Article

Development of an Electrochemical Biosensor for Rapid and Effective Detection of Pathogenic Escherichia coli in Licorice Extract

1
College of Pharmaceutical Engineering of Traditional Chinese Medicine, Tianjin University of Traditional Chinese Medicine, Tianjin 300193, China
2
Tasly Pharmaceutical Group Co., Ltd., Tianjin 300410, China
*
Author to whom correspondence should be addressed.
These authors contributed equally to this work.
Appl. Sci. 2019, 9(2), 295; https://doi.org/10.3390/app9020295
Submission received: 30 November 2018 / Revised: 9 January 2019 / Accepted: 11 January 2019 / Published: 15 January 2019
(This article belongs to the Special Issue Nano-Biointerface for Biosensing)

Abstract

:
An aptamer-based electrochemical biosensor was successfully developed and applied in the rapid detection of pathogenic Escherichia coli (E. coli) in licorice extract. The thiolated capture probes were firstly immobilized on a gold electrode, and then the biotinylated aptamer probes for E. coli were introduced by hybridization with the capture probes. Due to the stronger interaction between the aptamer and the E. coli, a part of the biotinylated aptamers will dissociate from the capture probes in the presence of E. coli. The residual biotinylated aptamer probes can quantitatively bind with streptavidin-alkaline phosphatase. Subsequently, α-naphthyl phosphate substrate was catalytically hydrolyzed to generate electrochemical response, which could be recorded by a differential pulse voltammetry. The dependence of the peak current on the logarithm of E. coli concentration in the range from 5.0 × 10² colony forming units (CFU)/mL to 5.0 × 10⁷ CFU/mL exhibited a linear trend with a detection limit of 80 CFU/mL. The relative standard deviation of 5 successive scans was 5.3%, 4.5% and 1.1% for 5.0 × 10², 5.0 × 10⁵ and 5.0 × 10⁷ CFU/mL E. coli, respectively. In the detection of the licorice extract samples, the results obtained from the proposed strategy and traditional culture counting method were close to each other, but the time consumption was only ~1/30 compared with the traditional method. These results demonstrate that the designed biosensor can be potentially utilized for rapid microbial examination in traditional Chinese medicine and relevant fields.

Graphical Abstract

1. Introduction

Pathogenic Escherichia coli (E. coli) is one of the most harmful bacteria related to food-borne diseases and can cause inflammation, abdominal pain, diarrhea and even severe cases like hemorrhagic enteritis and hemolysis, especially in infants and youngsters [1]. A systematic analysis indicated that E. coli infection has already become the second leading cause of death in children younger than 5 years old [2]. Therefore, a fast, sensitive, and easy-to-use method for the detection of E. coli is an urgent demand in clinical diagnosis, environment monitoring, pharmacy and food safety fields.
At present, E. coli detection methods mainly include the traditional culture counting method [3], molecular biological detection technology [4], immunological detection method [5], surface plasmon resonance (SPR) [6], Chemiluminescence immunoassay [7], etc. The traditional counting method for E. coli detection is based on culturing and isolation of bacteria in a specific medium, followed by observing bacterial colony morphology, color change, and biochemical reactions for quantitative detection. This detection method is economical and relatively simple to operate, but the detection time is generally 48–72 h or even longer, which cannot meet the needs for rapid detection. As an effective molecular biological detection technology, polymerase chain reaction (PCR) and the derived technology of PCR has been widely used in detecting E. coli [4,7]. PCR is based on the principle that DNA templates can denature at high temperatures, reactivate and extend (one cycle) at low temperatures by using appropriate DNA polymerase and primers. As the template DNA amplification product increases exponentially, increasing the number of cycles can magnify the specified DNA sequence by several million-fold in a short time, which greatly improves detection sensitivity [8]. However, PCR technology is costly and prone to produce false negatives [9], which limits the extensive application of PCR. In addition, enzyme-linked immunosorbent assay (ELISA), as a common immunological detection technology, has also been used in bacterial test [5,10]. ELISA technology undergoes a color change by the catalysis of the enzyme in the specific recognition process. Owing to the immune activity between antigen and antibody, ELISA method has superior specificity, high sensitivity and short detection time, and has been used in detection of different subtypes of E. coli [11,12,13]. However, due to the costly and cumbersome preparation process of antibodies, the detection cost of ELISA has increased greatly [14,15]. Another disadvantage is their limited shelf lives, which limits the viability of antibody-based biosensors in ELISA technology [16]. Moreover, the SPR method is labor intensive and requires expensive instrumentations, which limits its usage in E. coli detection. Chemiluminescence immunoassay has the advantages of simple operation, short detection time, and has been used in rapid detection of microbial [17]. However, few stable and sensitive chemiluminescence systems hinder the development of chemiluminescence immunology in microbial detection. Compared with the above-mentioned methods, electrochemical methods have received considerable interest with their high sensitivity, miniaturized and low-cost devices, and simple operation, especially in medical, pharmaceutical, food and environmental rapid detection of E. coli [18,19,20,21]. Recently, great efforts have been devoted to the development of novel modified electrodes for E. coli rapid detection, because the direct oxidation current on the bare electrode was not attractive owing to the high overpotential and sluggish electron transfer processes [22,23]. To date, three kinds of materials, including enzymes [14,24], aptamers [25] and nano-composites [26,27], have been used to modify the electrode surface for better analytical properties. Among them, aptamers are expected to be a promising candidate for the design of electrochemical biosensors for E. coli for their easy preparation, low cost, high stability and strong affinity.
Aptamers are single-stranded oligonucleotides screened by systematic evolution of ligands by exponential enrichment (SELEX) [28]. The high affinity between aptamers and target molecules is based on the hydrogen bonding, electrostatic interactions, and Van der Waals interactions (spatial conformations) [29]. At present, many electrochemical sensors based on aptamers have been developed for E. coli detection. The aptamer-electrochemical sensor can be used for E. coli detection at gene, protein or cell levels. In the gene and protein detections, electrochemical-aptamer sensors exhibit good analytical performance because of the hybridization and strong binding ability with E. coli proteins. However, complex extraction and separation steps along with the high reagent cost are still challenging problems for practical detection of genes and protein. Therefore, an aptamer-electrochemical sensor for direct detection of E. coli cells with low detection limit but little pre-treatment is more and more attractive.
Bratov and his group used three-dimensional interdigitated electrode array (3D-IDEA) as the working electrode and constructed impedimetric transducer by composing of aptamer for E. coli cell detection. The electrochemical biosensor showed an extremely good analytical performance for E. coli O157:H7 cells with a low detection limit, good selectivity and short detection time [30], but the preparation of such a 3D-IDEA aptamer biosensor significantly increases the cost because of the preparation complexity. Without using these expensive electrodes, Luo et al. selected common gold rod electrode for achieving the rapid detection of E. coli cell by using aptamer displacement strategy with three probes. Their method showed a linear relationship between the peak of current and the concentration of E. coli O111 cell in the range from 1.0 × 10³ to 1.0 × 10⁶ colony forming units (CFU)/mL with a detection limit of 305 CFU/mL in milk [31]. It is thus promising for the development of low-cost and practical electrochemical biosensor based on aptamer, but the sensitivity needs to be improved and the preparation process can be further simplified.
In this study, an aptamer (Seq.1) [32] with high affinity to pathogenic E. coli derived from the whole bacteria-SELEX strategy [33] was used as the identification probe, and a simple and sensitive method was developed for the rapid detection of E. coli in licorice extract. The proposed method showed high stability and sensitivity for the detection of E. coli with a low detection limit. In addition, in the detection of the E. coli existing in the licorice extractum samples, the results obtained from the proposed strategy are close to the plate counting results, while the detection time of our strategy has been greatly shortened. The method can be utilized as a promising tool for microbial examination in traditional Chinese medicine and other relevant fields.

2. Materials and Methods

2.1. Reagents

Thiol-modified capture probe and biotin-modified aptamer probe were synthesized by Sangon Inc. (Shanghai, China), and their base sequences were listed as follows:
Capture probe: SH-(CH2)6-CAG ATG CAC GAC TTC GAG TCT TAG GGC ACA CGA TGG CAG T
Aptamer probe: Biotin-CAG CTC AGA AGC TTG ATC CTA CCA GTA GAC TTT CAA CTT TAC TGC CAT CGT GTG CCC TAA GAC TCG AAG TCG TGC ATC TG
6-Mercapto-1-hexanol (MCH) and diethanolamine (DEA) were purchased from Tianjin HEOWNS Biochemical Technology Co. Ltd. Tris (2-carboxyethyl) phosphine (TCEP), salmon sperm DNA, brilliant green lactose bile (BGLB) medium and violet red bile agar (VRBA) were obtained from Beijing Solarbio Science & Technology Co. Ltd. (Beijing, China). Bovine serum albumin (BSA) and Luria-Bertani (LB) medium were purchased from Sangon Inc. (Shanghai, China). Streptavidin-alkaline phosphatase (ST-AP) was obtained from Beijing Dingguo Changsheng Biotechnology Co., Ltd. (Beijing, China). α-Naphthyl phosphate (α-NP) was obtained from TCI Development Co., Ltd. (Shanghai, China). The washing buffer (pH = 7.4) was mainly composed of 20 mM Tris-HCl, 0.1 M NaCl, 5.0 mM MgCl2 and 0.005% Tween-20. Licorice pieces (Lot NO. 1403008) were purchased from Hebei Qiyitang Pharmaceutical Co., Ltd. (Anguo, China). All the other reagents were of analytical reagent grade and all the solutions were prepared using sterilized ultrapure water.

2.2. Apparatus

All electrochemical experiments were performed using a CHI660E electrochemical workstation (Shanghai Chenhua Instruments Co. Ltd., Shanghai, China). A three-electrode system was used, which was composed of a saturated calomel reference electrode, a platinum wire counter electrode, and a gold electrode (φ = 2 mm) as the working electrode.

2.3. Preparation of Licorice Extract

Licorice is one of the most commonly used Chinese herbal medicines. Owing to its high sugar content, licorice extract is easily infected by bacteria, and especially with the prolongation of storage time, the risk of infection is higher. Therefore, it is necessary to select the appropriate method to detect the content of bacterial in the extract.
Licorice extract was prepared as follows: raw licorice pieces (20 g) and ultrapure water (160 mL) were placed into a flask for the 3 h reflux extraction. After filtering with a 200-mesh filter, the supernatant was collected and placed to settle for one day, and then the obtained mixture was centrifuged (6000 r/min, 10 min) to remove the sugar, protein and macromolecular substances. The obtained licorice extract was unsterilized and the solid content was about 4% (g/mL). In order to obtain the sterilized licorice extract, the filtration should be heated to 121 °C for 20 min, and then cooled for use.

2.4. Preparation of Pure Microbial Sample and Artificial Specimen

The E. coli strain (CICC 10372) was obtained from the China Center of Industrial Culture Collection (CICC). Firstly, the bacteria were cultivated in sterilized LB liquid medium at 37 °C for 16 h. The resulted pure cell suspension concentration was then determined by the plate counting method [3]. Subsequently, the bacterial suspension was centrifuged for 15 min at 4 °C and 1079× g. The supernatant was then removed and washed twice with sterile water and sterile phosphate buffer solution (PBS), the remaining bacteria were diluted to 5.0 × 10² CFU/mL, 5.0 × 10³ CFU/mL, 5.0 × 10⁴ CFU/mL, 5.0 × 10⁵ CFU/mL, 5.0 × 10⁶ CFU/mL, and 5.0 × 10⁷ CFU/mL with sterile licorice extract.

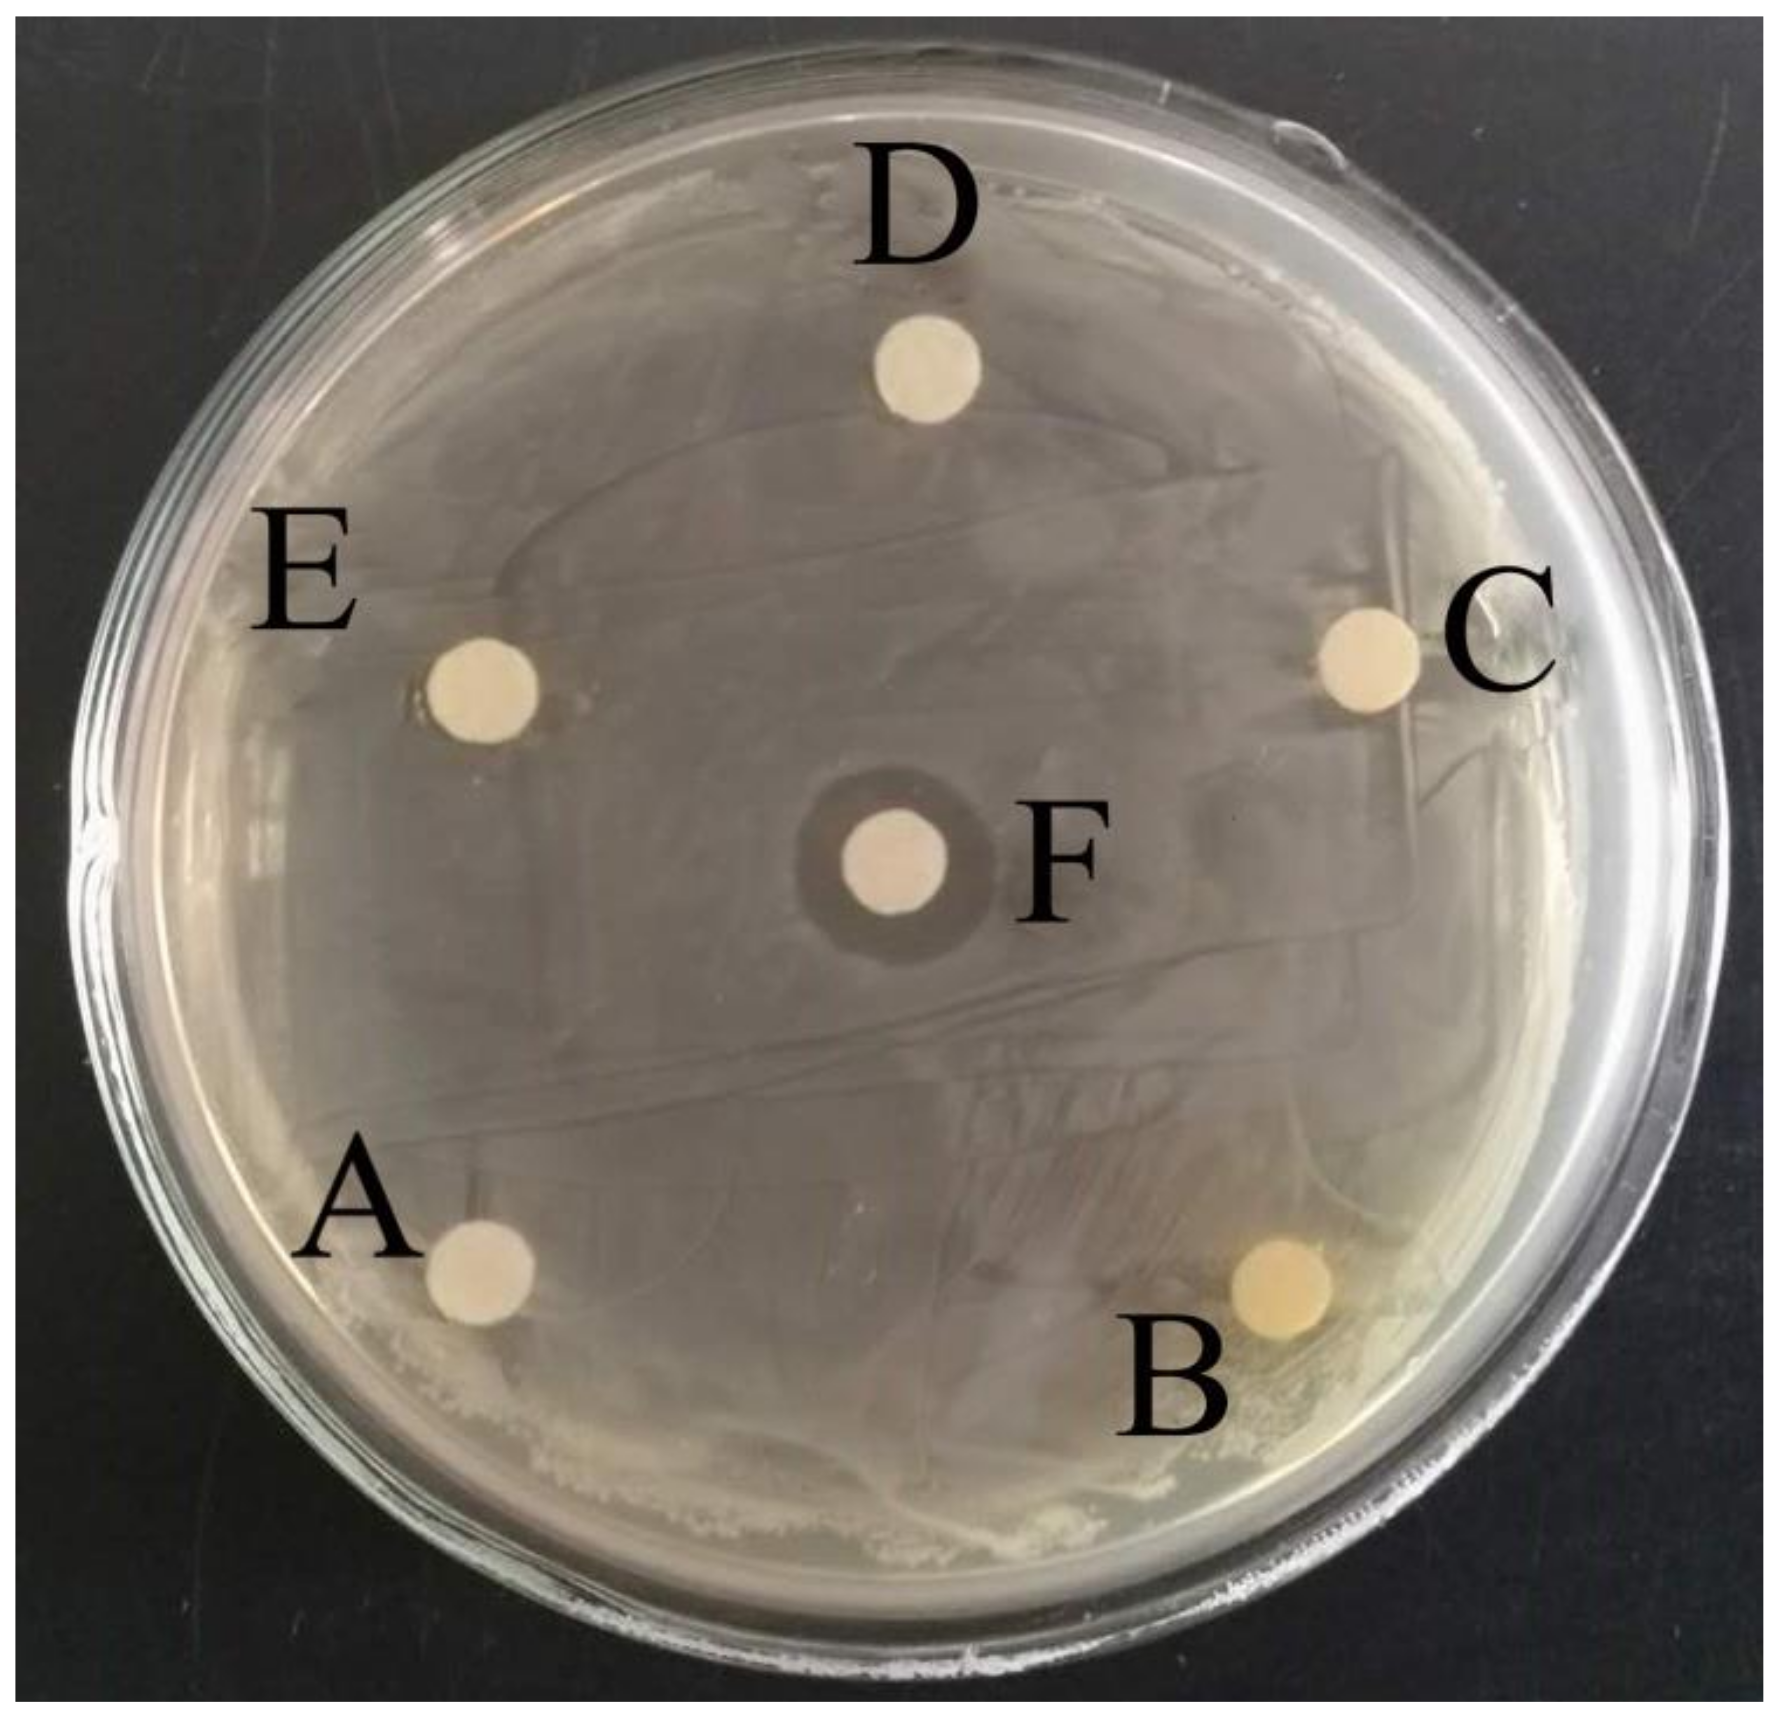
2.5. Study on The Antibacterial Effect of Licorice Extract

The antibacterial effect of the sterilized licorice extract at different solid contents was investigated by filter-paper disk method [34,35]. Firstly, a 2% solid content of the licorice extract was diluted with the licorice extract prepared in Section 2.3, while the 8% and 20% solid contents of the licorice extract were concentrated from the licorice extract prepared in Section 2.3. Secondly, pieces of filter paper with a diameter of 6 mm were made by a punch, numbered and then put into the bottle for sterilization. Thirdly, those filter paper were added individually into the EP tubes containing 2 mL licorice extract at four kinds of solid contents, 2 mL mixture of penicillin and streptomycin (positive control) [36] and 2 mL sterile saline (negative control). After soaking for 30 min, the obtained pieces of medicinal paper were exposed to a stream of warm air for another 30 min. Finally, a 100 μL, 5.0 × 10⁴ CFU/mL E. coli suspension was spread onto the nutrient agar flat medium evenly and incubated for 15 min, and six pieces of medicinal paper were immersed into the medium equidistantly and incubated at 37 °C for 24 h. The average size of the inhibition zone was measured by repeating three 3 plates.

2.6. Preparation of the Electrochemical Biosensor

A bare gold electrode was polished twice to a mirror-like surface with 0.3 mm and 0.05 mm alumina slurry and rinsed thoroughly with sterilized ultrapure water between each polishing step. Then, it was washed successively by piranha solution (H2SO4:H2O2 = 3:1) and sterilized ultrapure water in an ultrasonic bath, and dried in the air. The polished electrode was electrochemically cleaned and characterized by potential cycling between −1.0 V and 1.0 V in 1.0 M H2SO4 until a stable cyclic voltammogram for the cleaned gold electrode was obtained. Then, 10 μL of 2 μmol/L thiol-modified capture probe solution was dropped onto the surface of the gold electrode and incubated overnight at 4 °C. After rinsing with washing buffer, the electrode was immersed into 100 mL MCH (2.0 mM) for 1 h to obtain capture probe-modified gold electrode. Subsequently, the modified electrode was immersed and slightly shook in 0.1 mg/mL salmon sperm DNA and 1% BSA solution (each for 15 min) to avoid nonspecific adsorption [37]. After that, the treated gold electrode was rinsed with washing buffer, and 10 μL of 3.0 μM aptamer probe solution was dropped on its surface and incubated for 1 h at 37 °C to obtain the electrochemical biosensor.

2.7. Detection of E. coli in Licorice Extract by Using the Electrochemical Biosensor

For the detection of E. coli in licorice extract, the prepared biosensor was firstly incubated in the licorice extract of different concentrations of E. coli for 2 h at 37 °C. After washing with washing buffer, 20 μL of 0.5 mg/mL ST-AP aqueous solution was dropped onto the surface of the biosensor and incubated at 37 °C for 30 min. Finally, the obtained biosensor was rinsed with DEA solution containing 0.05% Tween-20 thoroughly and immersed in a 2.5% DEA solution containing 1.0 mg/mL of α-NP for differential pulse voltammetry (DPV) determination.

3. Results and Discussion

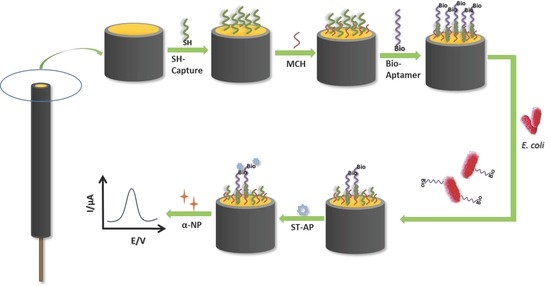
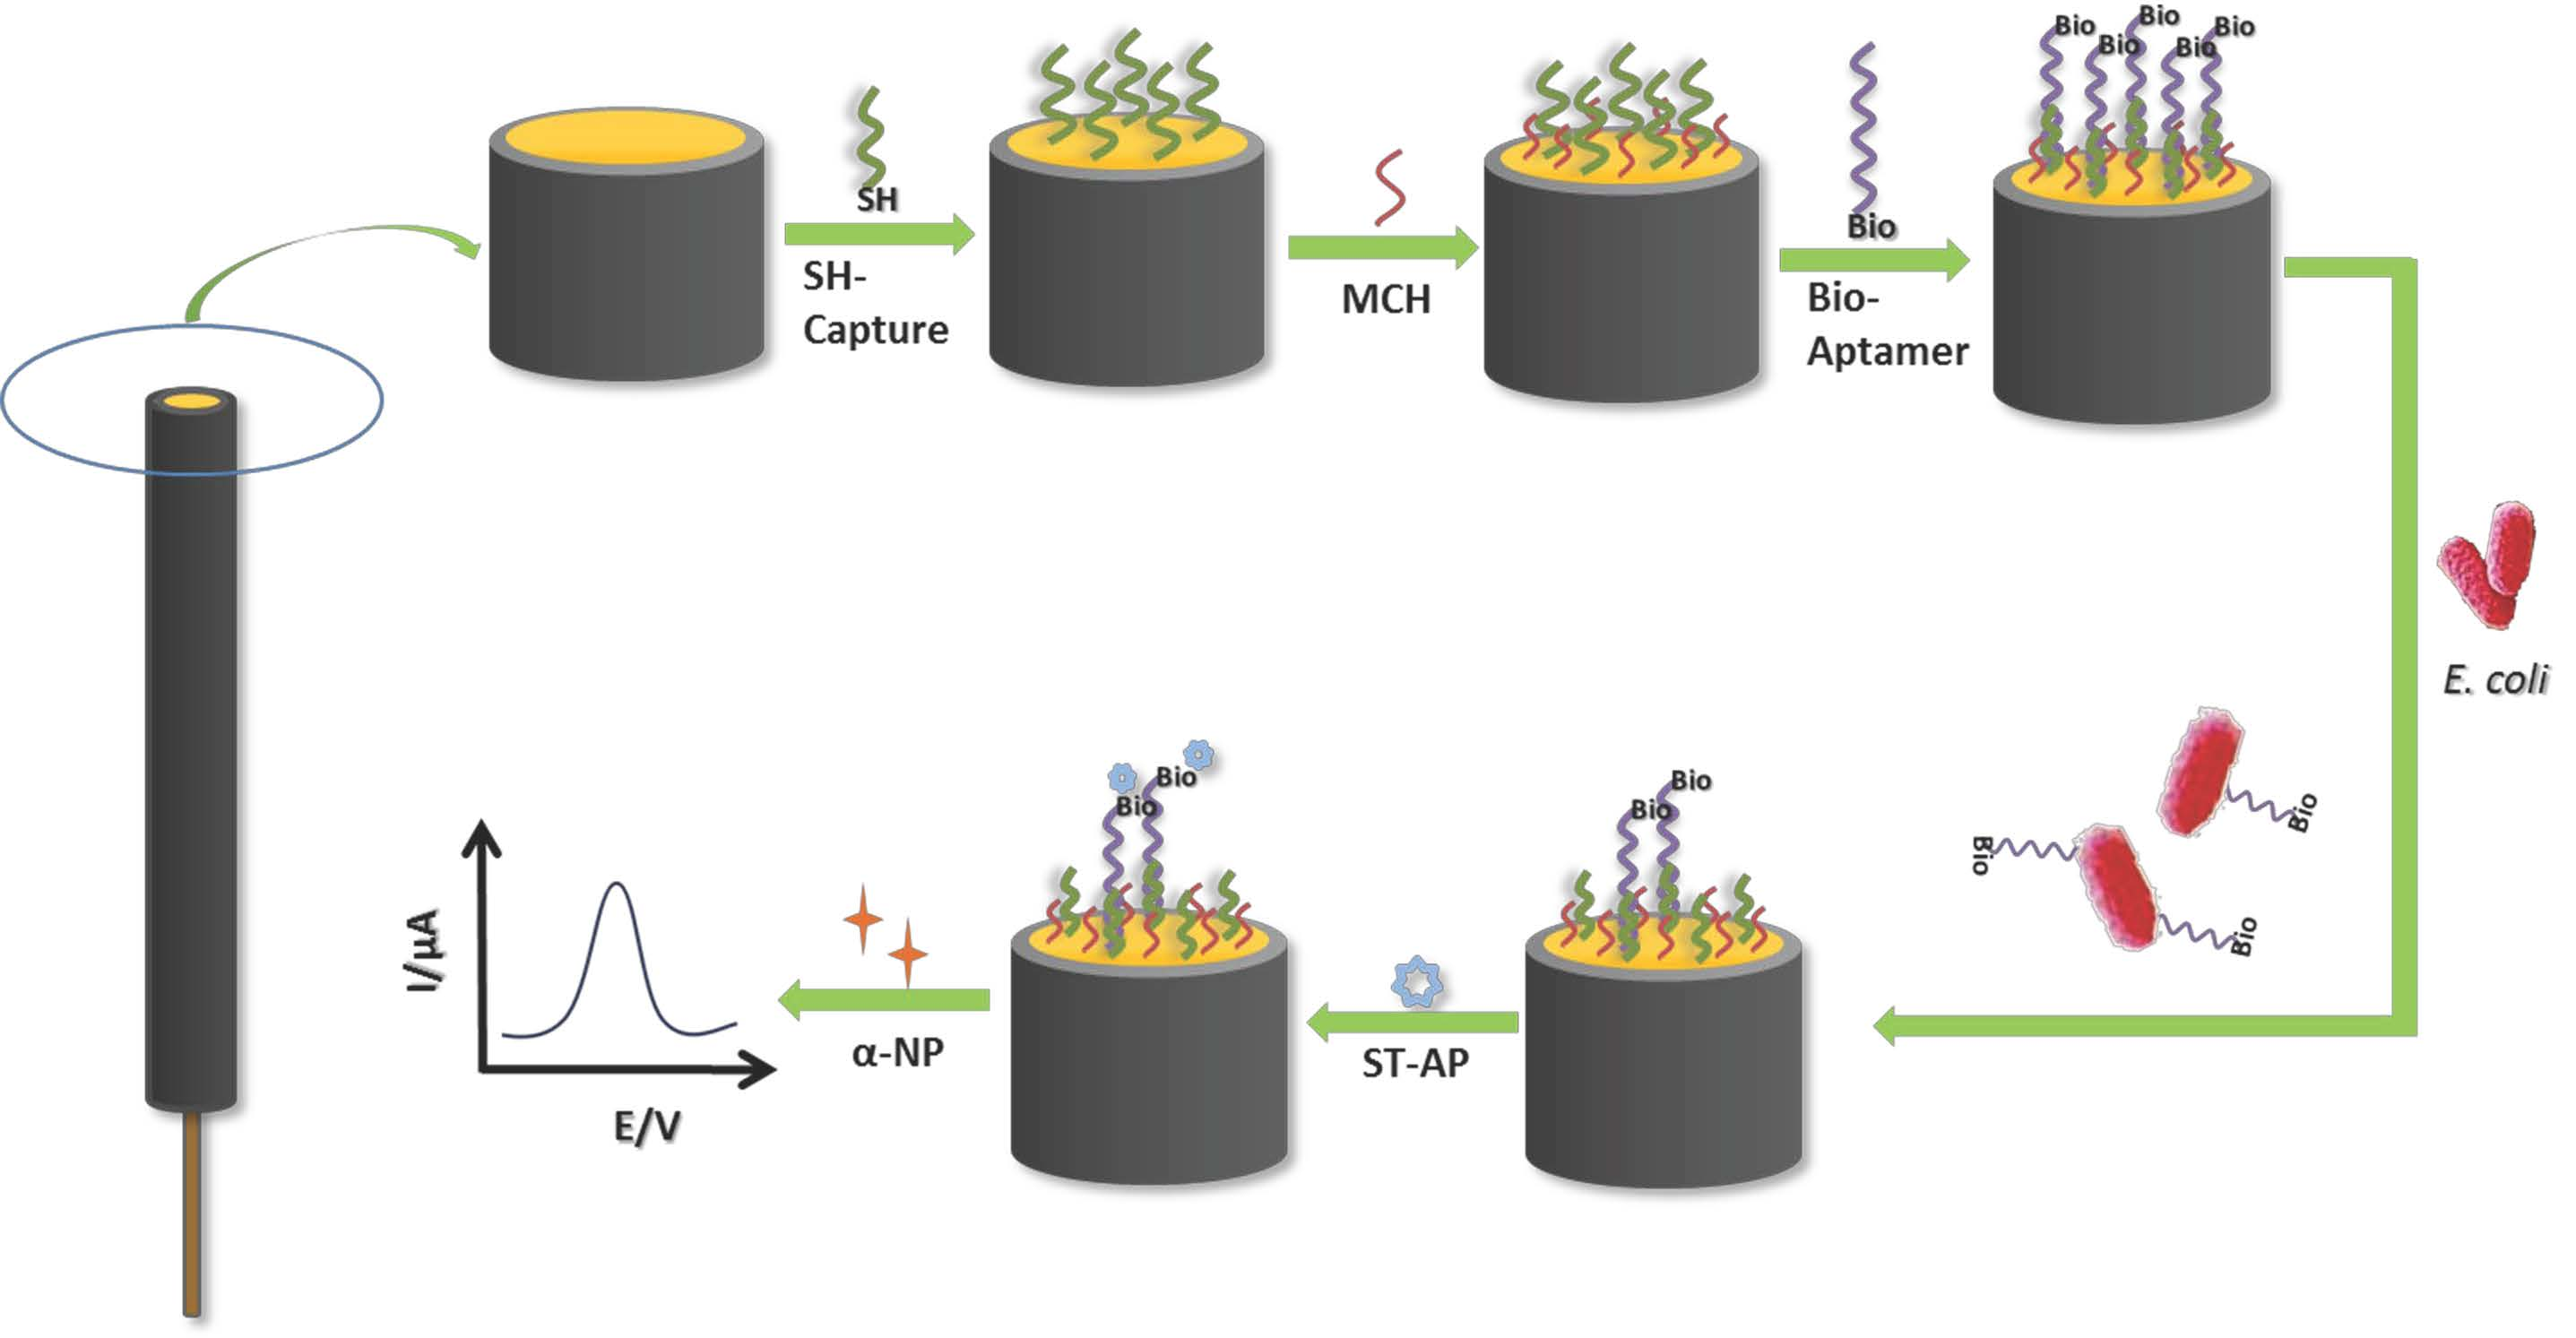
3.1. Principle of E. coli Detection by Electrochemical Biosensor

Figure 1 depicts the biosensing process of E. coli detection. Firstly, the thiol-modified capture probes (SH-Capture) are immobilized on the surface of the polished gold electrode by Au-SH covalent bond, and then the unreacted active sites on the electrode surface are blocked with MCH [38]. Secondly, excess biotin-modified aptamer probes (Bio-Aptamer) that are complementary to the capture probes are introduced onto gold electrode by DNA hybridization. Due to the stronger interaction between the biotinylated aptamer probes and E. coli, a part of the biotinylated aptamer probes can dissociate from the capture probes in the presence of E. coli. After that, quantitative ST-APs can be immobilized on the surface of gold electrode by linking to biotin on the residual aptamer probes. Under strong alkaline conditions, ST-APs can dissociate from the biotinylated aptamer probes and catalyze the hydrolysis of α-NP substrate generating the electrochemical signals [39]. As a result, the electrochemical response to E. coli can be measured by using DPV in the presence of α-NP.

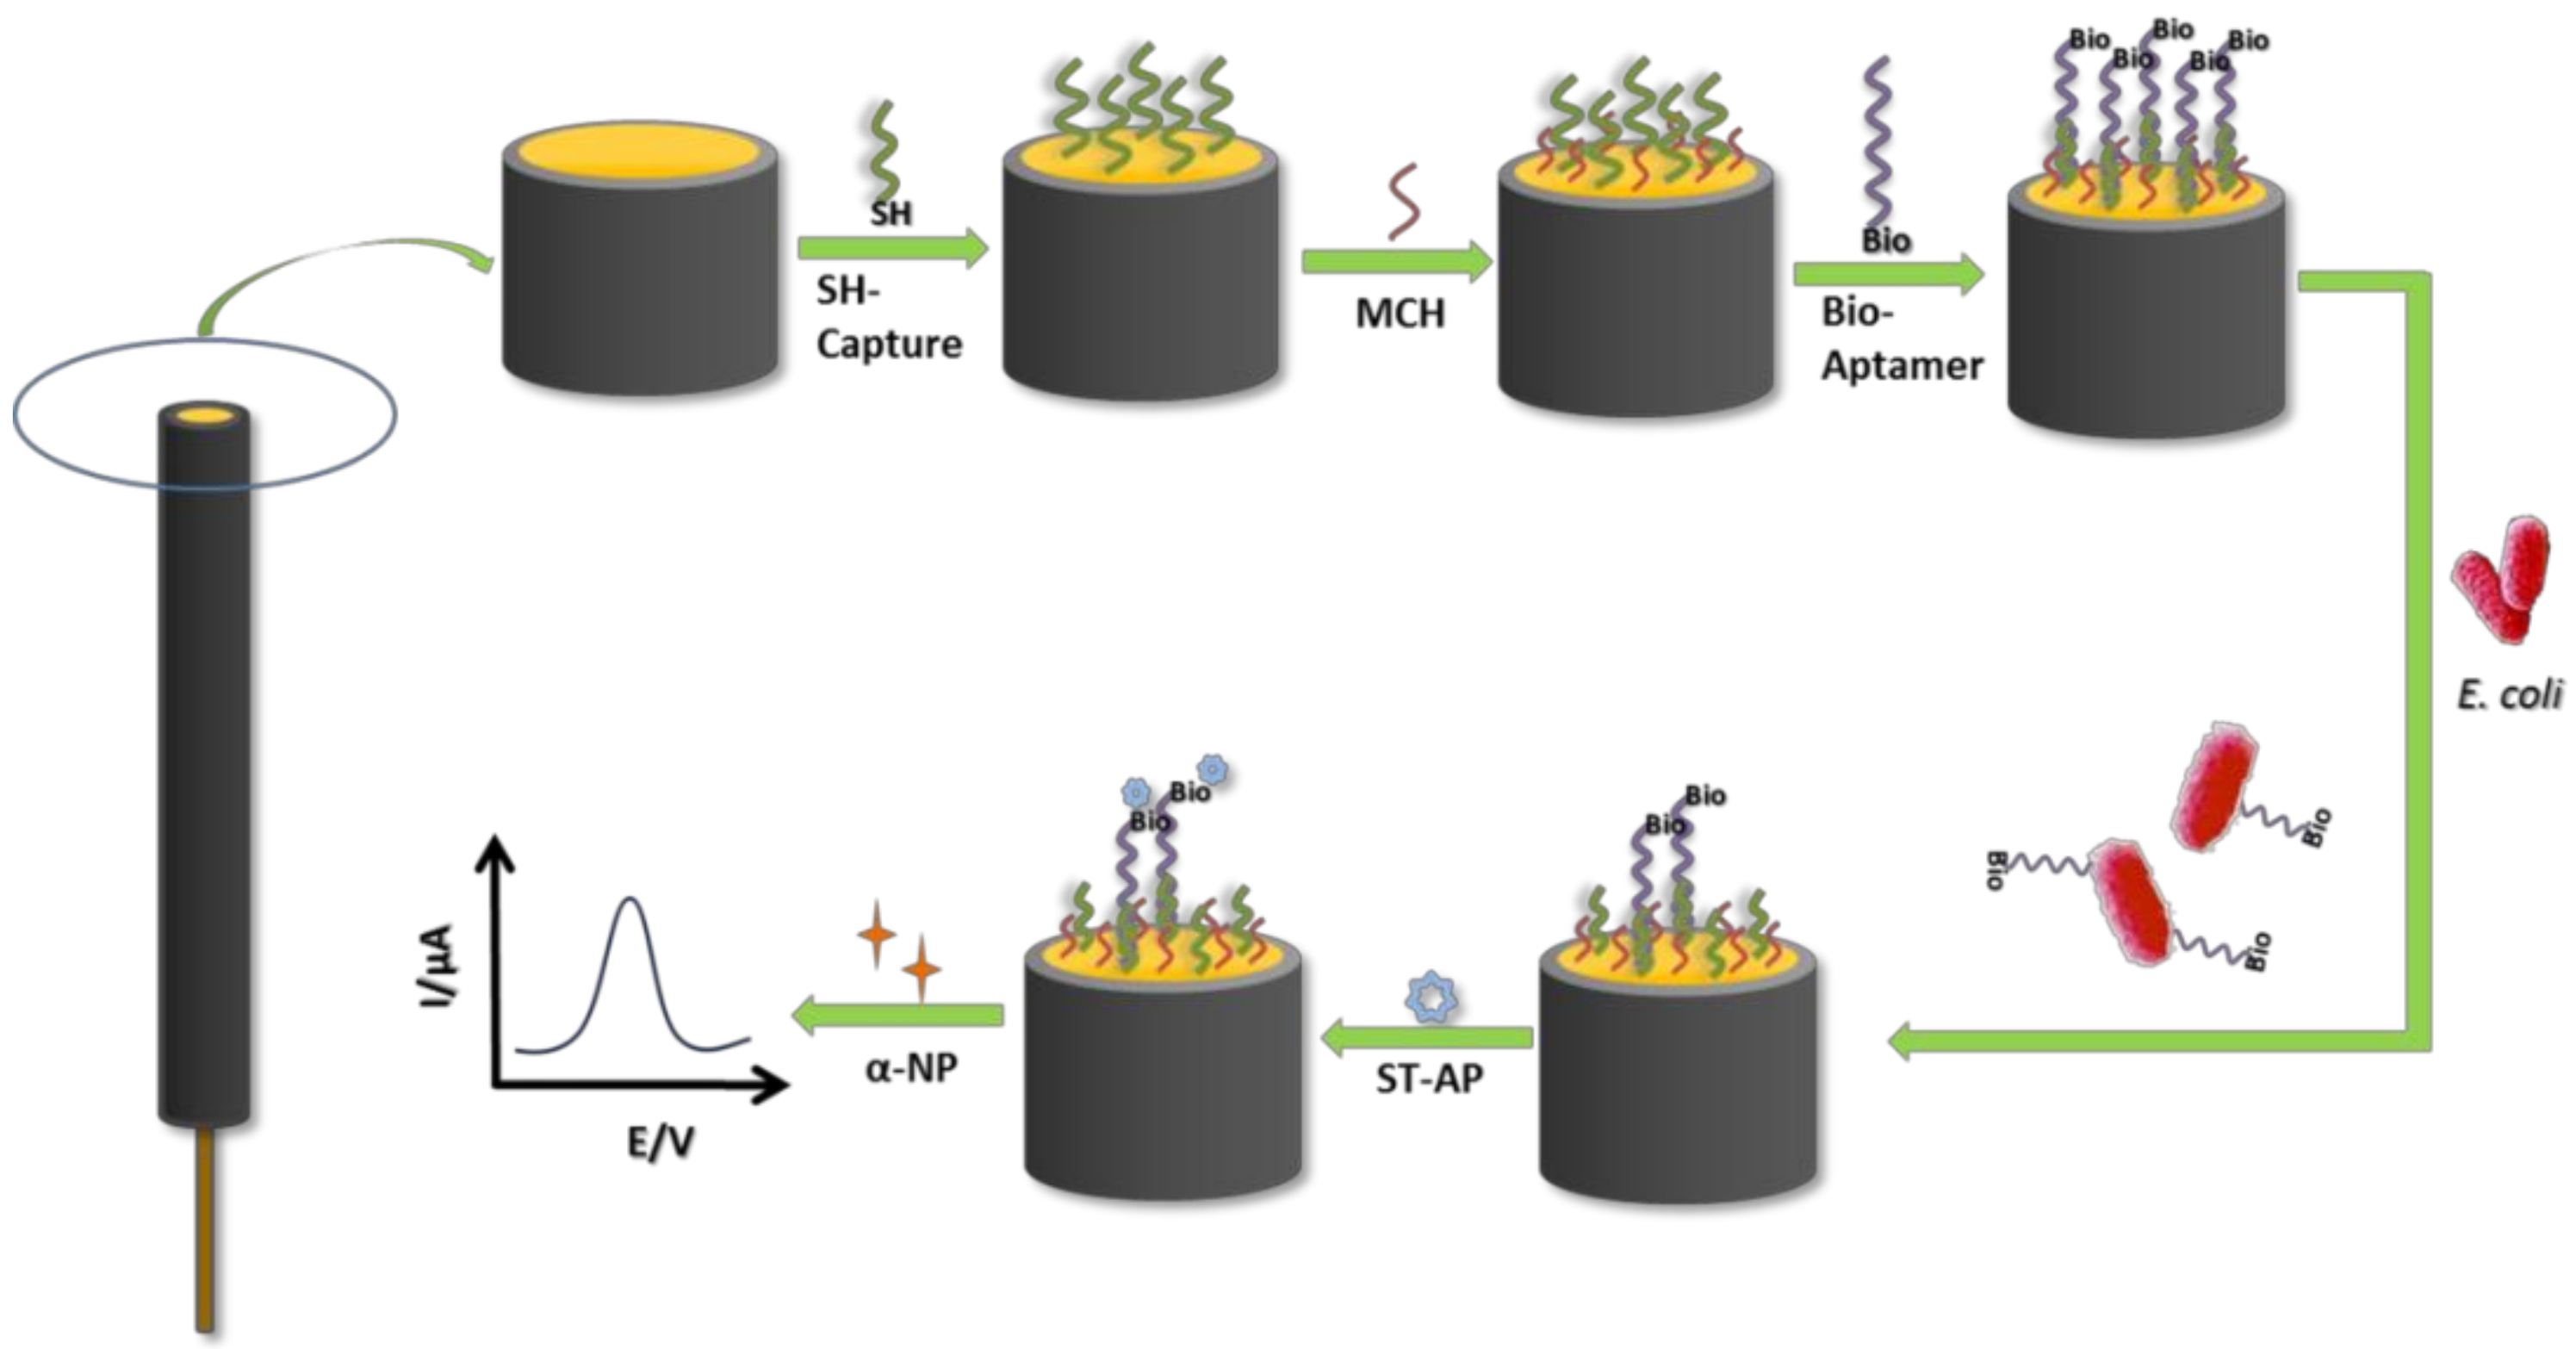
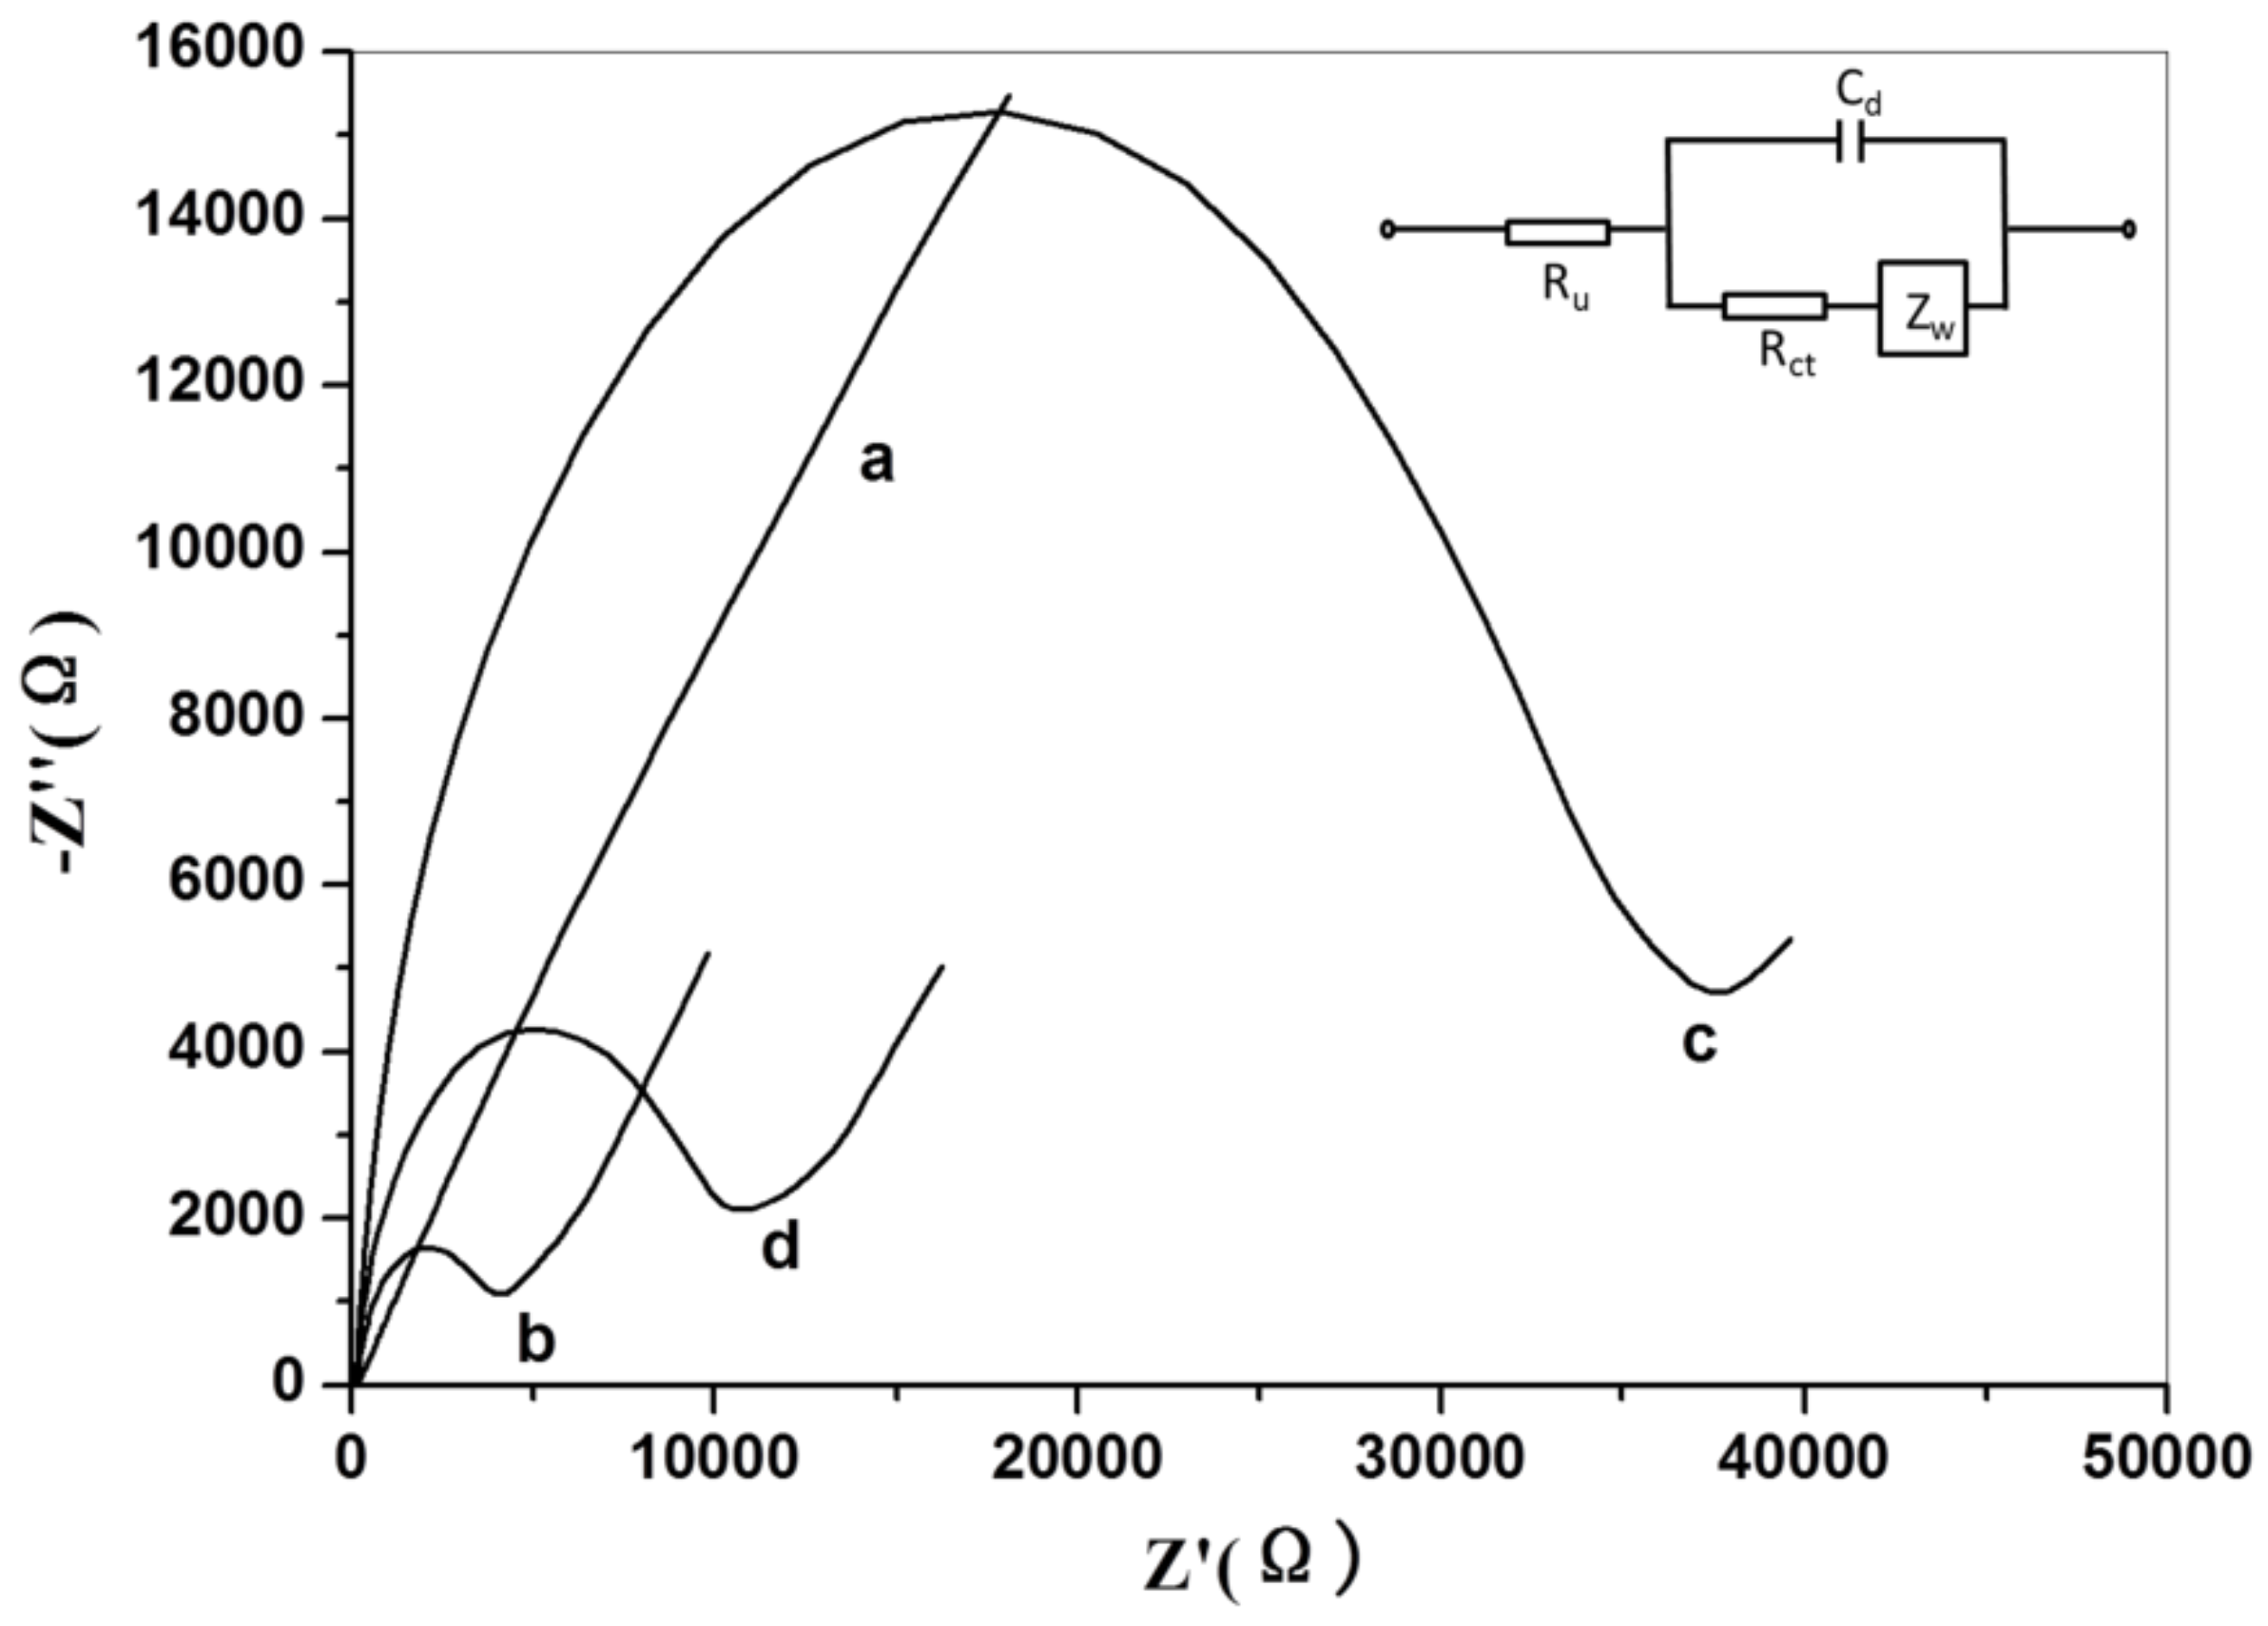
3.2. Electrochemical Characterization of the Biosensor

Electrochemical impedance spectroscopy (EIS) is used to determine the electron transfer properties of bare gold electrode and modified gold electrode surface. Figure 2 shows the Nyquist plots of the bare gold electrode (curve a), the capture probe modified gold electrode (curve b), the aptamer probe modified gold electrode (curve c) and the aptamer probe modified gold electrode after reaction with E. coli (curve d) in a solution containing 1.0 mM [Fe(CN)6]3−/4− and 0.1 M KCl. The Randles circuit model (inset of Figure 2) is chosen to fit the impedance data obtained, where the element Ru is the electrolyte resistance, the resistance to charge transfer (Rct) and the diffusion impedance (Zw) were both in parallel with the interfacial capacitance (Cd). The Rct at the electrode surface is equal to the semicircle diameter of EIS, which is used to describe the interface properties of the electrode [40]. For curve a, it presents an almost straight line, which demonstrates that there is a very high electron-transfer rate between the electrochemical probe [Fe(CN)6]3−/4− and the bare gold electrode. When the capture probes are immobilized onto the gold electrode, the Rct value increases at about 4100 Ω (curve b), which is attributed to an electrostatic repulsion force to [Fe(CN)6]3−/4− [41] produced by the combination of the negatively charged single-stranded oligonucleotides. For aptamer probes modified gold electrode (curve c), the Rct further increases to a much larger value (nearly 38,000 Ω) after the aptamer probes hybridized with the capture probes because of the increased negative charge. Afterwards, the Rct value (curve d, nearly 11,000 Ω) further decreased when the electrochemical biosensor is incubated with E. coli. This is due to the dissociation of the aptamer probes from the electrochemical biosensor, which causes the reduction of negative charge. These Nyquist plot proves the successful modifications and reactions as described in the principle scheme.

3.3. Antibacterial Activity of Licorice Extractum

The antibacterial activity results of licorice extractum with 2% (D), 4% (C), 8% (E) and 20% (B) solid content, penicillin and streptomycin mixture (positive control, F) and sterile saline (negative control, A) are displayed in Figure 3. As shown in Figure 3, no antibacterial activity of licorice extractum of different solid content is observed except for the positive control group, indicating that the licorice extractum does not interfere with the E. coli testing.

3.4. Optimization of Experimental Conditions

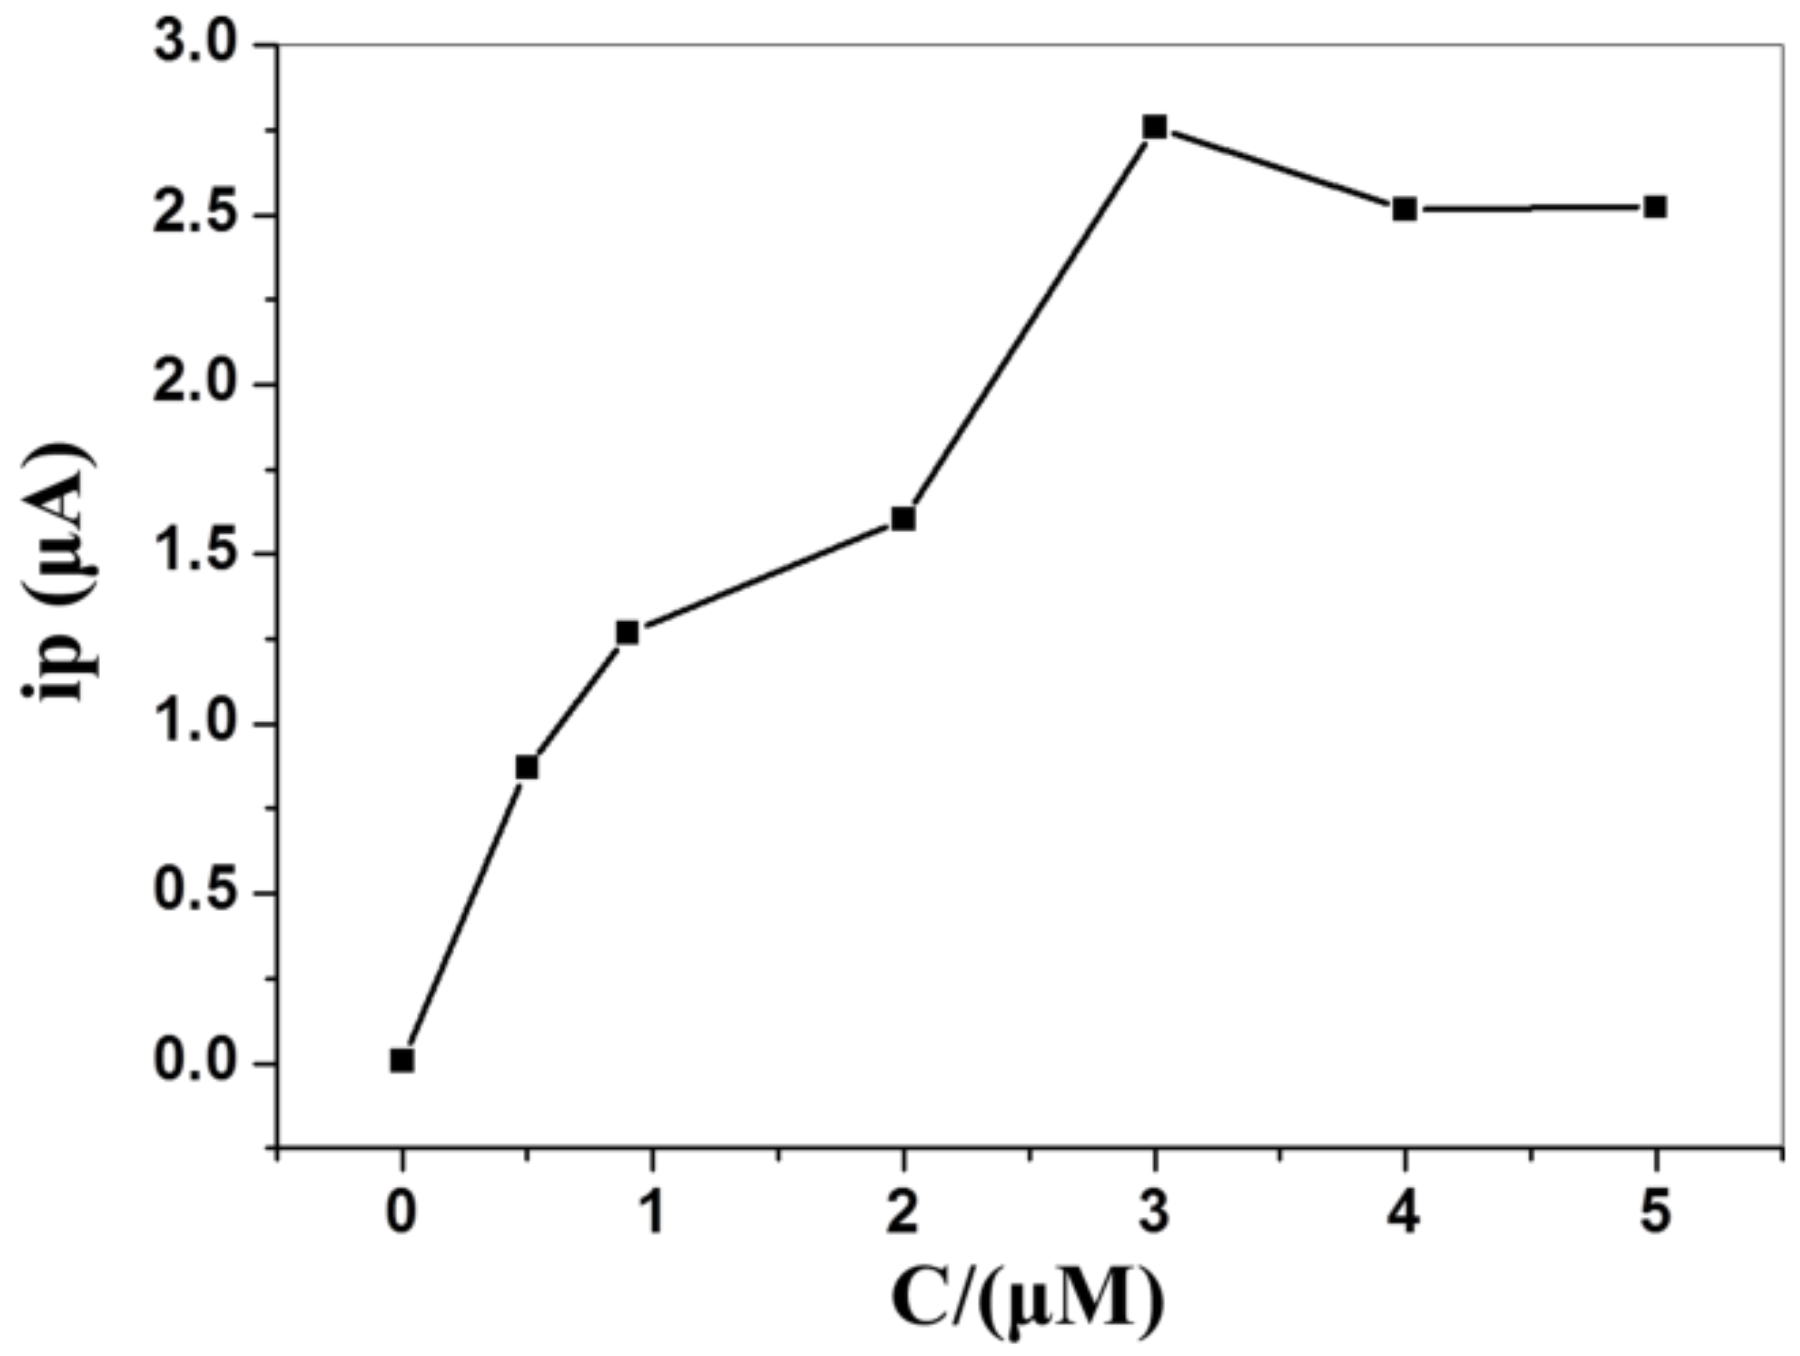
3.4.1. The Effect of the Concentration of Aptamer Probe on the Peak Current

The influence of the concentration of aptamer probe on DPV response was investigated under the reaction with 5.0 × 10² CFU/mL E. coli. As shown in Figure 4, it can be seen that the peak current increases dramatically when the concentration of aptamer probe increases from 0 to 3 μM. However, the peak current does not change significantly when the concentration of the aptamer probe exceeds 3 μM. The results can be attributed to the fact that the low amount of the aptamer probes did not completely hybridize with the single-strand capture probes. Therefore, after incubating with E. coli, there were very few aptamer probes left on the gold electrode, leading to a low peak current. With increasing the amount of the aptamer probe, the peak current value gradually increases until reaching a maximum, after which the peak current stops increasing. Consequently, 3 μM is selected as the optimum concentration of aptamer probe in the following experiments.

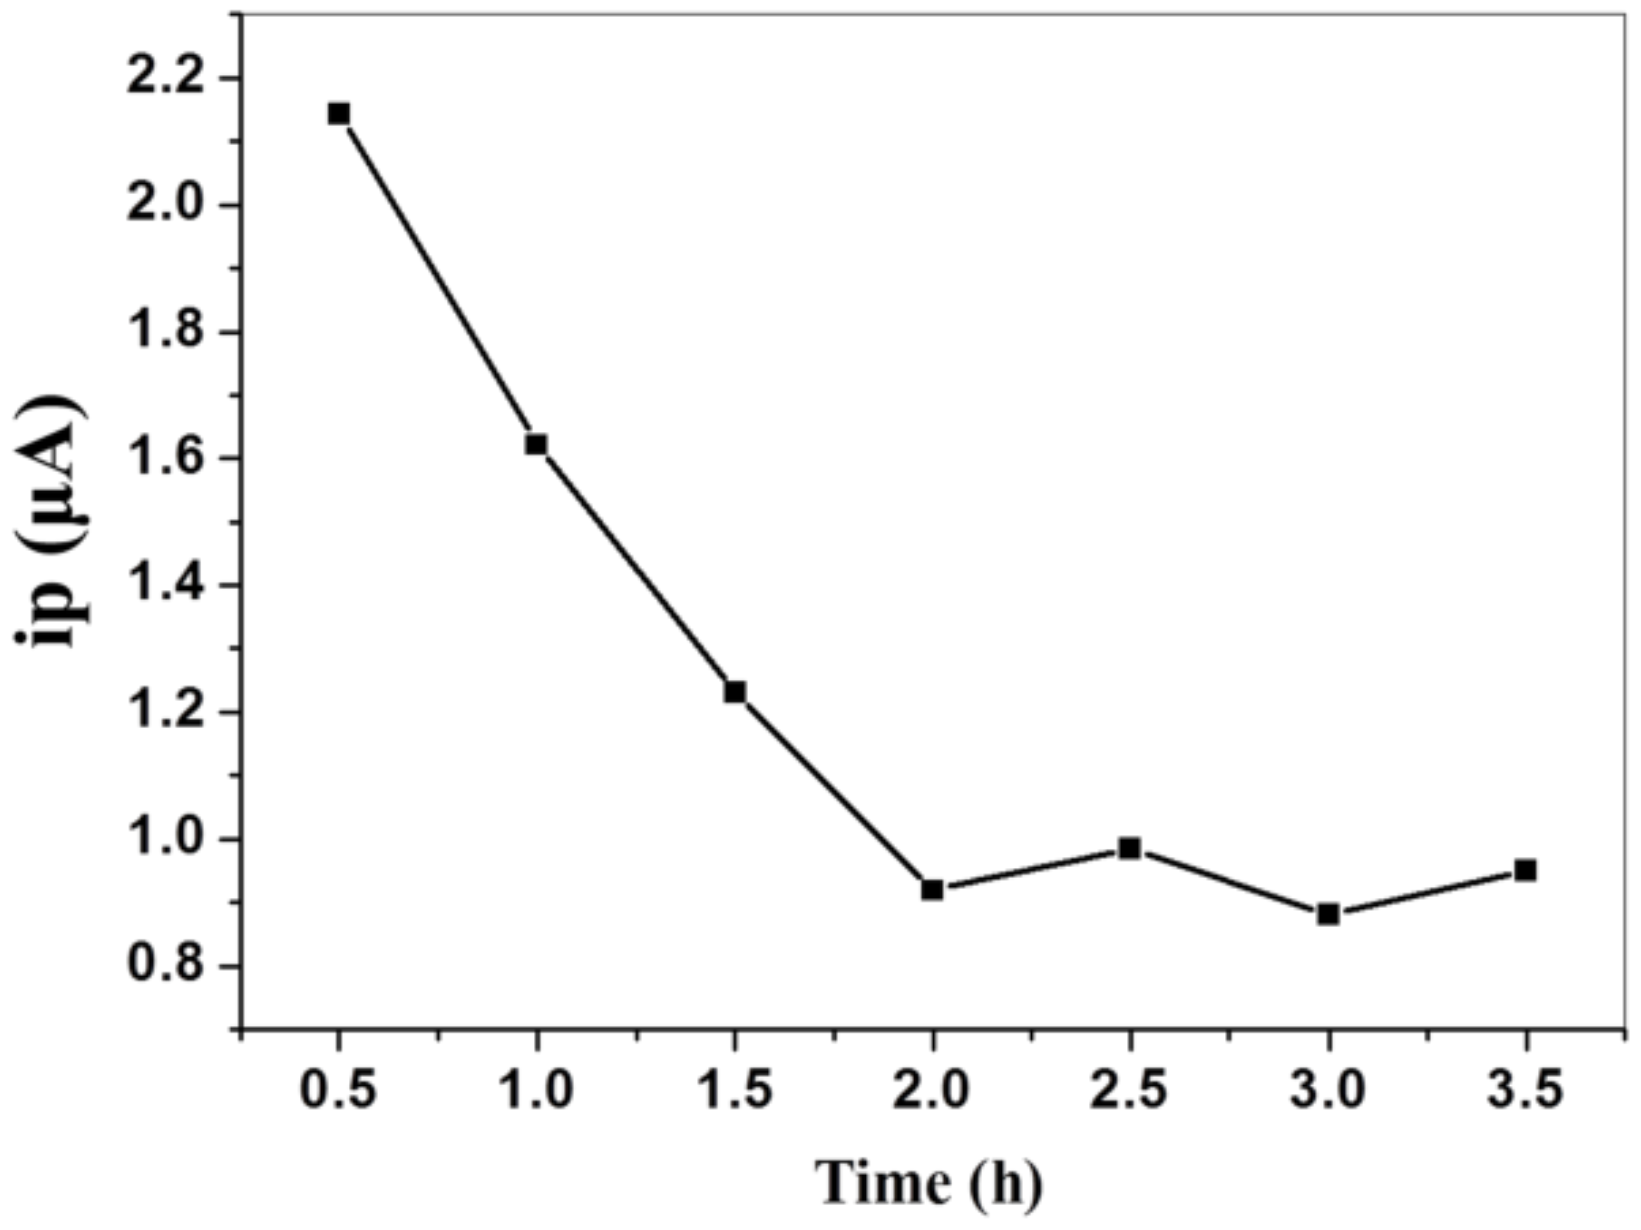
3.4.2. The Effect of the Incubation Time on the Peak Current

The effect of the incubation time of electrochemical biosensor with E. coli on the peak currents is investigated. As shown in Figure 5, the peak current decreases sharply with increasing the incubation time up to 2 h and then become nearly constant. The dissociation time of the aptamer probes from the biosensor is dependent on the incubation time of E. coli. It is difficult for the aptamer probes to dissociate from the capture probes in a short period of time. Thus, the incubation time of the electrochemical biosensor with E. coli is chosen as 2 h to obtain the stable current value of α-NP.

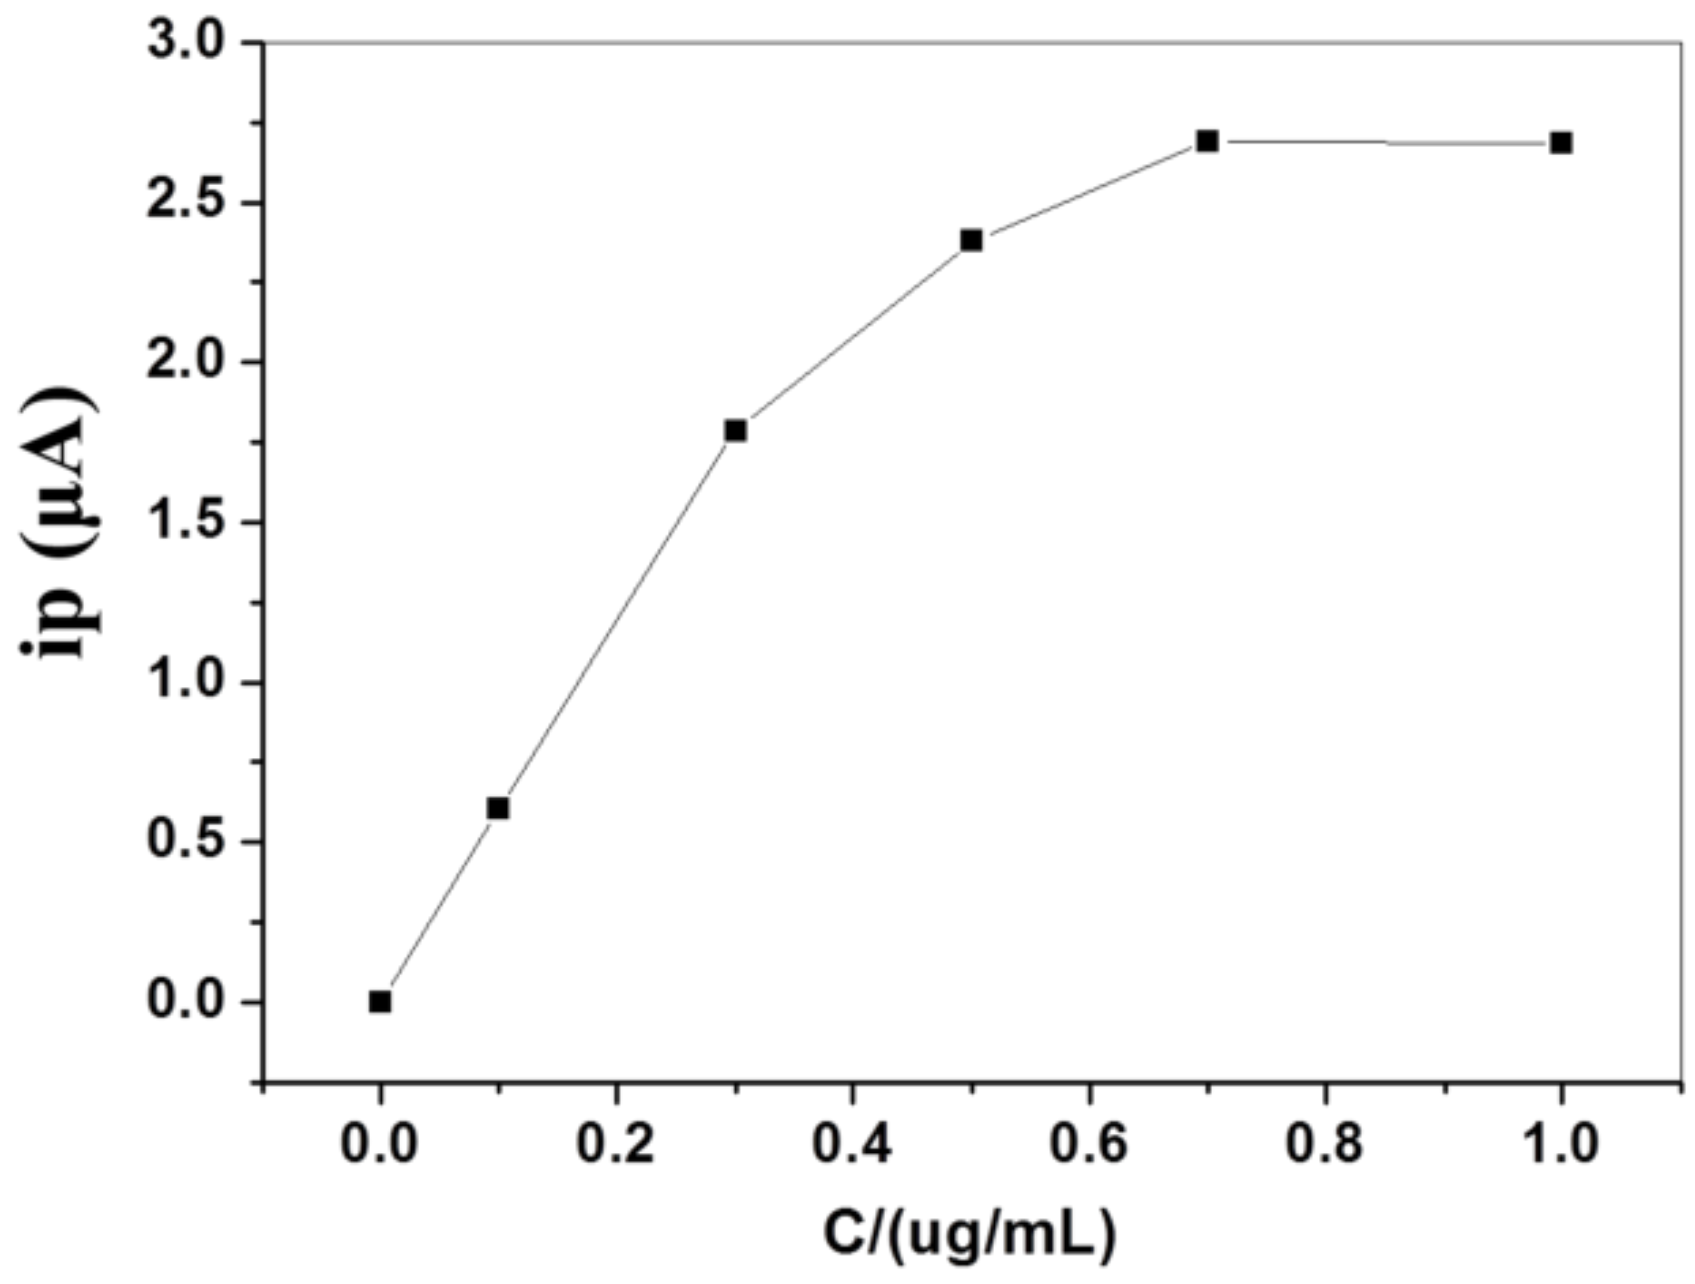
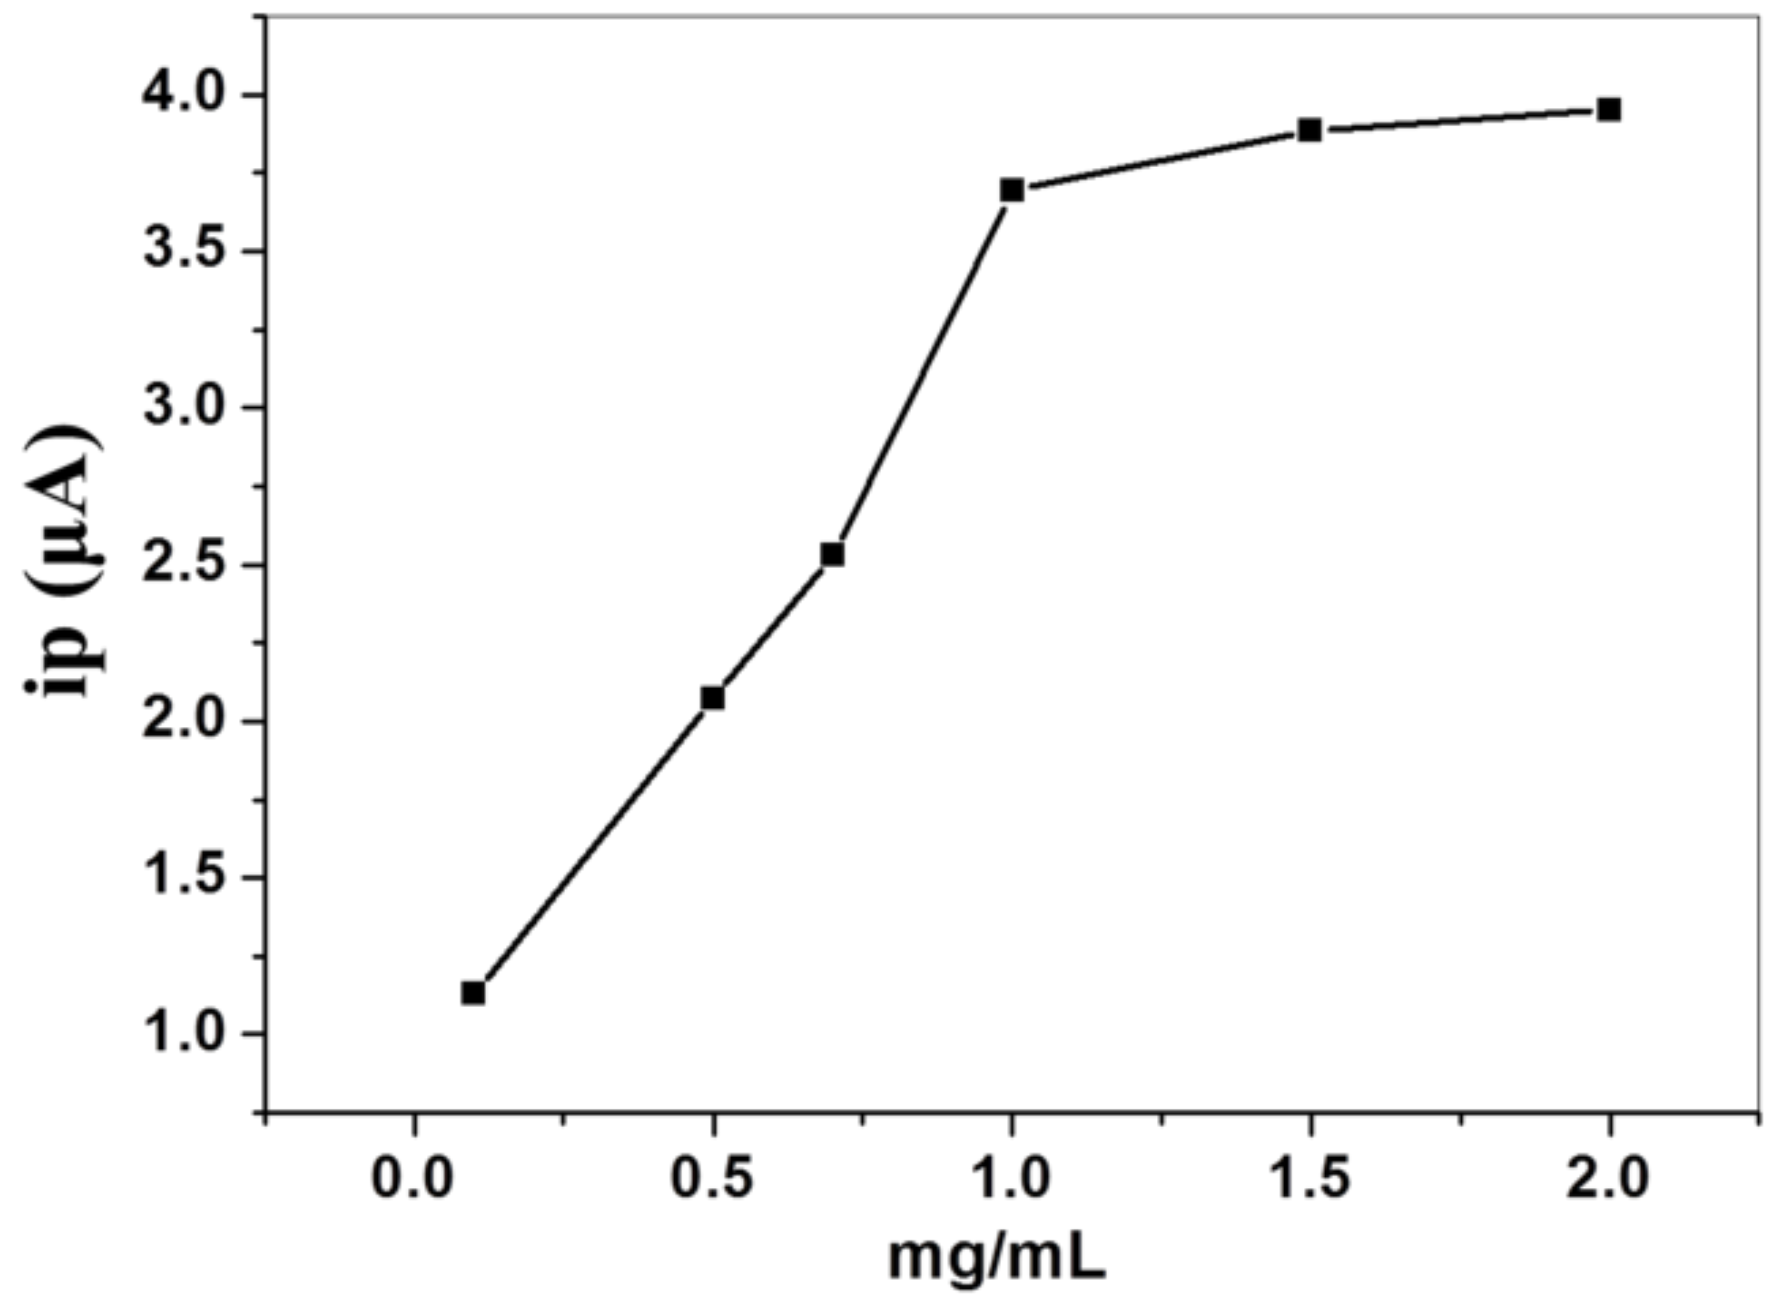
3.4.3. The Effect of ST-AP Concentration on the Peak Current

Figure 6 shows the relationship between the ST-AP concentration and the peak current of α-NP. It can be seen that the current value increases significantly when the ST-AP concentration increases from 0 to 0.7 μg/mL and then reaches a stable value. Therefore, 0.7 μg/mL is used as the optimal concentration of ST-AP in the following experiments.

3.4.4. The Effect of α-NP Concentration on the Peak Current

The effect of the α-NP concentration on the peak current is investigated. As shown in Figure 7, the current value increases sharply when the α-NP concentration increases from 0 to 1.0 mg/mL, and then the increasing become much slower. It is because that the amount of α-NP is closely related to the amount of ST-AP. Therefore, 1.0 mg/mL of α-NP is chosen in the following DPV detection.

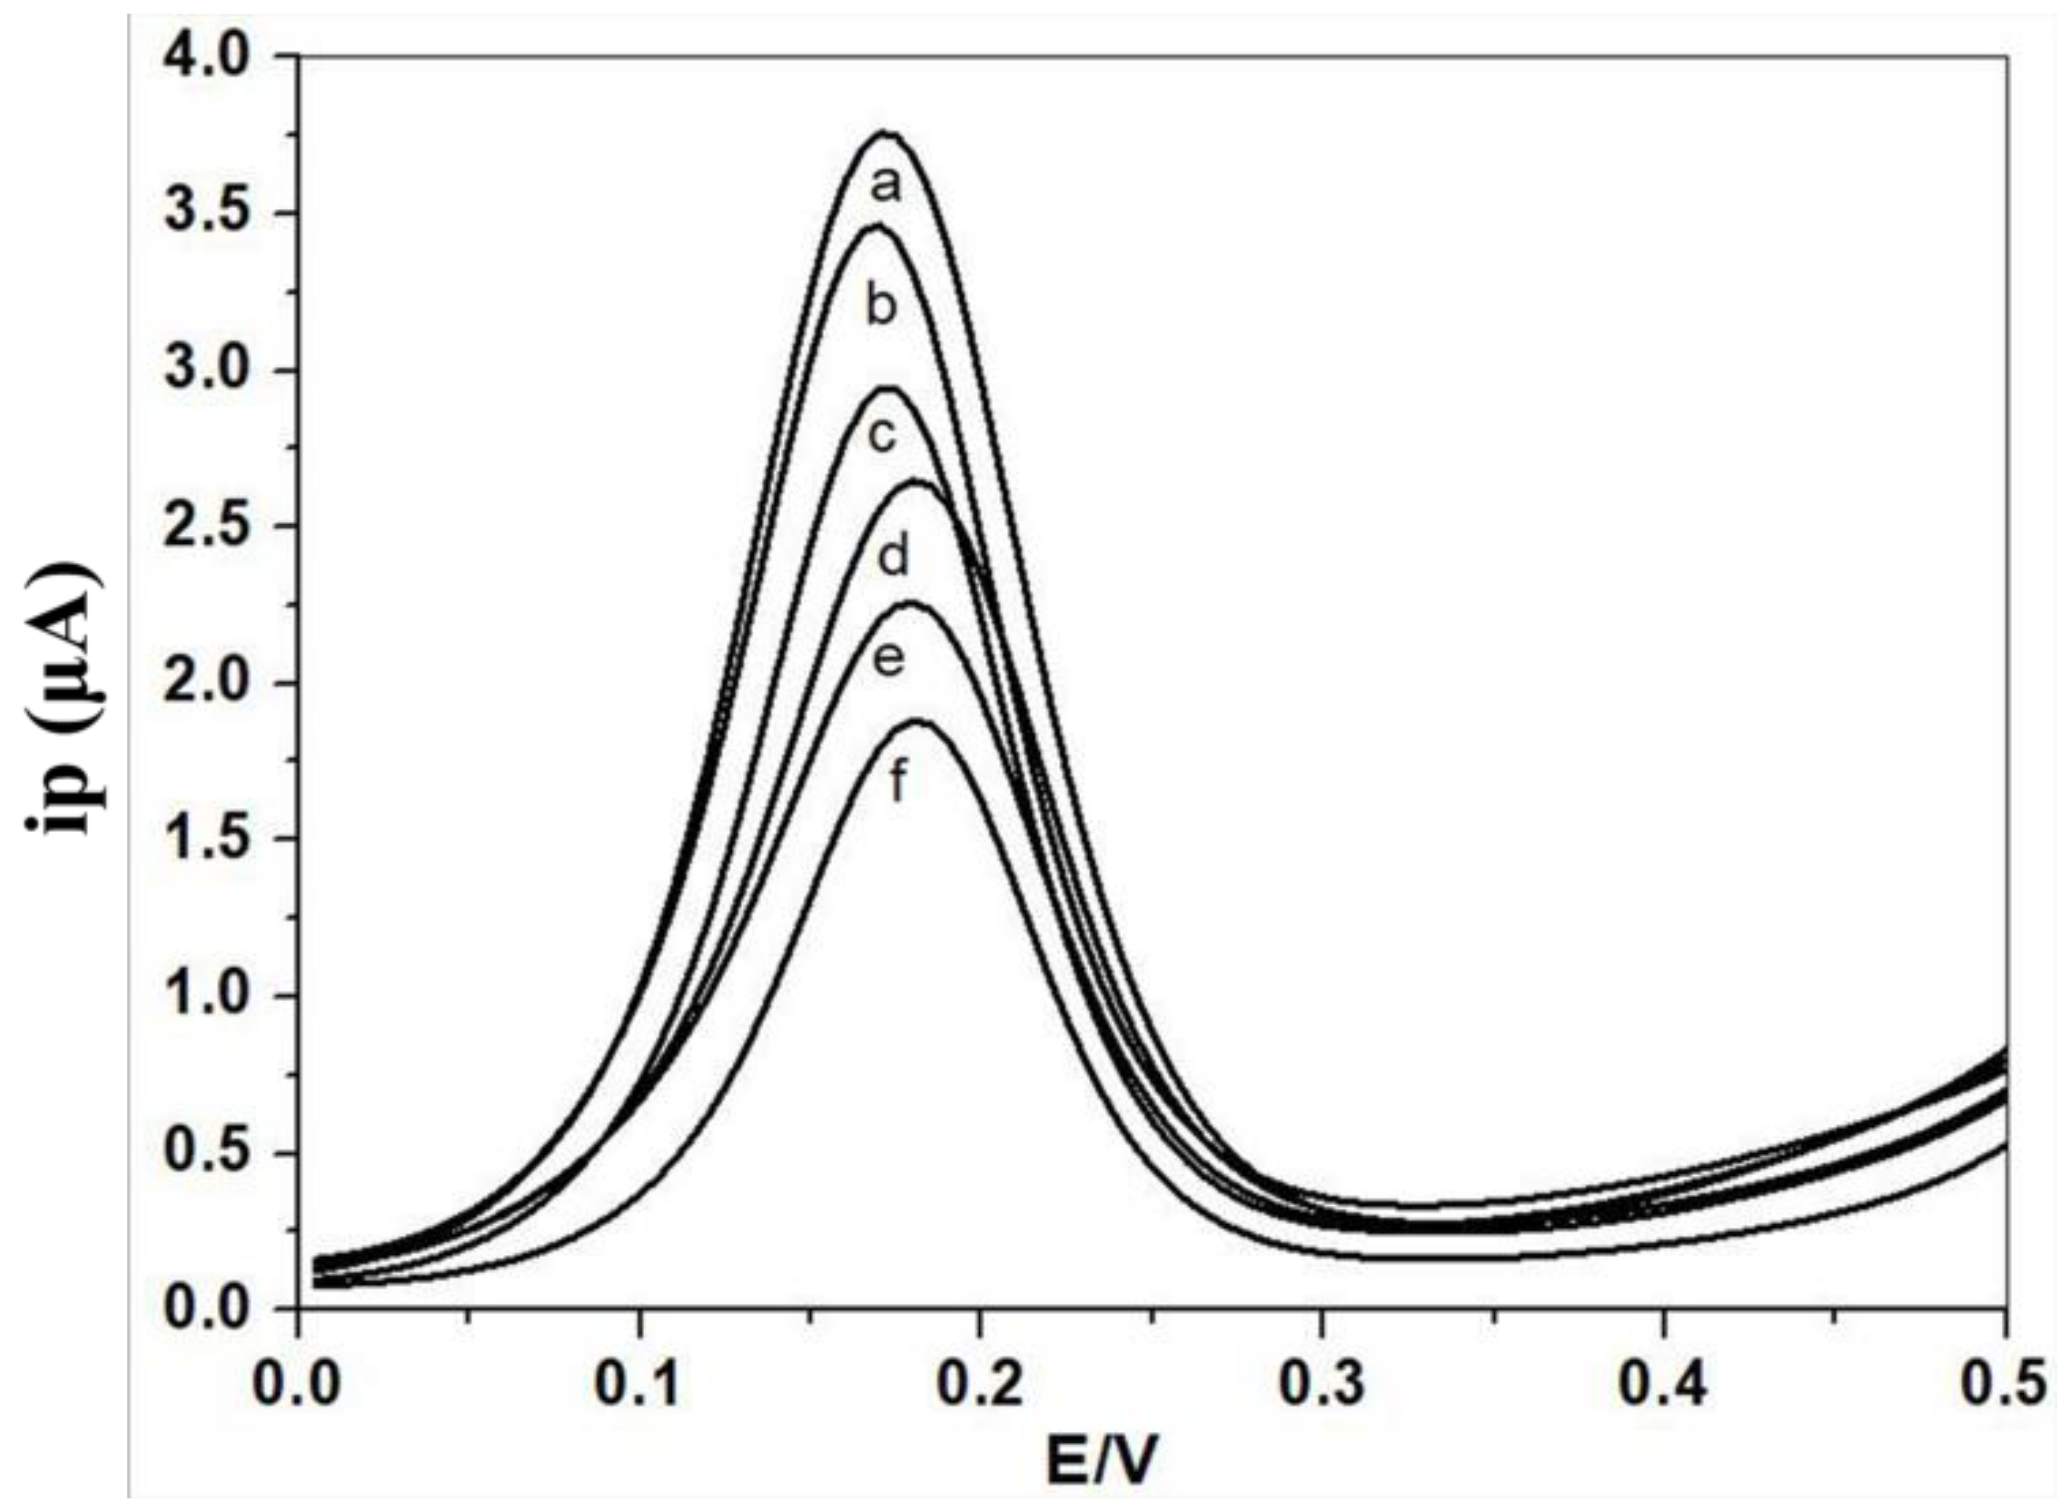
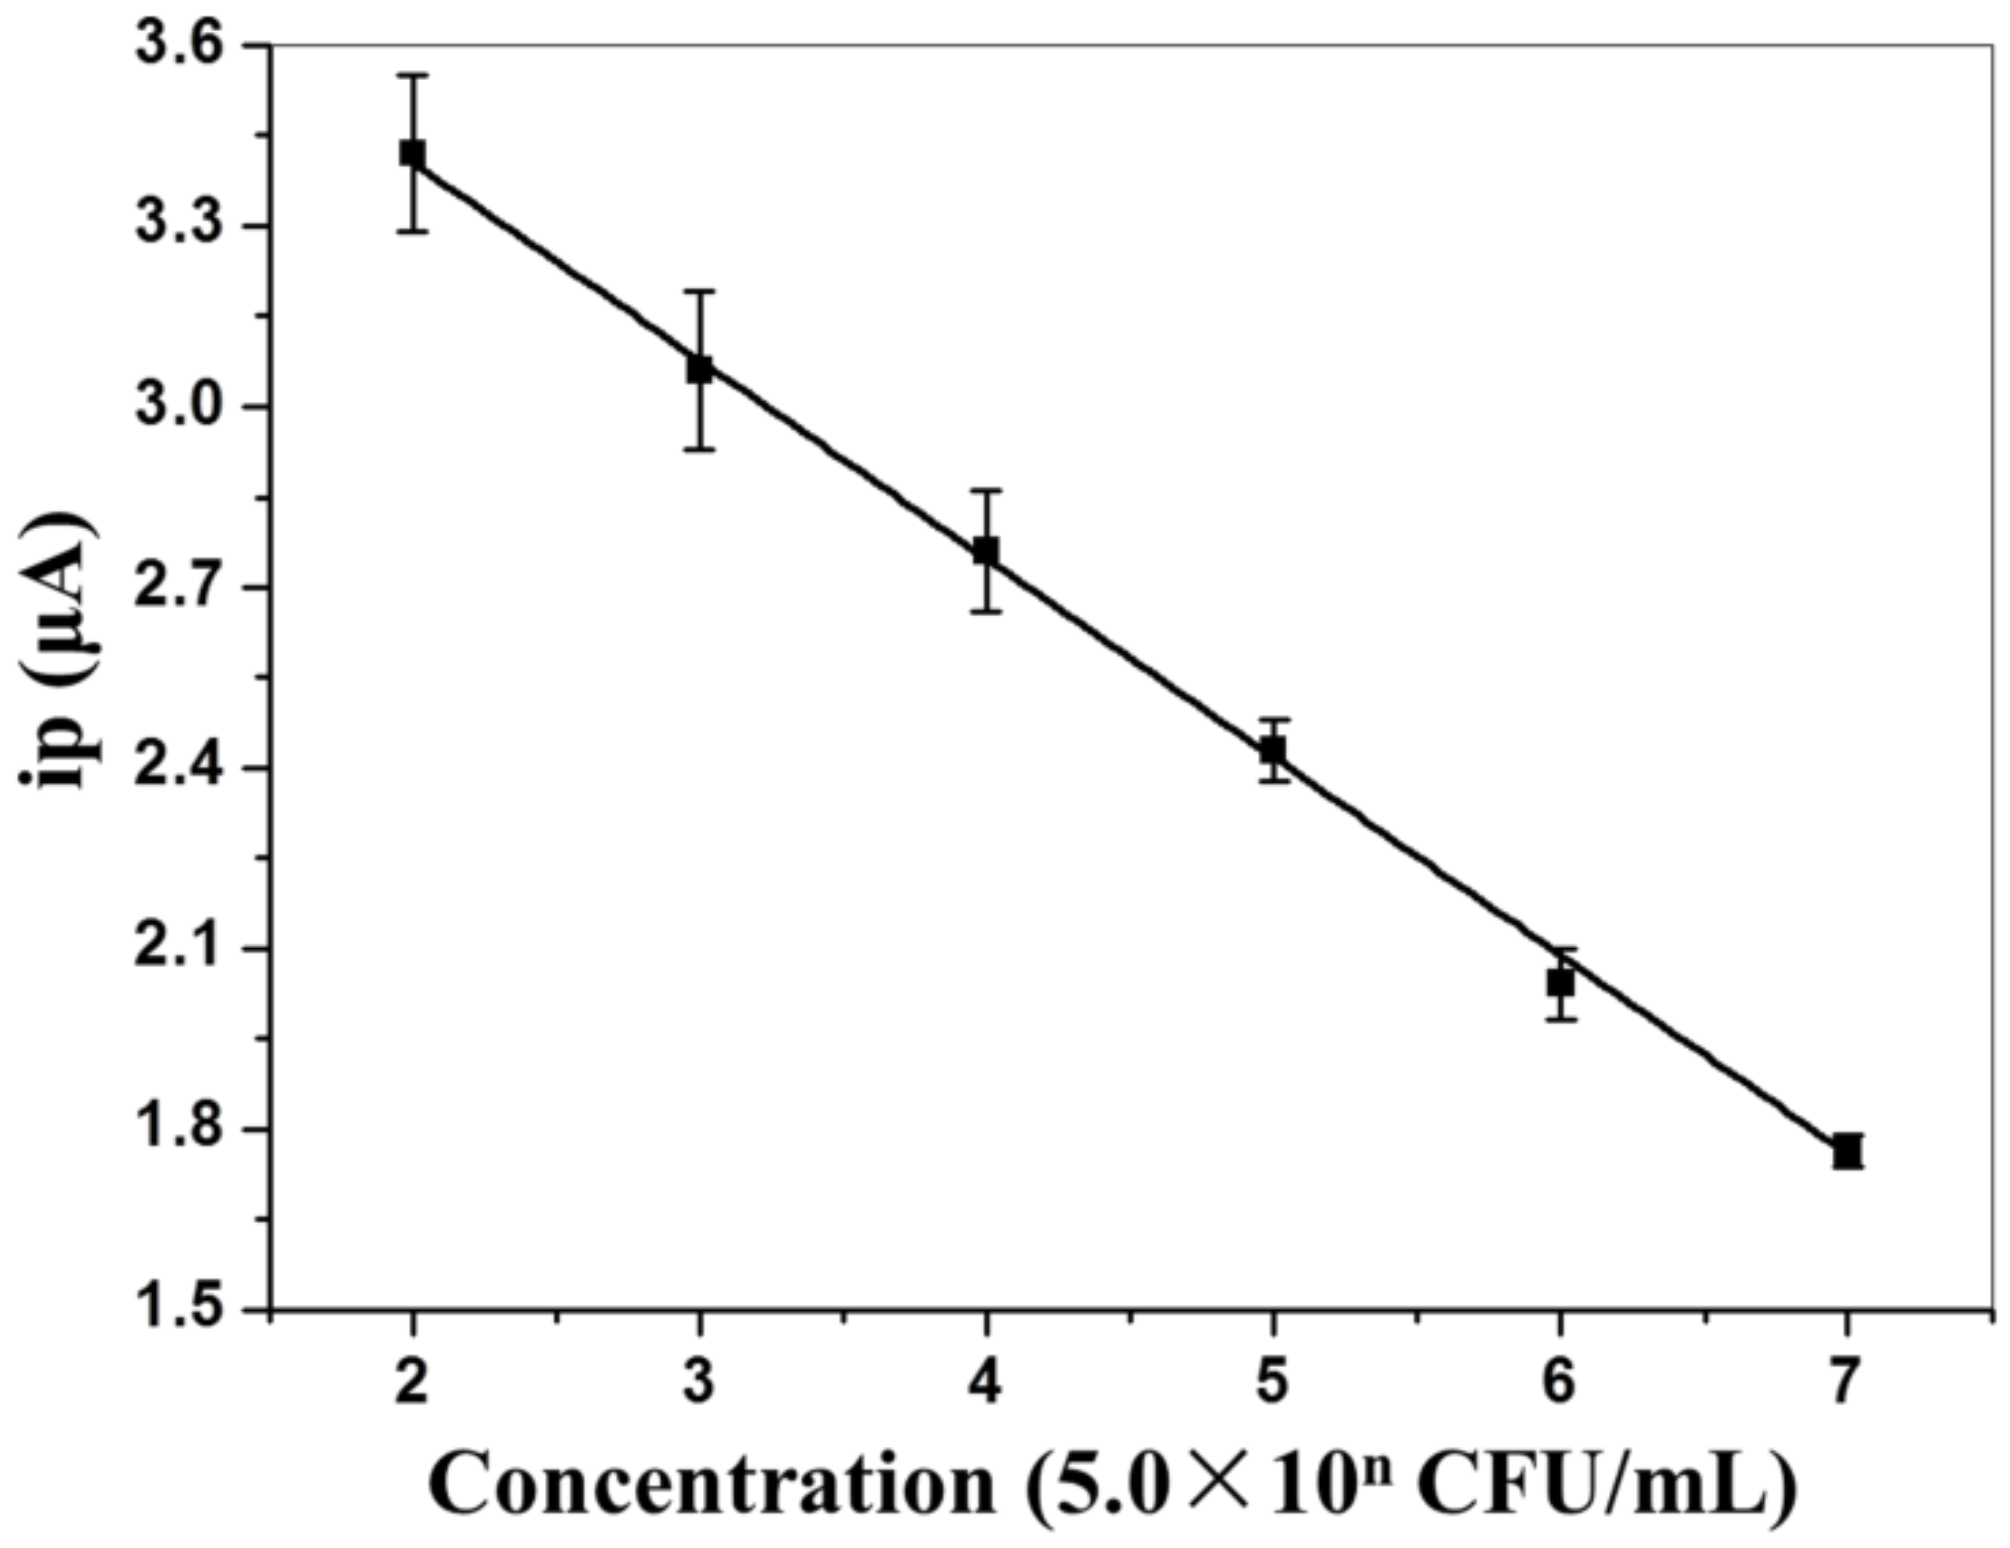
3.5. Sensitivity and Reproducibility of the Electrochemical Biosensor

Under the optimal experimental conditions, the DPV responses of the prepared electrochemical biosensor at different E. coli concentrations are shown in Figure 8. It is found that the DPV peak current decreases with the increasing concentration of E. coli from 5.0 × 10² CFU/mL to 5.0 × 10⁷ CFU/mL. The prepared electrochemical biosensor has a good linear relationship between the peak current (ip) value and the logarithm of E. coli concentration (n) in the range from 5.0 × 10² CFU/mL to 5.0 × 10⁷ CFU/mL (Figure 9). The resulting linear equation is ip (μA) = −0.368n + 4.29, with a correlation coefficient of 0.996. In addition, the limit of detection (LOD) is 80 CFU/mL at a signal-to-noise ratio of 3, which is lower than other methods reported previously for the detection of E. coli (Table 1) [6,42,43,44,45,46,47,48,49,50,51]. Moreover, the measurement time of this method is 150 min, which is shorter than that of PCR, ELISA, immunomagnetic bead sandwich assay and electrochemical immunoassay, not to mention the plate counting method (72 h). It is worth mentioning that the linear range is also wide, spanning 5 orders of magnitude.
To evaluate the repeatability of the developed electrochemical biosensor, the DPV responses were examined 5 times for each of 5.0 × 10², 5.0 × 10⁵ and 5.0 × 10⁷ CFU/mL E. coli. The relative standard deviation (RSD) is 5.3%, 4.5% and 1.1%, respectively. The RSD value is only slightly greater than 5% at 5.0 × 10² CFU/mL concentration, and the rest are less than 5%, indicating that this method had an acceptable reproducibility.

3.6. Detection of E. coli in Licorice Extractum

The applicability of the proposed strategy is tested by the detection the E. coli in real licorice extractum samples at different concentrations, and validated by the plate counting method. In the electrochemical detections, the cultured E. coli at three unknown gradient concentrations are incubated with the electrochemical biosensor in the diluted licorice extracts with the solid content of 4%. At the same time, the parallel E. coli samples at the same unknown gradient concentrations are measured by the plate counting method. The results of DPV test and plate counting method are compared in Table 2. The amounts of strains obtained by these two methods are consistent in magnitude, but the specific values are slightly different. The electrochemical measurement results are higher than those measured by the plate counting method, which may be due to the sensitivity of the electrochemical test method. The p-values in the 105 and 106 concentration gradient groups are much larger than 0. 1, indicating that our method and the plate counting method test results are not significantly different in these two groups, but in the 104 concentration gradient group, the difference between our method and the plate counting method is slightly significant. This may be ascribed to the large systematic error caused by the fewer repeated measurements. In order to clearly illustrate the consistency of these two methods, a large number of repetitive experiments are required. The detection time for plate counting method is 72 h, while the proposed method is only 2.6 h. The significantly shortened detection time will greatly improve the efficiency and expand its application areas in future.

4. Conclusions

An aptamer-based electrochemical biosensor was fabricated successfully and applied in the direct detection of pathogenic E. coli in licorice extract based on the DPV method. Under the optimal conditions, the prepared electrochemical biosensor displayed a low detection limit, a good reproducibility and a wide linear response range for E. coli. Additionally, the proposed method was successfully used for the detection of E. coli in licorice extractum, and the test results were close to the plate counting method at three different gradient concentrations of E. coli. It is worth mentioning that the detection time of the proposed method has been greatly reduced compared with the traditional plate counting methods. We believe that the introduction of the electrochemical biosensing strategy can be used for developing other biosensors for pathogenic microorganism and become a powerful tool for pathogenic bacteria detection in the fields of food and drug safety, quality control, clinical diagnostics, environmental monitoring, etc.

Author Contributions

In this work, H.W. mainly carried out the article design, literature analysis and drafted the manuscript. Y.Z. conducted the electrochemical experimental analyses and drafted the manuscript. S.B. conducted the microbial cultivation. T.S. participated in the revision of the article. G.J. participated in the microbial cultivation and detection. B.L. participated in the revision of the article. R.Y. participated in the revision of the article. Z.L. participated in the article design and revision of the article.

Funding

This research was funded by the Science and Technology Program of Tianjin (15PTCYSY00030), Tianjin Education Program (2017KJ133), Natural Science Foundation of Tianjin, China (No. 16JCYBJC43900), the National S&T Major Project (No. 2018ZX09201011).

Conflicts of Interest

The authors declare no conflict of interest.

Abbreviations

E. coliEscherichia coli
CFUColony forming units
SPRSurface plasmon resonance
LAPSLight-addressable potentiometric sensor
PCRPolymerase chain reaction
ELISAEnzyme linked immunosorbent assay
SELEXExponentially enriched ligand system evolution
3D-IDEAThree-dimensional interdigital array electrode
DEADiethanolamine
TCEPTris(2-carboxyethyl)phosphine
BGLBBrilliant green lactose bile
VRBAViolet red bile agar
BSABovine serum albumin
LBLuria-Bertani
ST-APStreptavidin-alkaline phosphatase
α-NPα-Naphthyl phosphate
CICCChina left of Industrial Culture Collection
PBSPhosphate buffer solution
MCH6-Mercapto-1-hexanol
DPVDifferential pulse voltammetry
SH-CaptureThiol-modified capture probe
Bio-AptamerBiotin-modified aptamer probe
EISElectrochemical impedance spectroscopy
LODLimit of detection
QCMQuartz crystal microbalance
RSDRelative standard deviation
RctThe resistance to charge transfer
CdThe interfacial capacitance
ZwThe diffusion impedance

References

  1. Saxena, T.; Kaushik, P.; Krishna Mohan, M. Prevalence of E. coli O157:H7 in water sources: An overview on associated diseases, outbreaks and detection methods. Diagn. Microbiol. Infect. Dis. 2015, 82, 249–264. [Google Scholar] [CrossRef] [PubMed]
  2. Black, R.E.; Cousens, S.; Johnson, H.L.; Lawn, J.E.; Rudan, L.; Bassani, D.G.; Jha, P.; Campbell, H.; Walker, C.F.R.; Cibulskis, T.; et al. Global, regional, and national causes of child mortality in 2008: A systematic analysis. Lancet 2010, 375, 1969–1987. [Google Scholar] [CrossRef]
  3. Ministry of Health of China. GB 4789.3-2016, Food microbiological examination: Enumeration of coliforms. In National Food Safety Standard of the People’s Republic of China; Ministry of Health of China: Beijing, China, 2016. [Google Scholar]
  4. Roussel, C.; Galia, W.; Leriche, F.; Chalancon, S.; Denis, S.; Van de Wiele, T.; Blanquet-Diot, S. Comparison of conventional plating, PMA-qPCR, and flow cytometry for the determination of viable enterotoxigenic Escherichia coli along a gastrointestinal in vitro model. Appl. Microbiol. Biot. 2018. [Google Scholar] [CrossRef]
  5. Guo, Q.; Han, J.J.; Shan, S.; Liu, D.F.; Wu, S.S.; Xiong, Y.H.; Lai, W.H. DNA-based hybridization chain reaction and biotin-streptavidin signal amplification for sensitive detection of Escherichia coli O157:H7 through ELISA. Biosens. Bioelectron. 2016, 86, 990–995. [Google Scholar] [CrossRef]
  6. Shin, H.J.; Lim, W.K. Rapid label-free detection of E. coli using a novel SPR biosensor containing a fragment of tail protein from phage lambda. Prep. Biochem. Biotechnol. 2018, 1–8. [Google Scholar] [CrossRef] [PubMed]
  7. He, L.; Yang, H.; Xiao, P.; Singh, R.; He, N.; Liu, B.; Li, Z. Highly selective, sensitive and rapid detection of Escherichia coli O157:H7 using duplex PCR and magnetic nanoparticle-based chemiluminescence assay. J. Biomed. Nanotechnol. 2017, 13, 1243–1252. [Google Scholar] [CrossRef]
  8. Gannon, V.P.; Rashed, M.; King, R.K.; Thomas, E.J. Detection and characterization of the eae gene of shiga-Like toxin-producing Escherichia coli using polymerase chain reaction. J. Clin. Microbiol. 1993, 31, 1268–1274. [Google Scholar] [CrossRef]
  9. Johnson, J.R. Development of polymerase chain reaction-based assays for bacterial gene detection. J. Microbiol. Methods 2000, 41, 201–209. [Google Scholar] [CrossRef]
  10. Wu, W.; Li, J.; Pan, D.; Li, J.; Song, S.; Rong, M.; Li, Z.; Gao, J.; Lu, J. Gold nanoparticle-based enzyme-linked antibody-aptamer sandwich assay for detection of Salmonella Typhimurium. ACS Appl. Mater. Int. 2014, 6, 16974–16981. [Google Scholar] [CrossRef]
  11. Kozitsina, A.; Svalova, T.; Malysheva, N.; Glazyrina, Y.; Matern, A. A new enzyme-free electrochemical immunoassay for Escherichia coli detection using magnetic nanoparticles. Anal. Lett. 2015, 49, 245–257. [Google Scholar] [CrossRef]
  12. Pang, B.; Zhao, C.; Li, L.; Song, X.; Xu, K.; Wang, J.; Liu, Y.; Fu, K.; Bao, H.; Song, D. Development of a low-cost paper-based ELISA method for rapid Escherichia coli O157:H7 detection. Anal. Biochem. 2017, 542, 58–62. [Google Scholar] [CrossRef] [PubMed]
  13. Lee, J.K.; Gu, Y.; Min, P.; Jose, J.; Pyun, J.C. Electrochemical ELISA Based on E. Coli with auto displayed Z-Domains. Sens. Actuators B Chem. 2012, 175, 46–52. [Google Scholar] [CrossRef]
  14. Xie, C.; Wang, R.; Saeed, A.F.U.H.; Yang, Q.; Chen, H.; Ling, S.; Xiao, S.; Zeng, L.; Wang, S. Preparation of anti-human podoplanin monoclonal antibody and its application in immunohistochemical diagnosis. Sci. Rep. 2018, 8. [Google Scholar] [CrossRef] [PubMed]
  15. Angenendt, P.; Glökler, J.; Konthur, Z.; Lehrach, H.; Cahill, D.J. 3D protein microarrays: Performing multiplex immunoassays on a single chip. Anal. Chem. 2003, 75, 4368–4372. [Google Scholar] [CrossRef] [PubMed]
  16. Lv, L.L.; Liu, B.C.; Zhang, C.X.; Tang, Z.M.; Zhang, L.; Lu, Z.H. Construction of an antibody microarray based on agarose-coated slides. Electrophoresis 2010, 28, 406–413. [Google Scholar] [CrossRef] [PubMed]
  17. Wunderlich, A.; Torggler, C.; Elsasser, D.; Luck, C.; Niessner, R.; Seidel, M. Rapid quantification method for legionella pneumophila in surface water. Anal. Bioanal. Chem. 2016, 408, 2203–2213. [Google Scholar] [CrossRef] [PubMed]
  18. Freitas, J.M.; Ramos, D.L.O.; Sousa, R.M.F.; Paixão, T.R.L.C.; Santana, M.H.P.; Muñoz, R.A.A.; Richter, E.M. A portable electrochemical method for cocaine quantification and rapid screening of common adulterants in seized samples. Sens. Actuators B Chem. 2017, 243, 557–565. [Google Scholar] [CrossRef]
  19. Istamboulié, G.; Paniel, N.; Zara, L.; Reguillo, G.L.; Barthelmebs, L.; Noguer, T. Development of an impedimetric aptasensor for the determination of aflatoxin M1 in milk. Talanta 2016, 146, 464–469. [Google Scholar] [CrossRef]
  20. Taufik, S.; Barfidokht, A.; Alam, M.T.; Jiang, C.; Parker, S.G.; Gooding, J.J. An antifouling electrode based on electrode–organic layer–nanoparticle constructs: Electrodeposited organic layers versus self-assembled monolayers. J. Electroanal. Chem. 2016, 779, 229–235. [Google Scholar] [CrossRef]
  21. Mishra, G.K.; Barfidokht, A.; Tehrani, F.; Mishra, R.K. Food safety analysis using electrochemical biosensors. Foods 2018, 7, 141. [Google Scholar] [CrossRef]
  22. Babaei, A.; Zendehdel, M.; Khalilzadeh, B.; Taheri, A. Simultaneous determination of tryptophan, uric acid and ascorbic acid at iron(III) doped zeolite modified carbon paste electrode. Colloids Surf. B Biointerfaces 2008, 66, 226–232. [Google Scholar] [CrossRef]
  23. Fiorucci, A.R.; Cavalheiro, E.T. The use of carbon paste electrode in the direct voltammetric determination of tryptophan in pharmaceutical formulations. J. Pharm. Biomed. Anal. 2002, 28, 909–915. [Google Scholar] [CrossRef]
  24. Kim, J.; Jeerapan, I.; Sempionatto, J.R.; Barfidokht, A.; Mishra, R.K.; Campbell, A.S.; Hubble, L.J.; Wang, J. Wearable bioelectronics: Enzyme-based body-worn electronic devices. Acc. Chem. Res. 2018, 51, 2820–2828. [Google Scholar] [CrossRef]
  25. Zhao, Y.W.; Wang, H.X.; Jia, G.C.; Li, Z. Application of aptamer-based biosensor for rapid detection of pathogenic Escherichia coli. Sensors 2018, 18, 2518. [Google Scholar] [CrossRef] [PubMed]
  26. Durairaj, S.; Sidhureddy, B.; Cirone, J.; Chen, A. Nanomaterials-based electrochemical sensors for in vitro and in vivo analyses of neurotransmitters. Appl. Sci. 2018, 8, 1504. [Google Scholar] [CrossRef]
  27. Barfidokht, A.; Ciampi, S.; Luais, E.; Darwish, N.; Gooding, J.J. Distance-dependent electron transfer at passivated electrodes decorated by gold nanoparticles. Anal. Chem. 2013, 85, 1073–1080. [Google Scholar] [CrossRef]
  28. Tuerk, C.; Gold, L. Systematic evolution of ligands by exponential enrichment: RNA ligands to bacteriophage T4 DNA polymerase. Science 1990, 249, 505–510. [Google Scholar] [CrossRef] [PubMed]
  29. Ellington, A.D.; Szostak, J.W. In vitro selection of RNA molecules that bind specific ligands. Nature 1990, 346, 818–822. [Google Scholar] [CrossRef]
  30. Brosel-Oliu, S.; Ferreira, R.; Uria, N.; Abramova, N.; Gargallo, R.; Muñoz-Pascual, F.-X.; Bratov, A. Novel impedimetric aptasensor for label-free detection of Escherichia coli O157:H7. Sens. Actuators B Chem. 2018, 255, 2988–2995. [Google Scholar] [CrossRef]
  31. Luo, C.; Lei, Y.; Yan, L.; Yu, T.; Li, Q.; Zhang, D.; Ding, S.; Ju, H. A rapid and sensitive aptamer-based electrochemical biosensor for direct detection of Escherichia Coli O111. Electroanalysis 2012, 24, 1186–1191. [Google Scholar] [CrossRef]
  32. Duan, N.; Zhang, T.L.; Wu, S.J.; Wang, Z.P. Selection of an aptamer targeted to enteropathogenic Escherichia coli. J. Food Saf. Qual. 2015, 6, 4803–4809. [Google Scholar]
  33. Chen, F.; Zhou, J.; Luo, F.; Mohammed, A.B.; Zhang, X.L. Aptamer from whole-bacterium SELEX as new therapeutic reagent against virulent Mycobacterium tuberculosis. Biochem. Biophys. Res. Commun. 2007, 357, 743–748. [Google Scholar] [CrossRef] [PubMed]
  34. Mans, R.J.; Novelli, G.D. A convenient, rapid and sensitive method for measuring the incorporation of radioactive amino acids into protein. Biochem. Biophys. Res. Commun. 1960, 3, 540–543. [Google Scholar] [CrossRef]
  35. Mans, R.J.; Novelli, G.D. Measurement of the incorporation of radioactive amino acids into protein by a filter-paper disk method. Arch. Biochem. Biophys. 1961, 94, 48–53. [Google Scholar] [CrossRef]
  36. Fan, G.W.; Xu, J.G. The effects of 6 antibiotics and berberine on releasing of Shiga-toxin from Escherichia O157:H7 strains isolated in China. Chin. J. Microbiol. Immunol. 2002, 22, 218–221. [Google Scholar]
  37. Zhao, W.W.; Ma, Z.Y.; Yu, P.P.; Dong, X.Y.; Xu, J.J.; Chen, H.Y. Highly sensitive photoelectrochemical immunoassay with enhanced amplification using horseradish peroxidase induced biocatalytic precipitation on a CdS quantum dots multilayer electrode. Anal. Chem. 2012, 84, 917–923. [Google Scholar] [CrossRef]
  38. Peterlinz, K.A.; Georgiadis, R.M.; Herne, T.M.; Tarlov, M.J. Observation of hybridization and dehybridization of thiol-tethered DNA using two-color surface plasmon resonance spectroscopy. J. Am. Chem. Soc. 1997, 119, 3401–3402. [Google Scholar] [CrossRef]
  39. Yang, L.; Fung, C.W.; Cho, E.J.; Ellington, A.D. Real-time rolling circle amplification for protein detection. Anal. Chem. 2007, 79, 3320–3329. [Google Scholar] [CrossRef]
  40. Orazem, M.E.; Tribollet, B. Electrochemical Impedance Spectroscopy, 1st ed.; John Wiley & Sons Inc.: New York, NY, USA, 2008; pp. 224–241. [Google Scholar]
  41. He, X.; Su, J.; Wang, Y.; Wang, K.; Ni, X.; Chen, Z. A sensitive signal-on electrochemical assay for MTase activity using AuNPs amplification. Biosens. Bioelectron. 2011, 28, 298–303. [Google Scholar] [CrossRef]
  42. Khang, J.; Kim, D.; Chung, K.W.; Lee, J.H. Chemiluminescent aptasensor capable of rapidly quantifying Escherichia Coli O157:H7. Talanta 2016, 147, 177–183. [Google Scholar] [CrossRef]
  43. Wang, Y.; Zhao, P.; Zhang, H.; Chen, W.; Su, X.; Suo, B. A simple and rapid realtime PCR assay for the detection of Shigella and Escherichia coli species in raw milk. J. Verbr. Lebensm. 2013, 8, 313–319. [Google Scholar] [CrossRef]
  44. Galikowska, E.; Kunikowska, D.; Tokarska-Pietrzak, E.; Dziadziuszko, H.; Los, J.M.; Golec, P.; Wegrzyn, G.; Los, M. Specific detection of Salmonella enterica and Escherichia coli strains by using ELISA with bacteriophages as recognition agents. Eur. J. Clin. Microbiol. Infect. Dis. 2011, 30, 1067–1073. [Google Scholar] [CrossRef] [PubMed]
  45. Rahman, S.; Lipert, R.J.; Porter, M.D. Rapid screening of pathogenic bacteria using solid phase concentration and diffuse reflectance spectroscopy. Anal. Chim. Acta 2006, 569, 83–90. [Google Scholar] [CrossRef]
  46. Chen, C.S.; Durst, R.A. Simultaneous detection of Escherichia coli O157:H7, Salmonella spp. and Listeria monocytogenes with an array-based immunosorbent assay using universal protein G-liposomal nanovesicles. Talanta 2006, 69, 232–238. [Google Scholar] [CrossRef]
  47. Yu, X.; Chen, F.; Wang, R.; Li, Y. Whole-bacterium SELEX of DNA aptamers for rapid detection of E. coli O157:H7 using a QCM sensor. J. Biotechnol. 2018, 266, 39–49. [Google Scholar] [CrossRef] [PubMed]
  48. Ruan, C.; Li, Y. A bienayme electrochemical biosensor coupled with immunomagnetic separation for rapid detection of Escherichia coli O157:H7 in food samples. Trans. ASAE 2002, 45, 249–255. [Google Scholar] [CrossRef]
  49. Gehring, A.G.; Patterson, D.L.; Tu, S.I. Use of a light-addressable potentiometric sensor for the detection of Escherichia coli O157:H7. Anal. Biochem. 1998, 258, 293–298. [Google Scholar] [CrossRef] [PubMed]
  50. Zhang, J.; Wang, J.; Zhang, X.; He, F. Rapid detection of Escherichia coli based on 16S rDNA nanogap network electrochemical biosensor. Biosens. Bioelectron. 2018, 118, 9–15. [Google Scholar] [CrossRef]
  51. Ye, L.; Zhao, G.; Dou, W. An electrochemical immunoassay for Escherichia coli O157:H7 using double functionalized Au@Pt/SiO2 nanocomposites and immune magnetic nanoparticles. Talanta 2018, 182, 354–362. [Google Scholar] [CrossRef] [PubMed]
Figure 1. Schematic of the Electrochemical Biosensor for E. coli detection.
Applsci 09 00295 g001
Figure 2. Nyquist diagrams of EIS at the bare gold electrode (curve a), the capture probe modified gold electrode (curve b), the aptamer probe modified gold electrode (curve c) and the aptamer probe modified gold electrode after reaction with 5.0 × 10² CFU/mL E. coli (curve d). EIS condition: frequency range: 100 kHz–0.01 Hz; potential: 0.175 V; amplitude: 5 mV; solution: 1 mM K3Fe(CN)6/K4Fe(CN)6 containing 0.1 M KCl. The inset of Figure 2 is the Randles circuit model.
Applsci 09 00295 g002
Figure 3. The antibacterial activity of filter paper immersed in licorice extract in 2% (D), 4% (C), 8% (E) and 20% (B) solid content, penicillin and streptomycin mixture (positive control, F) and sterile saline (negative control, A).
Applsci 09 00295 g003
Figure 4. The relationship between the concentration of the aptamer probe and the peak current under the reaction with 5.0 × 10² CFU/mL E. coli.
Applsci 09 00295 g004
Figure 5. The relationship between the incubation time and the peak current under reaction with 5.0 × 10³ CFU/mL E. coli and 3 μM aptamer probe.
Applsci 09 00295 g005
Figure 6. The relationship between the ST-AP concentration and the peak current under the reaction with 5.0 × 10² CFU/mL E. coli.
Applsci 09 00295 g006
Figure 7. The relationship between the α-NP concentration and the peak current under reaction with 5.0 × 10² CFU/mL E. coli.
Applsci 09 00295 g007
Figure 8. DPV responses in licorice extract of 4% solid content: (a) 5.0 × 10² CFU/mL, (b) 5.0 × 10³ CFU/mL, (c) 5.0 × 10⁴ CFU/mL, (d) 5.0 × 10⁵ CFU/mL, (e) 5.0 × 10⁶ CFU/mL and (f) 5.0 × 10⁷ CFU/mL E. coli.
Applsci 09 00295 g008
Figure 9. Calibration plot of peak currents versus concentration of E. coli.
Applsci 09 00295 g009
Table 1. Comparison between the proposed method and other reported biosensors for the detection of E. coli.
No.Biosensor PlatformBio-ReceptorLinear RangeMeasurement TimeLOD (CFU/mL)Ref.
1CL aptasensorAptamer104–107 CFU/mL63 min *4.5 × 103[42]
2PCRPrimer102–106 CFU/mL180 min102 (without pre-enrichment step)[43]
3ELISABacteriophages/240 min *106[44]
4Diffuse reflectance spectroscopyDye-labeled antibodies5 × 105–5 × 10⁸ CFU/mL45 min2 × 105[45]
5Immunomagnetic bead sandwich assayProtein G-liposomal nanovesicles102–108 CFU/mL275 min *100 (in pure cultures)
3.1 × 10³
(in mixed cultures)
[46]
6QCM (quartz crystal microbalance)sensorAptamer102–105 CFU/mL and
105–107 CFU/mL
50 min1.46 × 103[47]
7SPR biosensorFragment of tail protein J from phage lambda2 × 104–2 × 10⁹ CFU/mL20 min2 × 104 [6]
8Electrochemical sensorAntibody6 × 103–6 × 10⁵ CFU/mL120 min6 × 102 [48]
9Light-addressable potentiometric sensor (LAPS)Fluoresceinated antibodies/45 min7.1 × 102
(heat-killed)
2.5 × 10⁴ (live)
[49]
10Electrochemical biosensorssDNA103–108 CFU/mLLess than 180 min102[50]
11Electrochemical immunoassayMonoclonal antibody against E. coli O157:H7 functionalized magnetic nanoparticles3.5 × 103–3.5 × 10⁸ CFU/mL165 min *1.83 × 102[51]
12Electrochemical biosensorAptamer5.0 × 102–5.0 × 10⁷ CFU/mL150 min80This study
/ means not available in the text. * means not available in the text directly, the detection time is speculated based on the experimental steps in the paper.
Table 2. Comparison between the proposed method and the plate counting method for detection of E. coli at 95% confidence interval.
NO. The Plate Counting Method (n = 3, x ¯ S D , CFU/mL) This Study
(n = 3, x ¯ S D , CFU/mL)
P (n = 3)
1(5.00 ± 0.20) × 104 (9.02 ± 0.10) × 104 0.02
2(6.43 ± 0.05) × 105(7.57 ± 0.60) × 105 0.76
3(4.67 ± 0.16) × 106 (5.76 ± 0.360 × 10⁶ 0.54

