1. Introduction
Detection of ultra-low proteins concentration in solution using novel physical effects like plasmonics, surface-enhanced Raman spectroscopy, and photonic waveguide-based sensors are promising techniques for novel medical diagnostics [
1,
2,
3,
4,
5,
6,
7]. In particular, a low myoglobin concentration is a relevant marker of myocardial infarction in human blood plasma [
8,
9,
10]. It is well known that the amplified SERS response of organic molecules could be obtained by depositing those on specially designed silver, gold or copper thin film substrates [
11,
12,
13,
14,
15], as well as using silver or gold colloidal nanoparticles in solution [
16,
17,
18,
19]. One of the most critical issues of any SERS-based analysis is a procedure of protein probe preparation both for planar thin film SERS substrates and colloidal techniques. Conventional research on SERS-based sensors often depends on nanoparticle aggregation, whereas the non-reproducible nanoparticle aggregation gives rise to poor repeatability in the Raman signal. The simplest method of probe preparation is the drying of analyte solution drop on a SERS substrate in air under normal conditions. Compared to the metal nanoparticles solution used for protein deposition, the drying method is more convenient and faster because it does not require any precise control of chemisorption processes using a large number of auxiliary reagents. Moreover, the developed method provides the minimal amount of analyte required for analysis (about several micro liters) and minimizes sample preparation time, compared to various methods of surface modification using antibodies, which take several hours and require a number of reagents. It is well known, that both shape (and size) of dried probe on the SERS substrate surface and near-surface light rays trajectories have to be taken into account. By using planar SERS-active substrates, it is possible to utilize such a simple and quick sample preparation methods like probe drying, which, on the one hand, ensures the minimum area of sediment formation, on the other hand, provides sediment-surface conformation, which gives additional Raman signal enhancement.
Various metal films and fabrication techniques are used for this purpose: physical vacuum deposition (PVD) [
20,
21], electrochemical deposition from the solution [
22,
23,
24], deposition from a colloidal solution of nanoparticles [
25,
26,
27,
28], electron-beam lithography [
29,
30], plasma-chemical lithography [
31]. All the recently used metal thin films and surfaces for SERS-based sensorics usually based on already known general principles of creating surfaces for the successful registration of the giant Raman spectra [
32]. First of all, SERS structures/surfaces must have the morphology or topology features, which satisfy the conditions of local field enhancement in the selected range of Raman spectra registration wavelength [
32,
33,
34,
35]. Many recent researchers demonstrate registration of Raman spectra of proteins [
19,
36,
37,
38] by means of SERS substrates with patterned metal films or well-structured morphology.
It is worth noting that a metal film surface roughness could be a very important factor as it corresponds to forming and optimal adsorption of analyte near so called “hot spots”. When precipitating the analyzed substance from a solution, the scale of a substrate surface relief inhomogeneities affects dramatically on the way of analyte particles crystallization, sedimentation in the process of near-surface microcirculation and precipitate formation during analyte drops drying [
39,
40]. Unfortunately, there are still no simulation techniques, which provide an opportunity to predict substrates surface morphology corresponding to thin films deposition recipe parameters. From the other hand, there is a possibility to form almost any SERS-active substrates nanoscale morphology and topology using well-known e-beam lithography and dry etching processes, but they are still too expensive for mass production. That is why well-controlled experimental PVD methods of fabricating metal thin films of silver and gold with sophisticated surface morphology by self-assembling remains an extensive area of research. A lot of papers are devoted to island-like silver films with a thickness below the percolation threshold (non-continuous) obtained by vacuum sputtering methods. However, such films have limited applications due to low thermal conductivity, leading to SERS substrate degradation when exposed to exciting laser radiation power above several mW. By experimentally controlling evaporation process recipe parameters, it becomes possible to obtain continuous noble metal thin films with a well-controlled morphology down to atomically flat surfaces, crystalline structure, electrical and optical parameters [
41,
42,
43,
44,
45,
46,
47].
In this paper, we investigate the possibility of creating thin silver films with complex self-assembled morphology using the electron-beam evaporation in vacuum, which makes it possible to obtain high-amplitude spectra of myoglobin deposited on the surface from low concentration solution. We experimentally determine the e-beam evaporation recipe parameters to get SERS-active substrates with complex surface morphology, that allow obtaining the maximum SERS signal amplification for a particular type of analyte. At the same time, we observe that proposed SERS-active substrates promote quite important processes of concentrating liquid analyte probes during drying process on the substrate surfaces with characteristic uniform sediment ring dimensions less than 200 microns in diameter, which is also quite a challenge. Finally, the mathematical data treatment of the film surface morphology is carried out, followed by machine learning analysis to provide automatic characterization and forecast technique of SERS-active substrate quality.
2. Materials and Methods
Silver thin films were deposited on prime-grade intrinsic Si(111) FZ high-resistivity wafers (>10,000 Ω·cm), glass and muscovite mica substrates using both a 10 kW e-beam evaporator (Angstrom Engineering, Canada) with a base pressure lower than 3 × 10⁻⁸ Torr and 8 kW e-beam evaporator (Quartz, Russia) with a base pressure lower than 5 × 10⁻⁶Torr. Before loading into the vacuum chamber of an electron-beam evaporator the substrates were preliminary cleaned with isopropanol (99.5%) (Sigma-Aldrich, USA). Mica substrates were cleaved perpendicular to the c-axis to reveal fresh surfaces, prior to deposition. Prepared substrates were placed in a substrate holder at a distance of 380 mm from the source of metal vapor. Before the metal film deposition, the substrates were pre-cleaned in plasma in a residual atmosphere at a pressure of 10−3Torr in the vacuum chamber. All the films were grown using high-purity 4N (≥99.99%) (Moscow special alloys processing plant, Russia) granulated silver with the grain size of 3 mm. Seven types of SERS substrates were obtained and the possibility of myoglobin SERS-based detection (in a solution with concentrations of 10 µg/mL) was further studied.
Type I: Si (111)/Ag single-crystalline (65 nm).
Type II: Si (111)/Ag single-crystalline (65 nm)/Al2O3 (atomic layer deposition (ALD)) (2 nm).
Type III: glass/Ag rough film (100 nm).
Type IV: glass/Ag rough film (100 nm) with “droplet phase”.
Type V: mica/Ag single-crystalline film (100 nm) with pore-like semi-regular nanostructures.
Type VI: mica/Ag single-crystalline film (100 nm).
Type VII: glass/Al film (3000 nm)/Ag rough film (100 nm).
The samples of types I, II, V, VI were made at the BMSTU Nanofabrication Facility (Functional Micro/Nanosystems, FMNS REC, ID 74300). The samples of types III, IV, VII were made at the ITAE RAS. During films evaporation the deposition rate and the substrate temperature were varied, which made it possible to control the microstructure of growing films at the nanoscale level. The chamber pressure for the samples Type III, Type IV, Type VII was 5 × 10⁻⁶Torr, cathode voltage was 12 V, beam current was 30 mA, source accelerating voltage was 8 kV. For the samples Type I, Type II, Type V, Type VI, the chamber pressure was 3 × 10⁻⁸ Torr. The deposition rate varied from 1 nm/s to 30 nm/s, the substrate temperature ranged from 300 K to 650 K. The thickness of the films during deposition was controlled directly in the process of growth by means of optical control. After deposition, the film thickness was selectively measured using a stylus profilometer KLA-Tencor P-17 (KLA-Tencor Corporation, USA). Surface morphology was investigated using a Solver-Pro atomic-force microscope of (NT-MDT, Russia). Images were taken in the tapping mode. The HA_NC/Au probes with resonance frequency 140 kHz ± 10%, force constant 3.5 N/m, tip radius less than 10 nm were used.
We used freshly prepared solutions of myoglobin (produced by Sigma-Aldrich) in deionized water with a concentration of 10 µg/mL. To determine the influence of topology and volumeof protein precipitate on the amplitude of SERS spectra, myoglobin solutions of high concentration (about 1 g/L) were used. Deionized water for the solution was produced using the Milli-Q purification system. Drops of a 3 µL protein solution were applied on the surface of a silver film using a high-precision Eppendorf variable-volume pipettes. Drying was carried out on air under normal conditions.
After drying, the Raman spectra of protein on the substrates were obtained using the Raman spectrometer (WITec, Germany) at the excitation wavelength of 785 nm. Laser power was 65 mW, spectrum accumulation time was 60 s. The lens 50X/0,8 L 0/∞ with chromatic aberration correction was used to record the spectra. Spectrograph Andor with a lens-free optical signal transmission system was used as a recorder in the Raman spectroscopy system (WITec, Germany), which allows to reduce losses. Electron-multiplying charge-coupled device (EMCCD) matrix with cooling down to −60 °C was used for signal detection, which reduces dark noise by an order of magnitude. The adjustment of the measurement site was performed using an optical microscope tuning system and a precision piezoelectric microscope table. The spectra were processed with the WITec Project software. All the SERS spectra are firstly baseline-corrected using polynomial method.
3. Results and Discussion
3.1. SERS-Active Substrates Surface Analysis
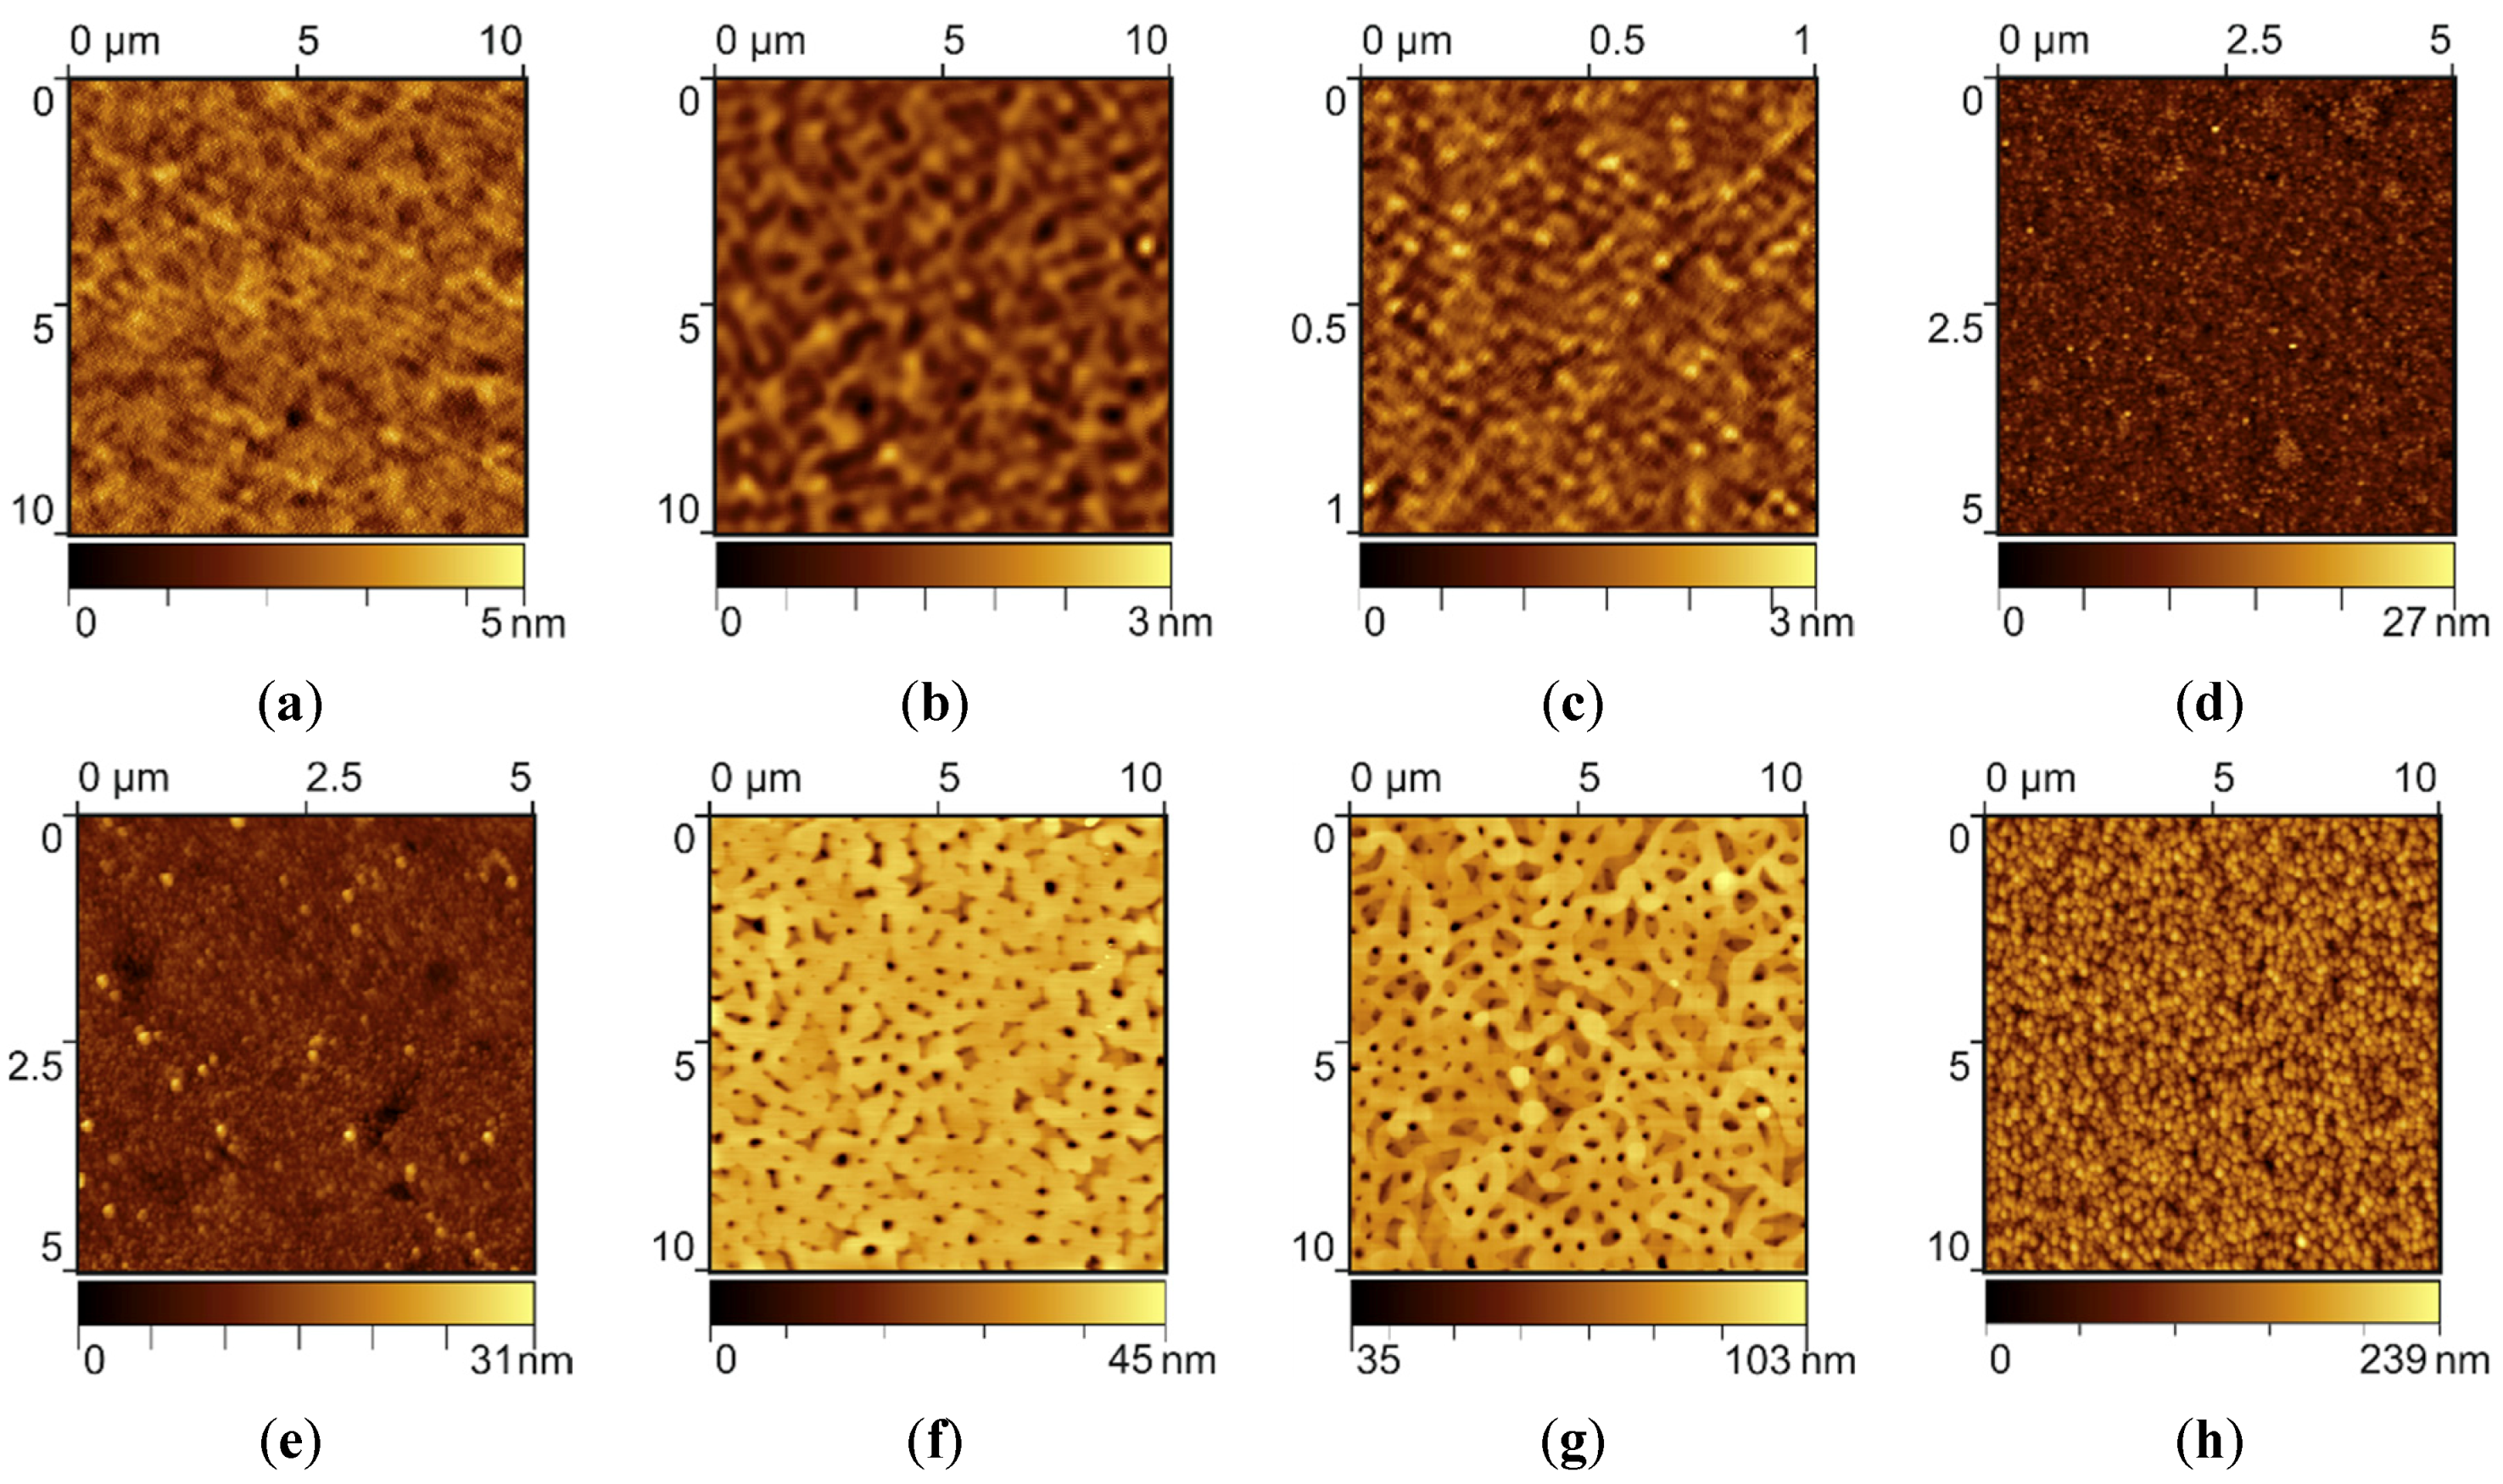
It is well-known, that one of the key parameters of the silver SERS substrate, which dramatically affects the quality and Raman signal amplification, is the character of thin film surface morphology. That is why in the past, the general idea of SERS substrates engineering was to deposit and investigate the different kinds of disrupted (or island-like) metal films with a various type of rough surface. The nanostructure and morphology of PVD metal thin films could be controlled by the substrate crystalline structure and temperature, deposition rate, material purity, vacuum conditions, etc. Precisely controlling these deposition recipe parameters makes it possible to obtain self-assembled metal thin films with reproducible and controllable sophisticated surface morphology. For example, silver thin films can be deposited with pore-like semi-regular structures, where the “pore” sizes and the surface roughness can be adjusted in a controlled manner. For substrate temperature in the range of 550–650 K, and deposition rate of approximately 1.0 nm/s, one can get films with large plateaus and deep holes. Smaller substrate temperature in the range of 450–550 K and higher deposition rates lead to smaller plateaus and shallow grooves. Each type of structures like this has its own surface morphology, which is characterized by a number of semi-regular structures, characteristic size, depth and shape. By optimizing the combination of these surface morphology singularities, we determine the best “pattern” providing the highest Raman signal amplification. To provide this analysis we first performed the high-resolution AFM surface scans of all the seven types of SERS-active substrates (see Materials and Methods).
Samples of type I (
Figure 1a) and type II (
Figure 1b) have smooth surfaces with relief height of about several nanometers. At high resolution it can be seen (
Figure 1c), that a smooth sample (type I) has micro-relief on the surface with typical feature size of about 30 nm. There are around 130 pieces in the 1 × 1 μm
2 area (the average quantity). Silver films on glass have more corrugated surface of two different types, depending on the deposition conditions. For example, the structures type III (
Figure 1d) are fine-grained films with a characteristic surface grain size of about 50 nm. There are significant defects of 100 ÷ 120 nm on the type IV samples (
Figure 1e) on the background of a similar fine-grained structure. A typical surface morphology of silver films formed on mica under described evaporation conditions (the samples type V and VI) is shown in
Figure 1f,g. Such structures are self-assembled silver film with nanoscale single-crystalline surface features (or pore-like semi-regular nanostructures). The microstructure of these films can be controlled by vacuum conditions, substrate temperature and deposition rate. By optimizing these parameters it is possible to manage the number of pores and their size, or even completely get rid of them.
The last sample (type VII) consist of 100 nm thick silver film grown on a thick (3000 nm) aluminum film on a glass substrate. The silver film has a uniform nanostructured surface with the structural elements size in the range of 130–180 nm (
Figure 1h). In the next step all the samples were experimentally analyzed in term of Raman signal amplification of myoglobin probe deposited on the surface using air-drying method from the low concentration solution (10 μg/mL).
3.2. Myoglobin Raman Spectra Measurements on the SERS-Active Substrates
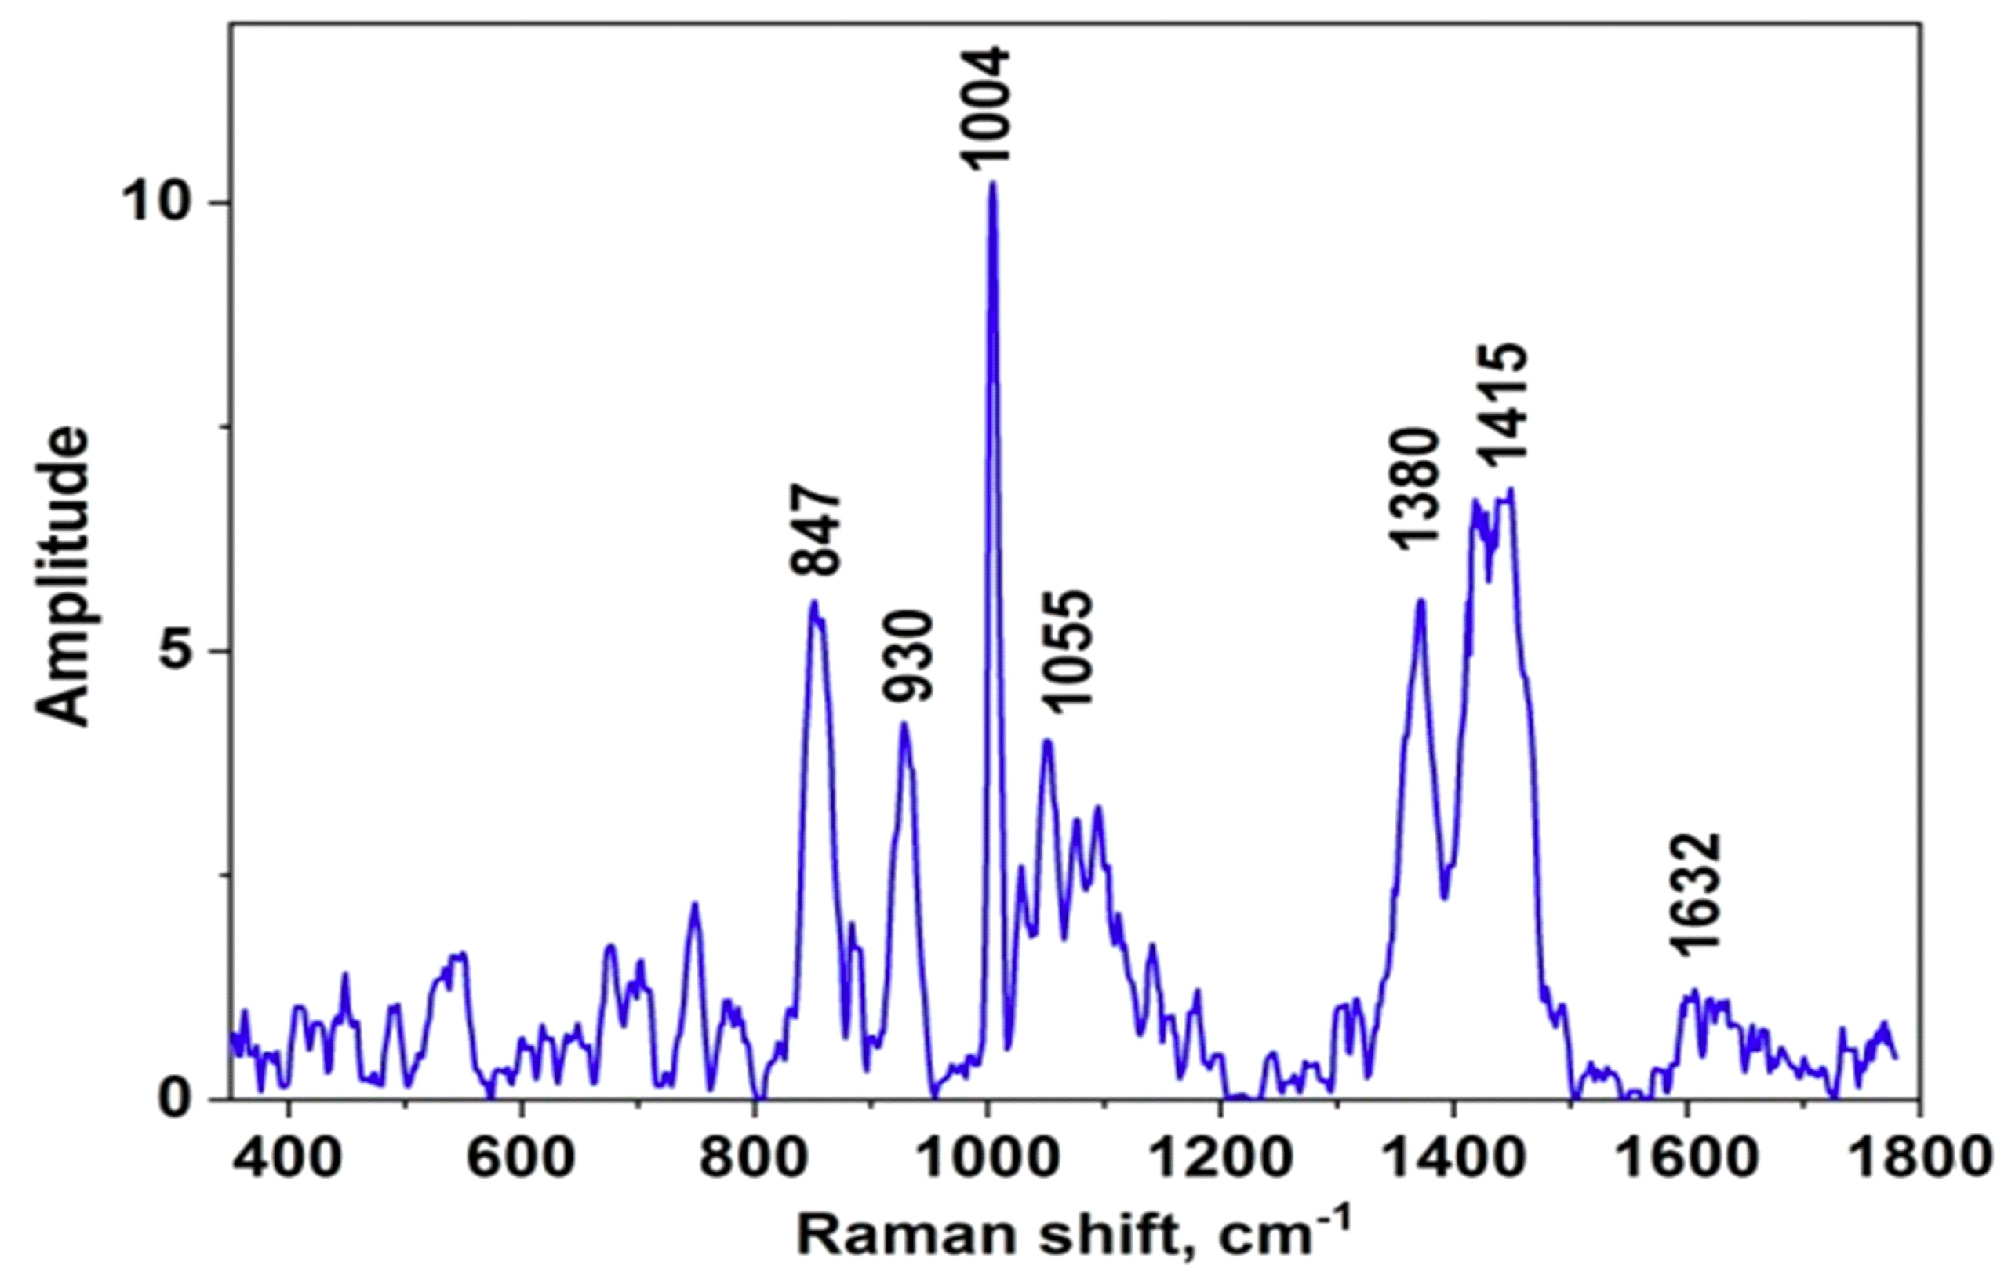
The SERS signal amplification of the proposed SERS-active substrates was evaluated using control sample and the protein deposited on the surface with the same drying technique. We have chosen the substrate with the aluminum thin film (100 nm), evaporated using the same PVD tool, as the control substrates. The control sample was the amorphous mass with the analyte concentration on the outer circumference of the drop in the form of a well-known “coffee-ring”. Reproducible spectra of myoglobin, equally distributed over the spot boundary region, was obtained. It was found thickness of protein precipitate exceeded the spectral volume of our confocal microscope. The spectrum of myoglobin on a control sample with the 100 nm thick aluminum film is shown in
Figure 2. The presented spectrum is typically interpreted for myoglobin according to [
37,
48]: bands at 847 cm
−1 – Trp; 930 cm
−1 – α-helix; 1004 cm
−1 – Phe; 1055 cm
−1 – Tyr; 1445 cm
−1 – Amide III; 1632 cm
−1 – Amide I; 1380 cm
−1 - Heme; 1415 cm
−1 – Trp. Some bands of oscillations are not developed, which may be due to the low signal-to-noise ratio.
The analysis of dried protein substance on the surface of all the SERS substrates showed that the protein formed reproducible amorphous structures (
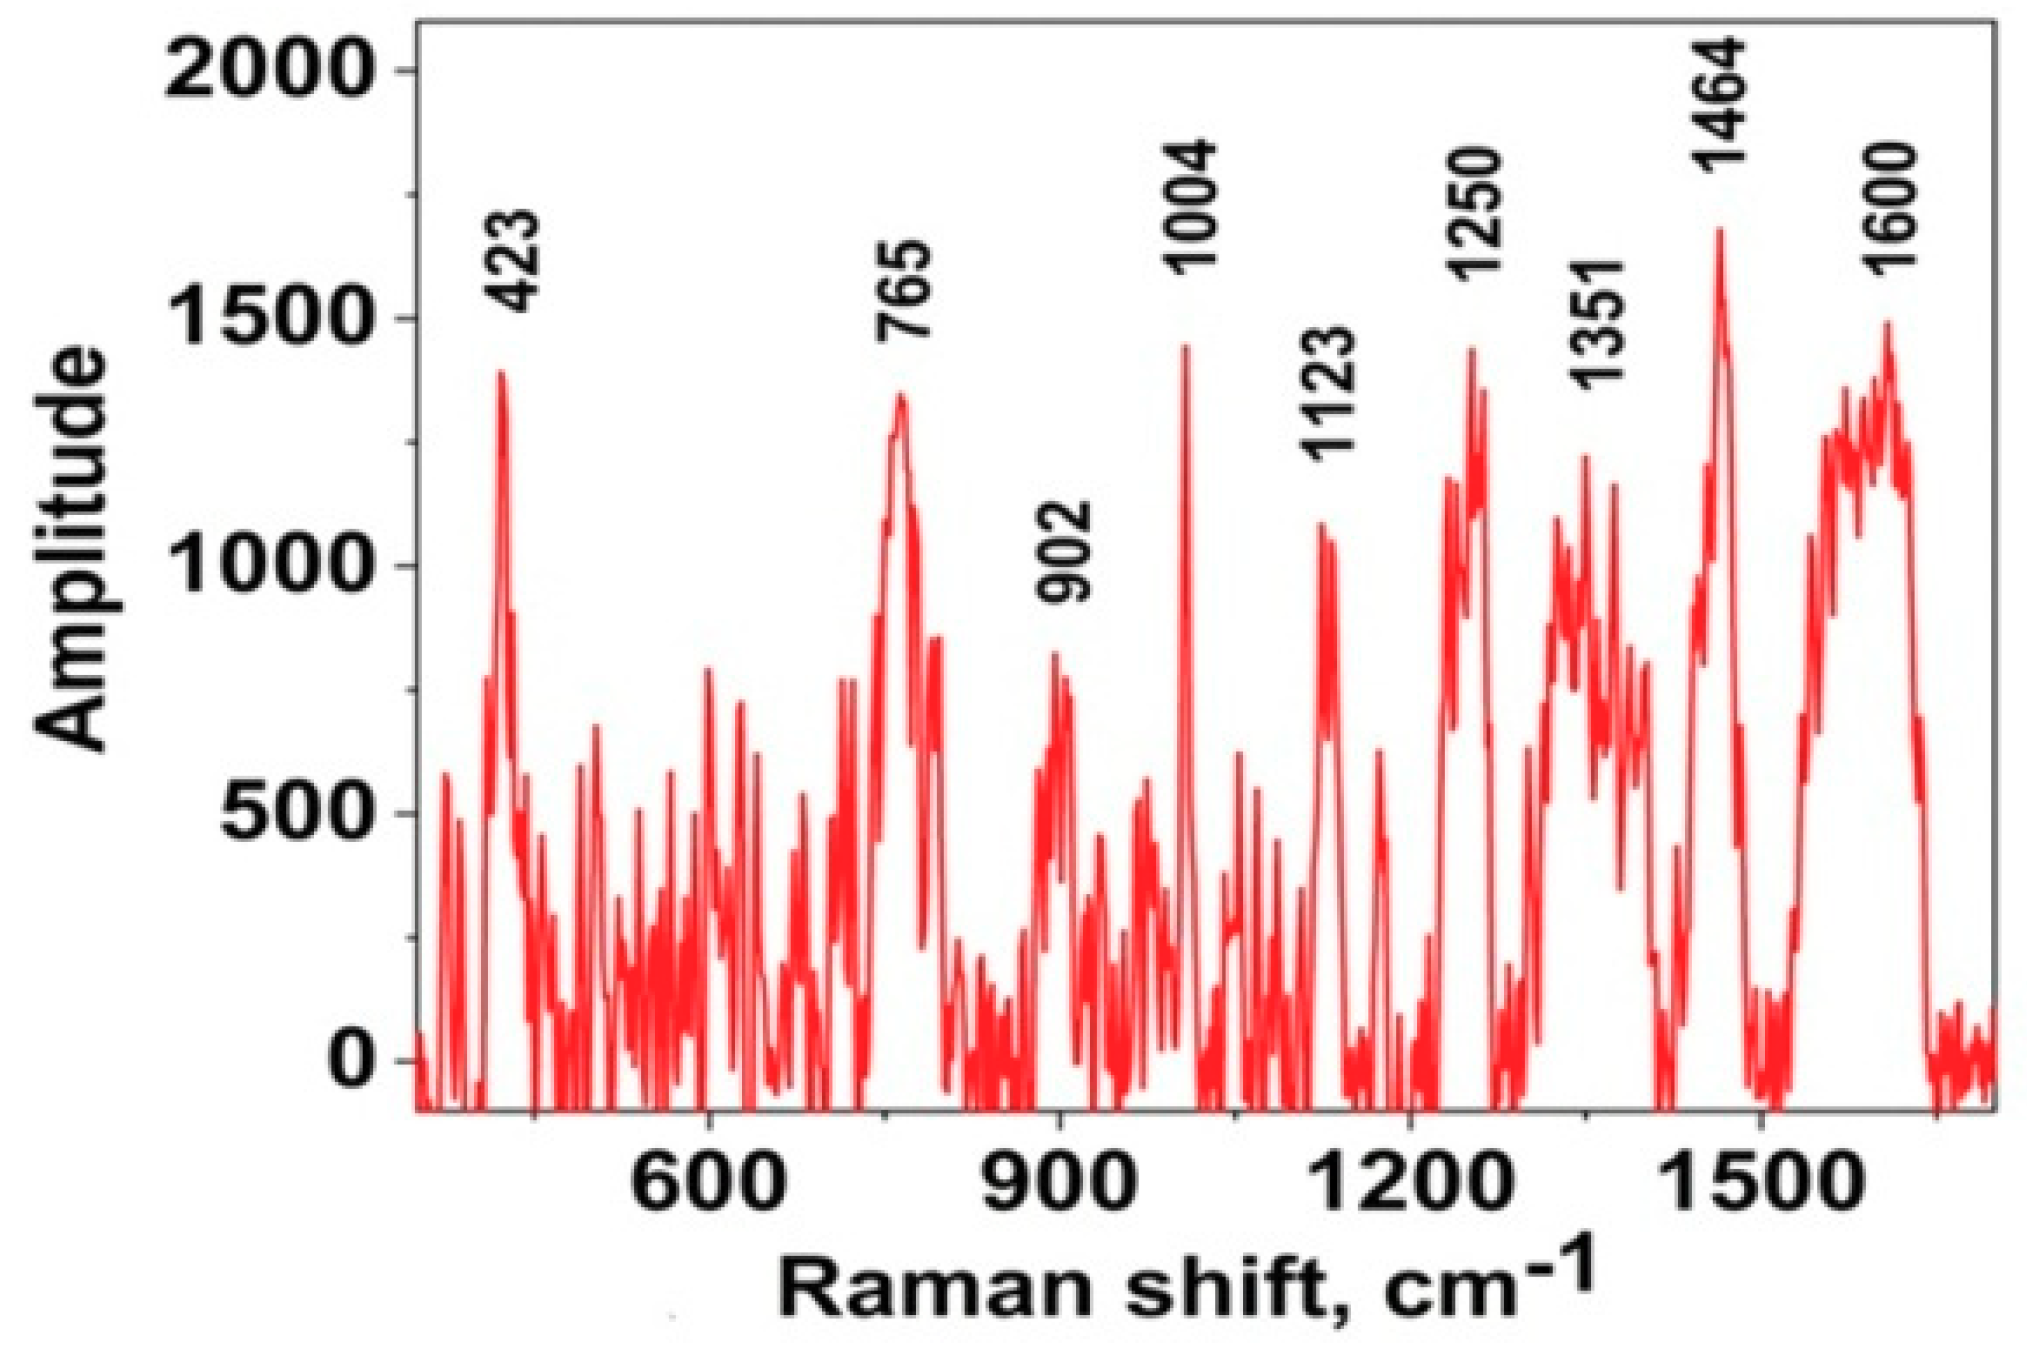
Figure 3a). The SERS spectra were obtained from myoglobin on all the types of substrates except type VII. Silver films does not have their own Raman spectrum. In all the cases, the protein spectra were reproducible and did not depend on the measurement point. Therefore, in
Figure 3b we present one typical protein spectrum with a typical amplitude. The location of the spectrum measurement is shown as the cross marker. The lines in the spectrum for ordinary air drying are decoded as follows according to the literature [
37,
48,
49,
50]. The band at 362 cm
−1 is Fe-S vibrations; 418, 525 cm
−1 is S-S vibration; 603, 627 cm
−1 is C-S vibrations; 770 cm
−1 is Trp; 856, 892 cm
−1 is Tyr; 927 cm
−1 is α-helix; 1052 cm
−1 is Phe; 1131 cm
−1 is ν (C - N); 1252 cm
−1 is Amide III; 1229 cm
−1 is α-helix, Amide III; 1352, 1391 cm
−1 is Heme; 1441, 1467, 1607 cm
−1 is δ (CH
x).
We observed slight shifts in vibration bands, for example, at 1052 cm
−1 instead of 1004 cm
−1 which are associated with the conformation of a protein molecule while it interacts with the surface of silver films after drying, since the degrees of freedom of the molecule change as a result of electrostatic forces in solution. The phenylalanine band position was calculated theoretically earlier [
46], in our experiments we observed the existence of three possible bands, which could be an indication of its oscillation. The band at 1004 cm
−1 is most often manifested in the spectra, but in our case it gives the band at 1052 cm
−1.
Comparative analysis of the spectra lines amplitudes showed that the effective amplitude of the obtained Raman signal was increased relative to the control sample in all the cases, but for the best sample up to 10
5 times amplification was observed. A possible amplification mechanism could be described by theoretically predicted amplification values for rough films with sinusoidal roughness [
35]. From the other hand, it could the result of the local field enhancement [
19] in borehole of pore-like surface structures (see
Figure 1f,g). The size of such pores is much smaller than the spectral volume of the microscope. We believe, that we experimentally observed the effective composite amplification as a result of combined action of these two mechanisms.
Table 1 summarized the characteristic intensities of the myoglobin Raman signal for all the types of SERS substrates. The type of substrates V demonstrate the maximum amplification, we have discussed the possible reasons (with the direct link to substrate surface morphology) in the next section.
Enhancement factor (EF) for each substrate was calculated as the intensity ratio between amplitude of spectrum from silver substrate and control spectrum from aluminum substrate. Calculation results are presented in
Table 1. All spectra were measured from protein objects of the same size.
3.3. Studies of the Effect of Morphology on the Amplitude of the Raman Scattering Signal of Myoglobin
We demonstrated that Raman signal amplification depends dramatically on the silver SERS-active substrates surface morphology. In order to adequately link the film surface distinctive features and the signal amplification, it is necessary to choose the most significant film surface parameters. We used the Gwyddion software and masking mode to perform film surface feature parameters analysis based on AFM images. An important averaged parameter characterizing the surface is a root-mean-square roughness (Rq) of the films, which reflects the degree of surface coverage with defects (or pores) and describes the surface perfection at macro level.
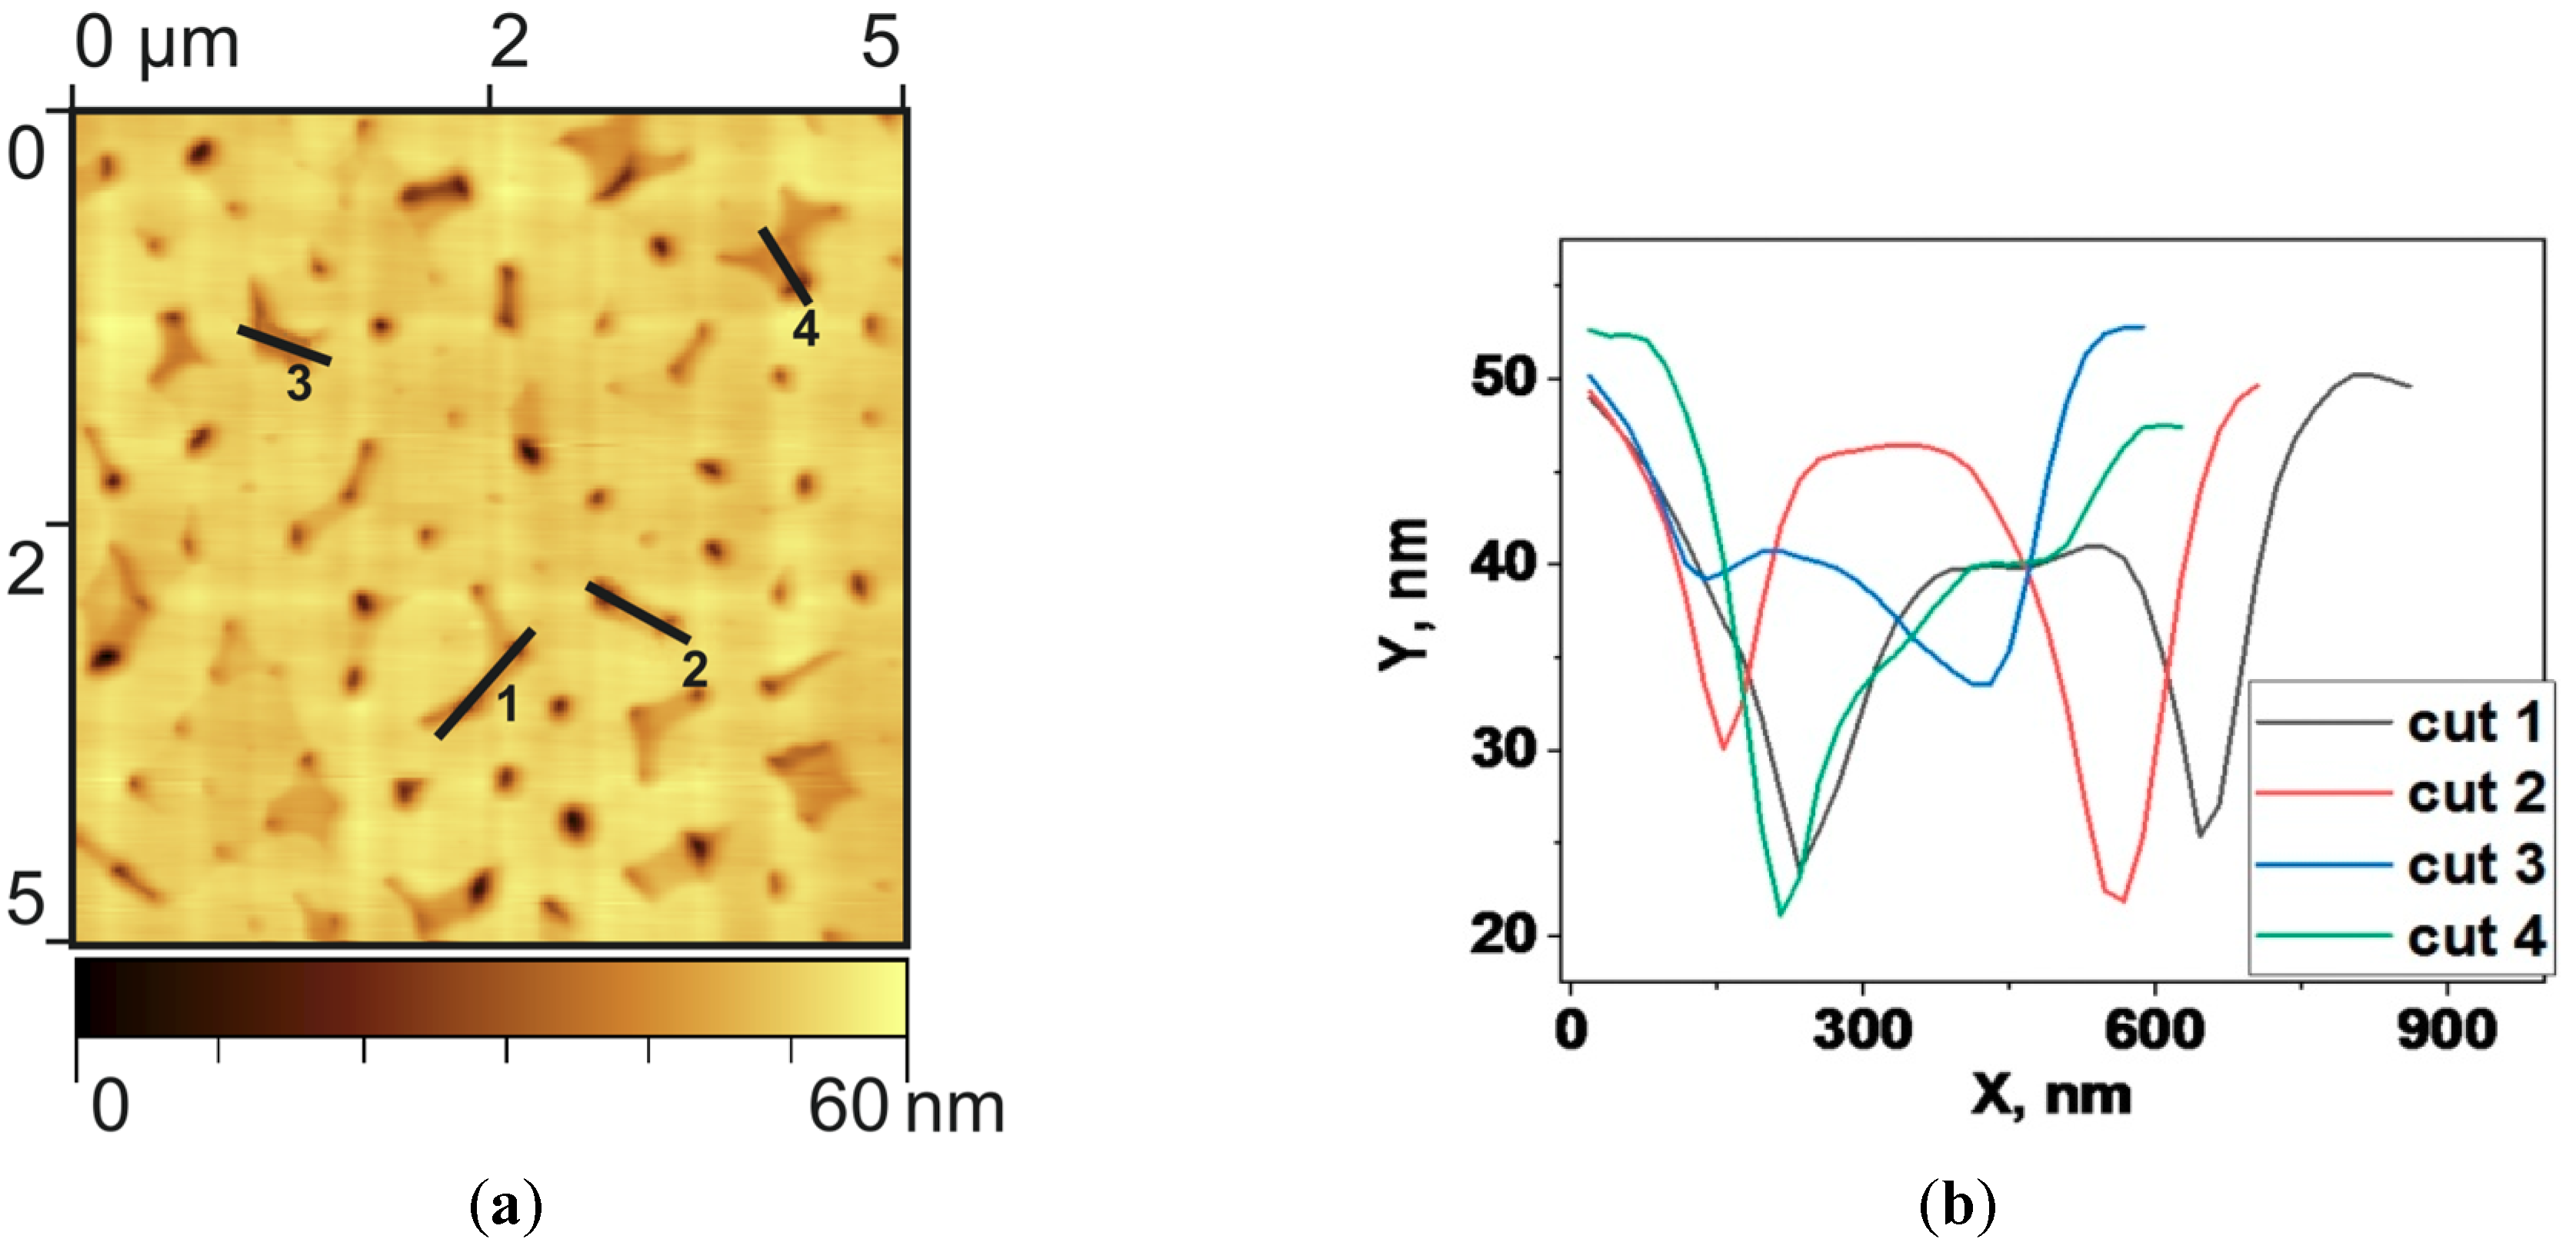
Figure 4 shows detailed image of the microstructure of pore-like structures for the sample type V, which corresponds to one of the largest Raman spectra amplification.
Despite the general macroscopic smoothness of the film, one can notice, that locally the size of frequently encountered pores of complex shapes reaches up to 30 nm in depth. The analysis showed that the effective size of the pores (microstructure defects) is 127 nm, the average surface area occupied by these defects equal to 12.5%. The average number of defects in a 10 × 10 μm area is around 250. Calculations showed that the root-mean-square roughness of films of this type is about 5 nm. The kurtosis parameter (Rku), which describes the degree of defects sharpness, is equal to 16.5 for the presented film, in contrast to smooth regular films where it is less than 3. The degree of local heterogeneity of the film is estimated by R3z parameter, which is the vertical mean from the third highest peak to the third lowest valley in a sample length over the evaluation length, equals to 13.2 nm. The average maximum profile height Rz was 9.7 nm. Another two parameters describe the profile of the film cross-section at the macro level: mean square waviness (Wq) equal to 57.5 nm that shows the amplitude of the harmonic envelope and the profile of the curve. And the root-mean-square wavelength of the profile (λa) equals to 590 nm, that shows the envelope wavelength. We have chosen this set of parameters in combination with the measured Raman spectra to determine the optimal surface morphology for high-quality SERS-active substrate nanoengineering.
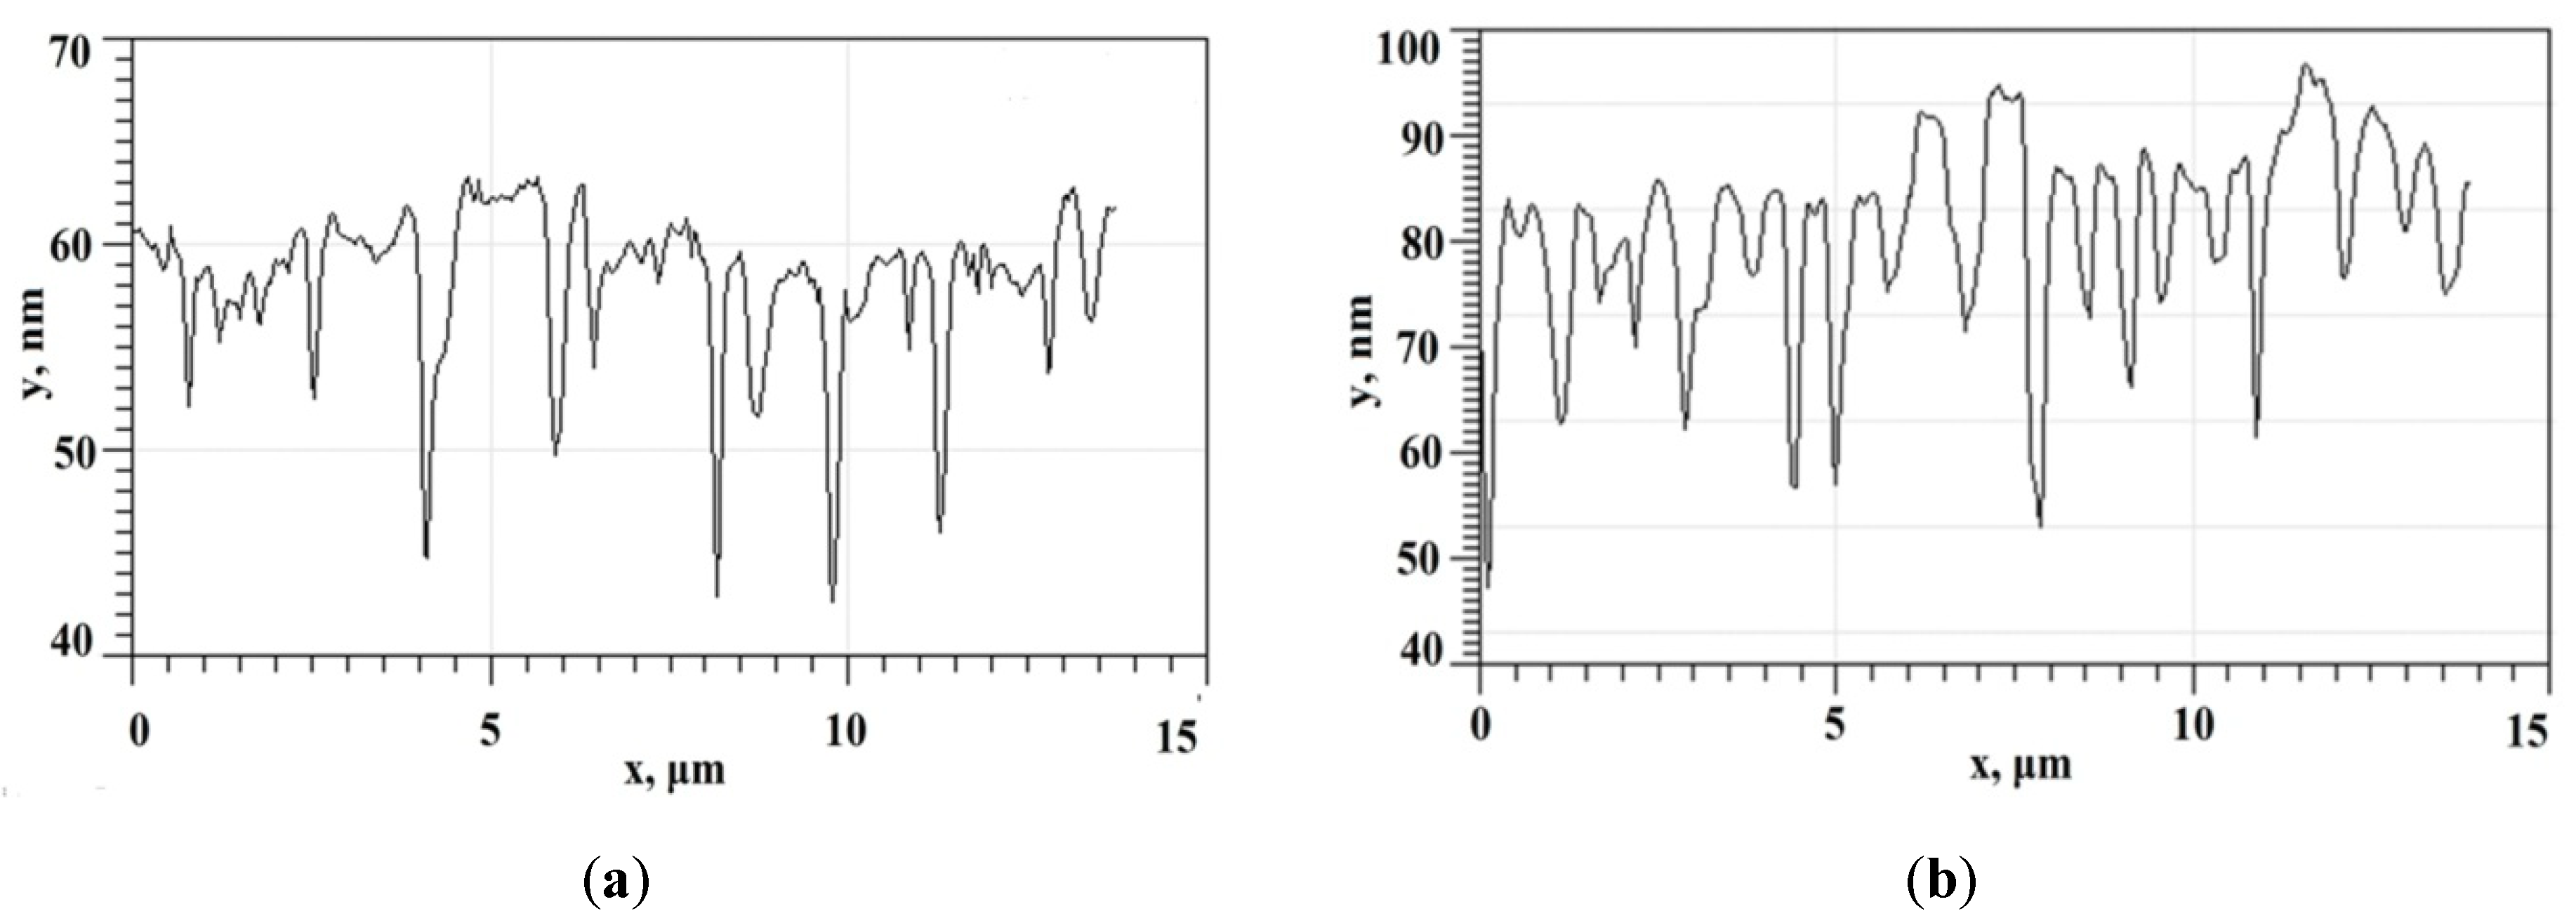
Structures of alike morphology with the sample type V (see its cross section on
Figure 5a), but with slightly modified surface pore-like structures parameters (
Figure 5b shows cross section of the sample type VI), demonstrate a decrease in the Raman signal amplification. With such a huge number of surface quality parameters, it is naturally difficult to recover the link function between surface parameters, deposition recipe and Raman signal amplification. That is why in the next sections we used machine learning techniques for data treatment to engineer high-effective SERS-active substrates.
The sample type VI parameters are: the mean square roughness (Rq) is 7.4 nm, the R3z is 29.0 nm, the kurtosis (Rku) is 3.9, the mean square waviness (Wq) 81.7 nm, the average wavelength of the profile (λa) is 680 nm. One could notice that increased kurtosis and root-mean-square roughness values with approximately the same valley level lead to decreased Raman signal amplification. In general, with increasing pores number we see a deterioration of its Raman signal amplification. It could be noticed for this sample (type VI) with the increased area of pores, their number and effective size, the amplitude of the protein spectrum decreased up to several times (
Figure 6). Apparently, this type of morphology negatively effects on protein adhesion to substrate surface and worsens the substrate-protein bond. A typical spectrum of myoglobin on such substrate is shown in
Figure 6.
It can be seen from
Figure 6, that for this type of substrate the myoglobin Raman spectrum efficiency is noticeably reduced in comparison with the previously demonstrated results. However, it should be noted that in this case the band at 1004 cm
−1 is not shifted and remains in its traditional place. Therefore, the influence of the substrate on the conformation of a protein molecule may differ significantly. This result is reproducible over the entire area of the protein spot on the surface in this experiment.
Table 2 summarizes the experimental analysis of the surface morphology for all the SERS-active substrate types.
The results of myoglobin spectrum measurements on a structure based on a thin silver film on a thick aluminum layer (type VII structure) showed the absence of the Raman spectra of the protein.
3.4. Data Processing using Machine Learning Methods
The following sequence of characterization methods was used to achieve robust results during the engineering process: data preparation, choosing of the base characterization method, convolutional neural networks (CNN) based autoencoding, convolutional autoencoding, feature engineering, and final comparison.
3.4.1. Data Preparation
For accuracy of the experiment, the data consisted of AFM-scans of substrates and was brought to a unified format by means of standard methods, which are used in the field of atomic force microscopy (AFM). The following procedures were carried out consistently: shifting of the mean value to zero, normalization by the standard deviation, polynomial background subtraction, rows alignment, defects corrections.
3.4.2. Baseline Characterization Method
We chose a strategy based on statistical surface values as a basic characterization method. These values are: mean roughness, mean square roughness Rq, kurtosis Rku, and depth depression R3z. Following the calculation of these values for each sample, they were tested for clustering quality. Clustering was provided by the K-means method [
51]. Basic characteristics were used as the features to study for an unsupervised algorithm (K-means). As the result every AFM array became an object with four features. Elbow method [
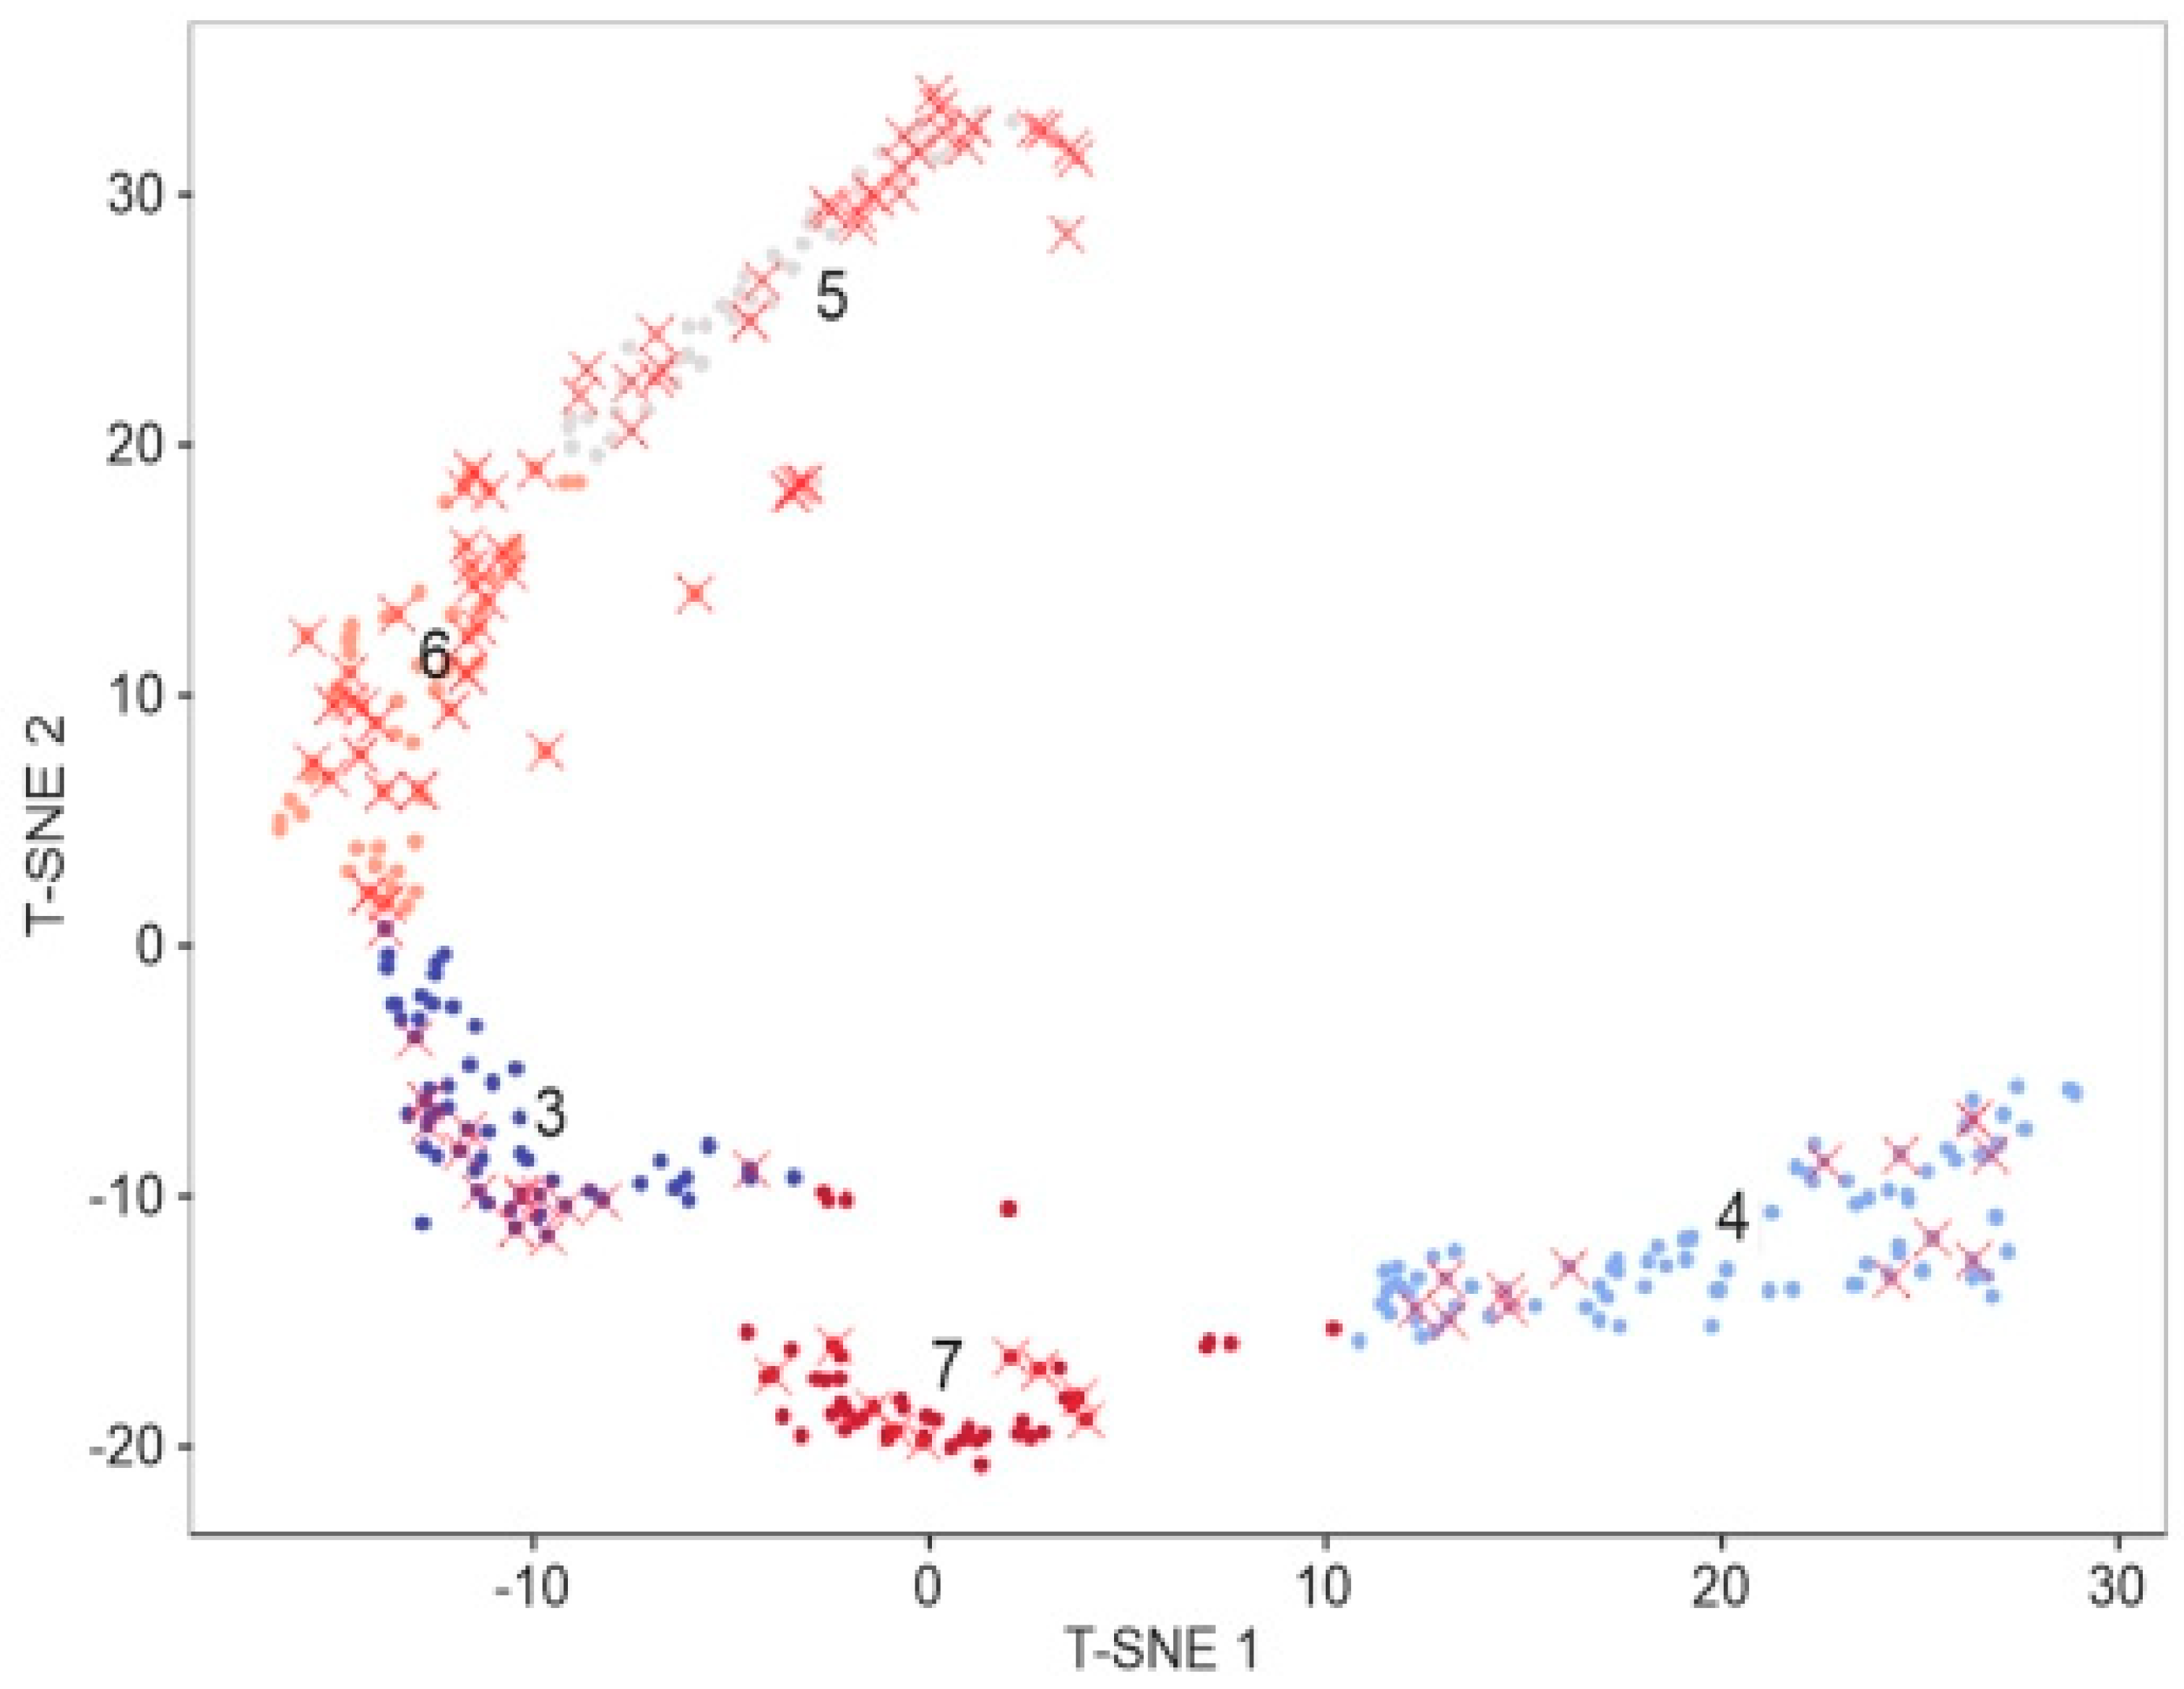
52] was used to identify the optimal number of clusters for the algorithm. In Elbow method the clusterization is given for a few amounts of clusters (N) and for each N we calculated the total divergence of clusters. The optimal number of clusters is the amount when there is a sharp decrease in the rate of fall of the total dispersion. Clustering was provided in the initial 4D space. As a result, five following clusters were obtained. Then, the dimension was reduced to 2 using T-distributed stochastic neighbor embedding method (T-SNE) [
53] for the purpose of visualization (
Figure 7). The clusters obtained were tested for compliance with the groups of substrates with surface enhancement of Raman spectra to assess the representativeness of the features used for characterization. Such type of substrates is red X marked.
The results showed that 70% of SERS-active substrates distribution is concentrated in clusters 3 and 4. Due to high variation of AFM-features during manufacturing, that is not enough for building of a robust engineering process. That is why it was decided to use more sophisticated methods, such as convolutional neural networks (CNN).
3.4.3. Neural Characterization Strategy
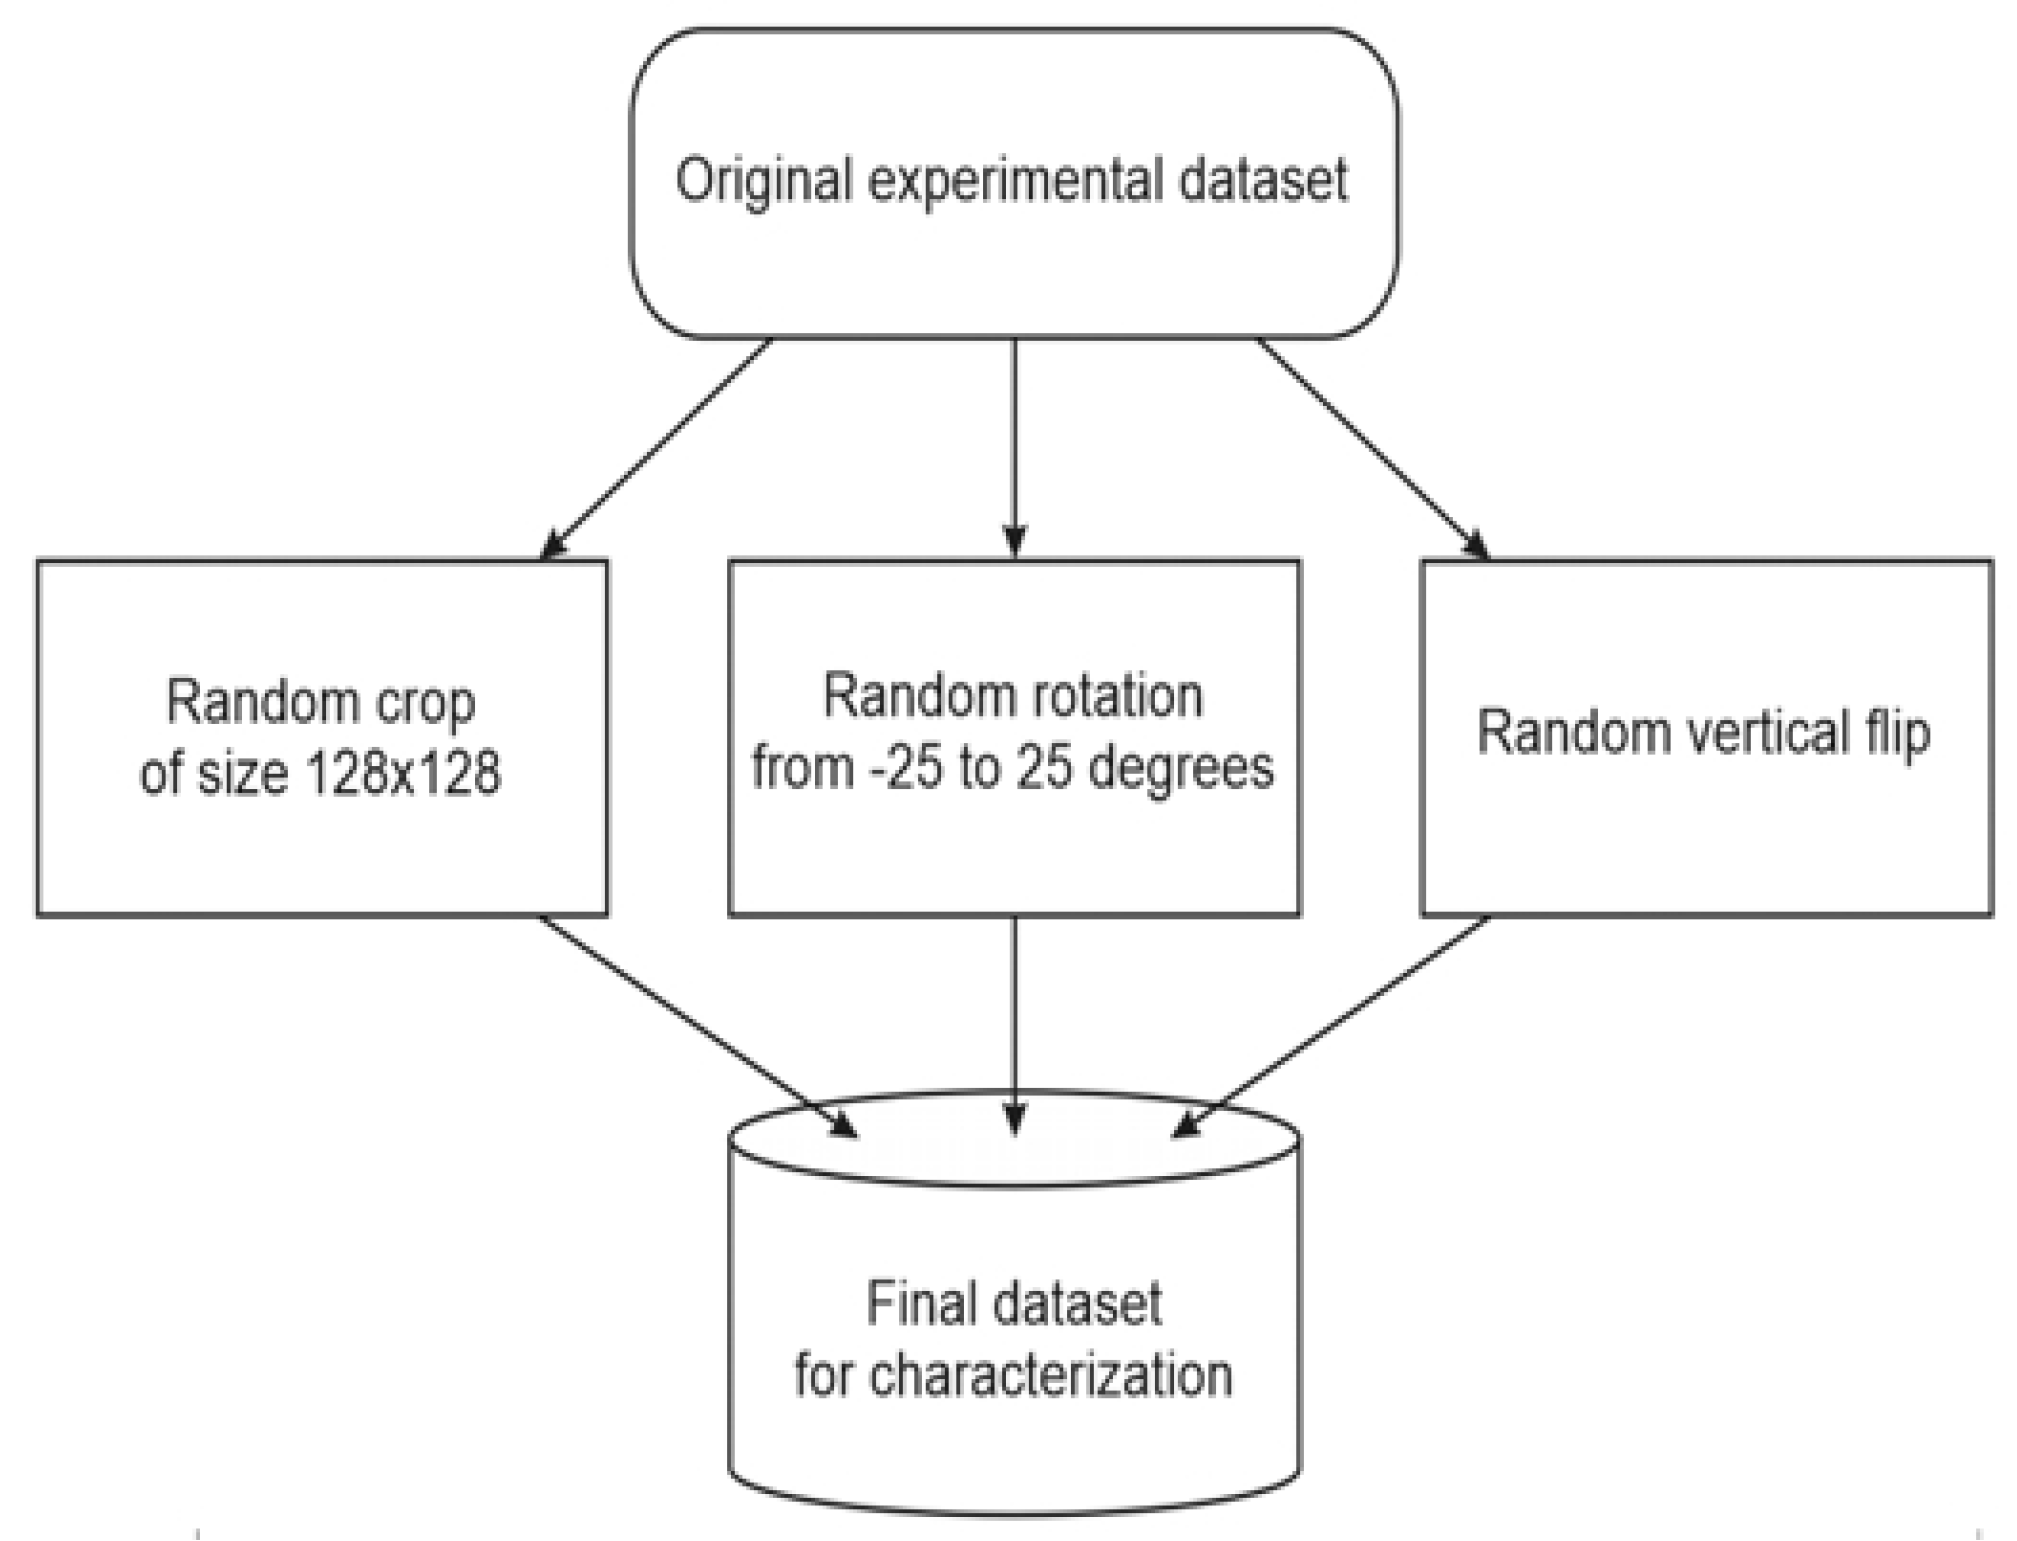
With account of the unsupervised nature of the problem, the CNN-based autoencoder was chosen for extracting hidden features from image arrays. Random-crop, random-rotation, and random vertical flip were applied simultaneously to generate a dataset of images from an available experimental data. Ten thousand samples of 64 × 64 pixels were isolated from the whole dataset of 919 grayscale AFM-scans of 256 × 256 pixels. The diagram of that process is shown below (
Figure 8). So significant augmentation is reasoned by the transformations applied (rotation, flip, random selection).
From 10 to 11 objects (sites) were generated from each experimental sample. Each sample was then normalized by subtracting its mean value and dividing by standard deviation. Such a method was used to obtain enough data for convolutional autoencoder to fit the inner structure of substrates. By implementation of this procedure 10,000 sites were available. Approximately 6000 of them were used for training of the neural network, 2000 were used for validation of the model, and 2000 for the test. Learning and testing were performed on different experimental samples.
3.4.4. Convolutional Autoencoder
A neural network consisted of alternating layers, Conv2D [
54] and Max-pooling [
55]. Binary cross-entropy was chosen as a loss function [
56]. Training was performed on a batch size of 196 samples with a total number of 150 epochs and cross-validation at the end of each epoch—the same image was used as an input and as a target. During the training process, the model learned to reconstruct the initial image as accurate as possible. During the reconstruction process, the image passed through each layer with a successive decrease in dimension (encoder layers) to reach the middle layer of the autoencoder. These transformations were held on the convolutional and max-pooling layers. Then, to restore the initial dimensions, the image passed through the convolution and upsampling layers (decoder). Example of an input and an output is shown in
Figure 9.
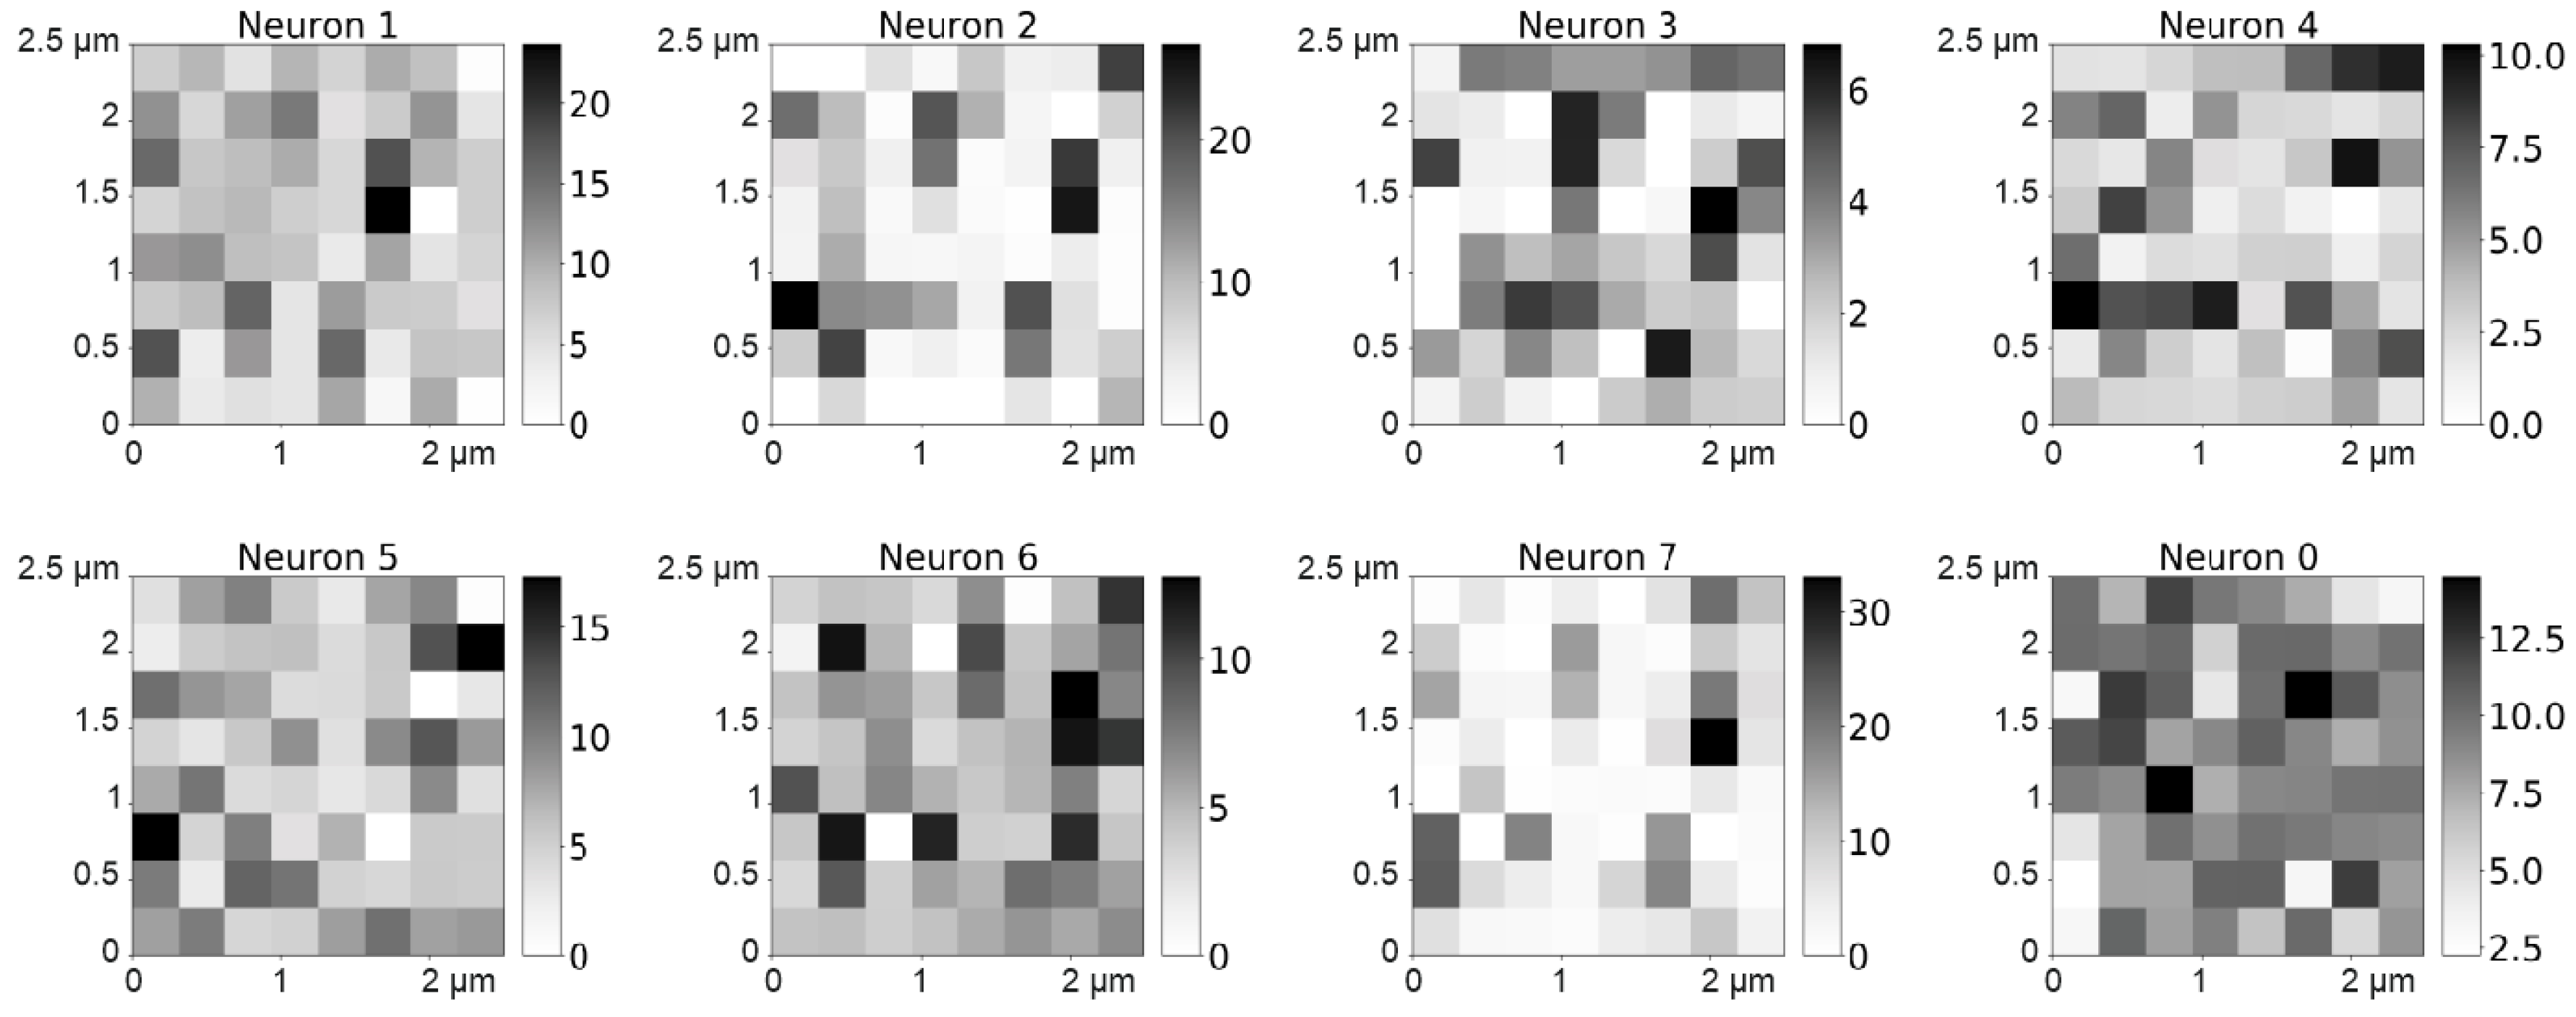
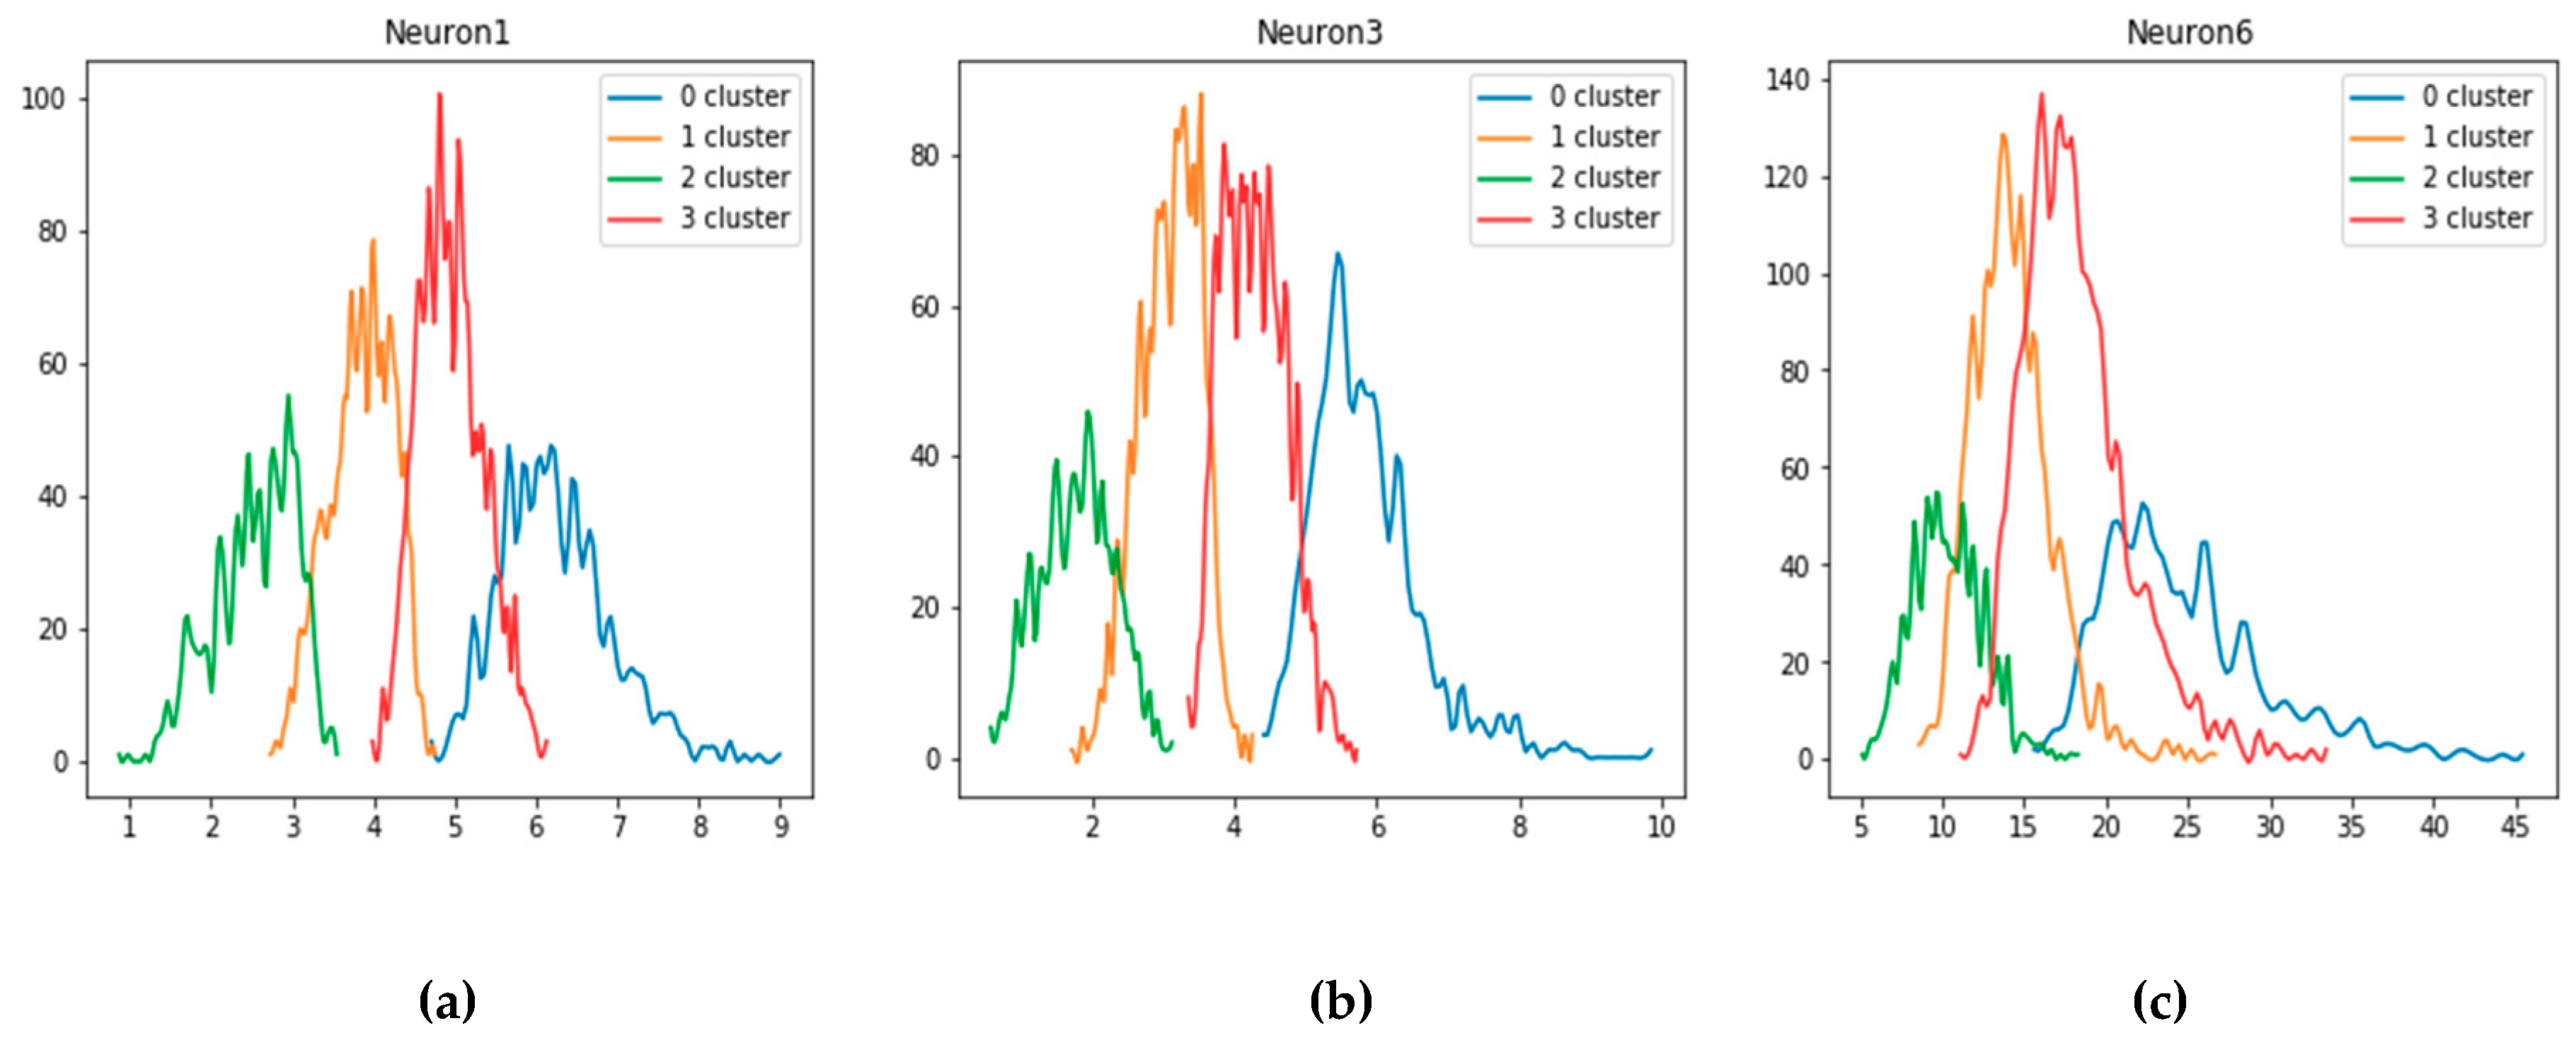
Since there were eight neurons in the middle layer, the output would be eight different sets of parameters. If the input data had a pattern, for example, the substrate might consist of several areas with low amplitude arranged in a line; a neural network would learn this fact and encode it in a more compact form. It allowed us to explore the extracted dependencies corresponding to different experimental parameters of the surface. For example, surfaces with low mean roughness corresponded to a more steady distribution of the analyte and a less distinct spectrum. Examples of codes are shown in
Figure 10.
3.4.5. Feature Engineering
The trained inner layers consist of 8 neurons, each of which has 64 values. Then the average, standard deviation and the maximum value are calculated for all the values of each neuron. The idea was to obtain reduced dimensional data, which is more selective to a specific substrate property due to each neuron uniqueness. The resulting dataset of 6000 images per 24 characteristics was used to train the K-means algorithm in a similar way to the basic features approach. The results showed that the content of SERS-active surfaces is 90% concentrated in two of the clusters. The optimal number of clusters was equal to four. The proposed approach made it possible to define the technological mode of formation silver-on-glass substrates with maximum spectral intensity for myoglobin.
3.4.6. Comparison
Old parameters distributions within the clusters formed by new features were plotted to compare the resolution of two characteristics sets. The obtained graphs clearly showed that the lateral areas of the distributions overlap substantially, which significantly worsened the quality of classification based on these parameters (
Figure 11).
For the features obtained using autoencoder, the optimal range of values in regard to the Raman spectrum amplification is shown on
Figure 12. The figures show the distribution of three random characteristics chosen from the whole experimental data.
Two central distributions (clusters 1 and 3) correspond to the type V and IV, which lead to spectrum amplification. Compared to the previous plot, more values are not intersected. Both feature sets are used for the development of data-driven models to make connections between extracted values and particular spectrum amplitudes. Finally, we utilized this approach for quick and precise automatic analysis of a vast number of fabricated SERS substrates, which made it possible to find optimal deposition recipe parameters for SERS-active substrates nanoengineering.
4. Conclusions
It is shown that the amplitude of Raman spectra of an air-dried protein solution strongly depends on the parameters of the surface morphology at the nanoscale level. In this paper, we demonstrated low concentration myoglobin detection down to 10 μg/mL using Raman amplified signal (at the excitation wavelength of 785 nm) from SERS-active substrates with e-beam evaporated self-assembled 100 nm-thick silver thin films on the surface of silicon (111), glass and mica substrates. We observed up to 105 times amplification (sample type IV) of the spectrum compared to 100 nm-thick aluminum thin film control sample. We demonstrated that Raman signal amplification depends dramatically on the silver SERS-active substrates surface morphology. The characteristic dimensions of surface morphology elements of considered SERS substrates were in the range from one to tens of nanometers. Using optical confocal microscopy, it was shown that the protein forms a conformation on the surface of a self-assembled silver film with a specific morphology, which makes it possible to effectively implement efficient Raman signal amplification.
The most significant surface morphology parameters the self-assembled silver films and corresponding deposition recipe parameters to obtain high-amplitude Raman spectra were identified. We suggested the set of surface morphology parameters (Rq, R3z, Rku, Wq, λa) in combination with the Raman spectra and deposition recipe (deposition rate, substrate temperature, vacuum conditions) parameters, which have to be taken into account for high-quality SERS-active substrates nanoengineering. In order to recover valuable data in reasonable time with such a huge number of parameters, which have to be optimized, we suggested using machine learning methods. Finally, we utilized this approach for quick and precise automatic analysis of a vast number of fabricated SERS substrates, which made it possible to find optimal deposition recipe parameters for SERS-active substrates nanoengineering. We found out that to provide the highest Raman signal amplification, one have to fabricate SERS-active substrates with the following surface morphology: root-mean-square surface roughness (Rq) equal to 5 nm, the height difference of the third largest peak to the third largest depression (R3z) equal to 13.2 nm, kurtosis (Rku) equal to 16.5, mean-square waviness (Wq) equal to 57.5 nm, average wavelength of the profile (λa) equal to 590 nm. Based on these requirements we developed the SERS-active substrates fabrication process based on self-assembled continuous silver films, which provides reproducible Raman signal amplification up to 105 times compared with 100nm-thick aluminum thin film control sample. It is worth noticing that proposed SERS-active substrates require no additional expensive technological operations (like e-beam lithography, dry etching, etc.), promote high-quality reproducible probe preparation using cheap in-air drying technique and provide much higher thermal conductivity compared to island-like SERS substrates leading to much higher possible excitation laser power (up to 65 mW).

 ,
, 


