1. Introduction
The dynamic global state of manufacturing industries has forced them to improve the performance of their manufacturing activities with the purpose of maintaining high-quality standards for their products at a competitive price. As a result, organizations resort to techniques, philosophies, and improvement tools that allow them to modify their production systems and achieve the desired profitability to make them sustainable [
1].
Over the last years, the increasing customization degree of products and services in the automotive industry is hindering the production planning, making supply chain and logistics issues become a real challenge [
2]. With such challenges to overcome, organizations have to find new ways to improve their production activities, making sure that the quality delivered to the customer is within certain standards and the price is competitive [
3,
4]. The automotive industry is comprised of the terminal sector and the auto parts sector. In the terminal sector, production is generally divided into light and heavy vehicles. The present study will focus on an automotive assembly company of light vehicles, specifically in the area of spare parts.
ProMéxico and the Mexican Association of the Automotive Industry (AMIA) in their 2016 annual report mention the relevance of the automotive industry as an engine of the Mexican economy’s growth.
The sector contributes more than 3% of the national Gross Domestic Product (GDP) and 18% of the manufacturing GDP, generating economic income for more than
$ 52 billion a year, and is responsible for some 900,000 direct jobs throughout the country. With these indicators, Mexico is the seventh producer and the fourth exporter of light vehicles worldwide. The Executive President of the National Auto Parts Industry of Mexico mentions that in the last five years the sector has reached record levels both in production (
$ 82 billion per year) and in exports (
$ 65 billion per year). Currently, Mexico is the sixth-largest producer in the world, and it is expected that in the coming years the country will move up some more positions. This is reflected in the more than 300 first-level suppliers (TIER 1) it has [
5].
However, despite the good figures presented, the current global competitive outlook is causing industries to face a lot of pressure from consumers to reduce costs and improve quality in order to gain market share. In this sense, the automotive plant that is the object of this study presents certain disparity with this premise in the after-sales area.
The present case study shows the complex interaction that an automotive company OEM (original equipment manufacturer) has with its leading supplier for the manufacture and shipment (national/international) of spare parts of the modules of the side panel of the door for the model Z. Delivery times can only be met when the modules arrive correctly; that is, the spare part does not have dents or scratches, and the color or decoration corresponds to the part requested by the customer. However, the company has received claims due to delays in deliveries and, therefore, customers are not satisfied with the level of service provided. On average, there are 2.13 complaints for every 100 shipments. In addition, in the process to resolve customer complaints, the delivery time increases 4 to 8 weeks depending on which market the claim comes from, because the company does not have an inventory of parts; in addition, the costs of forwarding increase, reaching amounts of almost $ 10,000 USD.
Due to the above stated, the company decided to carry out an improvement project to reduce the delivery time and improve the quality of the spare parts, and thus, improve the relationship with customers.
To overcome this challenge, Lean Manufacturing (LM) will be applied, making the delivery process more profitable. This philosophy is expected to make the process more responsive to customer demands, reducing different types of waste at the lowest possible cost [
2,
6].
Although Lean Manufacturing consists of a significant set of techniques, tools or practices, it is not always necessary to apply all of them [
7], nor in the same sequence [
8]. For this case study, only value stream mapping (VSM) and A3 report were used. VSM will allow us to get an outlook of the process, while A3 report, based on the Deming cycle, will prevent us from diverting the attention from the critical points to improve.
With this proposal, it is demonstrated that integrating the VSM (administrative/productive) tools and the A3 report proposed in the context of Lean Manufacturing allows to identify and eliminate waste in the module delivery process, reduce customer complaints, improve the level of service that is provides and also optimize the cost management.
The next section includes the literature review, in which main concepts and tools are described. Methodology is addressed in
Section 3, followed by the presentation of the case study.
Section 4 is devoted to the development of current VSM, the waste analysis and the development of future VSM. Finally, the last section provides the results and conclusions.
2. Literature Review
These days, one of the major manufacturing industries is the automotive industry. It plays an important role in different aspects, such as the development of new technologies, products, manufacturing methods, customer and financial services. It also seeks to improve its core manufacturing activities. In the 1950s, Japanese manufacturing industries struggled with shortages of financial resources, manpower resources and less availability of space. In the same period, customer demand in terms of variety, quality and service was at its peak [
9]. As a result of the situations presented, the Japanese engineers developed the Toyota Production System. To do this, they turned to master craftsmen, established the principles of standardization and included teamwork as a fundamental pillar of the system. With this new philosophy of work, Japanese engineers were prepared to respond quickly to the needs of the customers with a minimum of time and resources [
2,
9].
The term “Lean Manufacturing” or “Lean Production” was first used by Womack et al. [
10] in their historical book
The Machine That Changed the World. Lean Manufacturing shows the big differences between the Toyota Production System and the mass production system. Researchers like Womack and Jones share the idea that Lean Manufacturing is a way of thinking and living more than a technique or set of tools applied to certain situations. Therefore, when applied in the correct way, it creates a culture and philosophy within the organization, where all the hierarchical levels of the organization are involved. This type of philosophy is summed up in doing more with less [
11,
12]. Accordingly, the lean firms are defined in this way because they use fewer resources, compared to those employing traditional mass production [
10].
While the goal of lean manufacturing is clear, finding a single definition of lean manufacturing is complicated, because several authors refer to the concept from different points of view, that is, some authors address the issue only considering the performance of the process, while others approach it from a philosophical point of view and some others have the idea that it’s just a set of techniques or tools. However, no definition is wrong because it is a concept that is constantly updated and evolves according to the needs of different markets [
13,
14,
15]. Taking into account the consideration above, it follows that lean can be applied where there is waste and consequently an area of improvement, which means that its application is not restricted exclusively to certain areas of manufacture or companies engaged in the field of the manufacture of products [
12,
16].
During the last years, the fundamental pillar of Lean Manufacturing has not changed, that is, it maintains the perspective of the systematic reduction of waste with the support of all the members involved in the improvement project [
12,
16,
17,
18]. Waste is anything the customer would not be willing to pay for [
19]. Thus, any task, requirement and material that does not add value to a product or service can be considered as waste [
20]. Dr. Shigeo Shingo identified seven distinct forms of waste [
19]. These are overproduction, waiting, transport, inappropriate processing, unnecessary inventory, unnecessary motion and defects [
21,
22,
23,
24,
25]. Therefore, the existence of a large number of wastes within a process impacts one of its main metrics of lean manufacturing, which is the decrease in lead time between the customer order and the shipment of its product [
26]. Undoubtedly, the improvement of this indicator is a competitive advantage for any company over its competitors.
Within the internal manufacturing activities of any company, three types of elements can be identified: non-value adding (NVA), necessary but non-value adding (NNVA) and value-adding (VA) [
22,
27].
Considering the above stated, there are two elements that affect manufacturing activities: NVA and NNVA. Within this framework, the elements that must be identified and eliminated completely if possible are the NVA elements, because these represent waste. The NNVA elements will be those activities that may represent a waste but are necessary for a certain process. It is also necessary to indicate that there are elements that cannot be eliminated or improved immediately, because they may require a redesign of the layout, a modification of the supply chain or a combination of both. This would require good planning, as well as greater investment by the company undertaking the improvement project [
21]. Finally, the VA elements will be those that add value.
There are various tools, methods and techniques to implement lean principles to an industry; Total Productive Maintenance (TPM), Total Quality Management (TQM), Failure Mode and Effect Analysis (FMEA), 5S, Single Minute Exchange of Die (SMED), Quality Function Deployment (QFD), Cellular Layout, Pull Production System, Visual Controls, Kaizen, Kanban, Poka Yoke, Value Stream Mapping (VSM), etc. to identify and remove the waste from any procedures [
9,
28,
29,
30].
According to the aforementioned, there are a vast number of tools and techniques to be applied in the manufacturing areas, and the application of each one depends on the area of opportunity to be improved. A tool commonly applied at the beginning of an improvement project is VSM, which represents one of the first phases of any company that seeks to be lean [
30,
31].
VSM represents in a detailed manner the flow of material and information, allowing the identification of activities that add value and those that do not. Additionally, it can display the vital signs of the process as the waiting time, lead time, and the takt time [
32]. According to several authors [
33,
34], VSM is described as a technique used for the diagnosis, implementation and maintenance of a lean approach. Its main function is to identify opportunities for improvement through the elimination of waste. For García-Alcaraz et al. [
35], VSM is defined as a visual tool that allows understanding the process while identifying the different wastes. Finally, this map of the process is used as a common language for the correct communication of ideas among all those involved in the improvement project.
VSM has mainly been applied in the manufacturing industry; however, due to the versatility of the tool, it has also been applied as a Six Sigma complement. Powell et al. [
36] mentioned that many authors tend to differentiate Lean Six Sigma (LSS) from “pure” Six Sigma by first introducing fundamental lean mapping techniques such as value stream mapping (VSM). Thus, the importance of VSM is evident both for lean manufacturing and for LSS. Other fields where VSM was applied were immersive virtual reality [
29], construction industry [
33] and the development of a new drug [
37].
An additional and powerful tool to be used is the "A3 report". Based on the 13th Principle of the Toyota Way (‘‘Make Decisions Slowly by Consensus’’), the A3 Problem Solving Report is a tool that describes how consensus on complex decisions can be efficiently reached [
38]. It establishes a solid structure to implement PDCA management. It helps draw the author to a deeper understanding of the problem, and it gives insight into how to address that problem. It also facilitates cohesion and alignment within the organization as to the best course of action [
39]. In summary, its aim is to make sure you have asked the right question to truly understand the problem before you jump to implementation [
40].
There is no single format for the A3 report, because each one is used to tell a part of the story of the problem solution. These stories are composed, like any report, of a beginning, middle and end. The most common reports are the proposal story, problem-solving story and information story. However, each company can adopt a specific format and style according to their needs. In many instances, projects will begin with a proposal story to get approval to invest resources in the project, and then, as the project progresses, there will be a story of the problem-solving process, status stories at key milestones in the project and an information story to present the results [
24,
35]. In other words, A3 reports become the everyday tool through which managers analyze how to move from the current situation to a future state. Additionally, they constitute the mechanism that extends responsibility to all the people involved.
The existing literature regarding the application of VSM to the automotive industry shows that it has been applied in different ways, for example: reduction in cycle time, in work-in-process inventory, lead time, number of operators, positive impact on takt time, quantification of wastes, improvement in manpower and increase in the use of work positions [
3,
7,
9,
30,
41,
42]; however, no evidence was found where the joint application of VSM (administrative/productive) and the A3 report are applied to modify the logistics flow of a spare part and implementation of the improvement. Consequently, the added value of the product for the customer will be increased, and the costs for the automotive company will decrease.
Table 1 shows the different inconveniences that were presented in various research articles when the authors undertook an improvement project for the automotive sector. Moreover, the area of application is indicated, as well as the tools used to solve the problems.
3. Methodology
The establishment of the problem represents the starting point of this methodology. This step specifically describes the initial conditions of the improvement project.
In the second stage, the VSM was applied to map the current state of the process under study. Consequently, information was collected, and time was taken for each of the activities of the process. This stage of the process was developed with special attention because it would be the primary input of information.
The third stage was developed through a consensus of everyone involved in the improvement project. Several meetings were necessary to develop this stage due to the complexity of the process.
The Future State Map represents the vision of how the project team sees the value stream at a point in the future after the improvements have been made. After the analysis of the process at the micro-level, proposals for improvement were developed.
Finally, the A3 report was made, which allowed monitoring of the implementation of improvement activities. This report shows essential data such as the objective of the project, the current situation, and the desired situation, a matrix of assignment of responsibilities with their respective follow-up dates. It also includes the metrics regarding the project and the signatures of the project leaders.
Figure 1 shows the methodology applied in the present case study.
4. Case Study
The case study has been carried out in Mexico in an automotive plant (hereafter referred to as XYZ). Supplier names were changed for confidentiality reasons.
One of the strategies of the XYZ Company is to deploy intelligent innovations and technologies to become a world leader in customer satisfaction and quality. High customer satisfaction is one of the key requirements for the company’s long-term success. According to the aforementioned, there are some areas that need to be aligned with the strategy; in other words, they need to improve their processes. The area of improvement to be studied is the after-sales service management, focusing on the replacement parts.
Taking into account customer satisfaction, the XYZ company’s after-sales service management asked for a study to the “Quality of replacement parts” area in order to know which parts caused a greater number of claims and monetary losses, finding the modules of the door-side trim panel for the Z model. The claims, both national and international, are for erroneous deliveries, which may be due to top shoulder color, different decoration, scratches or dents, causing the customer to not be satisfied with the brand and model. Claims by the client represent 2.13% of the total shipments made while monetary losses by forwarding reached the amount of almost $ 10,000 USD and continue to rise.
Currently, the replacement part is ordered according to the Vehicle Identification Number (VIN). At the time the dealer requests it, a chain of processes begins, in which the complexity of manufacturing the product causes delivery times of up to eight weeks. Specifically, delivery takes 4 weeks for the national and American market and 8 weeks for the European market. However, if, at the time of delivery, the piece fails to meet any feature requested by the customer, such as top shoulder color or decoration, or if, during the review by the dealer, the part has dents or scratches, then the piece is rejected and the customer is informed of the new delivery date, which would take 4 or 8 weeks depending on the market. These kinds of parts are called V.I.P., which means that XYZ does not have any piece or part in stock, and when it is requested, the process of production begins. As a consequence, the after-sales image of the brand and customer satisfaction could be improved.
The measure taken by the assembler makes sense after observing the national and international market figures, which, despite going through a complicated economic situation, continue to grow.
5. Results
This section presents the results of the implementation of the methodology, showing the current state map, the identification of wastes, the development of the future state map and the proposal A3 report.
5.1. Development of the Current State Map
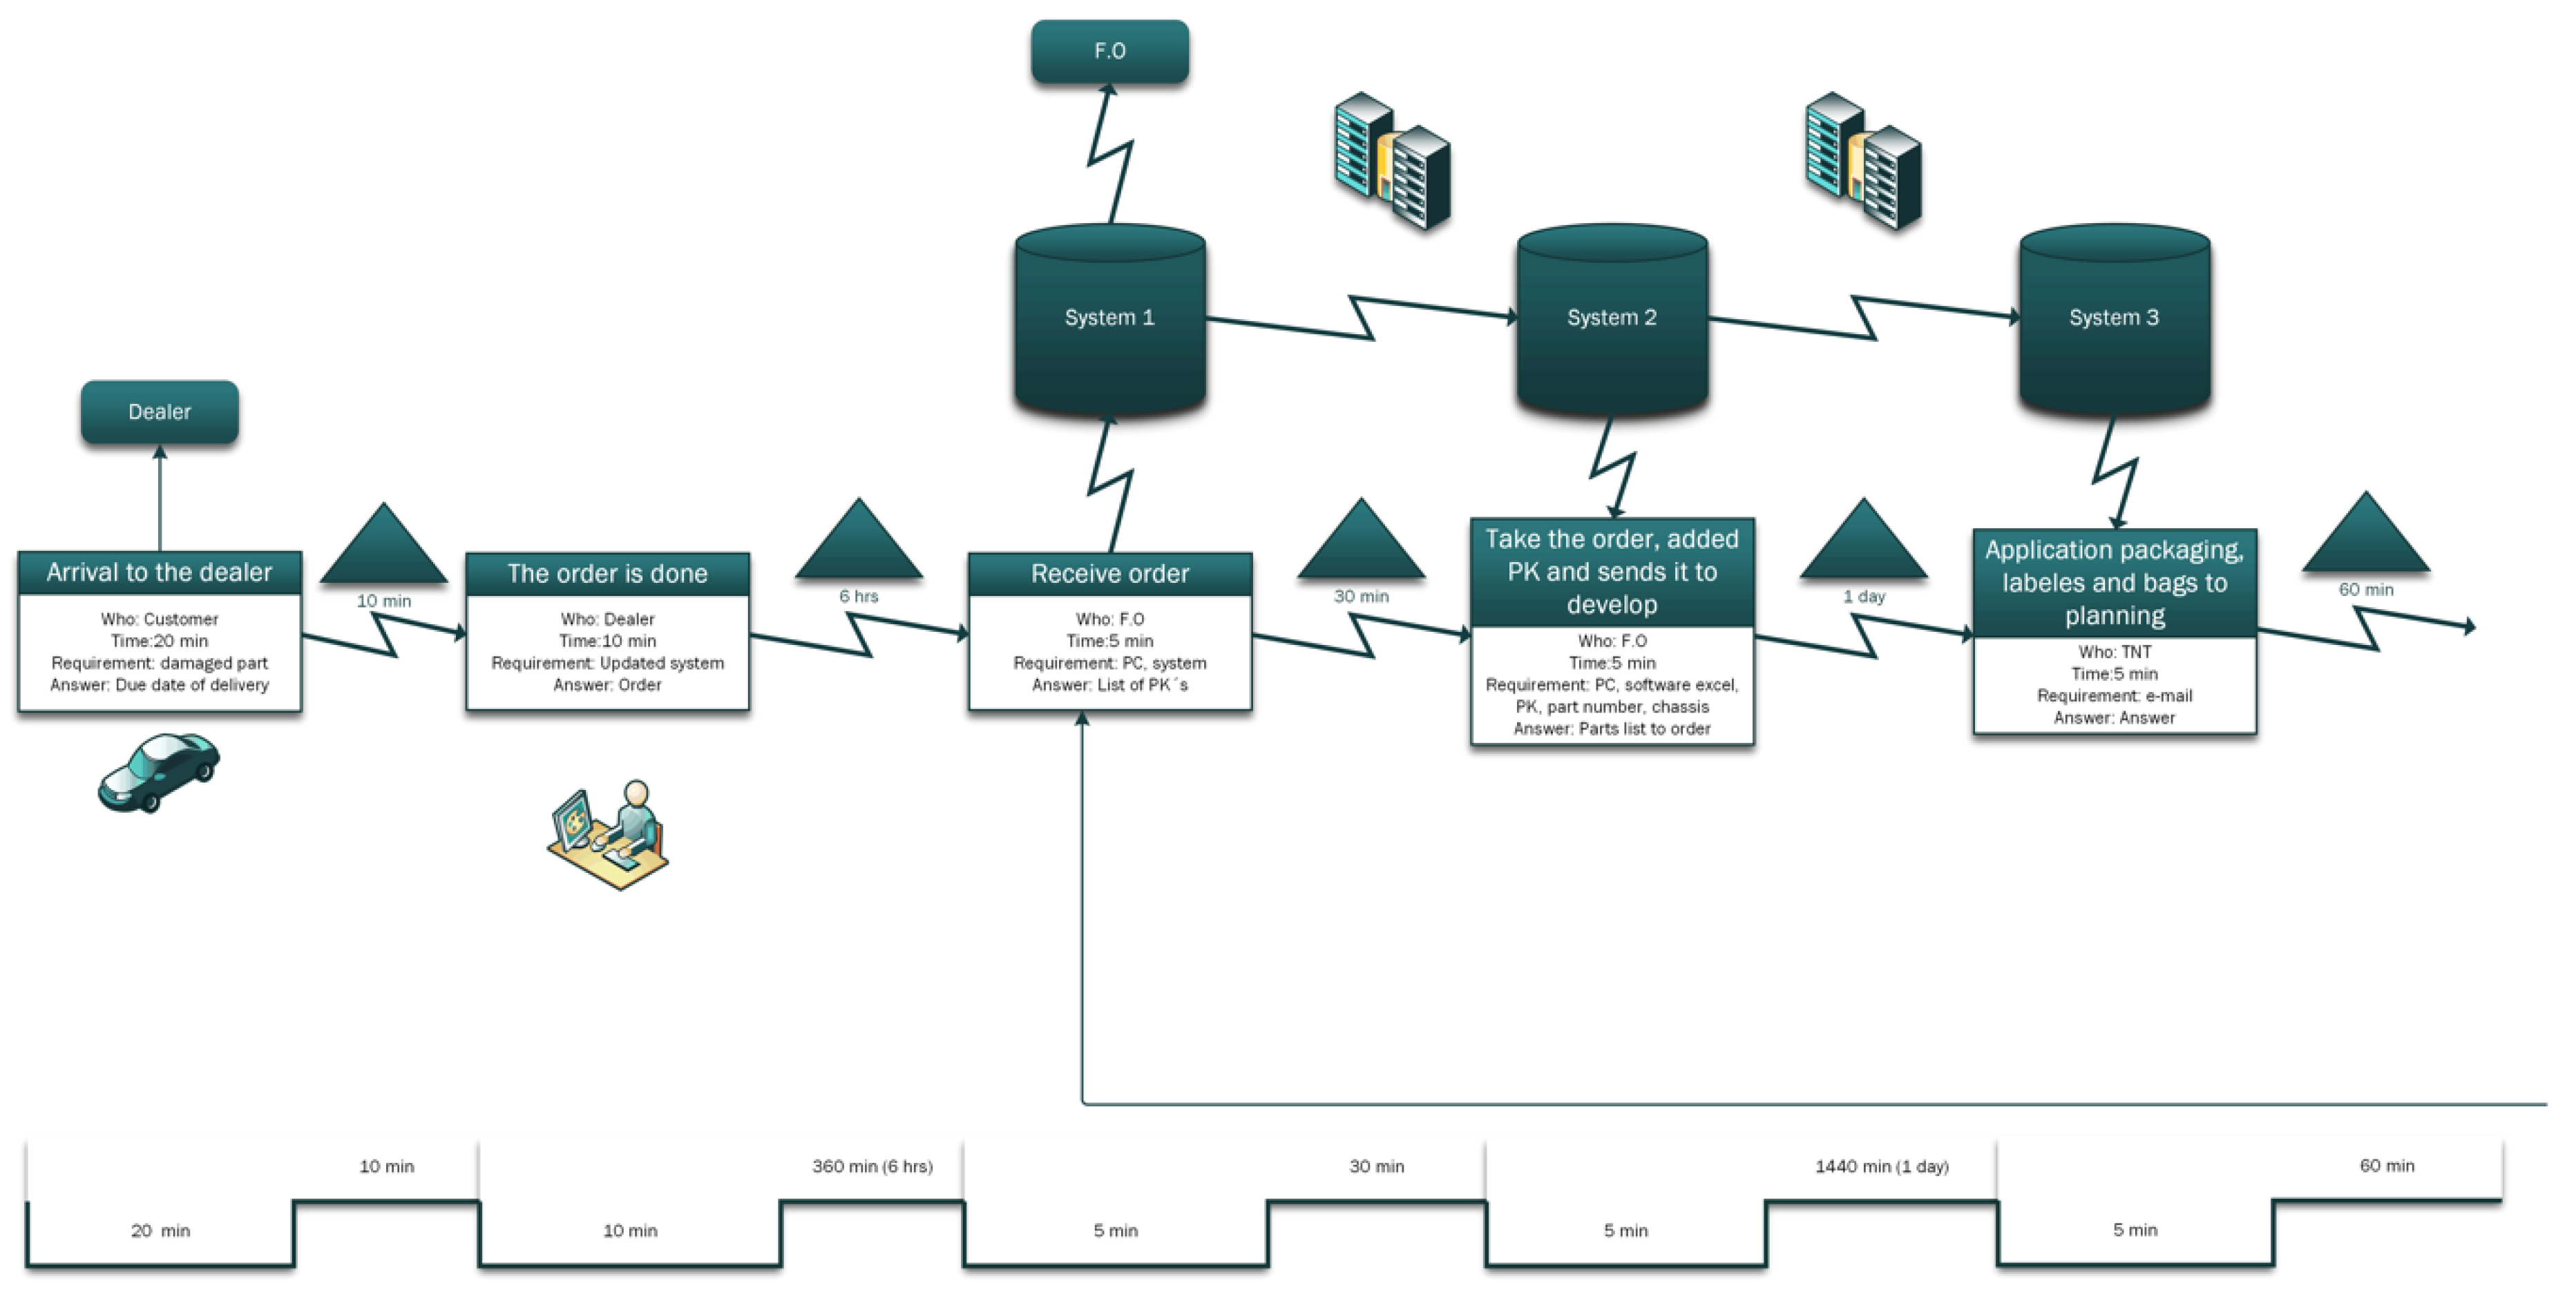
The flowchart of the current process for the delivery of the modules of the door-side trim panel for model Z is shown in
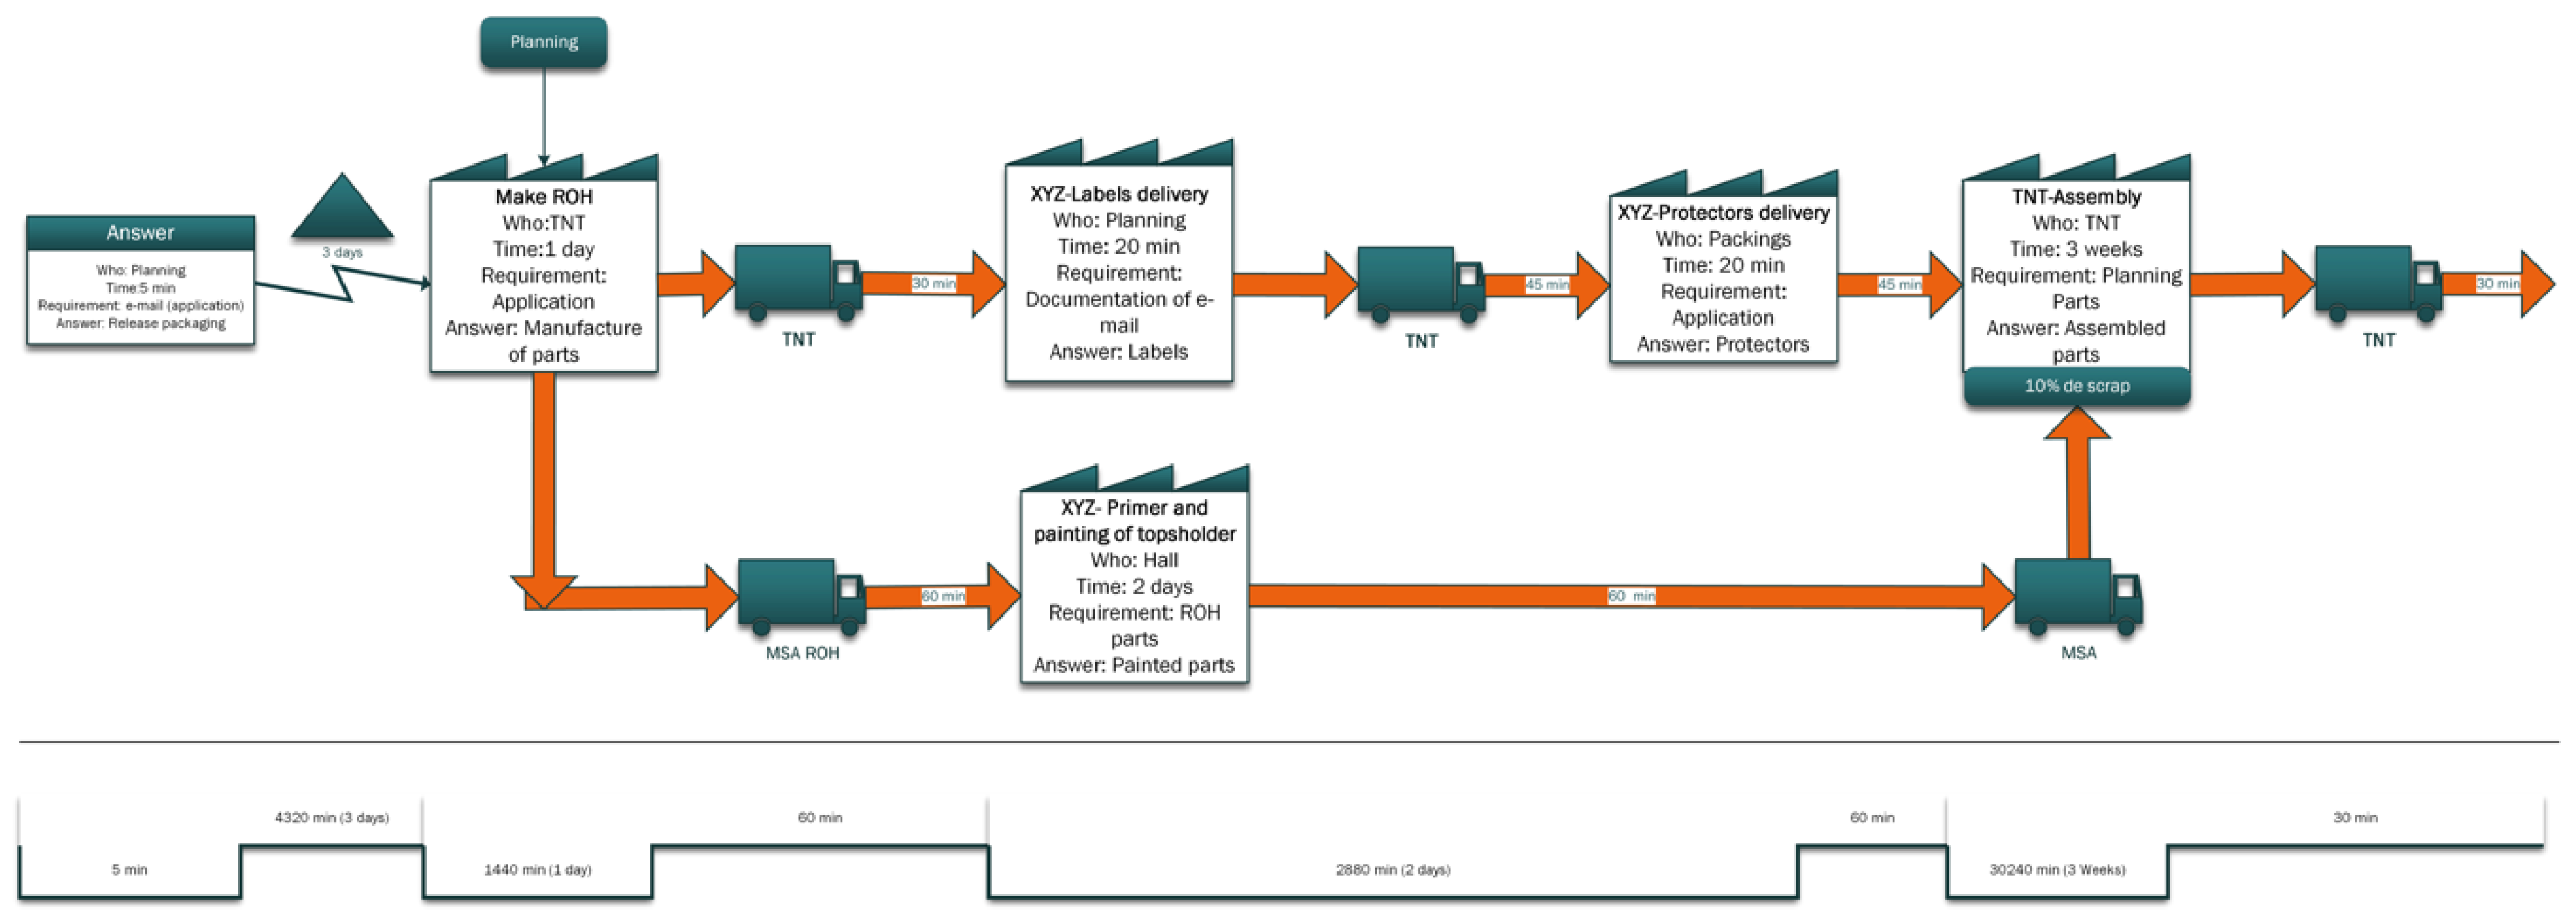
Figure 2. The XYZ Company receives the fabrication order (F.O.) from the Dealer with the part number and chassis number. Subsequently, the processing request is made to the TNT (supplier), adding the pack (PK) code, date of elaboration and model, with the corresponding information of the system 3. Then, the supplier sends the quote to the purchasing department of XYZ. The latter also generates the purchase order, which is released. TNT prepares the planning for the production of the door-side trim panel (this includes the top shoulder). Supplier MSA collects the top shoulder without painting (ROH) from supplier TNT. TNT receives the painted top shoulder and assembles them with the door-side trim panel. Additionally, TNT requests the boxes and labels to XYZ. TNT invoices the door-side trim panel and ships them to the XYZ store. Finally, XYZ performs the assignment of the destination: Europe, America or Mexico (National).
Table 2 was provided by XYZ. It shows the administrative activities that XYZ performs to supply the modules of the door-side trim panel for the Z model.
Table 1 also shows the corresponding times and costs for each administrative activity. Units of costs are not expressed for reasons of confidentiality. Each activity the TNT supplier performs was recorded. All these quantitative measures were taken, but are too confidential to be published explicitly. Despite having an initial list of activities of the process, it was decided to carry out the tour and check the data registered by the company.
In this and the subsequent section, “t” represents a factor to hide the actual amounts according to the rules of confidentiality of the company.
Value stream maps can be performed at two levels. One can be applied directly to the process map by evaluating each step of the process map as value-added or non-value added. This type of analysis has been in existence since at least the early 1980s. This is effective if the team is operating at a local level. However, if the team is at more of an enterprise level, and needs to be concerned about the flow of information as well as the flow of product or service, a higher level value stream map is needed, that is, it is similar to zooming in or out of a map [
21,
43]. The present work will combine both levels, according to the needs of the project.
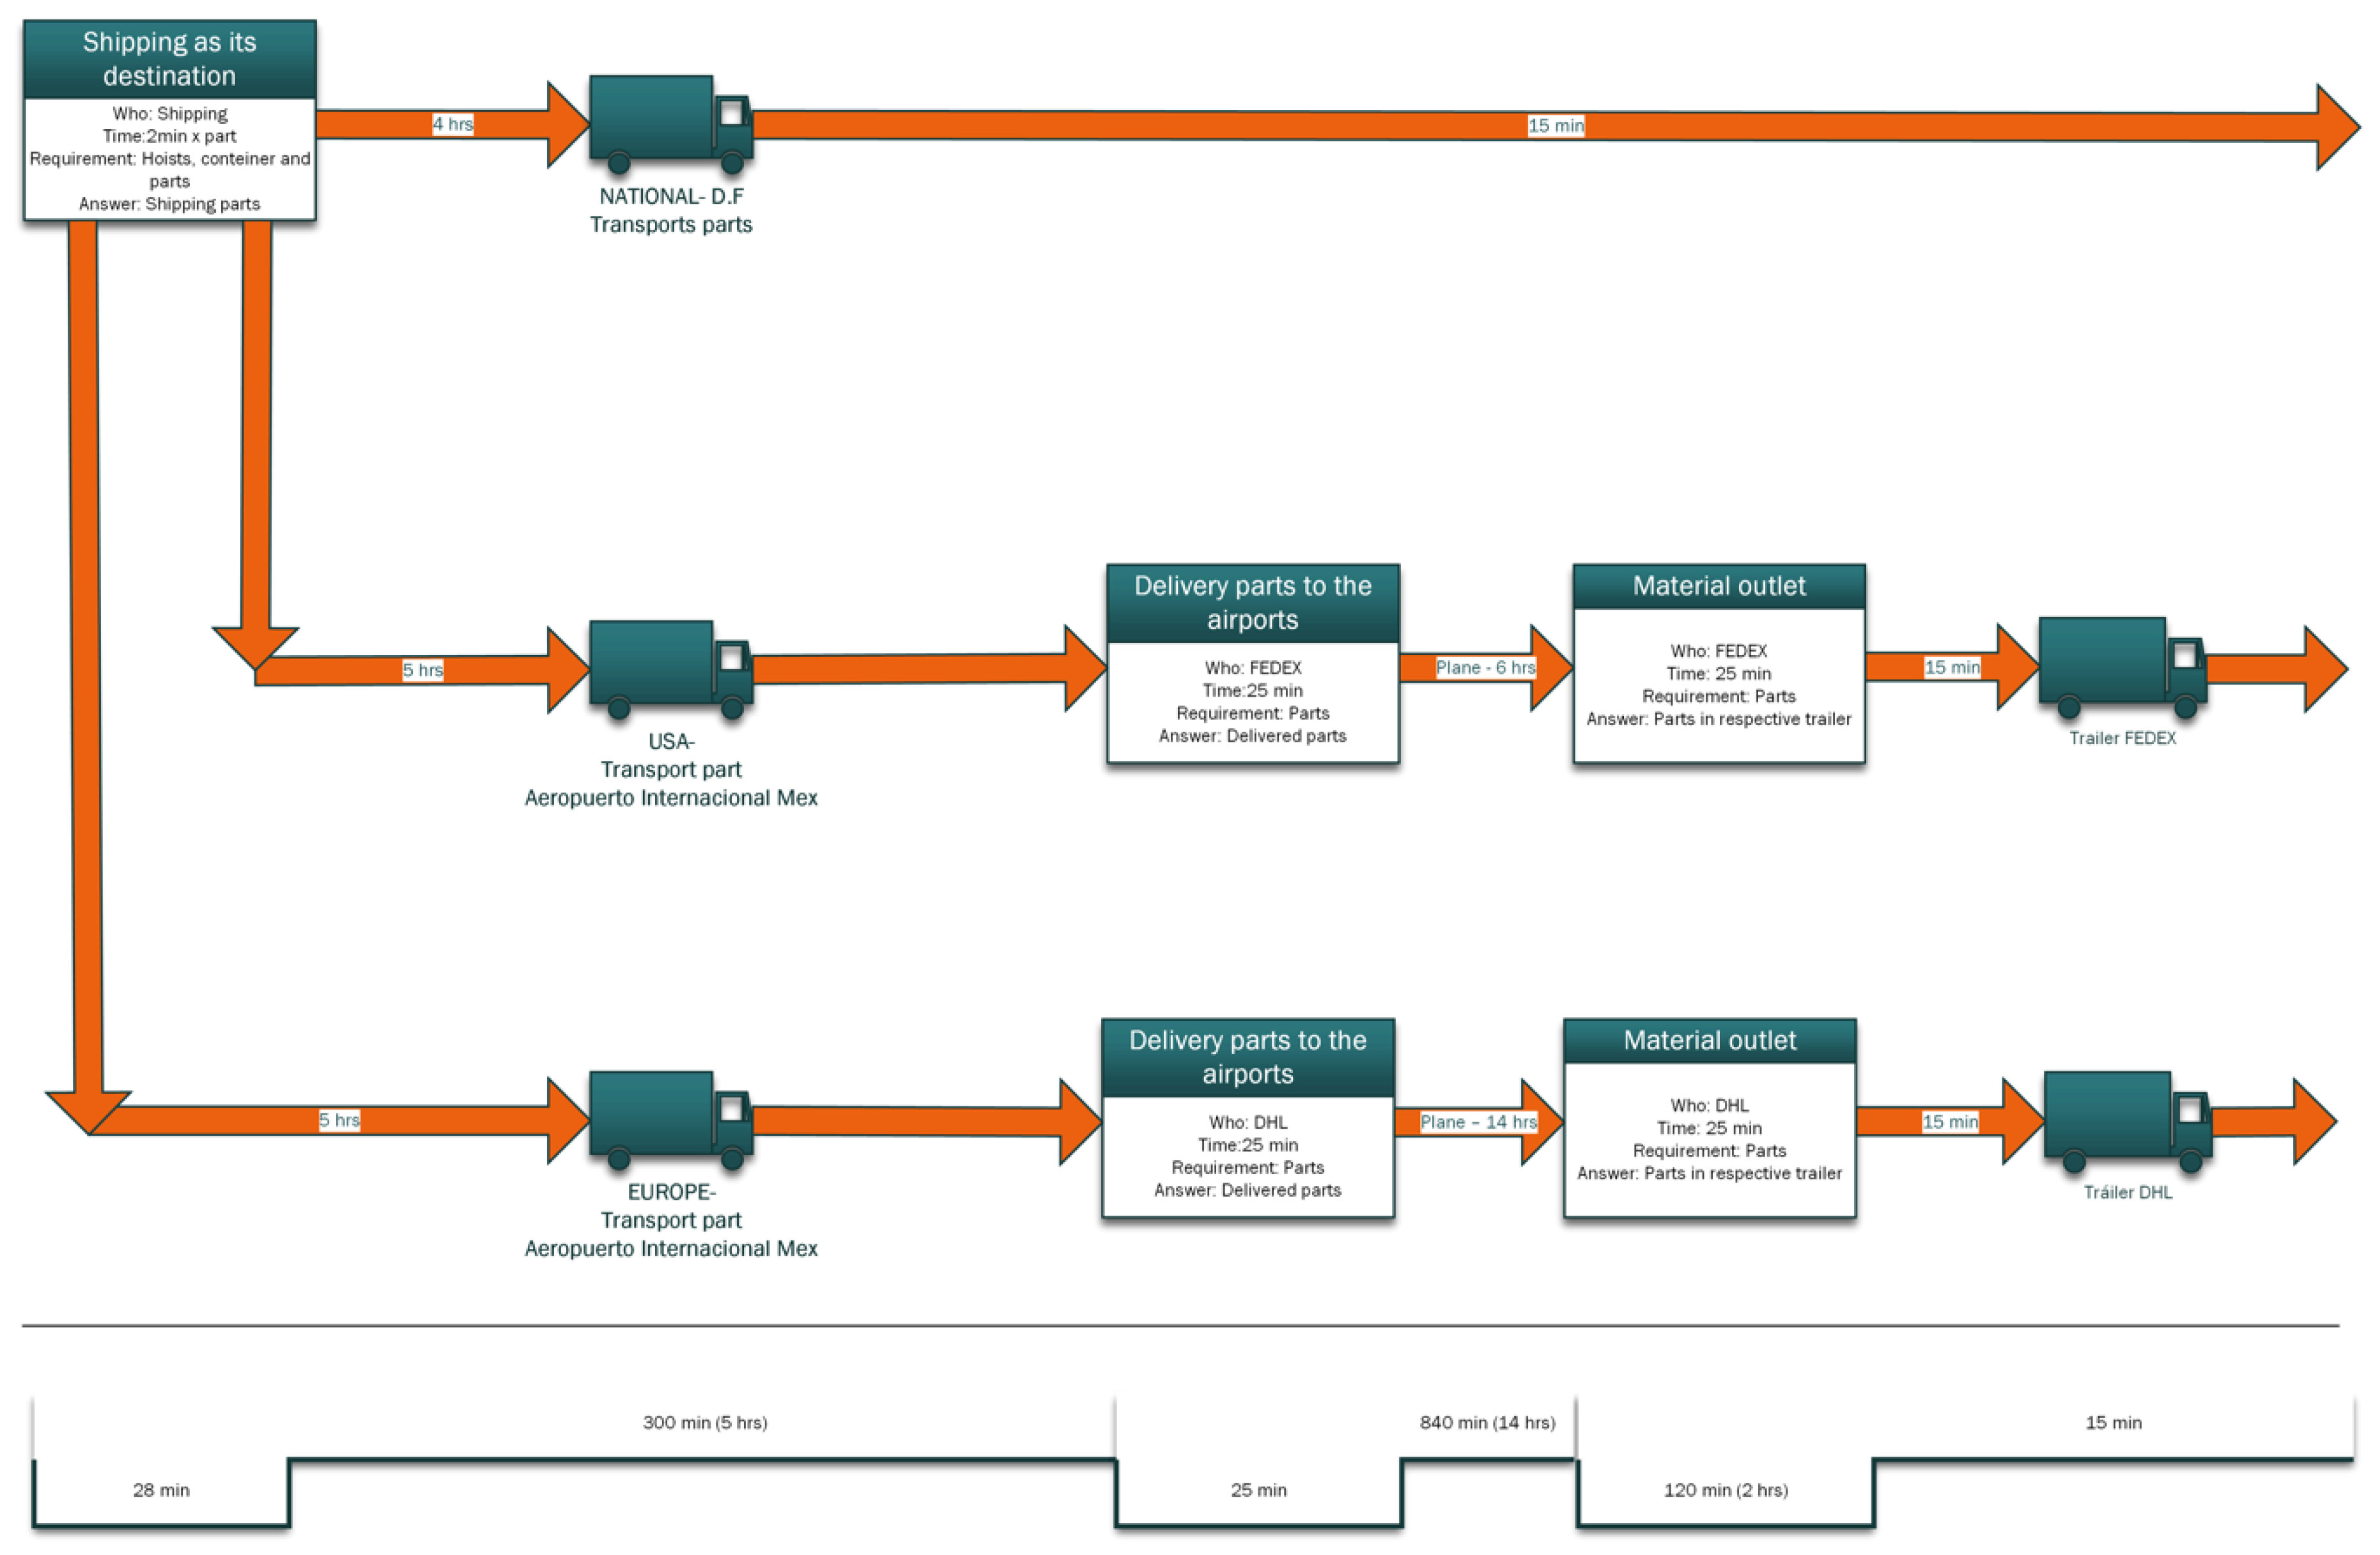
Figure 3,
Figure 4,
Figure 5,
Figure 6,
Figure 7,
Figure 8 and
Figure 9 show the current state map of the process. The activities shown are those that are invariably performed for the modules of the door-side trim the panel according to the multiple tours made. The map shows information that includes: the flow of information, systems, deliveries, wait time, process time and lead time. The current state map was also used to identify the existing problems in the process. The VSM was generated in MS Visio.
5.2. Identification of Wastes
The next step after carrying out the current state map is to identify the wastes. The current analysis is focused on both localizing the activities that generate value and localizing the waste that do not. The waste we are looking for are the ones accepted by the Toyota Production System: overproduction, waiting, transport, inappropriate processing, unnecessary inventory, unnecessary movement and defects [
30]. Furthermore, we are adding an additional kind of waste for the unbalanced operations [
9]. The main criteria used to evaluate the type of waste of a given activity were obtained from Hines and Rich [
22].
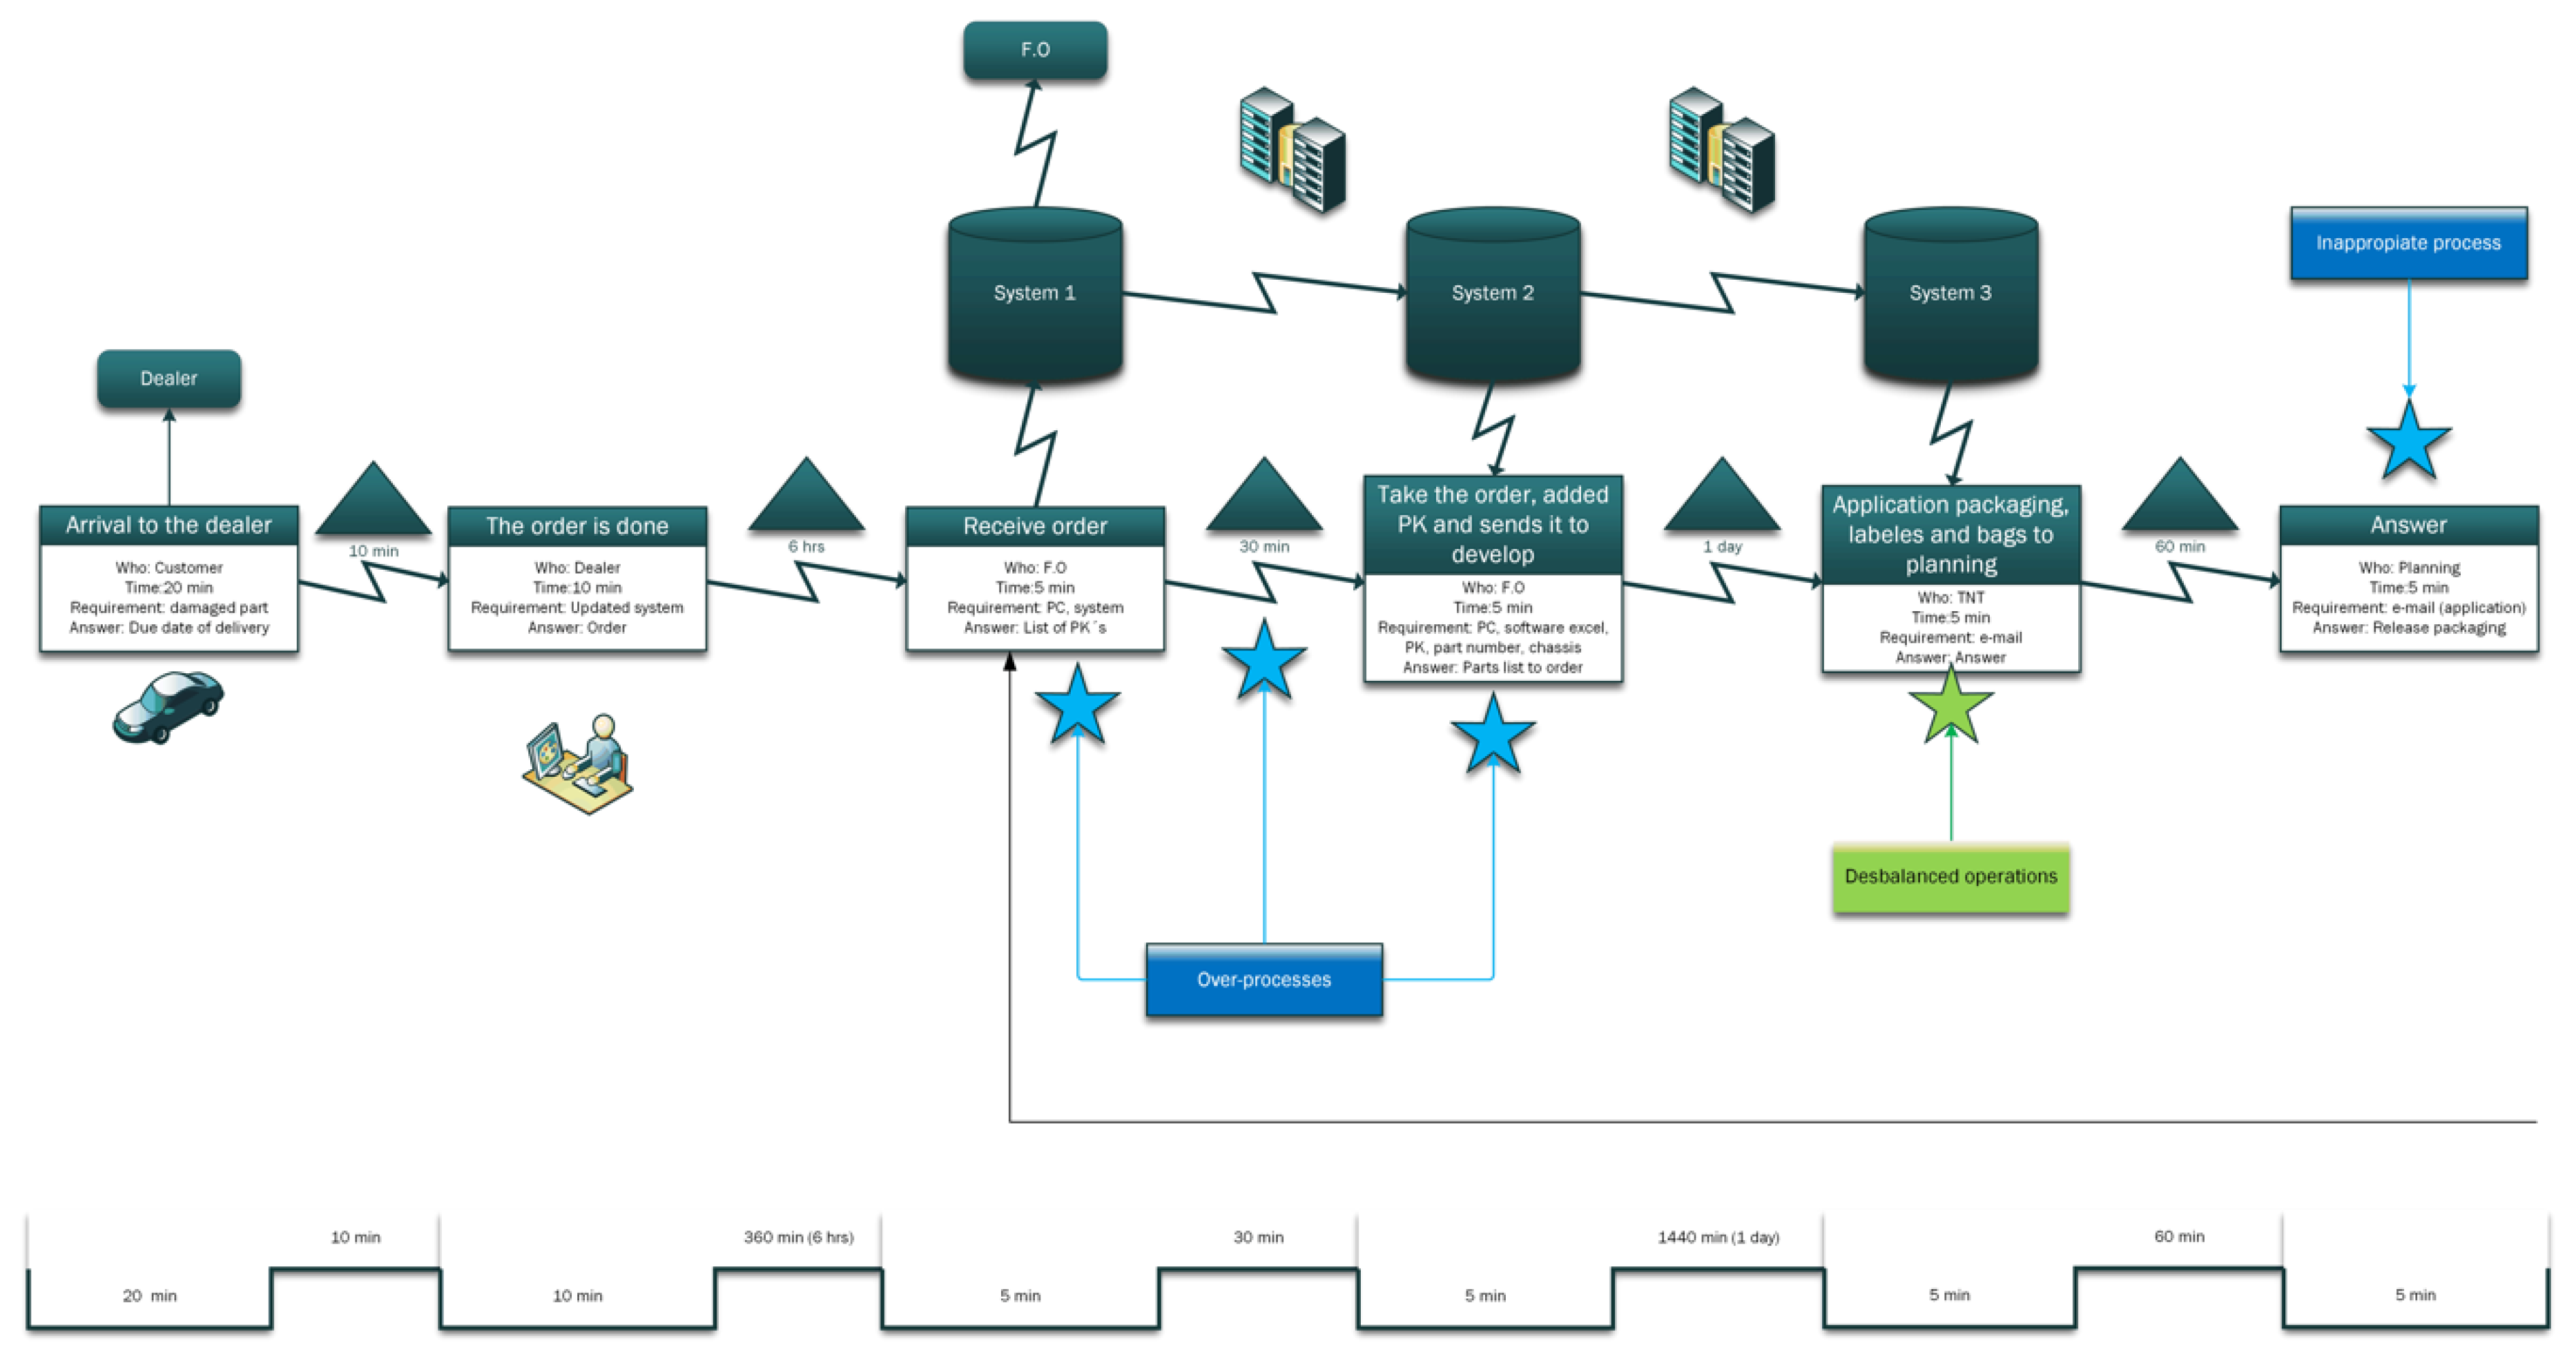
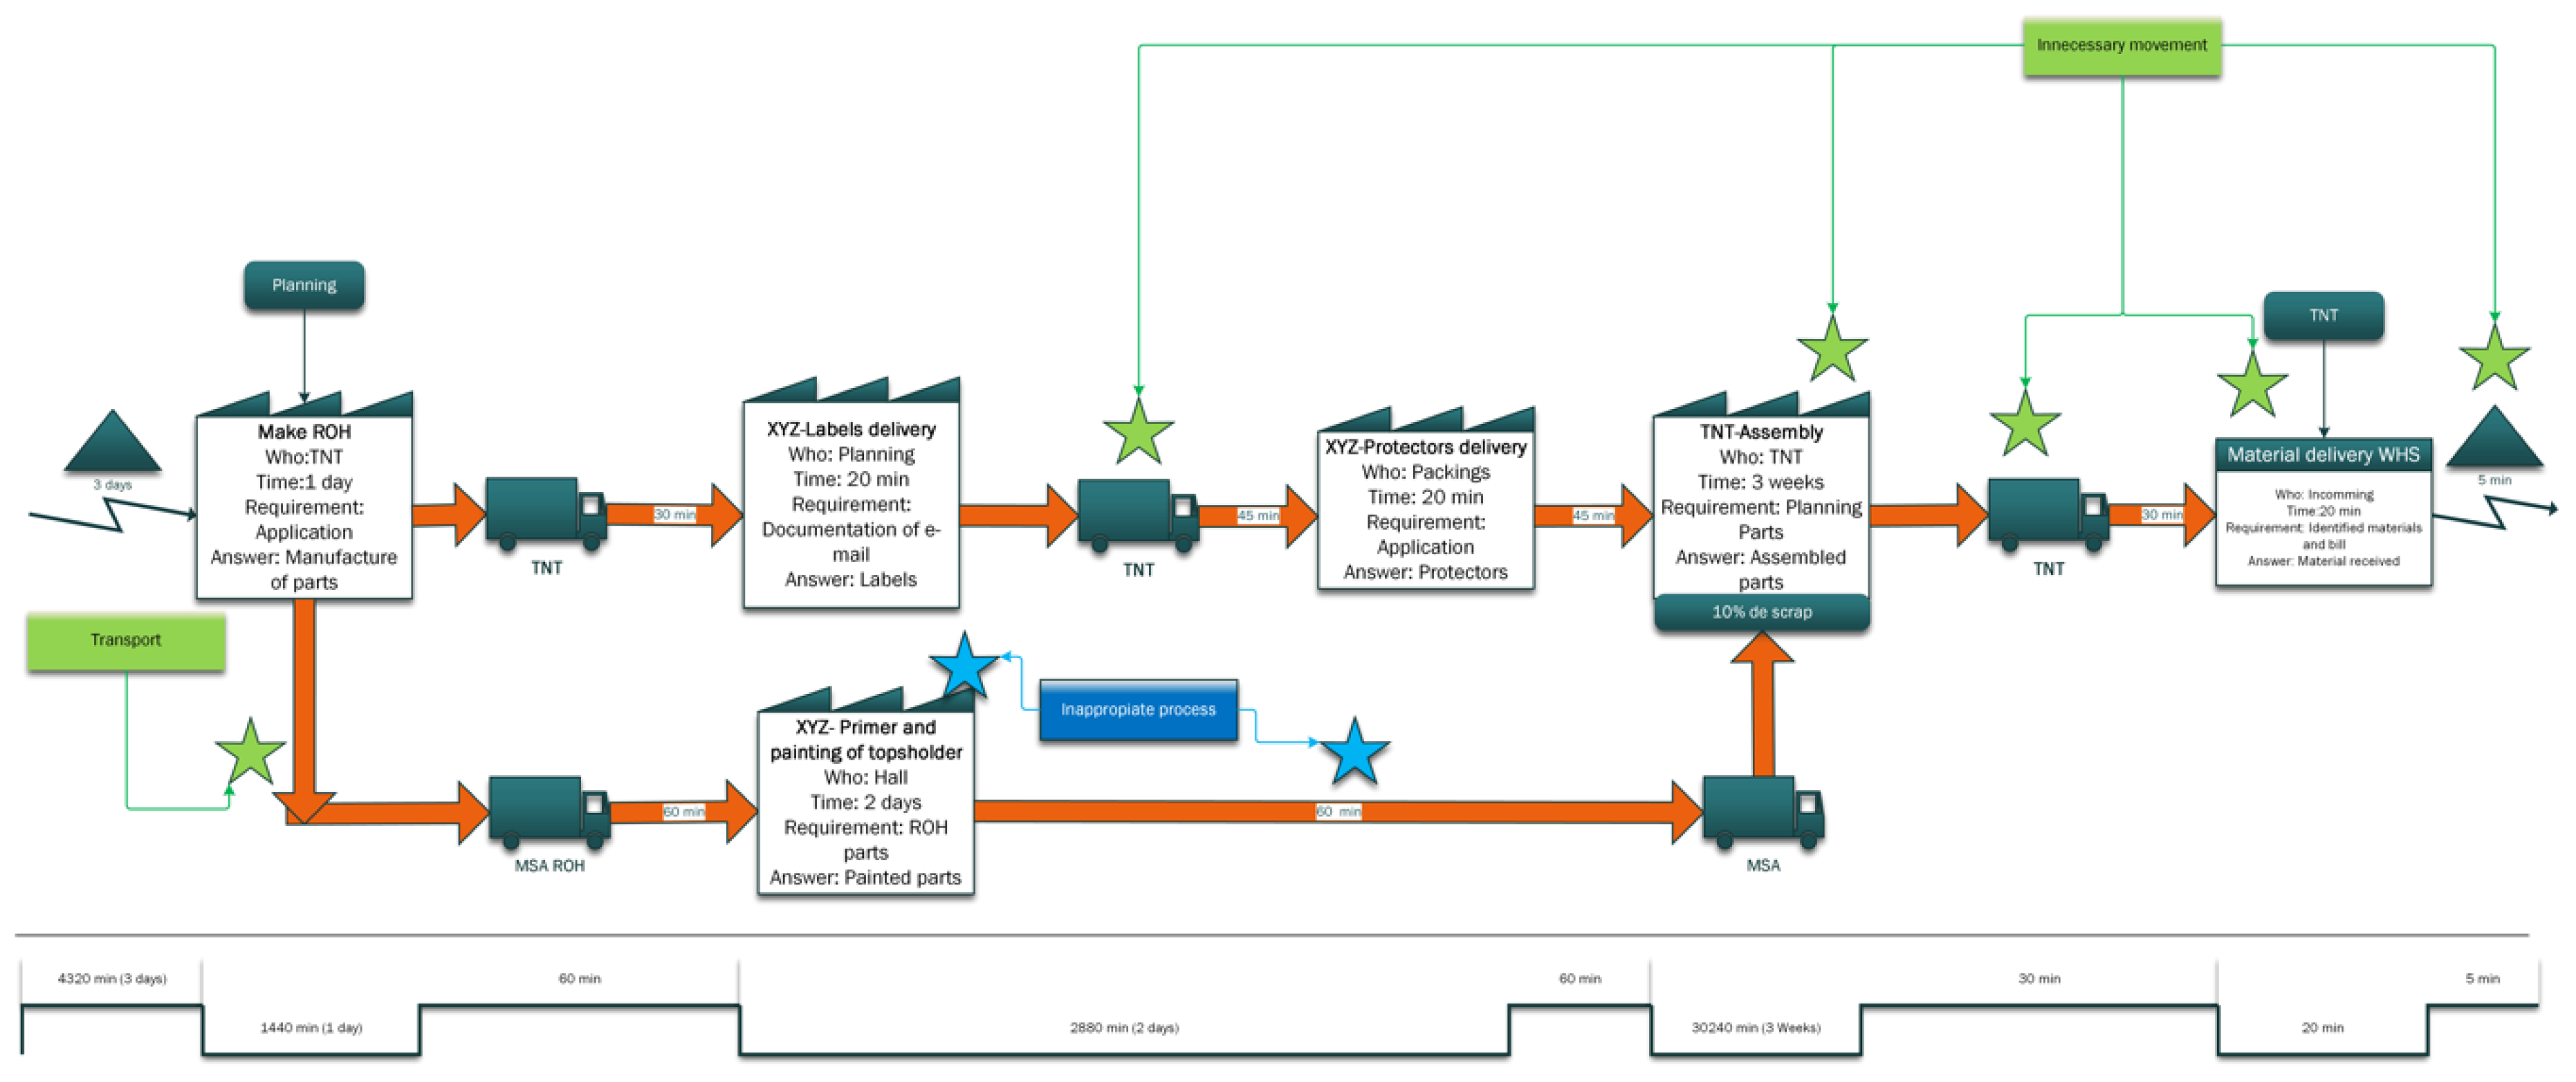
During the analysis, 38 activities were identified in the current state of the map, considering the delivery of the replacement part to the Dealer as the last one. The claiming process takes 3 days, adding seven more activities, which considerably prolongs the reshipment of the new piece. The identified wastes in the current VSM are shown in
Figure 10,
Figure 11,
Figure 12,
Figure 13,
Figure 14,
Figure 15 and
Figure 16.
According to the analysis of the current VSM, several operations can be considered as bottlenecks. The painting operation is time-consuming taking two days to be completed (see
Figure 10), but it adds value. This activity can be classified as "inappropriate processing." The aforementioned happens because the color required to paint the spare part is not available in the painting area of the assembly line.
Another operation considered as a bottleneck is the assembly process carried out by TNT (see
Figure 10), which takes 3 weeks. This activity is considered to add value, but it is time-consuming; then, it is classified as an "unnecessary motion" waste due to the inefficient workflow by the dealer and because it is more important to feed the assembly line rather than attending to a spare part assembly.
Shipping to European dealers takes 2 weeks (see
Figure 15). The centralization of the distribution for the pieces and the inefficient workflow can be classified as an “unnecessary motion waste”.
Only the analysis for the three activities mentioned before is shown, due to the massive amount of time they take. However, for all waste activities, an exhaustive analysis was carried out in collaboration with the staff of the company.
Table 3 shows a summary of the waste found. The number that appears next to the waste only works as a reference. For example, waste 1 “Over-processes” only indicates that it is the first waste that we will find in the VSM reading from left to right. On the other hand, the classification through a color of the waste facilitates to know if they can be optimized, eliminated, etc., the activities where the waste is presented.
The green color was used to indicate that an activity creates value in the current state, but can be optimized. The blue color indicates an activity that did not create any value but is unavoidable given the capabilities of the organization. The red color was used for activities that can be eliminated or decreased. Finally, little faces were used to identify activities that create value with optimal performance.
According to the wastes shown in
Table 3, it can be observed that the waste that most affects the process is unnecessary movement (6, 11 and 12), which takes 50,499.5 min (35.06 days). Therefore, these activities are in green color and can be optimized. The two activities that consume the most amount of time are assembly and shipping, which in this case represent 30,240 min and 20,160 min, respectively, which represents 60.17% of the lead time (view the full current VSM with wastes). The shipping activity is the transfer from the warehouse in Europe to the European Dealers.
The following wastes pertaining to defects (7 and 13) are in red, indicating an area of opportunity for improvement. The assembly has a certain percentage of scrap when the part does not meet the required specifications. Defects (13) should be given special attention because the part has already been rejected by the Dealer and consequently the Dealer will tell the customer that the piece was rejected and that it will have to wait 8 more weeks for its reshipment if the destination of the piece is Europe. This activity could be considered a moment of truth due to the interaction of XYZ, the Dealer, and the customer. This creates a bad image for XYZ and the customer’s recommendations regarding the after-sales service will be negative.
Another waste that affects the process in a significant way is in the category of inappropriate process in the painting activity (5), which consumes 2940 min and represents 3.5% of lead time. Inquiring a little more about this activity, it is observed that the color in production that is required for parts is not always in force and the color is not changed until the production quota is met. In the case of not having the color requested by the after-sales service area, the cost for the manual painting process increases significantly. This process adds value, however, the time required (2 days) can be reduced by making the appropriate improvements. The improvement will be discussed in more depth in the results section.
The wastes caused by over-processes (1) and inappropriate processes (9) are in blue color, which indicates that they do not create value, and is due to the structure in how the orders are made. XYZ uses more than one electronic system to download the requested information, which adds more unnecessary steps.
For activities 2, 3 and 8, there is no balanced work plan, thus, the work is done according to the daily demand. Activity 3 literally represents an inappropriate process, that is, even if it adds value, that activity could be included in activity 2, provided there is a work plan. Activity 8 happens when the replacement part is placed in a virtual storage location, that is, there is no physical place inside the warehouse for the V.I.P. replacement parts; thus, they are stored temporarily in an improvised space for 6 hours while their destination is determined.
Table 4 shows the waiting (WT), process (PT) and total (LT) times, as well as the percentage of value added, calculated as the ratio of the processing time to lead time for the replacement parts that were accepted or rejected.
5.3. Development of the Future State Map
To develop a future state map, it was proposed to change the process with the goal of delivering the product in a maximum of 3 weeks. Several meetings were held with all departments involved, as well as with suppliers. As a consequence of the redesign of the process, new departments were added, such as product support, product influence, technical literature and technical center.
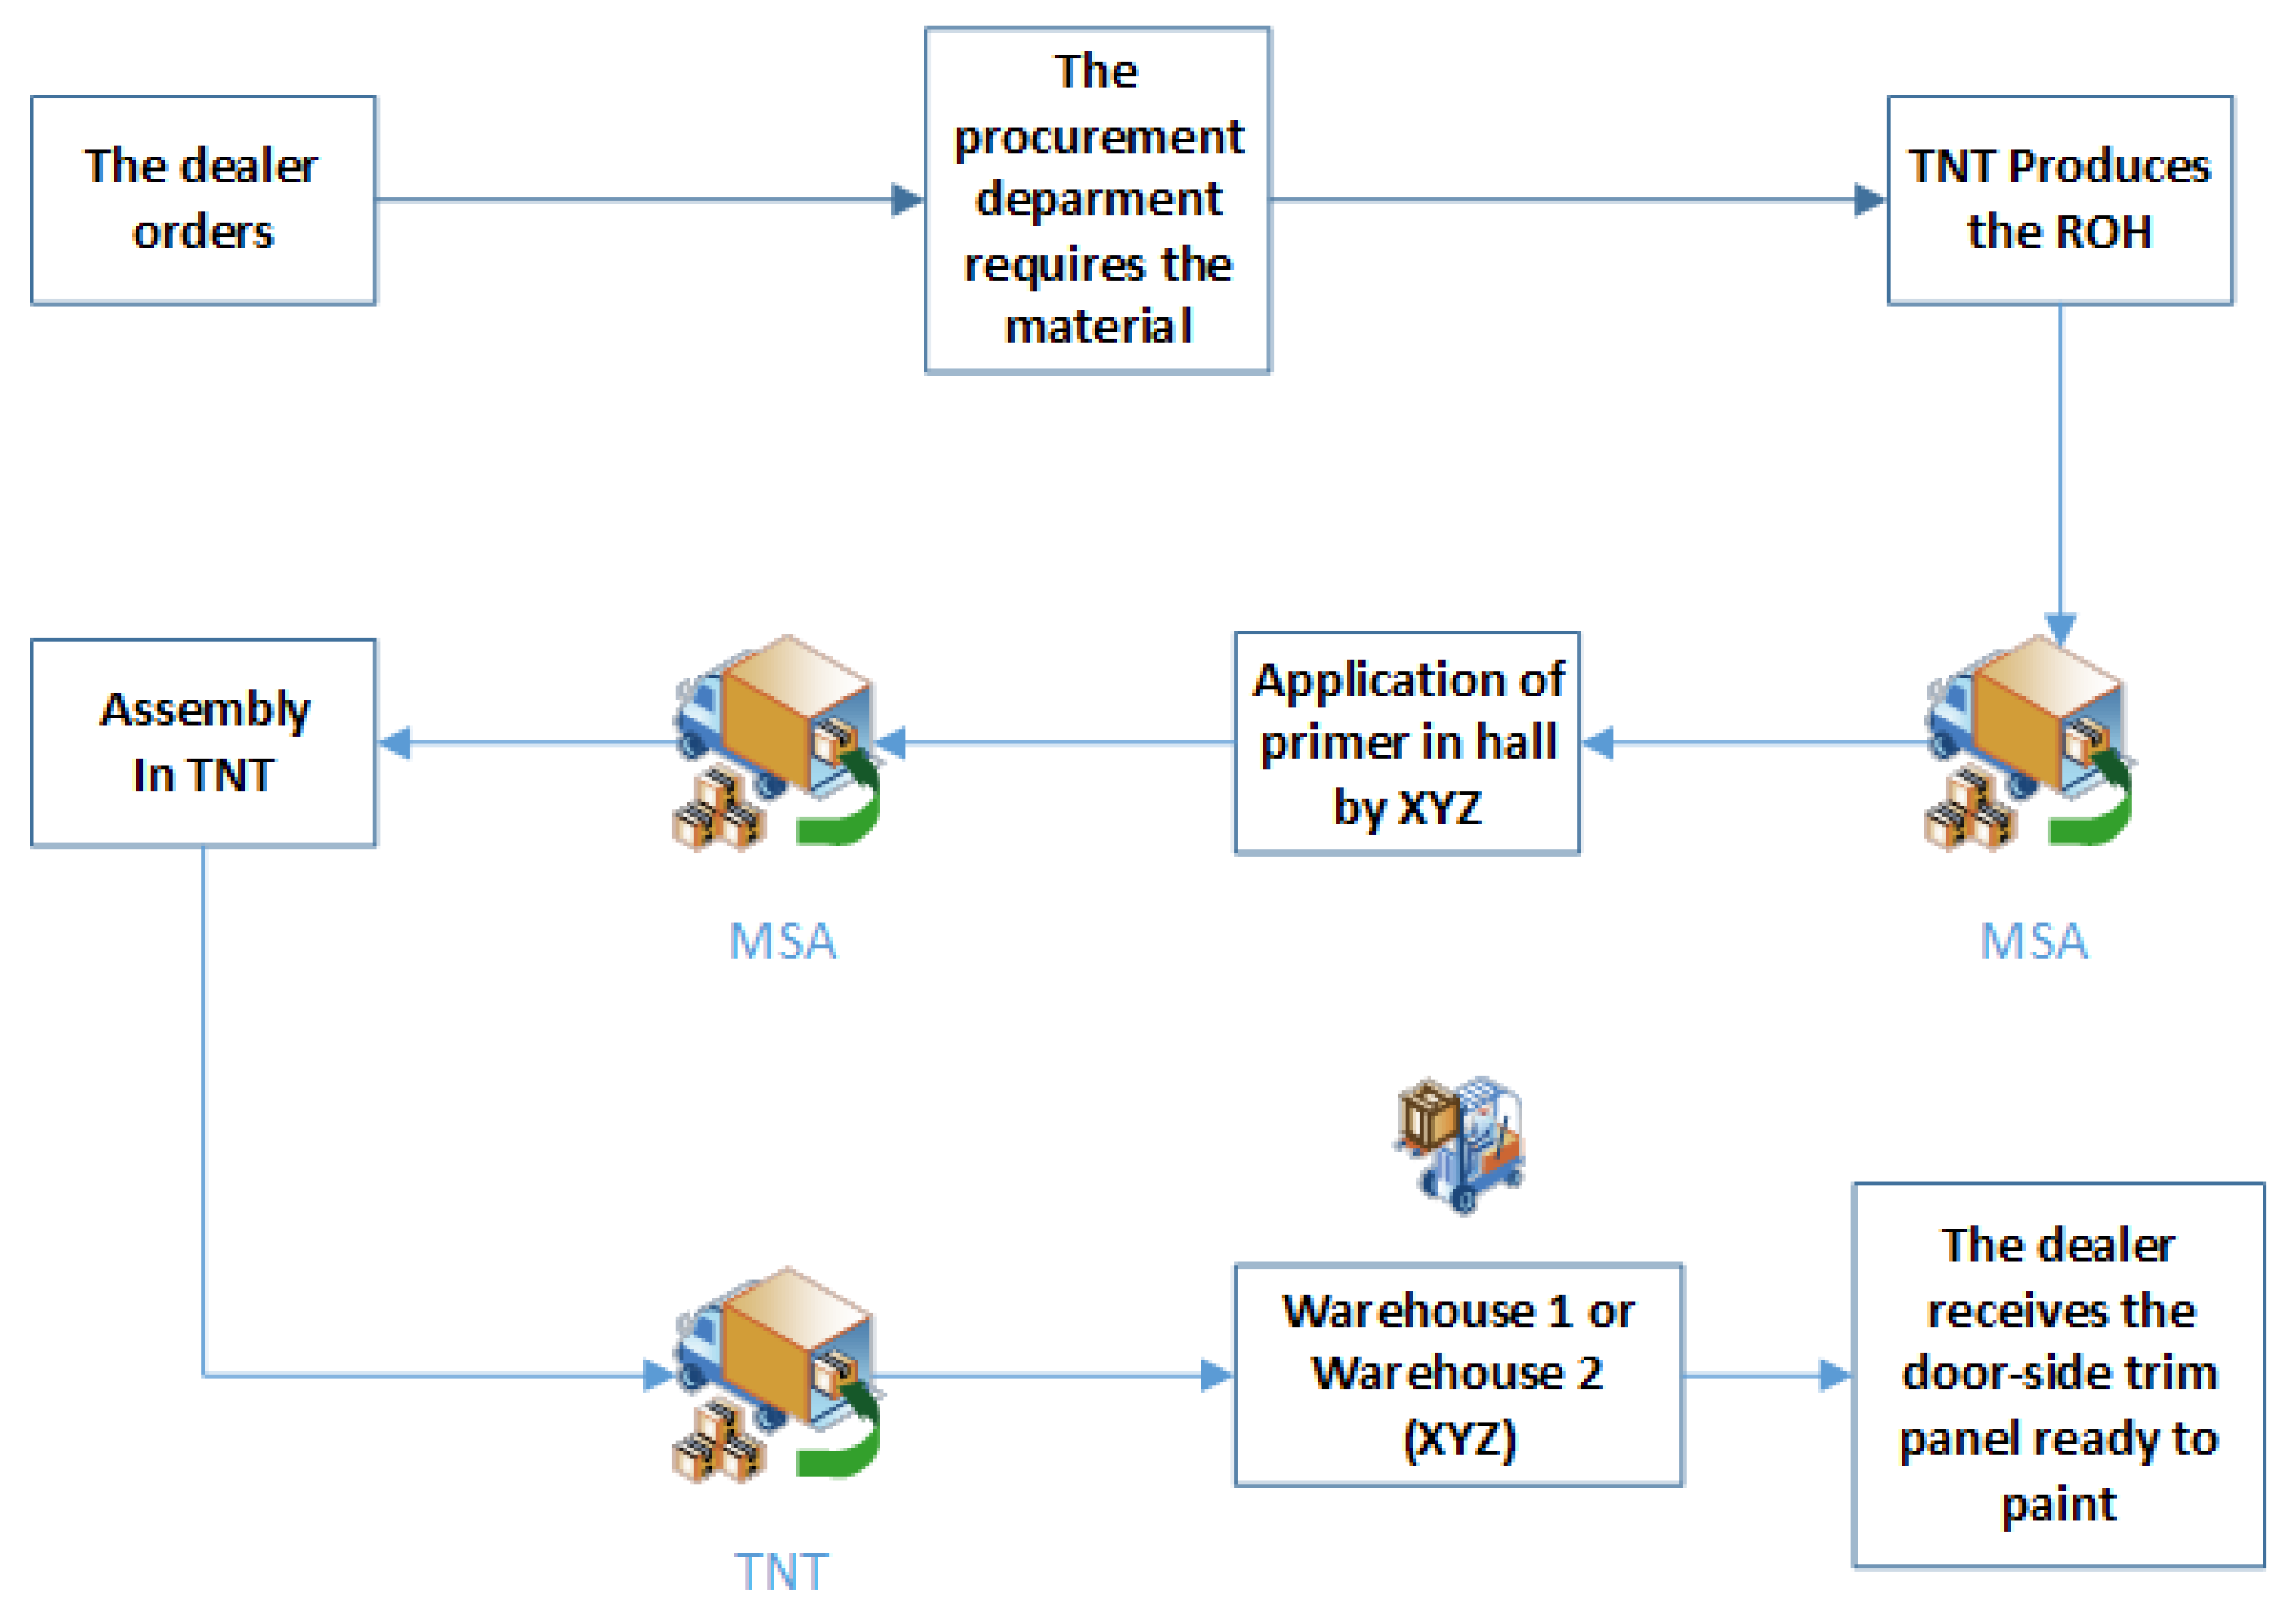
Two improvement proposals were made. For the first scenario, it was proposed that XYZ performed only the primer application, without performing the application of color. This proposal would significantly reduce unnecessary movements. In order to this proposal to work, Dealers would have to apply the color.
Figure 17 shows the flowchart of the proposal.
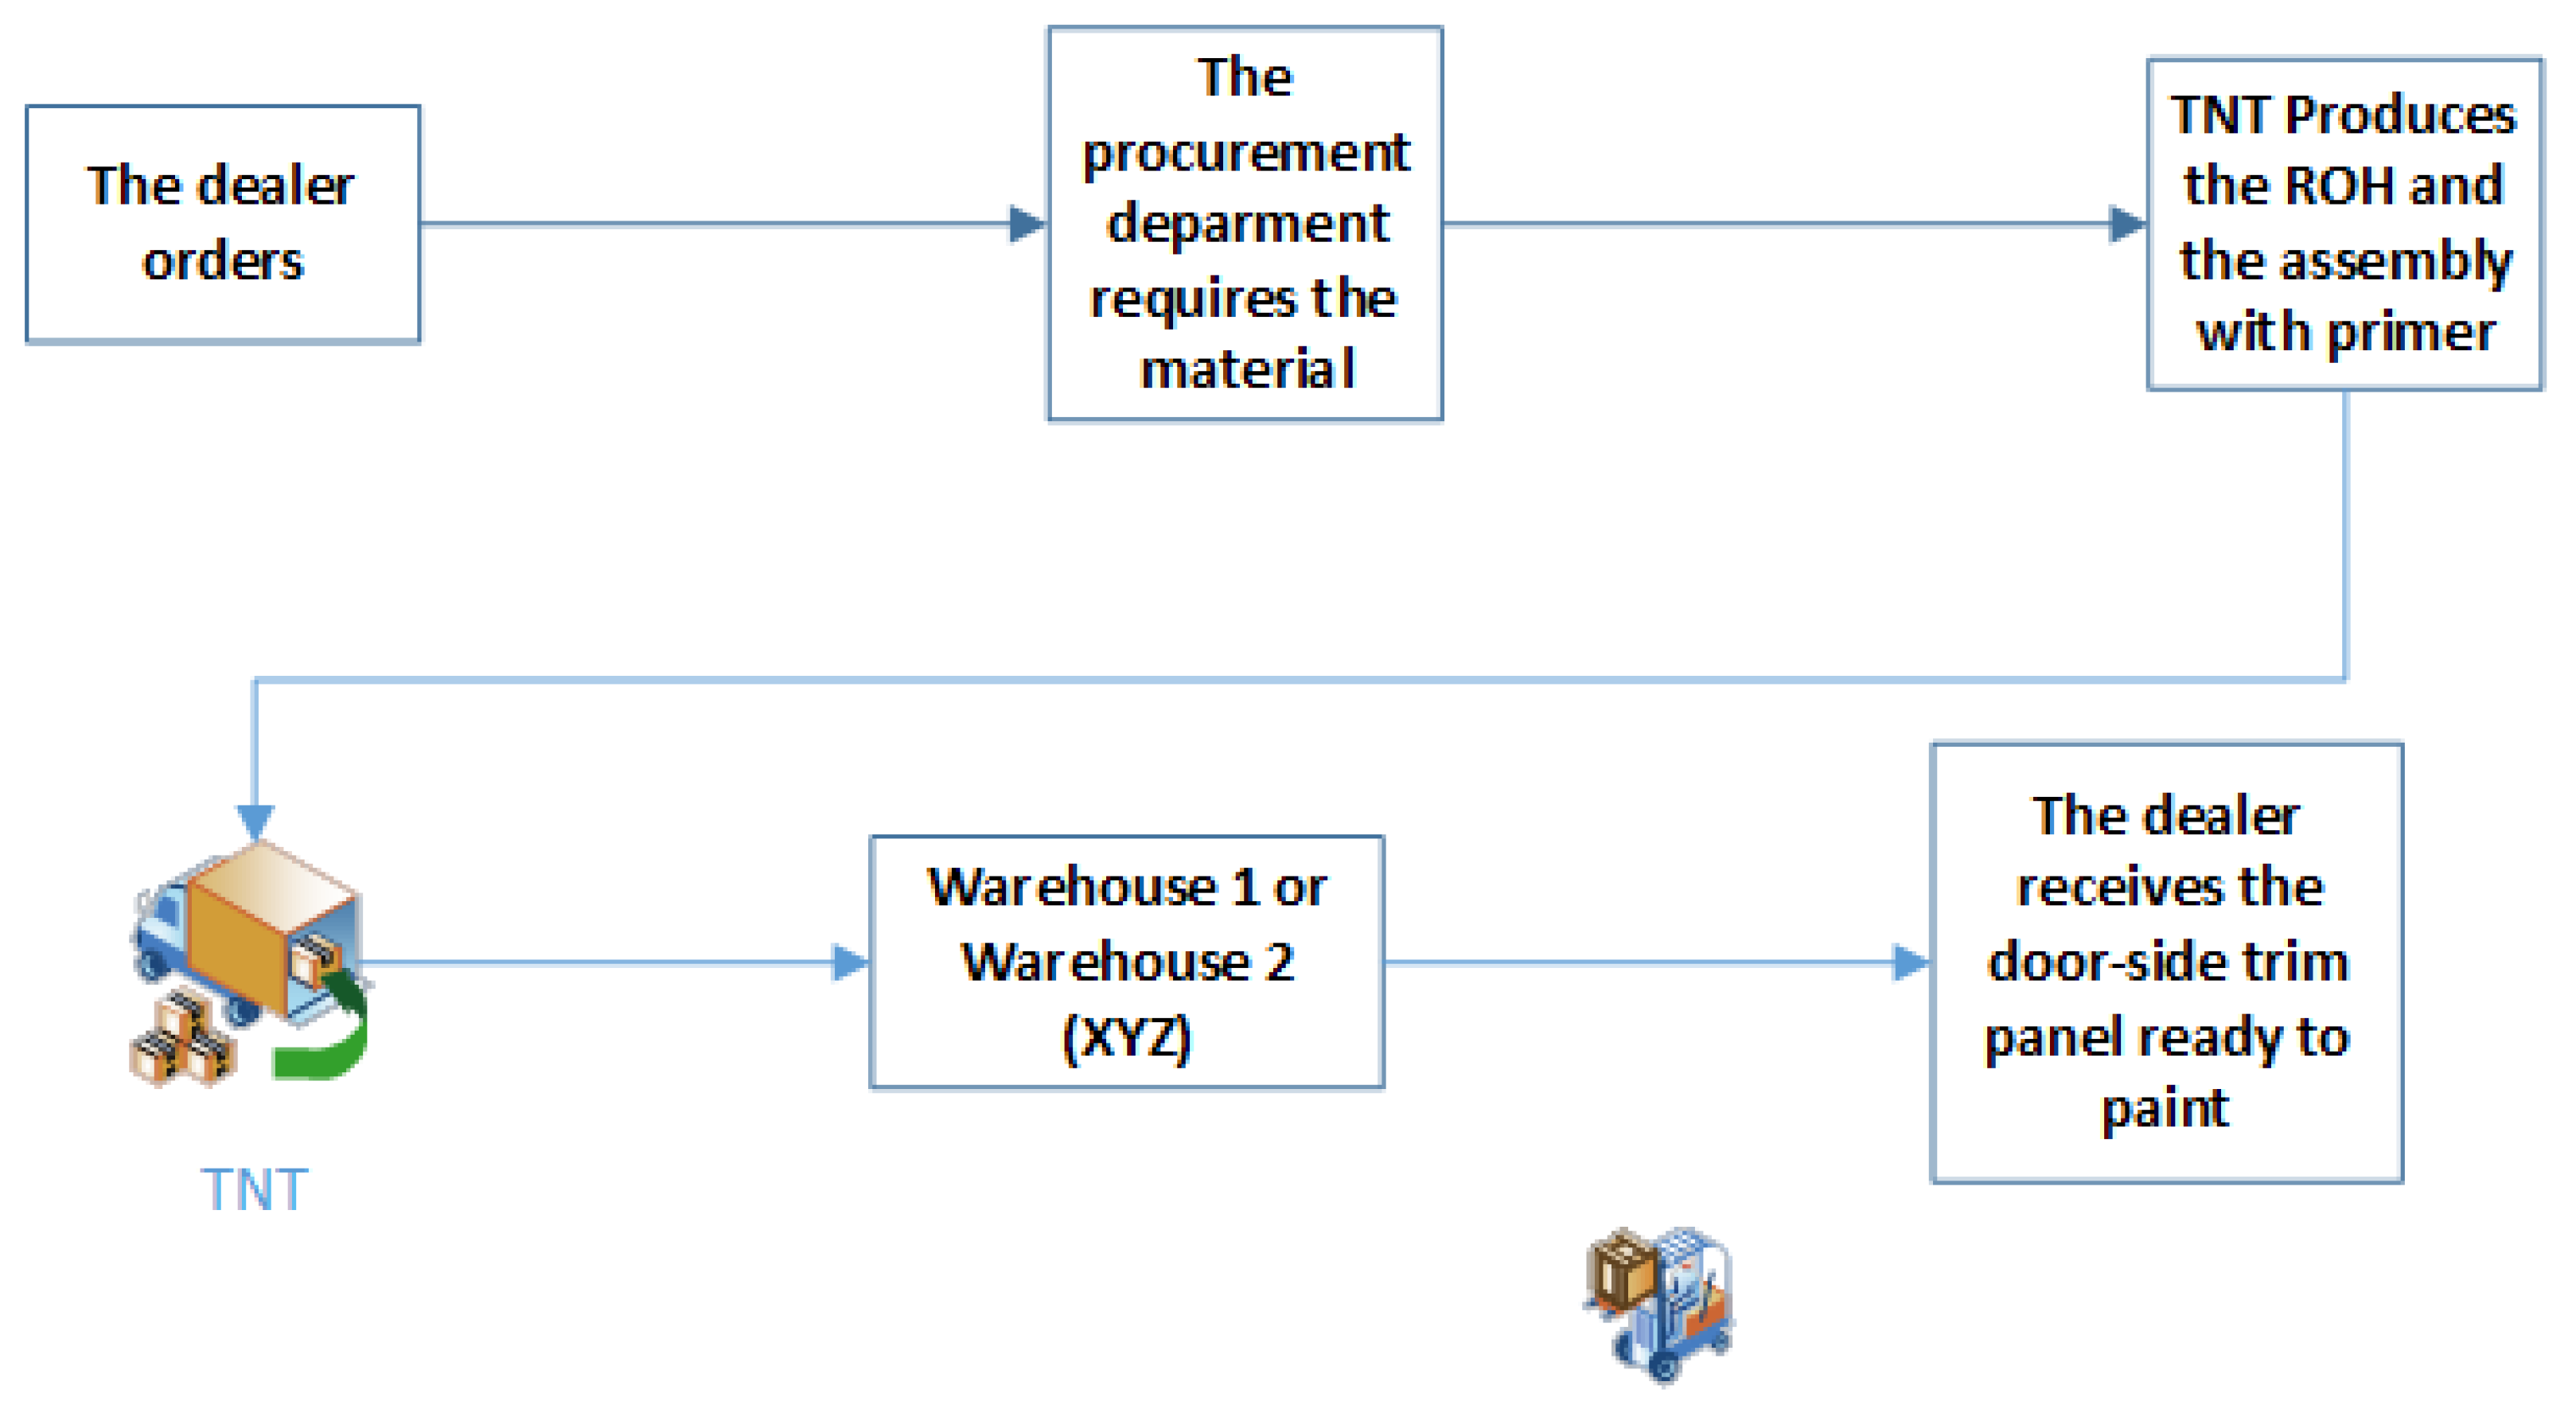
The second scenario considers a significant modification of the process. Because the company XYZ did not participate in the entire painting process, the application of the primer would be made by TNT. This process proposal would be carried out under certain conditions. First, the supplier must meet the XYZ internal standard for the primer application, and XYZ should negotiate with the supplier an economic agreement for the primer application. Second, a space for the pieces in the store would be destined, avoiding that the pieces are damaged by bad manipulation. For this, the necessary space and its corresponding cost would need to be calculated, as well as its working time. Third, tests must be performed by the Dealer, ensuring that it complies with the internal standard of the company for interior painting.
Figure 18 shows the flowchart of the proposal.
The feasibility of both proposals was analyzed, taking into account the available resources and the analysis of wastes. It was concluded that proposal 2 was feasible.
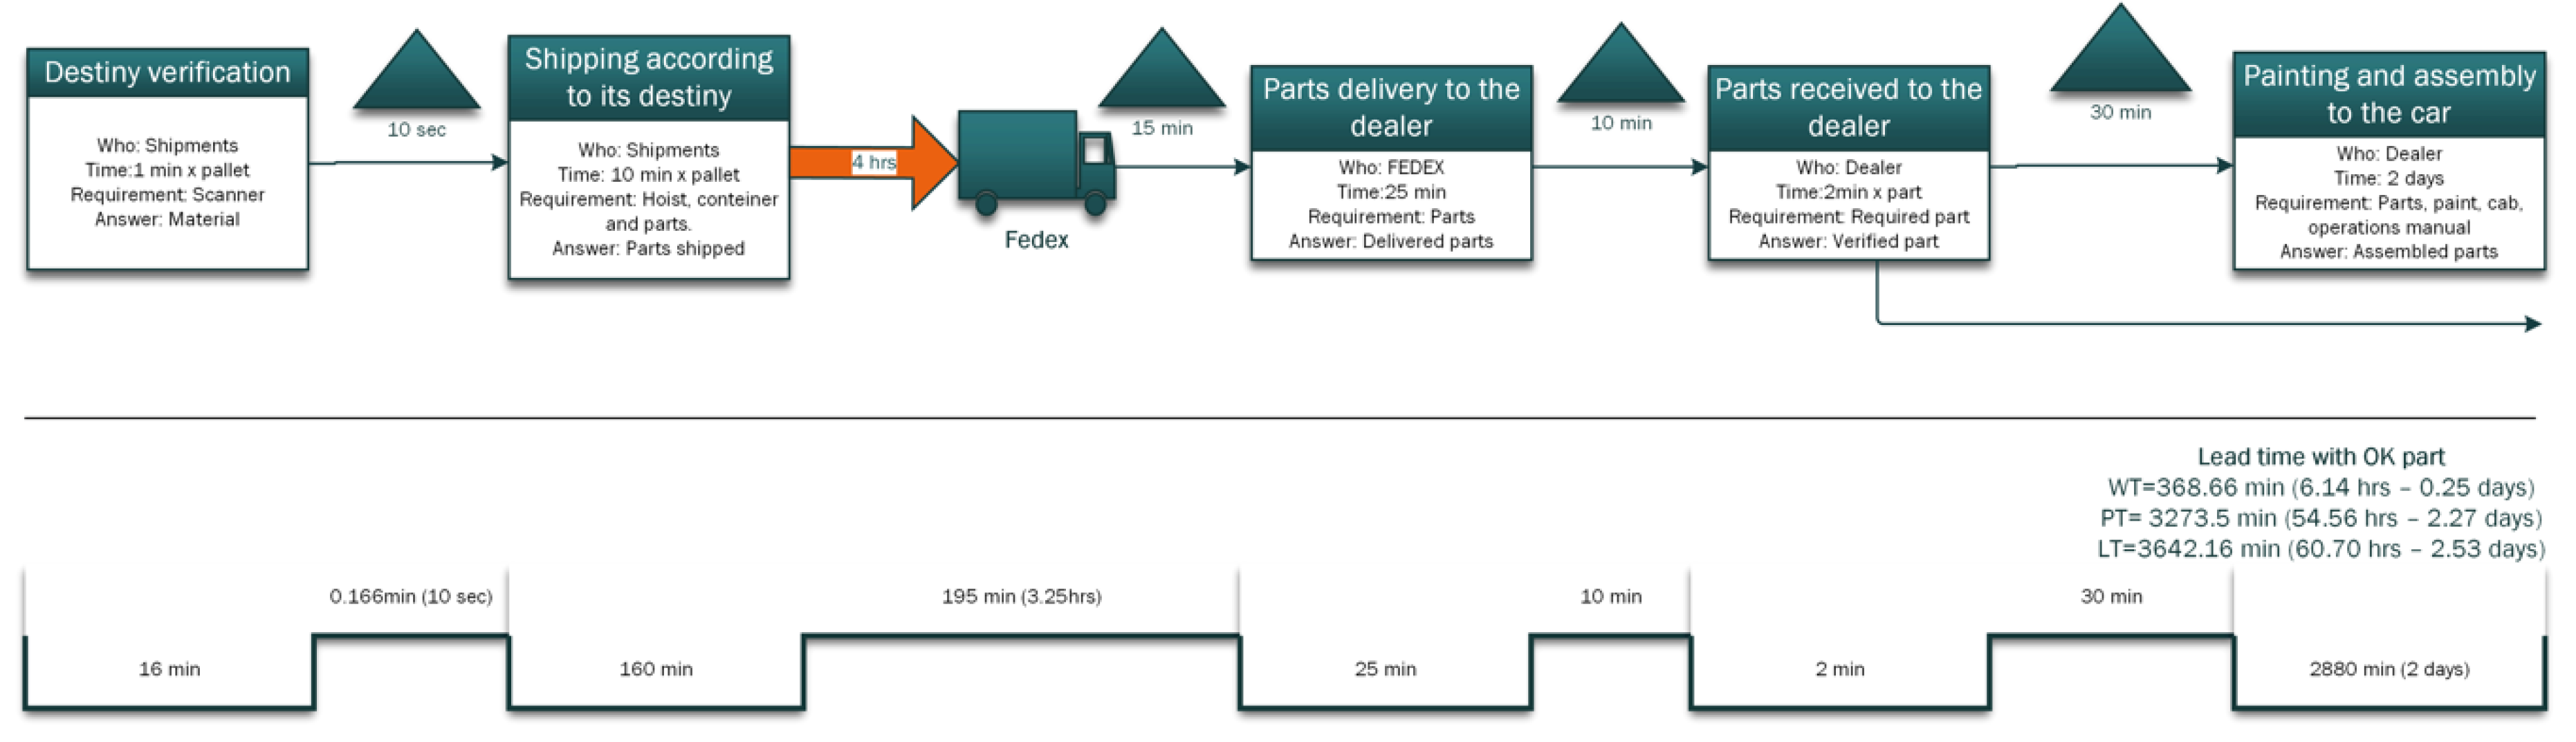
Figure 19,
Figure 20,
Figure 21 and
Figure 22 shows a part of the future state map (only for national orders) for reasons of confidentiality of the company.
Finally, a proposal A3 report was made. The goal of the proposal A3 is to present a logical, structured plan for consideration so that a good decision on implementation can be made [
39].
Figure 23 shows the result of the proposal A3 report. In
Figure 23, ‘Nombre del Proyecto’ stands for ‘Name of the Project’, and ‘Objetivo y Alcance’ stands for ‘Aim and Scope’.
6. Discussion of Results
Looking at the future state map, improvements can be observed mainly in the delivery time and costs of the modules of the door-side trim panel for the Z model.
When changing the process, several activities were removed or modified. One of the most important changes was that the V.I.P. spare parts, left this label, and now there is an inventory for these. In order to know the number of pieces that were needed, the IDIS system was used as a forecasting tool, which takes into account sales for a given year and production demand during that year. With this information, the system calculates the number of pieces that must be required for each month of the following year.
Table 5 shows the requisitions for each month.
It should be noted that these part numbers are generic.
Table 6 shows the most relevant costs obtained by the Pricing and Logistics areas. These costs include direct costs for each of the current and expected activities of the process during implementation.
Savings with the new process are expected to be significant for all three destinations. Taking the life cycle cost into account, these savings would amount to more than six digits.
Another section that was reviewed in depth was the primer application process by TNT, which met the requirements of the corresponding standard of XYZ.
The next process tested was the process of painting done by the Dealer. Different coating methods were analyzed so that the coated parts were not painted. In general, the process of painting is the following: cleaning the surface, masking with paper or tape, sanding, cleaning the surface again, and painting. Selected methods were designed according to the technical capabilities of the Dealers. The first method consisted of coating with paper, as can be seen in
Figure 24. The results show that when the paint is dried, there is a risk that when the paper is removed, some residues remain.
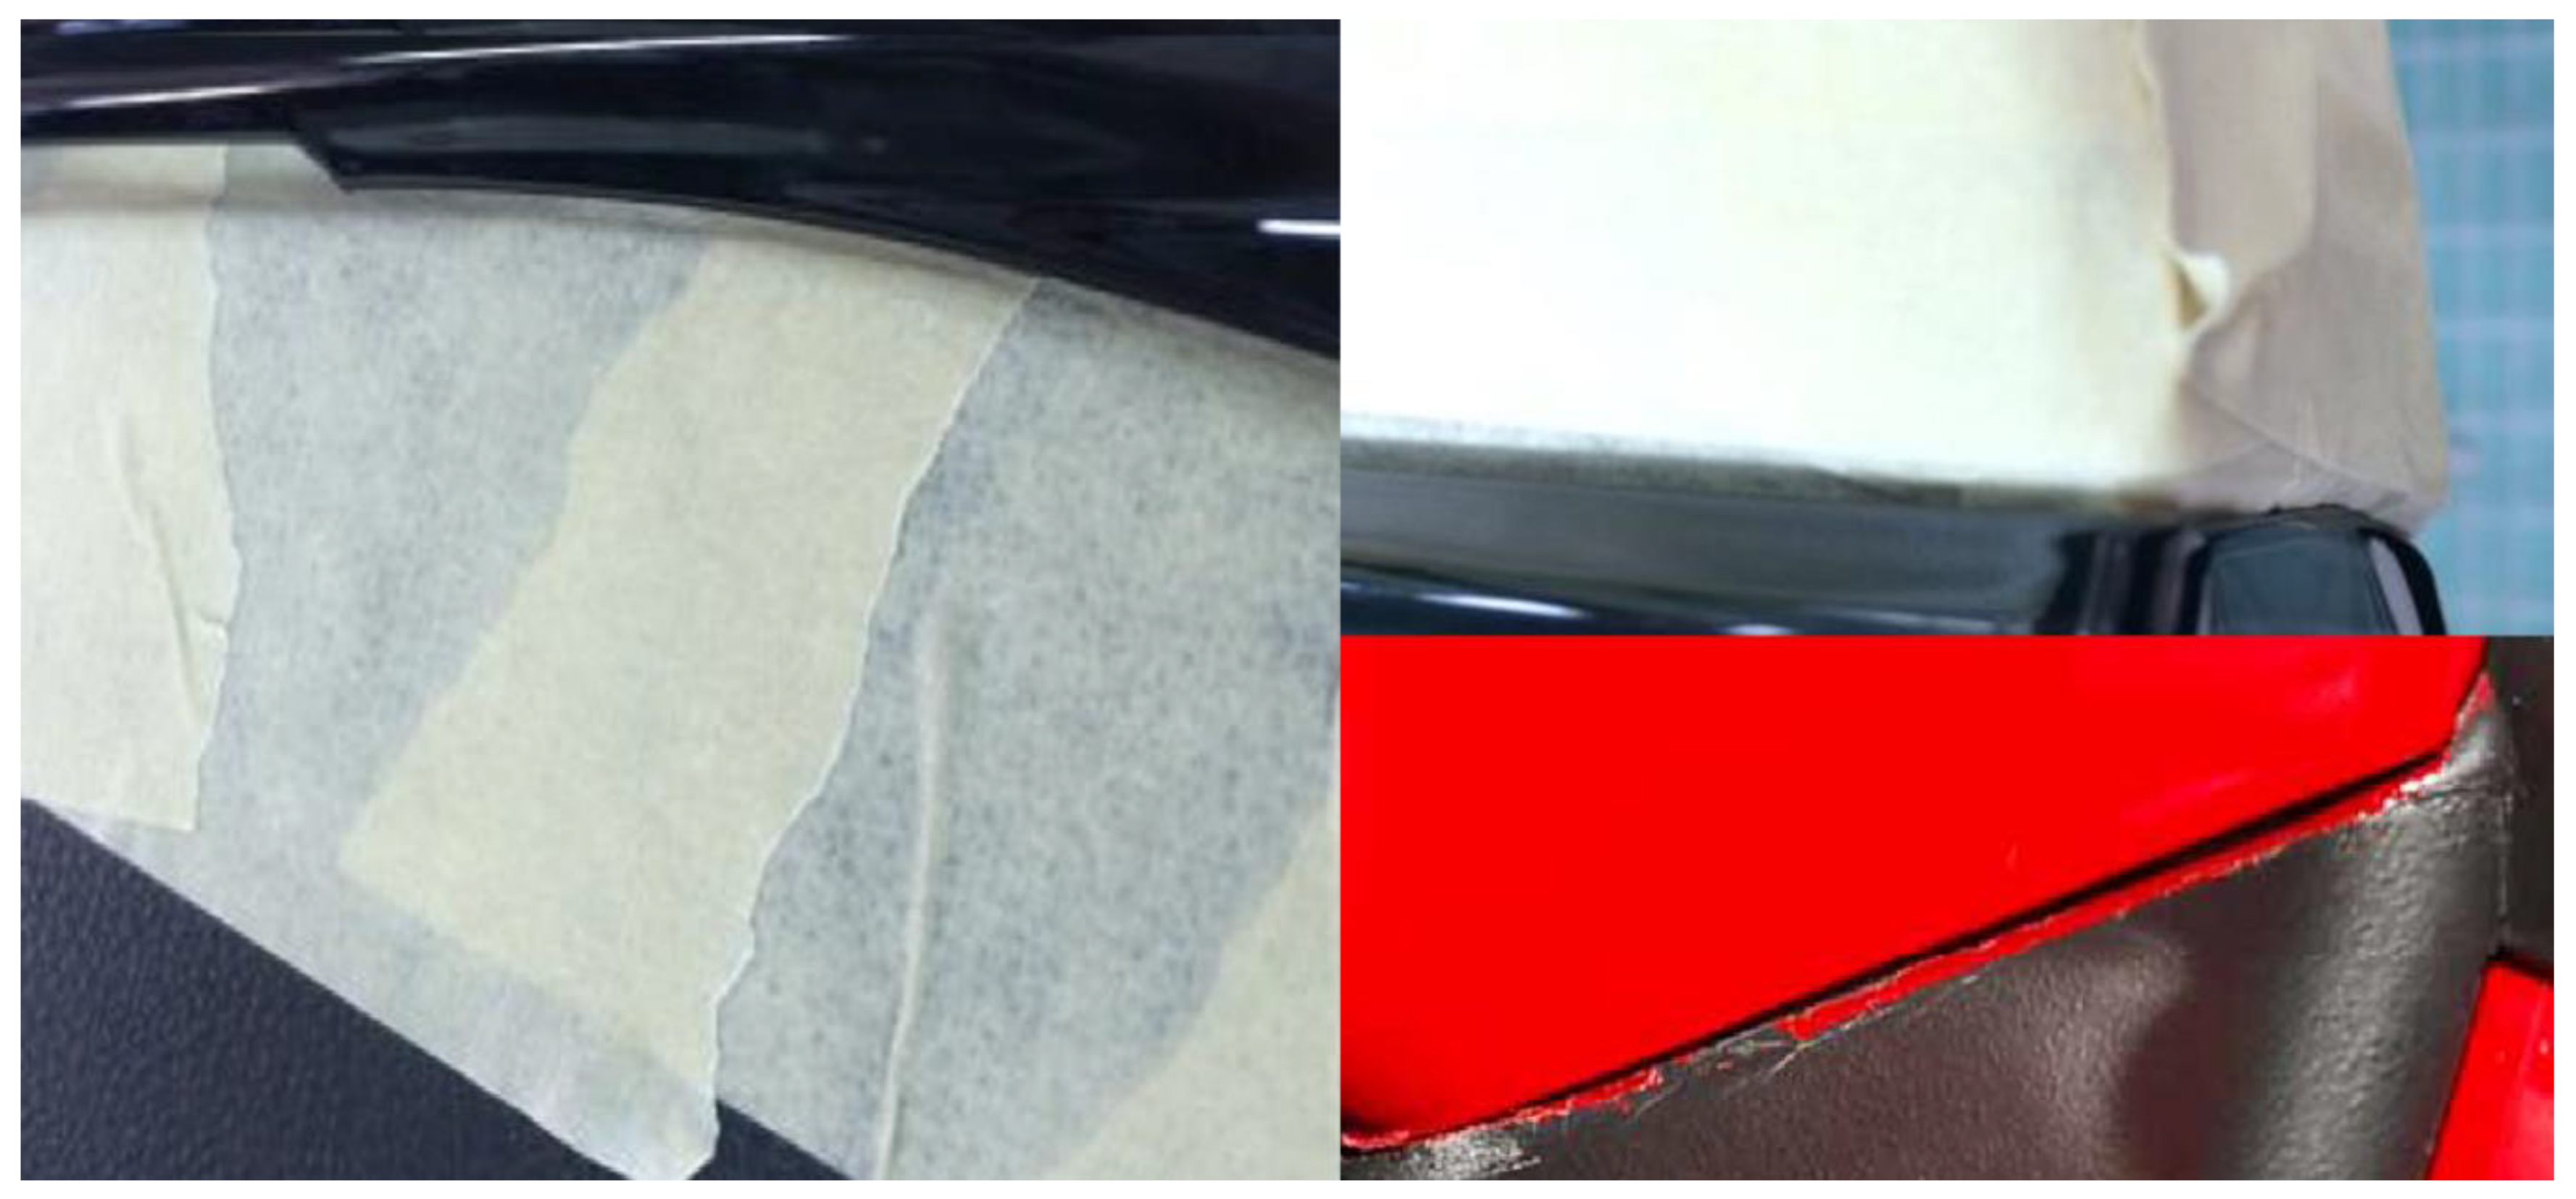
The second method consisted of using masking tape.
Figure 25 shows the masking tape, which presents its corresponding problems. For example, with the masking tape, there is a risk of painting the assembled door and the side panels, because the dry paint adheres to the adhesive tape and tears when it is removed. In the same way, the process took a considerable time. One more problem was that by removing the masking tape from the top shoulders, the paint is damaged at the edges. Thus, another method had to be found.
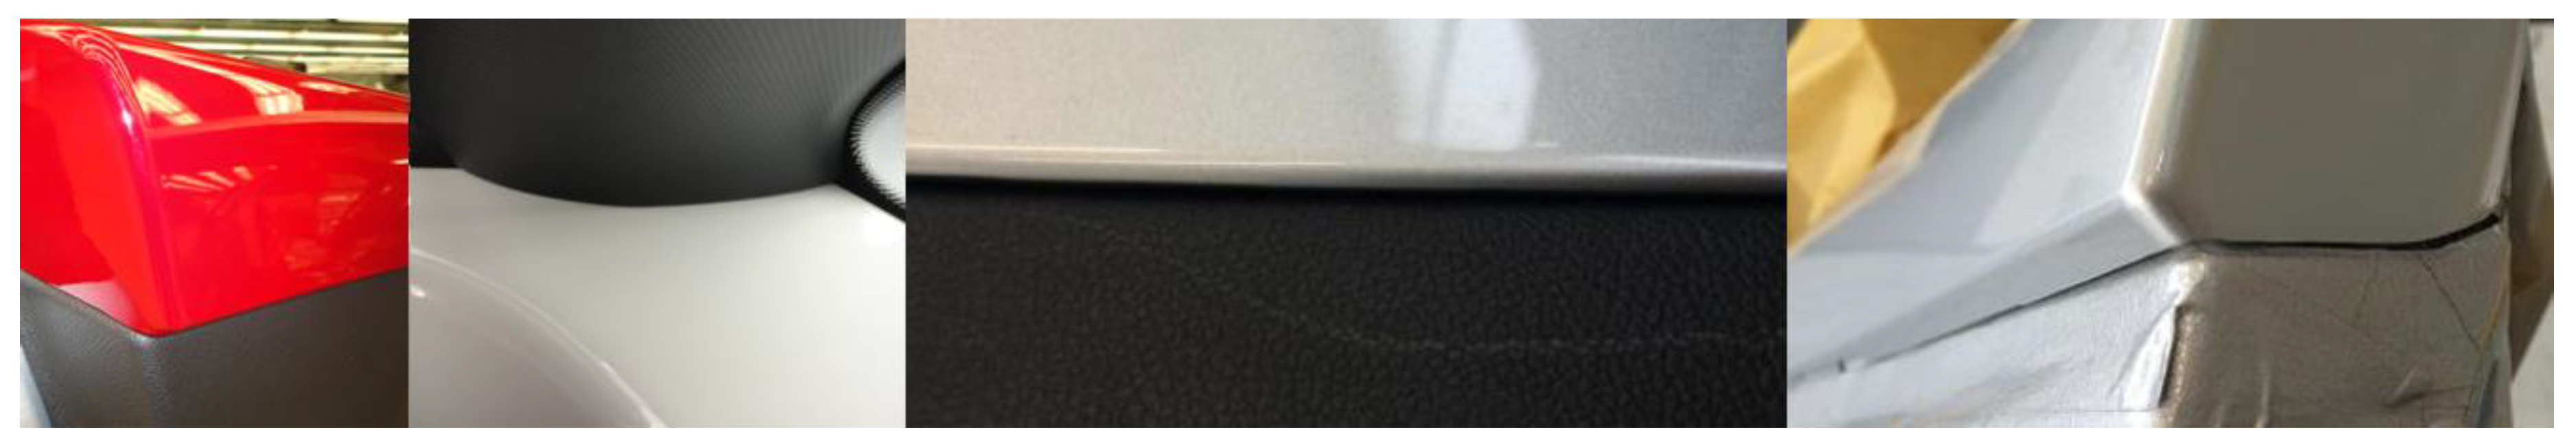
The third method consisted of using tape 3M with stiffened edges and masking tape. The results are shown in
Figure 26. As can be seen, the results are satisfactory and comply with the internal standard of the company XYZ for interior painting. The tests carried out for this method were: verification of gaps, laboratory tests for layers of paint of the top shoulders (layer thickness, adhesion, condensed moisture and hydrolysis test) and transparency test on painted top shoulders during the operation of environmental lights. The painting process for this method took 130 min per part.
The conclusion of the test laboratory was that the samples tested met the requirements of the corresponding standard, for the use of the technical center as an alternative process. The replacement parts department must ensure that this process is performed correctly.
However, according to the action plan, we realize that the complexity of the product can be decreased. It means that the part could be delivered with the primer application and without the inner actuator. This reduction of complexity can generate more savings because all the parts would not be released.
Table 7 shows the reduction of complexity according to the number of parts that existed in the past.
Finally,
Table 8 shows a summary of the relevant figures that will be achieved after the implementation is completed.
In addition, 40% of the operational and administrative time of this process will be reduced, thus giving more flexibility and capacity.
7. Conclusions
From the beginning of the project, it was observed that the design and the variations of the modules of the door-side trim panel are very complex, causing the logistics and production flow to be complicated. Due to the complexity and its characteristics, the project was ideal for the application of Lean Manufacturing (LM), since the scope that these tools have in the manufacturing industry guarantees the success of the project.
The two tools used during this project were of considerable importance. Value Stream Mapping addressed the flow of the process, which led to a thorough analysis of all steps involved in the process of delivery of spare parts to the Dealers. It was confirmed that several activities did not add any value to the process. Waste analysis was a very important tool, with which it was possible to fully identify the different types of waste that the process had.
Waste analysis allowed future VSM to be performed, eliminating inappropriate activities. For example, the painting process created value, but it was not optimized, which is why in the future VSM, it changed noticeably. Thus, in the future VSM, 12 activities were eliminated. In addition, a reduction in the national delivery time of around 95% is expected. These improvements are confirmed by the percentage of value added, which indicates an improvement of 24.08% compared to the previous data of the VSM, obtaining an added value of 89.87%.
The implementation of the proposal A3 report indicated the people responsible for executing each activity during the implementation and the deadlines of these activities.
The direct benefits for the company will be:
Improved logistics flow
National delivery of the piece in 2.53 days
40% reduction in operational and administrative work on this process
Economic savings in the life cycle of parts in more than six digits
The percentage of claims will be monitored monthly. A reduction of 30% is expected in three months, 50% six months later and 80% in one year.


 ,
, 


