Article

NMR Relaxometry and IR Thermography to Study Ancient Cotton Paper Bookbinding

1
Department of Physical and Chemical Sciences, University of L’Aquila, Via Vetoio 10, 67100 Coppito, L’Aquila, Italy
2
Department of Industrial and Information Engineering and Economics, University of L’Aquila, Piazzale E. Pontieri 1, I-67100 Monteluco di Roio, L’Aquila, Italy
*
Author to whom correspondence should be addressed.
Appl. Sci. 2019, 9(16), 3406; https://doi.org/10.3390/app9163406
Submission received: 31 July 2019 / Revised: 15 August 2019 / Accepted: 16 August 2019 / Published: 19 August 2019
(This article belongs to the Section Applied Physics General)

Abstract

:

Featured Application

Application of two-dimensional nuclear magnetic resonance relaxometry (2D 1H-NMR-R) and higher-order statistics thermography (IRT-HOS) for inspecting cellulose materials in a non-destructive and non-invasive way.

Abstract

Defects related to degradation were observed in an ancient book paperboard cover through nuclear magnetic resonance relaxometry and infrared thermography. Data collected with this combined method allowed identifying areas with moisture content and thermal diffusivity anomalies within the front board, corresponding to the different conservation status of the cellulose-based material. Non-destructive testing analytical procedures provide comprehensive knowledge for preserving precious library archives.

Graphical Abstract

1. Introduction

Protection of precious library archives includes specific tasks of the same relevance. In particular, the characterization of the books supporting materials is crucial for pointing out degradation phenomena, for improving micro-climatic parameters, and for suggesting restoration activities [1]. Considering the large number of factors involved and the vastness of the collections, the ongoing degradation processes are often identified once clear and irreversible. Knowledge of biological, physical, or chemical deterioration pathways is essential in preventing the increase of structural defects, so to improve the permanence of library heritage [2].
The present work aims at surveying the state of conservation of a 19th-century book, focusing on its paperboard cover. We used the cover as a case study for a reliable non-invasive diagnostic procedure. The front-board cover is made of cotton-based paper, a hygroscopic material that absorbs and releases water depending on the ambient conditions, i.e., temperature and relative humidity (RH). The cover was analyzed in terms of spatial distributions of moisture content, through two-dimensional nuclear magnetic resonance relaxometry (2D 1H-NMR-R) [3], and thermal diffusivity via higher-order statistics thermography (IRT-HOS) [4]. We performed both methods using non-destructive and portable instruments which enable in situ investigations [5,6], likewise precious book collections [7,8,9]. Cotton paper is a random network of hydrated cellulose fibers. The cellulose chain is the elemental unit of the cellulose fiber comprising a linear homopolymer of glucose monomers linked with glycosidic bonds. Possible inter- and intra-molecular hydrogen bonding provide the interaction between the different cellulose chains and their aggregation into hierarchical arrangements, from micro fibrils up to fibers [10]. Chains pack into a micro fibril with regularly arranged crystalline (with two different allotropes, Iα and Iβ cellulose) and irregularly aggregated amorphous domains. The microfibers, in turn, assemble into a fiber. The degree of polymerization (DP~104), the relative amounts of the two polymorphous (Iα/ Iβ~40%) and of crystalline material in cellulose (CI~80%) influence the mechanical and physical properties of cellulose. Based on this architecture, the amorphous regions in a microfiber along with microfibers-microfibers and fibers-fibers inter-spaces allow considering cellulose as a porous system. Therefore, water molecules play a crucial role in establishing its chemical and physical properties [11]. In soft drying conditions, at least a minimum quantity of water (hydration water) stabilizes the porous network by bridging different cellulose chains via hydrogen bonds, wherever hydroxyl groups are available. Hydration water and water molecules filling cellulose pores are characterized by different dynamics, affected by their spatial confinement [12,13,14,15]. Water can swell or shrink the porous structure depending on its volume under controlled thermo-hygrometric conditions [16]. Although water is required to achieve the paper’s flexibility, water vapor adsorption/desorption mechanisms are responsible for solubilizing and carrying atmospheric reactive compounds, soluble salts and minerals, contributing to the deterioration of cellulose. To describe the conservation status of the cellulose-based paper, many authors suggested correlating the water molecule dynamics, physically and chemically hindered by the cellulose network, with the thermo-hygrometric response and hence with the ageing processes of the material [17,18].
1H-NMR-R measurements allow characterizing the dynamics of water molecules confined in cellulose amorphous phase, acting as hydration water or filling pores [19,20,21,22]. Protons belonging to the polymer chains, in fact, are seldom experimentally accessible since their NMR signal’s coherence time is too short. 1H-NMR longitudinal (T1) and transverse (T2) relaxation times correlation maps permit distinguishing water molecules populations with different dynamics in a porous material as cellulose [23,24]. Moreover, the acquisition of T1–T2 correlation maps with a surface probe provides the assessment of water molecules volume fraction within the NMR sensitive volume (an area of about 2.0 × 0.8 cm2 up to a depth of 0.2 cm from the surface), a value strictly related to the material’s moisture content [25]. Despite the interesting opportunities offered by NMR relaxometry, this diagnostic technique has been rarely applied for investigating antique books.
It is widely acknowledged the use of infrared thermography for monitoring defects in bookbinding [26] and paper deformations [27]. Specific advanced procedures for processing raw thermograms may enhance the results obtained. In the case under analysis, we selected the higher-order statistics thermography (IRT-HOS) to identify the more damaged areas, thanks to the segmentation algorithm described in [28].
In this paper, a successful correlation between nuclear magnetic resonance relaxation and infrared thermography results is described.

2. Materials and Methods

The front board of an ancient book (Figure 1), dating back to the 19th century, with dimensions 9.0 × 16.5 × 3.6 cm, was inspected. The book has a half leather binding with embossed paper sides. The front board under examination appears discolored and stained with laminating pasteboard corners.

2.1. 2D 1H-NMR-R

NMR measurements were performed using an mq-ProFiler (Bruker Biospin, Italy), a single-sided 1H-NMR probe connected to a laptop. The probe head has a weight of only 2 kg and the portable electronics unit weighs about 10 kg. The probe, working at a Larmor frequency of 17.8 MHz, satisfies the resonant condition within the sensitive volume, an area of about 2.0 × 0.8 cm2 up to a depth of 0.2 cm. To be measured, the sample can be simply placed on the probe surface with no shape or size restriction [5].
In order to proceed with NMR analyses, we ideally subdivided the book front cover into 12 sections (see white grid lines in Figure 1), each one with dimensions 2.5 × 5.0 cm and marked as L1–L12. After seven days of previous conditioning in a climatic chamber, we acquired two sets of measures at T = 23 °C with 45% (i.e., environmental) and 100% relative humidity (RH), respectively. We performed data acquisition in the conditioned environment by placing the sensitive volume of the surface probe at the center of each Ln-section.
The radiofrequency pulse sequence adopted for collecting the correlation between the longitudinal and transverse relaxation times comprised two distinct editing parts, the evolution and the detection period. In each one, the spin system evolved under T1 and T2 relaxation mechanisms, respectively. The T1 and T2 editing parts arise from a saturation recovery and a CPMG sequence described as [saturationS-π/2-τE-(π-τE-acquisitionE-)nERD]m [3]. In this sequence, π/2 and π indicate the standard radio-frequency pulses, while saturation represents ten π/2 pulses of fixed length and inter-pulse delays geometrically decreased to prevent residual net magnetization at zero evolution time. We acquired the T1–T2 correlated signal by establishing τE, i.e., the T2 encoding time, for different τS that is the T1 encoding time. The total T2 encoding time, i.e., 2τEnE, was set to sample ~20 ms of transverse relaxation decay with 2τE = 44 µs and nE = 500. To detect a large interval of longitudinal relaxation times, the T1 encoding was performed ranging τS from 0.1 to 3600 ms, according to a geometric progression with nS = 41 different values. We averaged each signal acquisition over m = 1024 scans with a recycle delay time τRD = 2 s for improving the signal-to-noise ratio (SNR). Finally, a phase cycling for the radio-frequency pulses, and the receiver was used [23].
The nE × nS (500 × 41) two-dimensional data were processed using the 2D fast Laplace inversion (FLI) algorithm developed by Hurlimann and co-workers [3]. Datasets were elaborated thanks to an optimization method for choosing the proper smoothing coefficient value (αheel) that allows balancing the residual fitting error and the noise variance. αheel depends on measurements’ SNR and on the features of distribution actually required from experimental data. This procedure avoids artifacts arising from too large broadening or excessive separation of NMR signal density peaks.
The two datasets, acquired at 45% and 100% RH, were characterized by αheel-values within 55 and 90, respectively, along with a relative variation by a factor up to 50 within each group. Usually, a fixed criterion for the choice of the αheel enables to compare the correlated distribution functions for different samples, in spite of the differences in the optimal smoothing coefficient. In this study, the moisture contents, rather than the moisture distribution features in the relaxation times space, were preferred for effective comparison of the two RH datasets. Then, the common smoothing coefficient αheel = 90 was considered.
Since the 1H-NMR signal is proportional to the total amount of confined water molecules within the probe’s sensitive volume, for sample larger than the sensitive volume, the signal amplitude allows appraising the volume fraction occupied by water (moisture content, MC) [25]. In this work, we computed moisture contents associated with distinct ranges of relaxation times by integrating the T1–T2 correlated signal density over the corresponding intervals of relaxation times [29].

2.2. IRT-HOS

IRT measurements were conducted working in the active modality and using a long wave thermal camera (FLIR S65 HS series, 7.5–13 μm). Cold images of the book cover were recorded at the steady-state condition (23 °C and 33% RH). We placed two 250 W lamps 0.34 m far from the front facet and set the angle at 45° to obtain a suitable superposition of the beams. The heating-up phase (ten minutes) and the frame rate (one image every two seconds) were controlled through a synchronizer connected with a laptop.
During the heating up and cooling down phases, 720 raw thermograms were collected. We applied the IRT-HOS technique in Matlab® environment to all the pixels of the region of interest (ROI) for processing the raw thermograms. To this end, an ad hoc Matlab® script has been linked to the one described in [30].
The HOS approach is based on the analysis of the time profiles with no projection basis. Profiles are analyzed through their statistical behavior. Each thermo-gram is characterized by the central moments of the distribution of recorded temperatures. Subsurface defects are potentially detected by contrasts in moments up to fifth order. In particular, the fourth standardized central moment, or Kurtosis, reflects the degree to which a distribution is peaked. Kurtosis provides information regarding the height of the distribution relative to the value of its standard deviation [31]. This statistical approach helps the segmentation procedure because it summarizes the best characteristics of the whole sequence into a final image [4].
The surface temperature evolution for a defect-free area after a square pulse follows a leptokurtic distribution (in which the tails are heavier), where ambient temperature exhibits the highest frequency. The extent of contrast between defective and defect-free areas depends on differences among the corresponding surface temperature scores. It derives from the characteristic mechanisms supporting the material thermal diffusivity in standard condition and from the strength of their changes with degradation. For a sub-surface defect having a higher thermal diffusivity than the surrounding material, the distribution is more peaked, and the kurtosis value is higher for a defective than for a defect-free area. Conversely, the distribution has a wider peak, and the kurtosis value is lower for a defective than for a defect-free area in case of a defect having a lower thermal diffusivity [32].

3. Results and Discussion

3.1. 2D 1H-NMR-R Measurements and Processing

Figure 2 shows the T1–T2 correlation maps of some selected sections of the book cover, L1-, L2-, L5- and L10-, recorded after conditioning the book at 45% RH (first row) and 100% RH (second row).
All the maps exhibit the typical features of pure cellulose paper [23,24] and paper from a blank page of the inspected ancient book (see Supplementary Materials). Proton signal density forms over one separated cluster in the relaxation times space, more evidenced in the 100% RH maps rather than in those at 45% RH. This feature unambiguously confirms that in the amorphous cellulose domains there are different sites for water molecules in slow chemical exchange regime. The low-T2 population (average T2-value of about 10−4 s) is due to dynamically high restricted water molecules, fast exchanging with hydroxyl groups of the cellulose chains. The high-T2 population with T2 ≈ 10−3 s depicts few and more mobile water molecules, almost exclusively confined in the amorphous cellulose regions [11,12].
Unlike low-T2 values, independent from relative humidity degree, the high-T2 values at 100% RH are well greater than those obtained at 45% RH. This implies that with higher relative humidity percentages, a larger amount of dynamically liquid-like water permeates the available cellulose interspaces.
The dynamically different water populations, observable by T2′s, are not clear in the detected T1′s widespread (over three orders of magnitude). Anyway, in the 100% RH data set (reported in Figure 2 and Figure 3), for the high-T2′s water molecule domain, a great spread of T1′s distribution to shorter T1′s can be observed.
According to electron paramagnetic resonance studies on historical paper, such behavior may be due to low-to-moderate content of paramagnetic impurities. The latter may derive from natural or processing causes and are mostly limited in a significant fraction of the amorphous regions. [33]. For a proper description of the longitudinal relaxation data, the effects on the NMR relaxation, either from Fe3+, Cu2+, Mn2+ ions or from other paramagnetic species eventually present in the paper, should, therefore, be considered.
In each dataset, the average values of both relaxation times do not change on account of Ln-section. Then, no kind of noticeable decay process of the ancient cellulosic material is evidenced by changes in relaxation times [7,19,34].
In Figure 2 and Figure 3, greyscale bars were set to the absolute maximum intensity of all maps of both series, i.e., L5-map collected at 100% RH, to compare the proton amounts in the areas under analysis. In both datasets, in fact, the L5-section turned out to be the one with the highest signal densities, showing the greatest presence of water in both its domains. The contours are equally spaced from 10% to 90% of the maximum intensity for each map. The dash-dot line indicates the water bulk reference T1 = T2.
As regards the intensities of the T1–T2 correlation maps, the maximum intensities of the twelve maps at 100% RH resulted always higher than those at 45% RH. This further supports the idea that the amorphous domains work as a reservoir of water in paper, mainly related to the exchange of water with the environment.
The different hydration results with respect to relative humidity are shown in Figure 4a, where the one-dimensional T2-distributions are reported. They have been extracted from the T1–T2 maps for the L8-section performed at 45% (open circles) and 100% RH (closed circles).
We calculated the ordinate analyzing the integral of a cumulative part of the curve, comparable to the percentage of water volume. Therefore, equal areas correspond to the same fractions of the whole signal.
The hydration behavior on RH and on Ln-section is further evidenced by estimating the trend of the moisture content (MC). As the inspected areas are larger than the sensitive volume of the surface probe, the NMR signal amplitudes acquired on the Ln-sections allow assessing the moisture content’s spatial distribution of the cover. By integrating the signal density distribution over the full range of T1 and selected ranges of T2 (computed by deconvolution of each T2-distribution), MClow and MChigh, pertaining the low- and high-T2 water populations, respectively, were evaluated and reported in Table 1.
From the above results, we can observe that, when the relative humidity goes up, the low-T2 population increases less than 10%, while the high-T2 population gains over 120%. These data confirm that, by raising the RH percentage, the excess of water molecules quite exclusively enhances the liquid-like water component.
In Table 1, we also reported % MChigh, that is the amount of the high-T2 population with respect to the total volume fraction occupied by water in the sensitive volume of the NMR probe. It is equal to 20% at 45% RH, and 33% at 100% RH and these values are nearly constant for all the Ln-sections. Notwithstanding, for both RH datasets, a comparison between the different areas of the front cover underlines L1- and L5- section’s hydration capacity, 15% and 25% higher than the corresponding mean values computed on all the Ln-sections (last row of Table 1). As shown in Figure 4b, for L6- and L5-section obtained at 100% RH this behavior seems to be a common feature for both water phases in the amorphous cellulose network. More precisely, the low-T2 population, due to dynamically high confined water molecules fast exchanging with OH groups of the cellulose chains, and the high-T2 population linked to few and more mobile water molecules in porous amorphous cellulose fractions. As water molecules exclusively occupy amorphous domains, the larger amount of signal in L1 and L5 may be the effect of an increase of the accessible sites for both water components within the cellulose network. This could be ascribable to biochemical events that led to the cleavage of hydrogen bonds between cellulose chains of the amorphous regions [12] or to a modification of the crystalline-amorphous interfaces with an increase of the amorphous phase to the detriment of the crystalline one.
We tend to exclude that the behavior of cellulose network just described can be solely assigned to a reversible swelling process or to hygroscopic salt contamination because these phenomena are primarily expected to generate an increment of the high-T2 component.

3.2. IRT-HOS Measurements and Processing

For the front facet of the book, it was possible to estimate the kurtosis value for every pixel in the thermogram matrix to obtain an image, i.e., a kurtogram (Figure 5). The kurtogram provided an indication of the sub-surface defects, on the one hand, and of their thermal diffusivity, on the other.
In Figure 5, the sub-superficial defects have a high thermal diffusivity, which is an index of deteriorated regions [35,36]. Indeed, the kurtosis values are higher in the dark areas segmented by dotted irregular white lines. The segmentation algorithm worked in the recorded area by excluding the extreme left part of the book which belongs to the hinge.
During the segmentation procedure, in the first place, we detected the centers of the defects (i.e., the seeds marked by white crosses). Labeling of the pixels was based on the distance. Secondly, a specific threshold was obtained for every defect identified via region-growing working around those seeds, considering the peak of the distribution. In practice, the shape of each defect grew by gradually decreasing the threshold until a sudden increase of the sinks (corresponding to an agglomeration of pixels similar in intensity), or an image boundary was found.
Ultimately, the kurtogram in Figure 5 provides an indication of the sub-surface defects of the front cover through an increase of the thermal diffusivity. Thermal diffusivity measures the ability of a material to conduct thermal energy and is associated with thermal conductivity, specific heat capacity, and density. In general, bulk polymers are known to have low values of thermal diffusivity ranging in the interval of 0.1–0.5 W/mK [34] because they contain defective structures, such as amorphous regions, voids, chain ends, and entanglements, which inhibit heat propagation. Morikawa and Hashimoto [35] reported thermal diffusivity data for various bulk densities of typical cellulosic paper. As thermal diffusivity of the paper linearly decreased while the bulk density increased, this highlights the role of the air within the polymer network. In fact, the air has a higher thermal diffusivity than polymers.
Nevertheless, the water presence has likewise to be examined for explaining the spatial inhomogeneous behavior of thermal diffusivity shown in Figure 5. It is reasonable to assume that in the Ln-sections of the book cover the higher the water amount, the greater the thermal diffusivity.

4. Conclusions

In this study, we performed two-dimensional nuclear magnetic resonance relaxometry and infrared thermography, both NDT techniques, to put in evidence defects related to degradation of an ancient book cover. The non-destructive and non-invasive approach of NMR surface apparatus makes it suitable for research on library heritage. Moreover, it allows performing measurements of proton relaxation times and moisture content on specific sections of the inspected item.
Although it is not easy to mark directly relaxation time constants as unique structure anomalies of the cellulose network, some conclusions on its aging can be drawn by referring the results to the typical ranges of a good quality cellulosic material or comparing the data from areas of the same item with a different conservation status.
The NMR relaxation and IRT results can be summarized as follows:
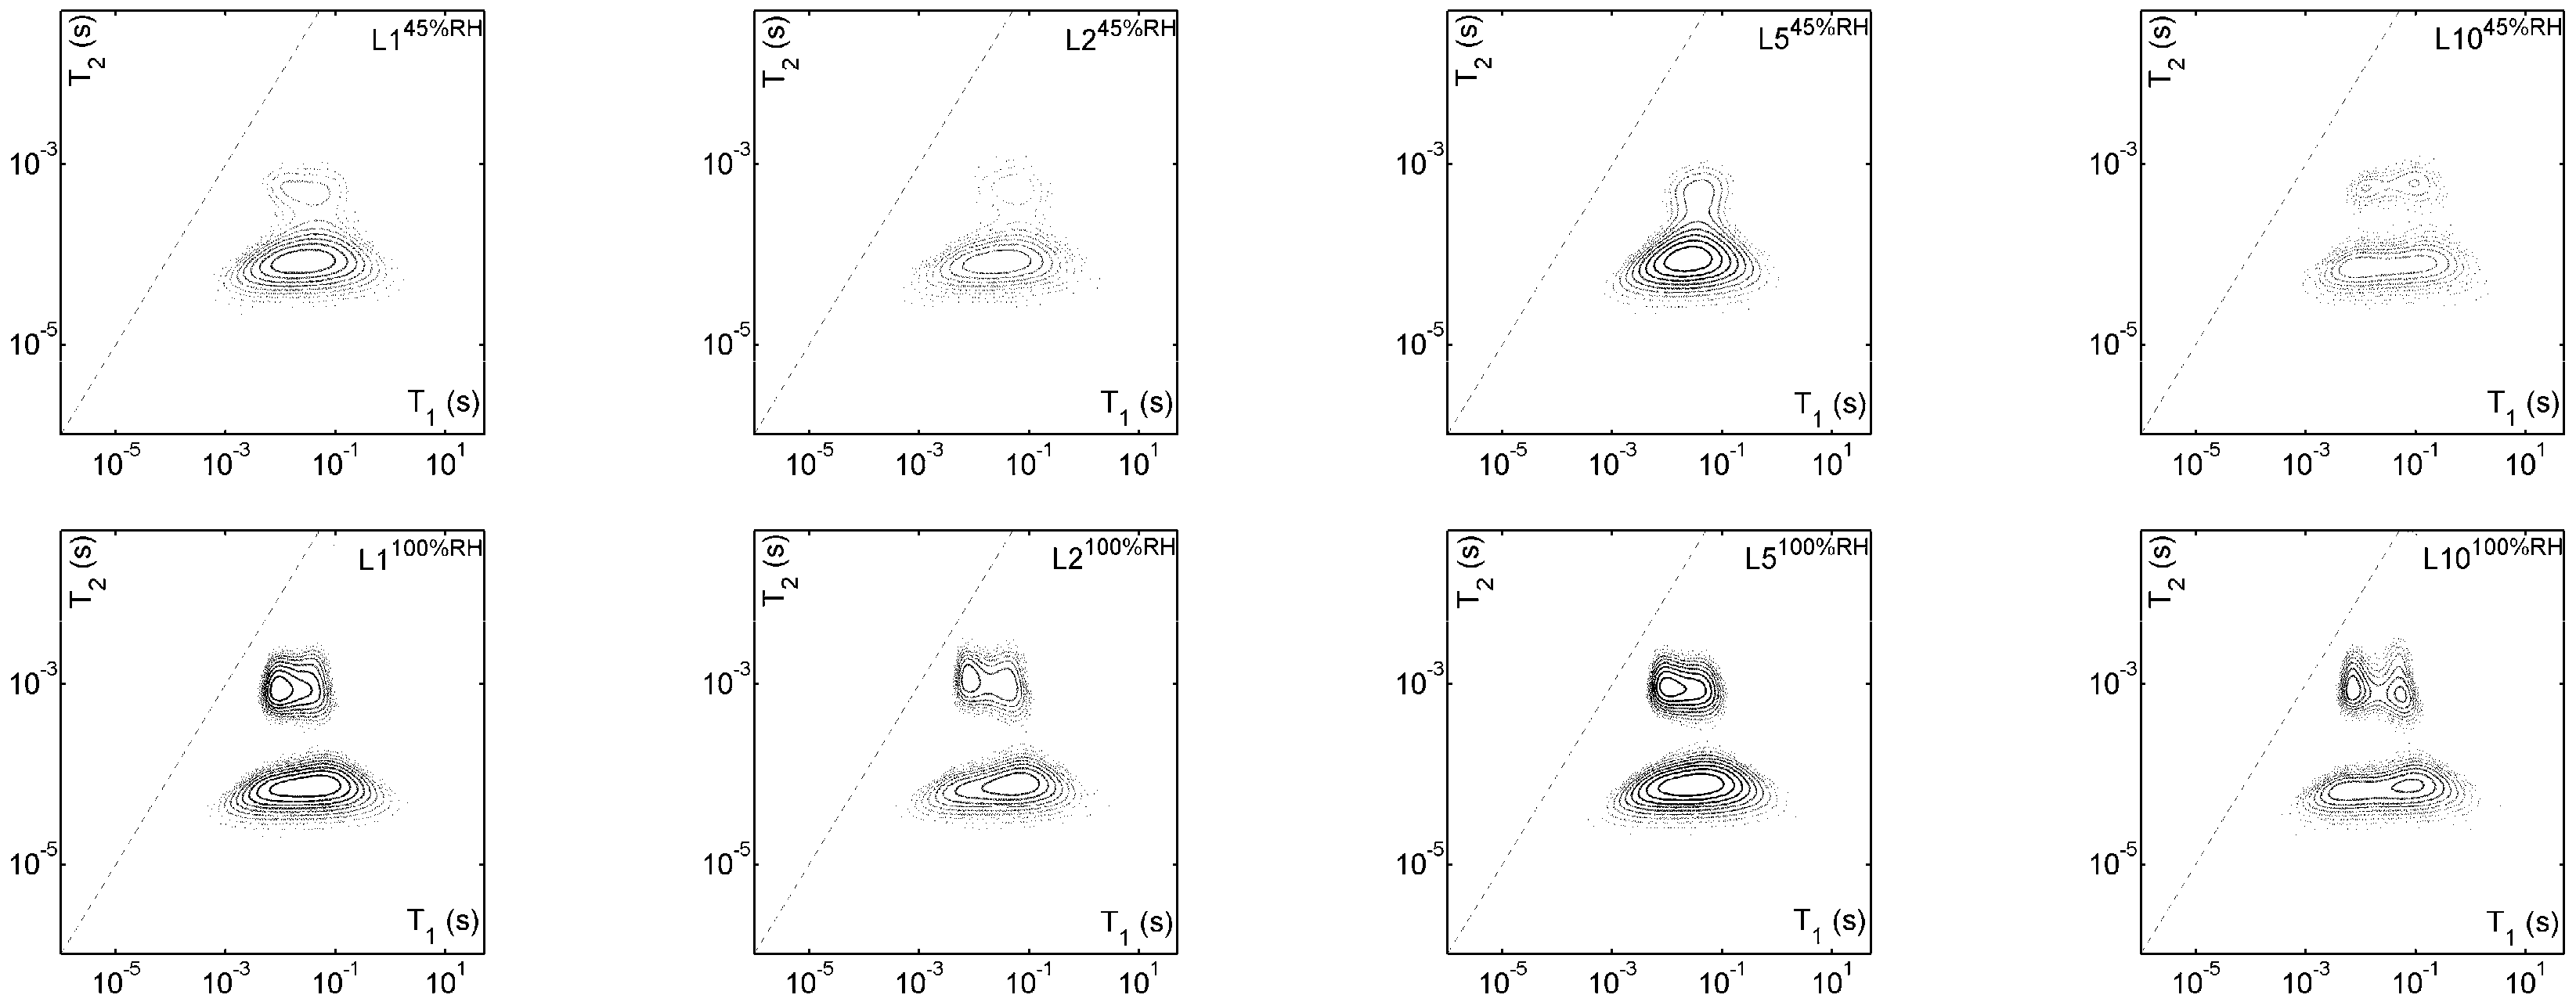
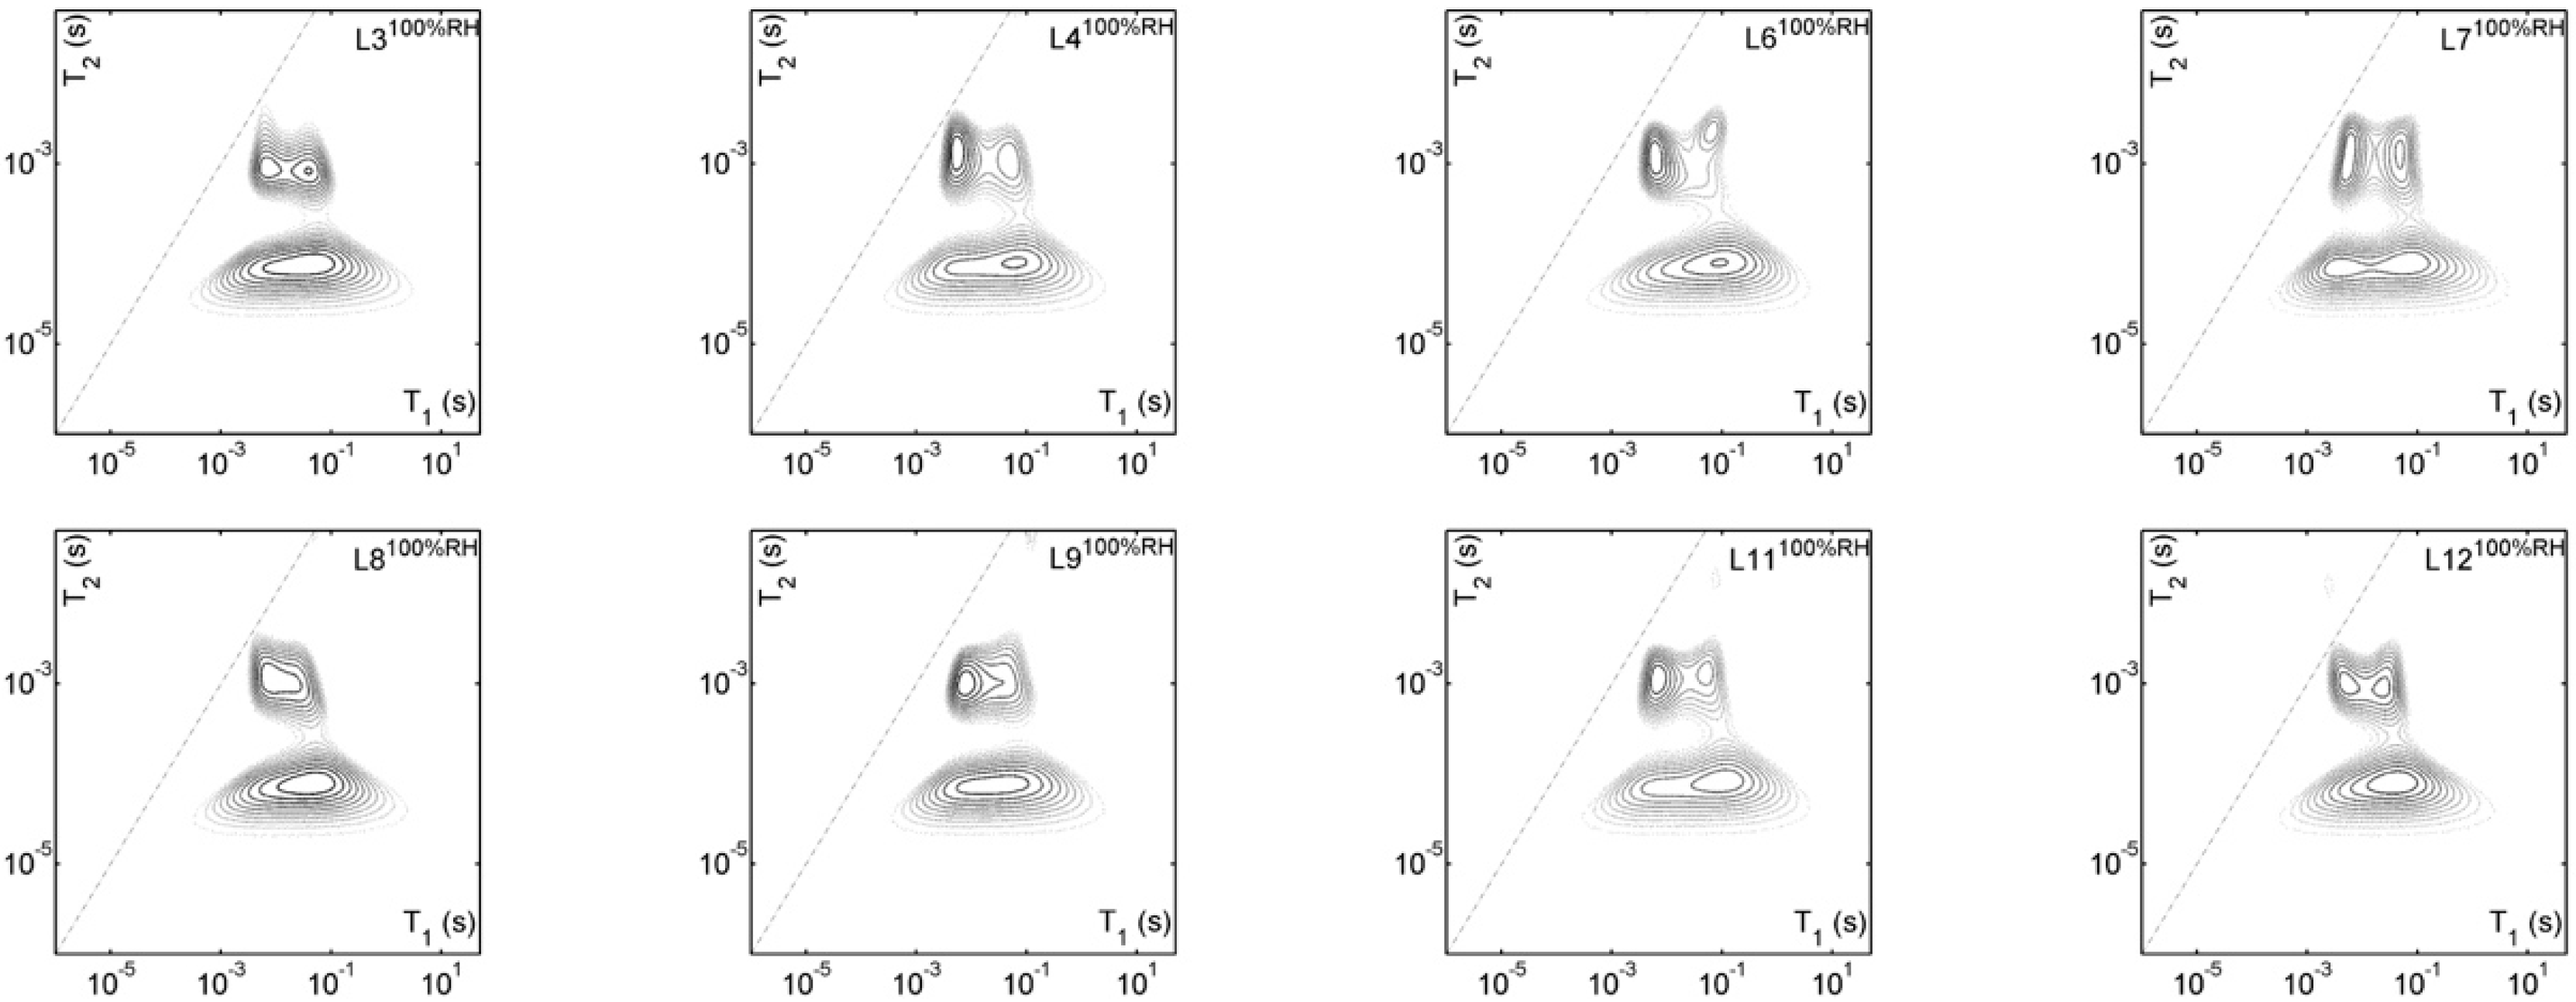
  • The 2D 1H NMR-R measurements (Figure 2 and Figure 3) performed on the twelve Ln sections showed the typical T1- and T2-values of water molecules confined in a good quality cellulose paper. In particular, the two-component T2-distribution refers to water molecules trapped among cellulose chains, both as connections set up by one or two molecules (T2-low) or as domains of few molecules, acting like free water (T2-high).
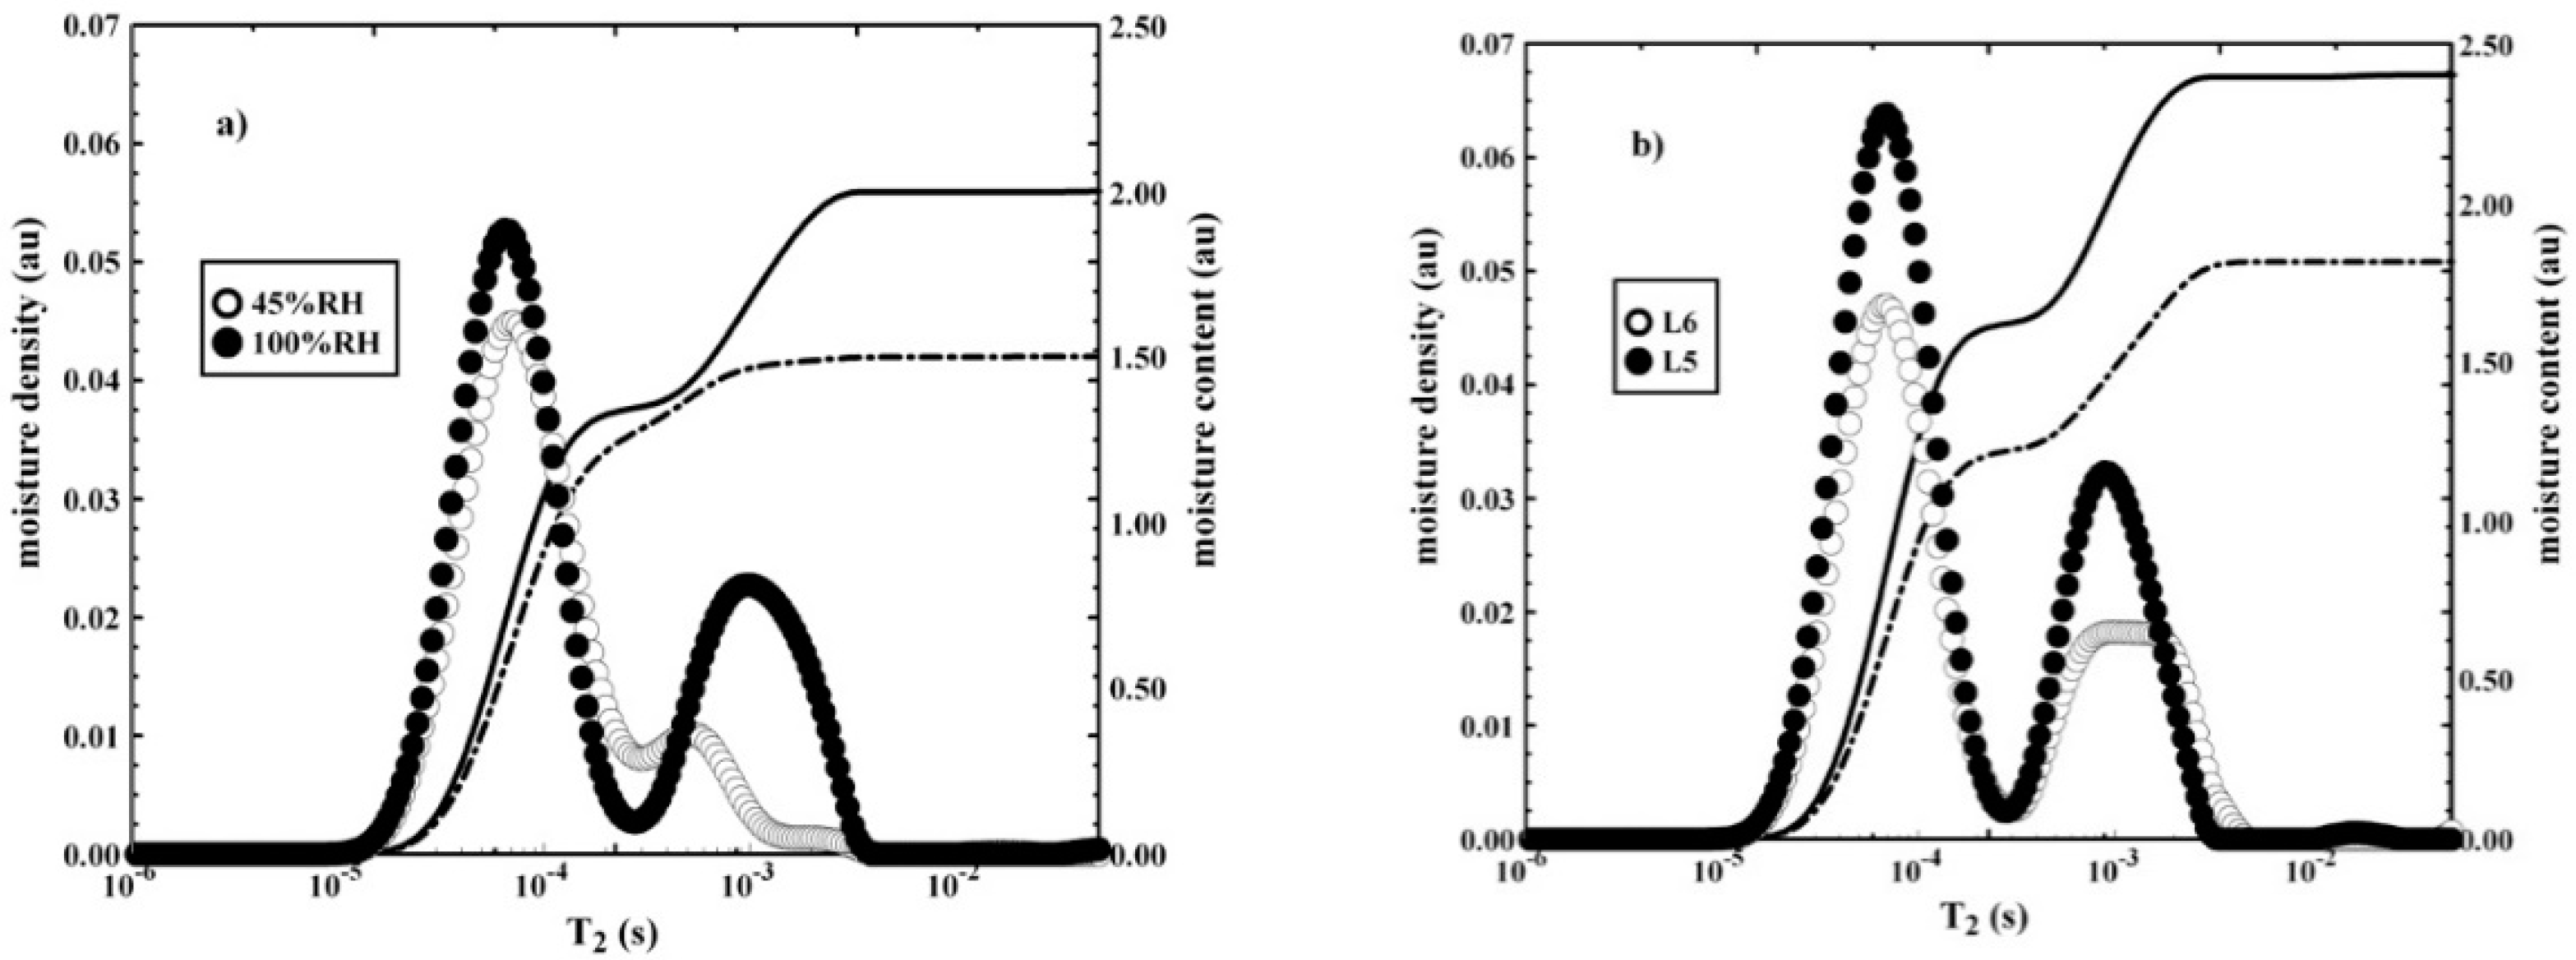
  • The influence of increasing the environmental relative humidity from 45% up to 100% on the shape evolution of the T2-distribution (Figure 4), confirms that water molecules, besides being adsorbed on cellulose surfaces, can diffuse into the macromolecular network, swell the structure, and form new hydrogen bonds.
  • Contrary to T2′s, the two water domains have a similar T1-value that is quite unrelated to RH. However, for the high-T2′s water molecule domain, we could detect a bimodal T1′s distribution, especially in the 100% RH dataset (Figure 3), apparently caused by paramagnetic impurities in the water clusters.
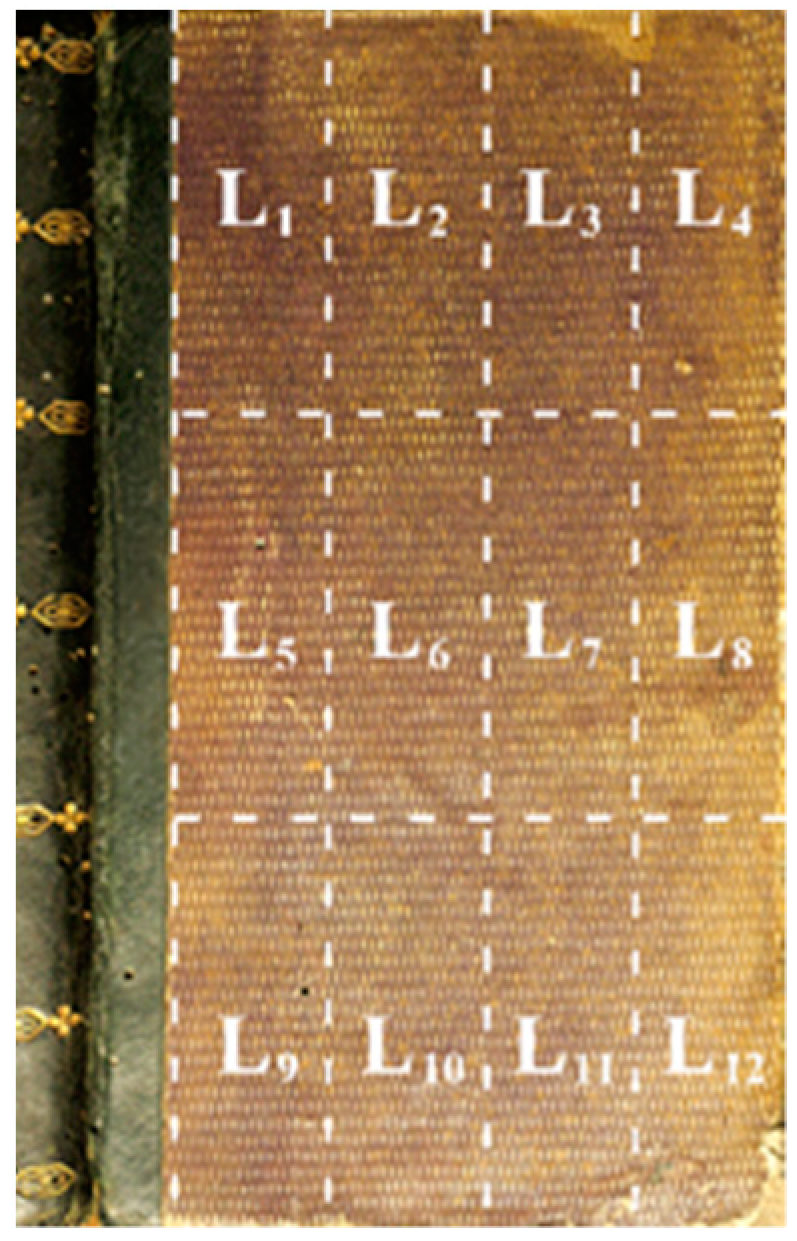
  • For both RH datasets, an evaluation of the moisture content in different areas of the front cover (Table 1) put in evidence the high hydration capacity of L1 and L5 sections compared to others. This behavior seems to be a common aspect for both water phases in the amorphous cellulose network. In our opinion, the larger amount of signal in L1 and L5 could be the effect of biological/chemical degradation phenomena that led to an increase of the amorphous phase. Though crystalline and amorphous domains are always present in cellulose, the crystalline regions are almost unavailable to moisture. Then, the amorphous structure is the sole responsible for the amount of humidity inside the cellulosic network.
  • The evaluation of kurtosis value for every pixel in the thermogram matrix provided to get the kurtogram in Figure 5. This displayed a sign of the sub-surface defects and of their thermal diffusivity.
  • To explain the spatial inhomogeneity of thermal diffusivity, we took into account not only the presence of air but also of water. In the cellulose-water system, it is reasonable to assume that thermal diffusivity gets higher because of a great water amount.
In conclusion, NMR moisture content evaluations and the statistical analysis of the IRT data, show a large matching area on the left of the inspected book cover where it is reasonable to assume that the defective areas are both sub-surface and structurally dysfunctional. Looking at the L1-and L5-sections, the highest moisture contents and thermal diffusivities support the hypothesis of crystalline-amorphous interface modification that increases the accessible sites for water molecules within the cellulose network.

Supplementary Materials

The following are available online at https://www.mdpi.com/2076-3417/9/16/3406/s1, Figure S1: paper 2D 1H-NMR T1–T2 maps. 2D 1H-NMR T1–T2 maps of a blank page of the ancient book at 45% (left) and 100% RH (right).

Author Contributions

Conceptualization, S.S. and C.C.; formal analysis, C.C.; investigation, M.T. and S.S.; visualization, M.T., S.S. and C.C.; writing—original draft, M.T. and C.C.; writing—review & editing, M.T.

Funding

This research received no external funding.

Acknowledgments

C.C. is indebted to M. Hurlimann (Schlumberger–Doll Research) for having supplied her with the 2D Laplace Inversion Software.

Conflicts of Interest

The authors declare no conflict of interest.

References

  1. Chapman, P. Guidelines on Preservation and Conservation Policies in the Archives and Libraries Heritage; UNESCO: Paris, France, 1990. [Google Scholar]
  2. Engel, P. New Approaches to Book and Paper Conservation-Restoration; Verlag Berger: Horn, Austria, 2011. [Google Scholar]
  3. Song, Y.-Q.; Venkataramanan, L.; Hurlimann, M.D.; Flaum, M.; Frulla, P.; Straley, C. T1–T2 correlation spectra obtained using a fast two-dimensional Laplace inversion. J. Magn. Reson. 2002, 154, 261–268. [Google Scholar] [CrossRef] [PubMed]
  4. Madruga, F.J.; Ibarra-Castanedo, C.; Conde, O.M.; López-Higuera, J.M.; Maldague, X. Infrared thermography processing based on higher-order statistics. NDT E Int. 2010, 43, 661–666. [Google Scholar] [CrossRef]
  5. Blümich, B.; Perlo, J.; Casanova, F. Mobile single-sided NMR. Prog. Nucl. Magn. Reson. Spectrosc. 2008, 52, 197–269. [Google Scholar] [CrossRef]
  6. Maldague, X.P.V. Theory and Practice of Infrared Thermography for Non-Destructive Testing; Wiley: New York, NY, USA, 2001. [Google Scholar]
  7. Blümich, B.; Anferova, S.; Sharma, S.; Segre, A.L.; Federici, C. Degradation of historical paper: Nondestructive analysis by the NMR-MOUSE. J. Magn. Reson. 2003, 161, 204–209. [Google Scholar] [CrossRef]
  8. Viola, I.; Bubici, S.; Casieri, C.; De Luca, F. The codex major of the collectio altaempsiana: A non-invasive NMR study of paper. J. Cult. Herit. 2004, 5, 257–261. [Google Scholar] [CrossRef]
  9. Sfarra, S.; Regi, M.; Tortora, M.; Casieri, C.; Perilli, S.; Paoletti, D. A multi-technique nondestructive approach for characterizing the state of conservation of ancient bookbindings. J. Therm. Anal. Calorim. 2018, 132, 1367–1387. [Google Scholar] [CrossRef]
  10. Klemm, D.; Philipp, B.; Heinze, T.; Heinze, U.; Wagenknecht, W. Comprehensive Cellulose Chemistry. Volume I: Fundamentals and Analytical Methods, 1st ed.; WILEY-VCH Verlag GmbH: Weinheim, Germany, 1998. [Google Scholar] [CrossRef]
  11. Hatakeyama, H.; Hatakeyama, T. Interaction between water and hydrophilic polymers. Thermochim. Acta 1998, 308, 3–22. [Google Scholar] [CrossRef]
  12. Corsaro, C.; Mallamace, D.; Vasi, S.; Pietronero, L.; Mallamace, F.; Missori, M. The role of water in the degradation process of paper using 1H HR-MAS NMR spectroscopy. Phys. Chem. Chem. Phys. 2016, 18, 33335–33343. [Google Scholar] [CrossRef]
  13. Zhang, C.; Li, P.; Zhang, Y.; Lu, F.; Li, W.; Kang, H.; Xiang, J.; Huang, Y.; Liu, R. Hierarchical porous structures in cellulose: NMR relaxometry approach. Polymers 2016, 98, 237–243. [Google Scholar] [CrossRef]
  14. Terenzi, C.; Prakobna, K.; Berglund, L.A.; Furó, I. Nanostructural effects on polymer and water dynamics in cellulose biocomposites: 2H and 13C NMR relaxometry. Biomacromolecules 2015, 16, 1506–1515. [Google Scholar] [CrossRef]
  15. Lindh, E.L.; Terenzi, C.; Salmen, L.; Furó, I. Water in cellulose: Evidence and identification of immobile and mobile adsorbed phases by 2H MAS NMR. Phys. Chem. Chem. Phys. 2017, 19, 4360–4369. [Google Scholar] [CrossRef]
  16. Brückle, I. Structure and properties of dry and wet paper. In Paper and Water: A Guide for Conservators; Banik, G., Brückle, I., Eds.; Butterworth-Heinemann: Oxford, UK, 2011; pp. 81–114. [Google Scholar]
  17. Łojewski, T.; Miskowiec, P.; Molenda, M.; Lubanska, A.; Łojewska, J. Artificial versus natural aging of paper. Water role in degradation mechanisms. Appl. Phys. A 2010, 100, 625–633. [Google Scholar] [CrossRef]
  18. Castro, K.; Princi, E.; Proietti, N.; Manso, M.; Capitani, D.; Vicini, S.; Madariaga, J.M.; De Carvalho, M.L. Assessment of the weathering effects on cellulose based materials through a multianalytical approach. Nucl. Instrum. Methods B 2011, 269, 1401–1410. [Google Scholar] [CrossRef]
  19. Paci, M.; Federici, C.; Capitani, D.; Perenze, N.; Segre, A.L. NMR study of paper. Carbohydr. Polym. 1995, 26, 289–297. [Google Scholar] [CrossRef]
  20. Capitani, D.; Segre, A.L.; Attanasio, D.; Blicharska, B.; Focher, B.; Capretti, G. 1H NMR relaxation study of paper as a system of cellulose and water. Tappi J. 1996, 79, 113–122. [Google Scholar]
  21. Capitani, D.; Proietti, N.; Ziarelli, F.; Segre, A.L. NMR study of water-filled pores in one of the most widely used polymeric material:  The paper. Macromolecules 2002, 35, 5536–5543. [Google Scholar] [CrossRef]
  22. Mallamace, D.; Vasi, S.; Missori, M.; Mallamace, F.; Corsaro, C. NMR investigation of degradation processes of ancient and modern paper at different hydration levels. Front. Phys. 2018, 13, 138202. [Google Scholar] [CrossRef]
  23. Lepore, A.; Baccaro, S.; Casieri, C.; Cemmi, A.; De Luca, F. Role of water in the aging mechanism of paper. Chem. Phys. Lett. 2012, 531, 206–209. [Google Scholar] [CrossRef]
  24. Conti, A.; Poggi, G.; Baglioni, P.; De Luca, F. On the macromolecular cellulosic network of paper: Changes induced by acid hydrolysis studied by NMR diffusometry and relaxometry. Phys. Chem. Chem. Phys. 2014, 16, 8409–8417. [Google Scholar] [CrossRef]
  25. Casieri, C.; Senni, L.; Romagnoli, M.; Santamaria, U.; De Luca, F. Determination of moisture fraction in wood by mobile NMR device. J. Magn. Reson. 2004, 171, 364–372. [Google Scholar] [CrossRef]
  26. Mercuri, F.; Zammit, U.; Orazi, N.; Paoloni, S.; Marinelli, M.; Scudieri, F. Active infrared thermography applied to the investigation of art and historic artefacts. J. Them. Anal. Calorim. 2011, 104, 475–485. [Google Scholar] [CrossRef]
  27. Yamauchi, T.; Okumura, S.; Noguchi, M. Application of thermography to the deforming process of paper materials. J. Mater. Sci. 1993, 28, 4549–4552. [Google Scholar] [CrossRef]
  28. Maldague, X.; Krapez, J.C.; Poussart, D. Thermographic nondestructive evaluation (NDE): An algorithm for automatic for automatic defect extraction in infrared images. IEEE Trans. Syst. Man Cybern. 1990, 20, 722–725. [Google Scholar] [CrossRef]
  29. Terenzi, C.; Casieri, C.; De Luca, F.; Quaresima, R.; Quarta, G. Firing-induced microstructural properties of quasi-diamagnetic carbonate-based porous ceramics: A 1H NMR relaxation correlation study. Appl. Magn. Reson. 2015, 46, 1159–1178. [Google Scholar] [CrossRef]
  30. Klein, M.; Ibarra-Castanedo, C.; Maldague, X.P.; Bendada, A. A straightforward graphical user interface for basic and advanced signal processing of thermographic infrared sequences. In Thermosense XXX, Proceedings of the SPIE Defense and Security Symposium, Orlando, FL, USA, 16–20 March 2008; Vavilov, V.P., Burleigh, D.D., Eds.; SPIE: Bellingham, WA, USA, 2008. [Google Scholar] [CrossRef]
  31. Darlington, R.B. Is kurtosis really “peakedness”? Am. Stat. 1970, 24, 19–22. [Google Scholar] [CrossRef]
  32. Madruga, F.; Ibarra-Castanedo, C.; Conde, O.M.; Maldague, X.P.; López-Higuera, J.M. Enhanced contrast detection of subsurface defects by pulsed infrared thermography based on the fourth order statistic moment, kurtosis. In Thermosense XXXI; Burleigh, D.D., Dinwiddie, R.B., Eds.; E-print: Baltimore, MD, USA, 2009. [Google Scholar] [CrossRef]
  33. Attanasio, D.; Capitani, D.; Federici, C.; Segre, A.L. Electron spin resonance study of paper samples dating from the fifteenth to the eighteenth century. Archaeometry 1995, 37, 377–384. [Google Scholar] [CrossRef]
  34. Casieri, C.; Bubici, S.; Viola, I.; De Luca, F. A low-resolution non-invasive NMR characterization of ancient paper. Solid State Nucl. Magn. 2004, 26, 65–73. [Google Scholar] [CrossRef]
  35. Sheng, C.K.; Mat Yunus, W.M. Thermal diffusivity measurement of the commercial papers using photoacoustic technique. Pertanika J. Sci. Technol. 2002, 10, 161–166. [Google Scholar]
  36. Morikawa, J.; Hashimoto, T. Thermal diffusivity measurement of papers by an AC Joule heating method. Polym. Int. 1999, 45, 207–210. [Google Scholar] [CrossRef]
Figure 1. The book front cover. It was ideally divided into twelve, L1–L12, sections (white grid lines) for performing nuclear magnetic resonance (NMR) measurements and linked to infrared thermography (IRT) inspections.
Applsci 09 03406 g001
Figure 2. Two-dimensional nuclear magnetic resonance (2D 1H-NMR) T1–T2 maps of L1-, L2-, L5- and L10-sections collected at 45% (first row) and 100% (second row) relative humidity. The common greyscale bars are set to the highest intensity of both series, i.e., L5-map’s intensity acquired at 100% relative humidity (RH). The contours are equally spaced from 10% to 90% of the maximum intensity for each map. The dash-dot line corresponds to T1 = T2.
Applsci 09 03406 g002
Figure 3. 2D 1H-NMR T1–T2 maps of L3--, L4-, L6-, L7-, L8-, L9-, L11- and L12-sections acquired at 100% RH. The graphic layout of the maps is the same as in Figure 2.
Applsci 09 03406 g003
Figure 4. 1H-NMR T2-distributions of (a) L8-section acquired at 45% (open circles) and 100% (closed circles) RH, (b) L6-section (open circles) and L5-section (closed circles) acquired at 100% RH. The corresponding integrals over T2 are also reported.
Applsci 09 03406 g004
Figure 5. Kurtogram result pointed out by a segmentation procedure. White grid lines indicate the Ln-sections used for performing NMR measurements.
Applsci 09 03406 g005
Table 1. NMR moisture contents pertaining to the low- and high-T2 water populations (MClow and MChigh) of each Ln-section. Data refer to measurements performed at 45% and 100% RH.
45% RH100% RH
MClowMChighMCtot%MChighMClowMChighMCtot%MChigh
L11.290.321.610.201.470.742.220.34
L21.050.251.310.191.220.591.810.33
L31.170.291.460.201.330.621.960.32
L41.290.241.530.151.200.651.850.35
L51.520.341.860.181.620.782.400.32
L61.080.281.360.201.220.591.820.33
L71.280.291.580.181.230.641.860.34
L81.260.231.500.161.350.652.000.33
L91.110.341.460.231.230.691.920.36
L100.990.321.310.241.170.581.750.33
L111.240.291.530.191.210.581.780.32
L121.280.301.590.191.190.591.780.33
m ±σ1.21 ± 0.140.29 ± 0.041.51 ± 0.150.19 ± 0.031.29 ± 0.140.64 ± 0.071.93 ± 0.200.33 ± 0.01

