TiO2/ZnO Nanofibers Prepared by Electrospinning and Their Photocatalytic Degradation of Methylene Blue Compared with TiO2 Nanofibers

 ,
,
Abstract
:1. Introduction
2. Materials and Methods
2.1. Electrospinning Process
2.2. Evaluation of Photocatalytic Efficiency
3. Results
3.1. TiO2/ZnO Nanofibers
3.2. Photocatalytic Performance Evaluation
4. Conclusions
Author Contributions
Funding
Acknowledgments
Conflicts of Interest
References
- Griffiths, W.; Bennett, A.; Speight, S.; Parks, S. Determining the performance of a commercial air purification system for reducing airborne contamination using model micro-organisms: A new test methodology. J. Hosp. Infect. 2005, 61, 242–247. [Google Scholar] [CrossRef] [PubMed]
- Khalil, L.; Mourad, W.; Rophael, M. Photocatalytic reduction of environmental pollutant cr (vi) over some semiconductors under uv/visible light illumination. Appl. Catal. B Environ. 1998, 17, 267–273. [Google Scholar] [CrossRef]
- Phillips, M.; Gleeson, K.; Hughes, J.M.B.; Greenberg, J.; Cataneo, R.N.; Baker, L.; McVay, W.P. Volatile organic compounds in breath as markers of lung cancer: A cross-sectional study. Lancet 1999, 353, 1930–1933. [Google Scholar] [CrossRef]
- Fukuzumi, S.; Ohkubo, K. Selective photocatalytic reactions with organic photocatalysts. Chem. Sci. 2013, 4, 561–574. [Google Scholar] [CrossRef]
- Hashimoto, K.; Kawai, T.; Sakata, T. Photocatalytic reactions of hydrocarbons and fossil fuels with water. Hydrogen production and oxidation. J. Phys. Chem. 1984, 88, 4083–4088. [Google Scholar] [CrossRef]
- Ohko, Y.; Hashimoto, K.; Fujishima, A. Kinetics of photocatalytic reactions under extremely low-intensity uv illumination on titanium dioxide thin films. J. Phys. Chem. A 1997, 101, 8057–8062. [Google Scholar] [CrossRef]
- Tachikawa, T.; Fujitsuka, M.; Majima, T. Mechanistic insight into the TiO2 photocatalytic reactions: Design of new photocatalysts. J. Phys. Chem. C 2007, 111, 5259–5275. [Google Scholar] [CrossRef]
- Behnajady, M.; Modirshahla, N.; Hamzavi, R. Kinetic study on photocatalytic degradation of ci acid yellow 23 by zno photocatalyst. J. Hazard. Mater. 2006, 133, 226–232. [Google Scholar] [CrossRef]
- Jassby, D.; Farner Budarz, J.; Wiesner, M. Impact of aggregate size and structure on the photocatalytic properties of TiO2 and ZnO nanoparticles. Environ. Sci. Technol. 2012, 46, 6934–6941. [Google Scholar] [CrossRef]
- Miyauchi, M.; Nakajima, A.; Watanabe, T.; Hashimoto, K. Photocatalysis and photoinduced hydrophilicity of various metal oxide thin films. Chem. Mater. 2002, 14, 2812–2816. [Google Scholar] [CrossRef]
- Ohno, T.; Sarukawa, K.; Tokieda, K.; Matsumura, M. Morphology of a TiO2 photocatalyst (degussa, p-25) consisting of anatase and rutile crystalline phases. J. Catal. 2001, 203, 82–86. [Google Scholar] [CrossRef]
- Qu, Y.; Duan, X. Progress, challenge and perspective of heterogeneous photocatalysts. Chem. Soc. Rev. 2013, 42, 2568–2580. [Google Scholar] [CrossRef] [PubMed]
- Ramírez-Ortega, D.; Meléndez, A.M.; Acevedo-Peña, P.; González, I.; Arroyo, R. Semiconducting properties of zno/tio2 composites by electrochemical measurements and their relationship with photocatalytic activity. Electrochim. Acta 2014, 140, 541–549. [Google Scholar] [CrossRef]
- Shan, G.; Yan, S.; Tyagi, R.; Surampalli, R.Y.; Zhang, T.C. Applications of nanomaterials in environmental science and engineering. Pract. Period. Hazard. Toxic Radioact. Waste Manag. 2009, 13, 110–119. [Google Scholar] [CrossRef]
- William, L., IV; Kostedt, I.; Ismail, A.A.; Mazyck, D.W. Impact of heat treatment and composition of ZnO−TiO2 nanoparticles for photocatalytic oxidation of an azo dye. Ind. Eng. Chem. Res. 2008, 47, 1483–1487. [Google Scholar]
- Tang, H.; Yan, F.; Tai, Q.; Chan, H.L. The improvement of glucose bioelectrocatalytic properties of platinum electrodes modified with electrospun TiO2 nanofibers. Biosens. Bioelectron. 2010, 25, 1646–1651. [Google Scholar] [CrossRef]
- Gouma, P.-I. Nanomaterials for Chemical Sensors and Biotechnology; Pan Stanford Publishing: Singapore, 2010. [Google Scholar]
- Lin, Z.-H.; Xie, Y.; Yang, Y.; Wang, S.; Zhu, G.; Wang, Z.L. Enhanced triboelectric nanogenerators and triboelectric nanosensor using chemically modified TiO2 nanomaterials. ACS Nano 2013, 7, 4554–4560. [Google Scholar] [CrossRef]
- Qiu, J.; Zhang, S.; Zhao, H. Recent applications of TiO2 nanomaterials in chemical sensing in aqueous media. Sens. Actuators B Chem. 2011, 160, 875–890. [Google Scholar] [CrossRef]
- Bignozzi, C.A.; Dissette, V. Material, Item and Products Comprising a Composition Having Anti-Microbial Properties. U.S. Patent No. 8,389,022, 5 March 2013. [Google Scholar]
- Bian, S.-W.; Mudunkotuwa, I.A.; Rupasinghe, T.; Grassian, V.H. Aggregation and dissolution of 4 nm zno nanoparticles in aqueous environments: Influence of ph, ionic strength, size, and adsorption of humic acid. Langmuir 2011, 27, 6059–6068. [Google Scholar] [CrossRef]
- Wu, C.-M.; Baltrusaitis, J.; Gillan, E.G.; Grassian, V.H. Sulfur dioxide adsorption on zno nanoparticles and nanorods. J. Phys. Chem. C 2011, 115, 10164–10172. [Google Scholar] [CrossRef]
- Weintraub, B.; Zhou, Z.; Li, Y.; Deng, Y. Solution synthesis of one-dimensional zno nanomaterials and their applications. Nanoscale 2010, 2, 1573–1587. [Google Scholar] [CrossRef] [PubMed]
- Chopra, N.; Gavalas, V.G.; Bachas, L.G.; Hinds, B.J.; Bachas, L.G. Functional one-dimensional nanomaterials: Applications in nanoscale biosensors. Anal. Lett. 2007, 40, 2067–2096. [Google Scholar] [CrossRef]
- Gibson, P.; Schreuder-Gibson, H.; Rivin, D. Transport properties of porous membranes based on electrospun nanofibers. Colloids Surf. A Physicochem. Eng. Asp. 2001, 187, 469–481. [Google Scholar] [CrossRef]
- Long, Y.-Z.; Li, M.-M.; Gu, C.; Wan, M.; Duvail, J.-L.; Liu, Z.; Fan, Z. Recent advances in synthesis, physical properties and applications of conducting polymer nanotubes and nanofibers. Prog. Polym. Sci. 2011, 36, 1415–1442. [Google Scholar] [CrossRef]
- Hwang, T.-H.; Kim, W.-T.; Choi, W.-Y. Photoconversion of dye-sensitized solar cells with a 3d-structured photoelectrode consisting of both TiO2 nanofibers and nanoparticles. J. Electron. Mater. 2016, 45, 3195–3199. [Google Scholar] [CrossRef]
- Kim, B.-Y.; Yoon, J.-W.; Lee, C.; Park, J.-S.; Lee, J.-H. Trimethylamine sensing characteristics of molybdenum doped ZnO hollow nanofibers prepared by electrospinning. J. Sens. Sci. Technol. 2015, 24, 419–422. [Google Scholar] [CrossRef]
- Kim, W.-T.; Choi, W.-Y. Fabrication of TiO2 photonic crystal by anodic oxidation and their optical sensing properties. Sens. Actuators A Phys. 2017, 260, 178–184. [Google Scholar] [CrossRef]
- Choi, W.-Y.; Chung, J.; Cho, C.-H.; Kim, J.-O. Fabrication and photocatalytic activity of a novel nanostructured TiO2 metal membrane. Desalination 2011, 279, 359–366. [Google Scholar] [CrossRef]
- Hu, J.; Odom, T.W.; Lieber, C.M. Chemistry and physics in one dimension: Synthesis and properties of nanowires and nanotubes. Acc. Chem. Res. 1999, 32, 435–445. [Google Scholar] [CrossRef]
- Lu, X.; Wang, C.; Wei, Y. One-dimensional composite nanomaterials: Synthesis by electrospinning and their applications. Small 2009, 5, 2349–2370. [Google Scholar] [CrossRef]
- Ramaseshan, R.; Sundarrajan, S.; Jose, R.; Ramakrishna, S. Nanostructured ceramics by electrospinning. J. Appl. Phys. 2007, 102, 7. [Google Scholar] [CrossRef]
- Hwang, T.-H.; Kim, W.-T.; Choi, W.-Y. Mixed dimensionality with a TiO2 nanostructure and carbon nanotubes for the photoelectrode in dye-sensitized solar cells. J. Nanosci. Nanotechnol. 2017, 17, 4812–4816. [Google Scholar] [CrossRef]
- Kim, W.-T.; Hwang, T.-H.; Choi, W.-Y. Composite photoelectrode with TiO2 nanofibers and nanoparticles in dye-sensitized solar cells. Sci. Adv. Mater. 2018, 10, 210–214. [Google Scholar] [CrossRef]
- Nakata, K.; Fujishima, A. TiO2 photocatalysis: Design and applications. J. Photochem. Photobiol. C Photochem. Rev. 2012, 13, 169–189. [Google Scholar] [CrossRef]
- Zhang, M.; Shao, C.; Mu, J.; Zhang, Z.; Guo, Z.; Zhang, P.; Liu, Y. One-dimensional Bi2MoO6/TiO2 hierarchical heterostructures with enhanced photocatalytic activity. CrystEngComm 2012, 14, 605–612. [Google Scholar] [CrossRef]
- Li, H.; Zhang, W.; Li, B.; Pan, W. Diameter-dependent photocatalytic activity of electrospun TiO2 nanofiber. J. Am. Ceram. Soc. 2010, 93, 2503–2506. [Google Scholar] [CrossRef]
- Doshi, J.; Reneker, D.H. Electrospinning process and applications of electrospun fibers. J. Electrost. 1995, 35, 151–160. [Google Scholar] [CrossRef]
- Ramakrishna, S. An Introduction To Electrospinning And Nanofibers; World Scientific: Singapore, 2005. [Google Scholar]
- Luo, C.; Stoyanov, S.D.; Stride, E.; Pelan, E.; Edirisinghe, M. Electrospinning versus fibre production methods: From specifics to technological convergence. Chem. Soc. Rev. 2012, 41, 4708–4735. [Google Scholar] [CrossRef]
- Persano, L.; Camposeo, A.; Tekmen, C.; Pisignano, D. Industrial upscaling of electrospinning and applications of polymer nanofibers: A review. Macromol. Mater. Eng. 2013, 298, 504–520. [Google Scholar] [CrossRef]
- Nayak, R.; Padhye, R.; Kyratzis, I.L.; Truong, Y.B.; Arnold, L. Recent advances in nanofibre fabrication techniques. Text. Res. J. 2012, 82, 129–147. [Google Scholar] [CrossRef]
- Bognitzki, M.; Czado, W.; Frese, T.; Schaper, A.; Hellwig, M.; Steinhart, M.; Greiner, A.; Wendorff, J.H. Nanostructured fibers via electrospinning. Adv. Mater. 2001, 13, 70–72. [Google Scholar] [CrossRef]
- Spivak, A.; Dzenis, Y.; Reneker, D. Model of steady state jet in the electrospinning process. Mech. Res. Commun. 2000, 27, 37–42. [Google Scholar] [CrossRef]
- Liu, R.; Ye, H.; Xiong, X.; Liu, H. Fabrication of TiO2/ZnO composite nanofibers by electrospinning and their photocatalytic property. Mater. Chem. Phys. 2010, 121, 432–439. [Google Scholar] [CrossRef]
- Wang, S.; Yun, J.-H.; Luo, B.; Butburee, T.; Peerakiatkhajohn, P.; Thaweesak, S.; Xiao, M.; Wang, L. Recent progress on visible light responsive heterojunctions for photocatalytic applications. J. Mater. Sci. Technol. 2017, 33, 1–22. [Google Scholar] [CrossRef]
- Ke, J.; Younis, M.A.; Kong, Y.; Zhou, H.; Liu, J.; Lei, L.; Hou, Y. Nanostructured ternary metal tungstate-based photocatalysts for environmental purification and solar water splitting: A review. Nano-Micro Lett. 2018, 10, 69. [Google Scholar] [CrossRef]
- Wang, H.; Zhang, L.; Chen, Z.; Hu, J.; Li, S.; Wang, Z.; Liu, J.; Wang, X. Semiconductor heterojunction photocatalysts: Design, construction, and photocatalytic performances. Chem. Soc. Rev. 2014, 43, 5234–5244. [Google Scholar] [CrossRef]
- Ullah, R.; Dutta, J. Photocatalytic degradation of organic dyes with manganese-doped ZnO nanoparticles. J. Hazard. Mater. 2008, 156, 194–200. [Google Scholar] [CrossRef]
- Yogi, C.; Kojima, K.; Wada, N.; Tokumoto, H.; Takai, T.; Mizoguchi, T.; Tamiaki, H. Photocatalytic degradation of methylene blue by TiO2 film and Au particles-TiO2 composite film. Thin Solid Film. 2008, 516, 5881–5884. [Google Scholar] [CrossRef]


| Variable | Voltage (kV) | Flow Rate (mL/h) | Acetic Acid (wt %) |
|---|---|---|---|
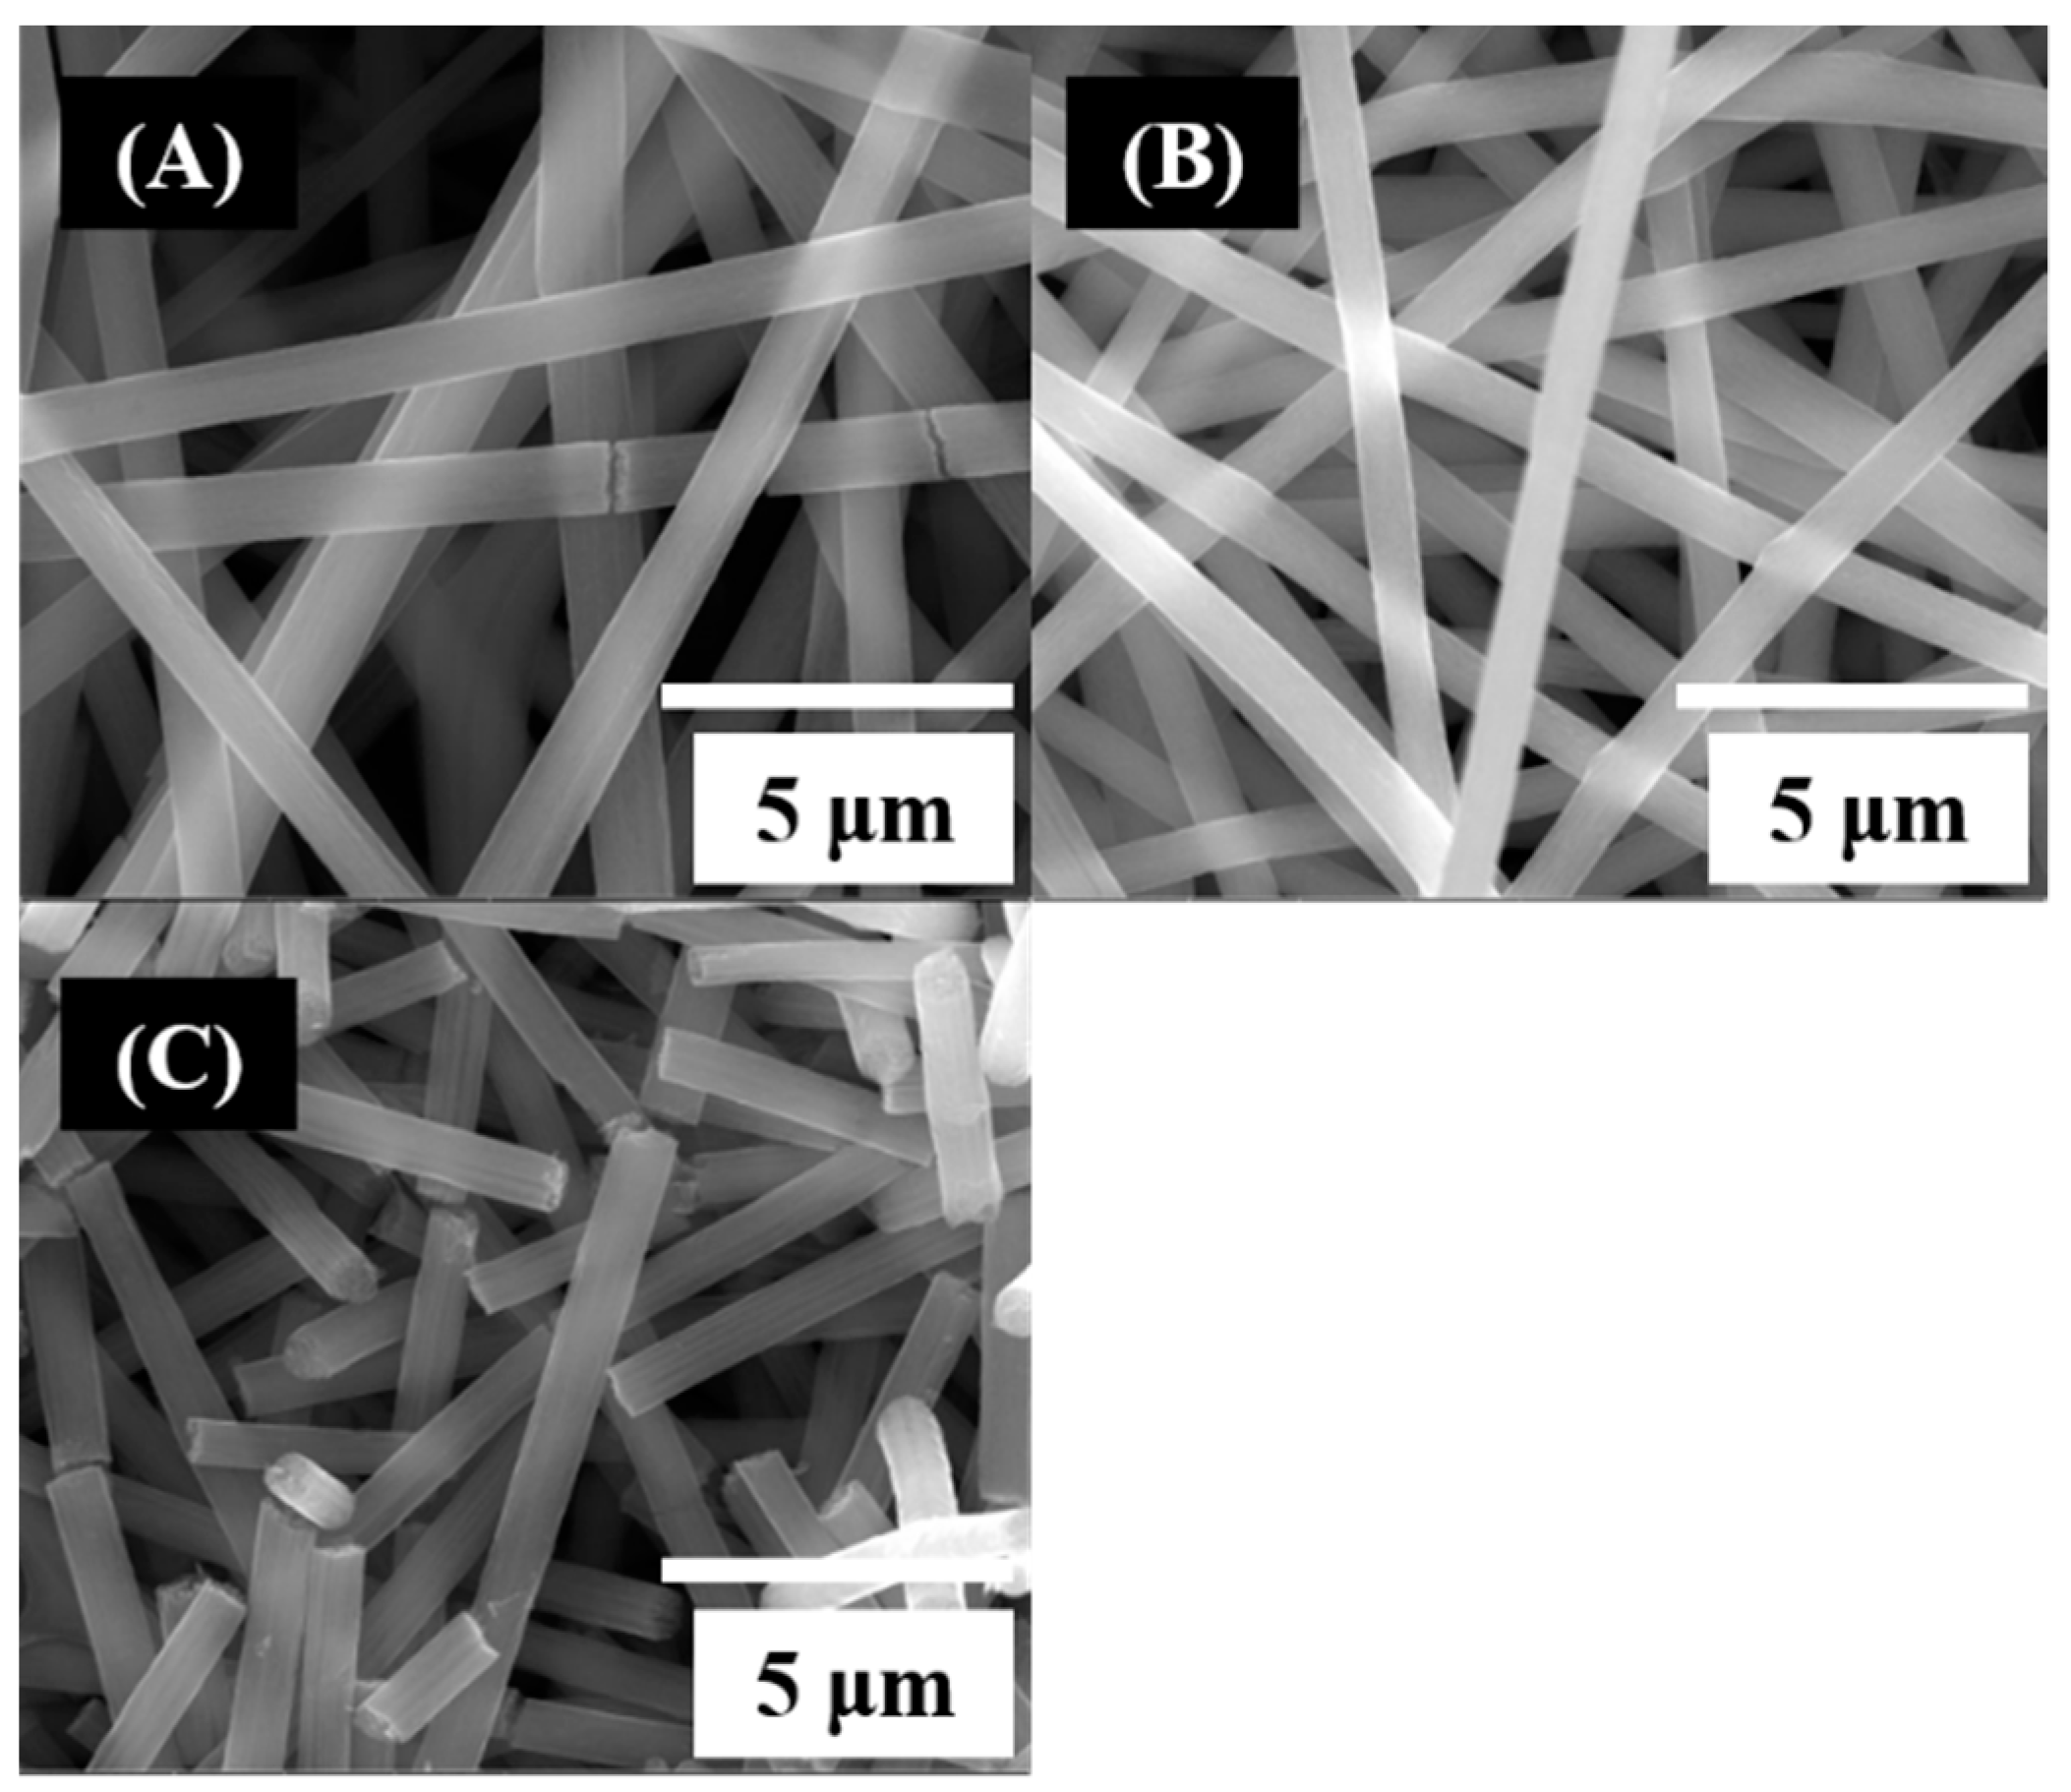
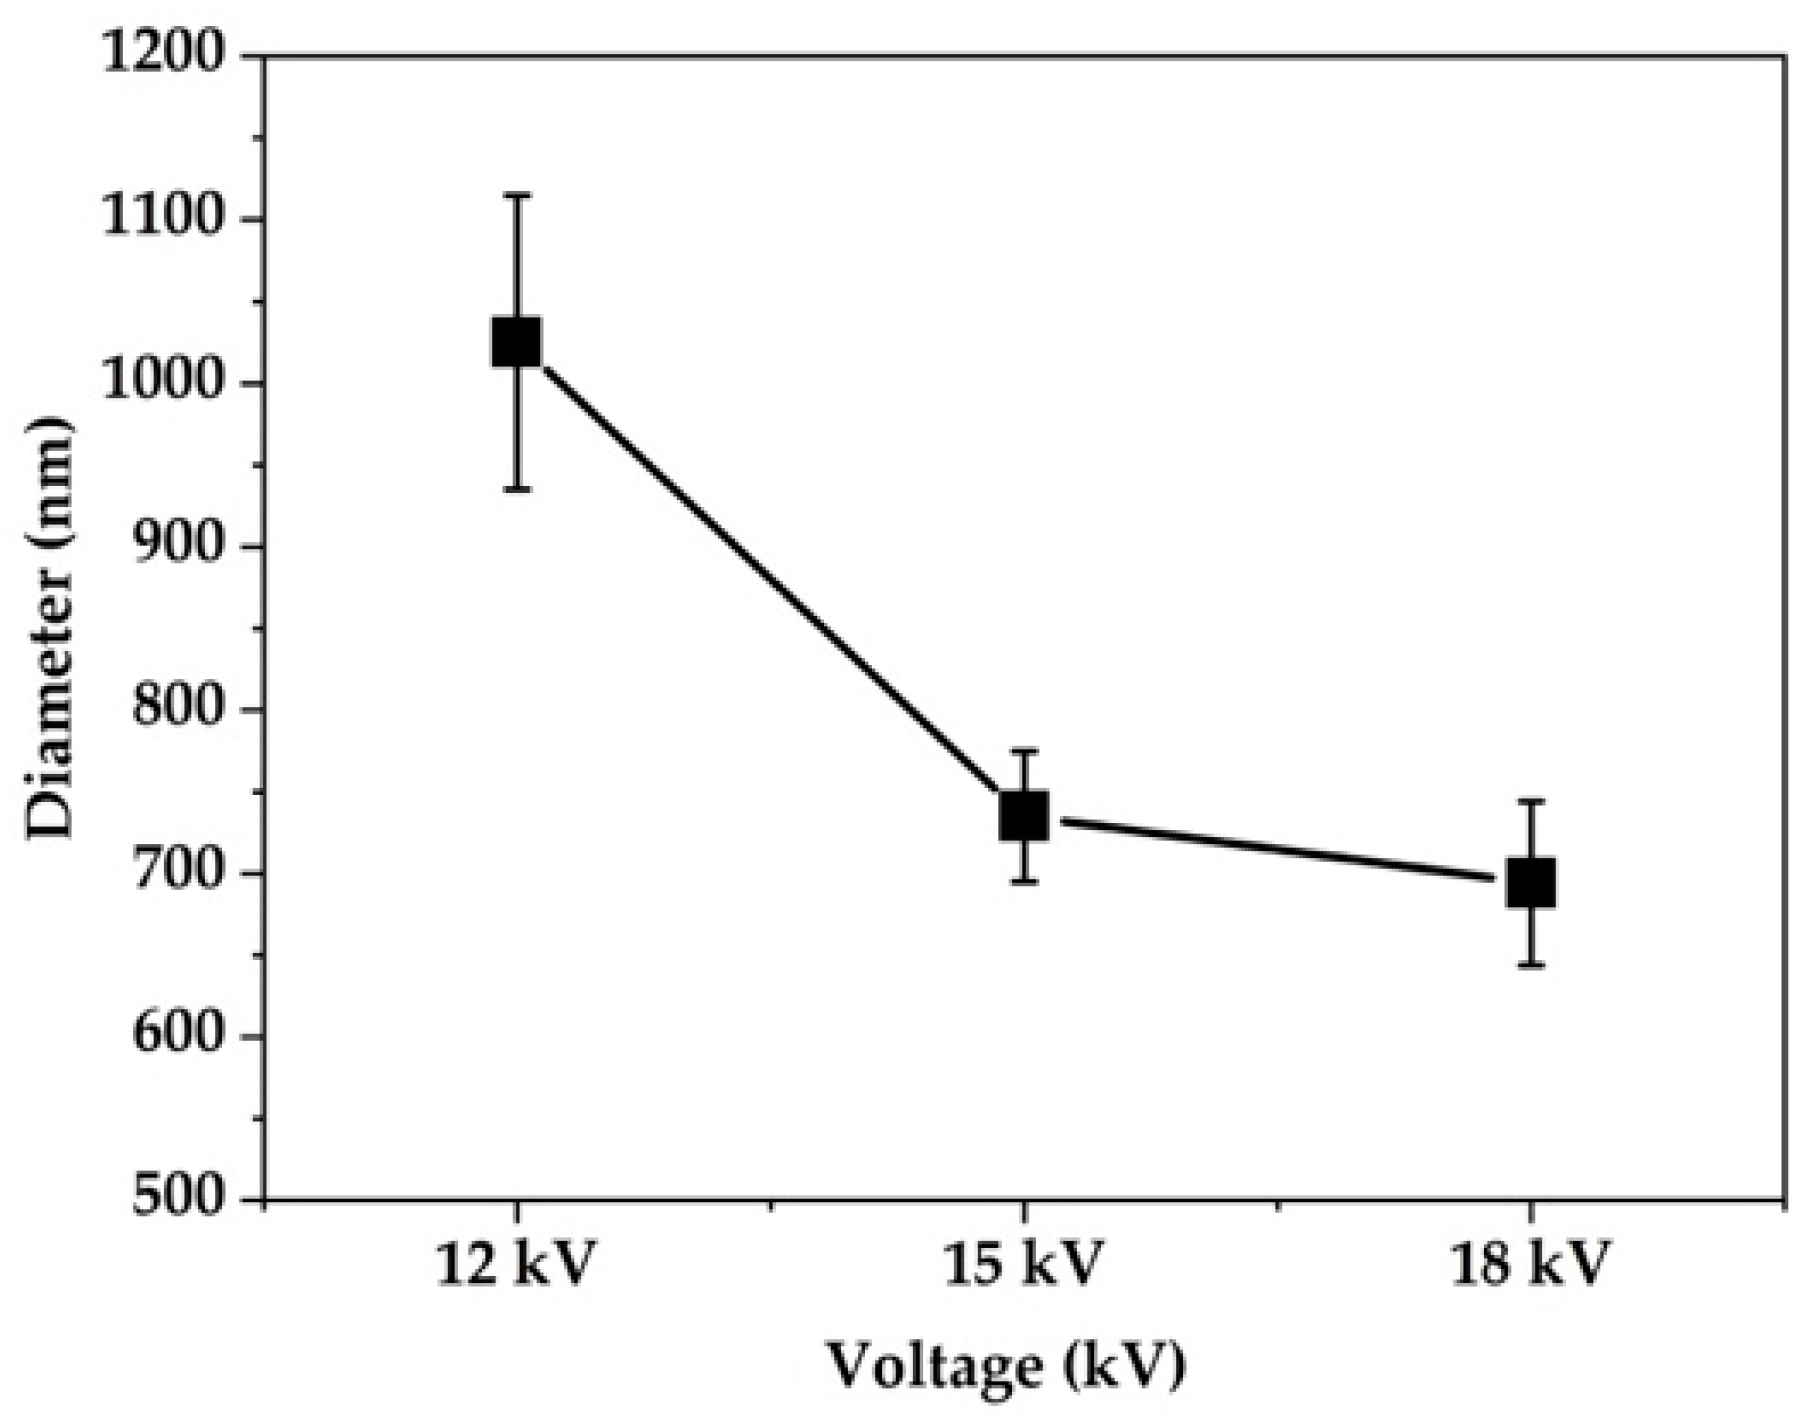
| Voltage | 12 | 1 | 21 |
| 15 | 1 | 21 | |
| 18 | 1 | 21 | |
| Flow rate | 12 | 1 | 21 |
| 12 | 0.8 | 21 | |
| 12 | 0.6 | 21 | |
| Acetic acid | 12 | 1 | 21 |
| 12 | 1 | 28 | |
| 12 | 1 | 35 |
| Voltage (kV) | Flow Rate (mL/h) | Acetic Acid (wt %) | |
|---|---|---|---|
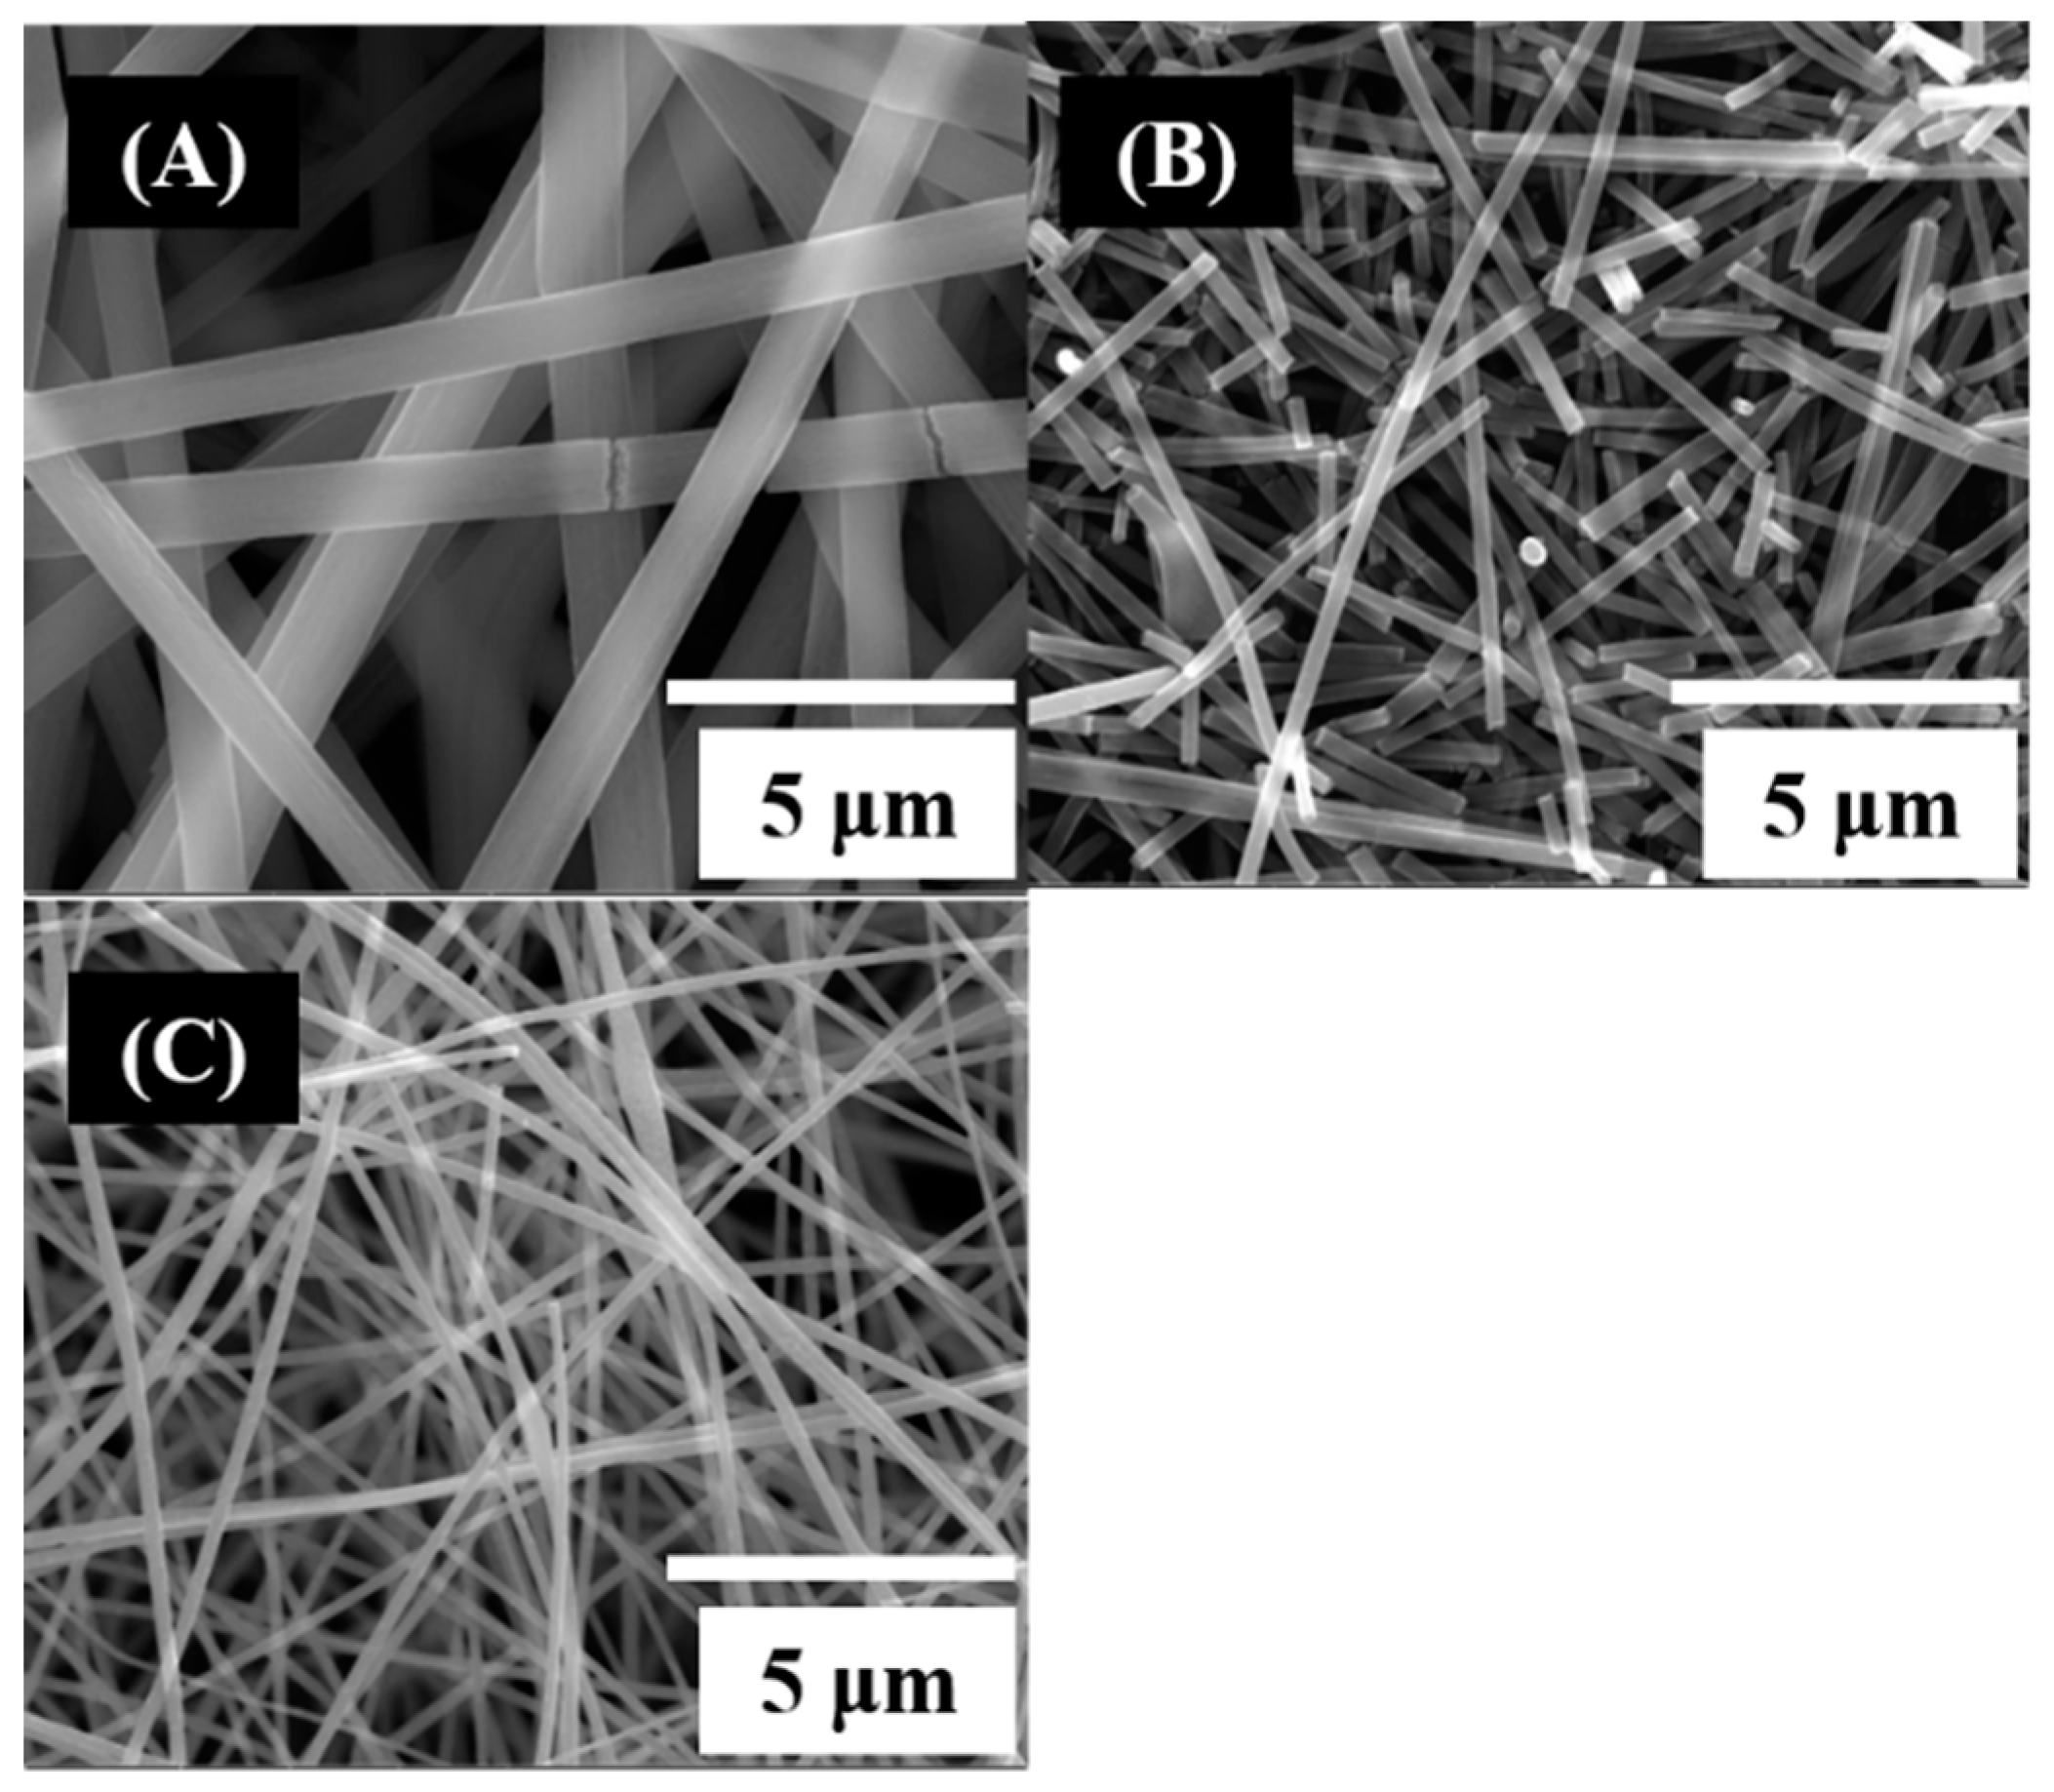
| TiO2 nanofibers | 15 | 1 | 0 |
| TiO2/ZnO-1 nanofibers | 15 | 3 | 28 |
| TiO2/ZnO-2 nanofibers | 15 | 2 | 28 |
| Nanofibers | Diameter (nm) |
|---|---|
| TiO2 | 400 ± 32 |
| TiO2/ZnO-1 | 600 ± 27 |
| TiO2/ZnO-2 | 400 ± 13 |
© 2019 by the authors. Licensee MDPI, Basel, Switzerland. This article is an open access article distributed under the terms and conditions of the Creative Commons Attribution (CC BY) license (http://creativecommons.org/licenses/by/4.0/).
Share and Cite
Lee, C.-G.; Na, K.-H.; Kim, W.-T.; Park, D.-C.; Yang, W.-H.; Choi, W.-Y. TiO2/ZnO Nanofibers Prepared by Electrospinning and Their Photocatalytic Degradation of Methylene Blue Compared with TiO2 Nanofibers. Appl. Sci. 2019, 9, 3404. https://doi.org/10.3390/app9163404
Lee C-G, Na K-H, Kim W-T, Park D-C, Yang W-H, Choi W-Y. TiO2/ZnO Nanofibers Prepared by Electrospinning and Their Photocatalytic Degradation of Methylene Blue Compared with TiO2 Nanofibers. Applied Sciences. 2019; 9(16):3404. https://doi.org/10.3390/app9163404
Chicago/Turabian StyleLee, Chang-Gyu, Kyeong-Han Na, Wan-Tae Kim, Dong-Cheol Park, Wan-Hee Yang, and Won-Youl Choi. 2019. "TiO2/ZnO Nanofibers Prepared by Electrospinning and Their Photocatalytic Degradation of Methylene Blue Compared with TiO2 Nanofibers" Applied Sciences 9, no. 16: 3404. https://doi.org/10.3390/app9163404