Application of Heartbeat-Attention Mechanism for Detection of Myocardial Infarction Using 12-Lead ECG Records

Abstract
:
1. Introduction
2. Materials and Methods
2.1. Data Description
2.2. Proposed Method
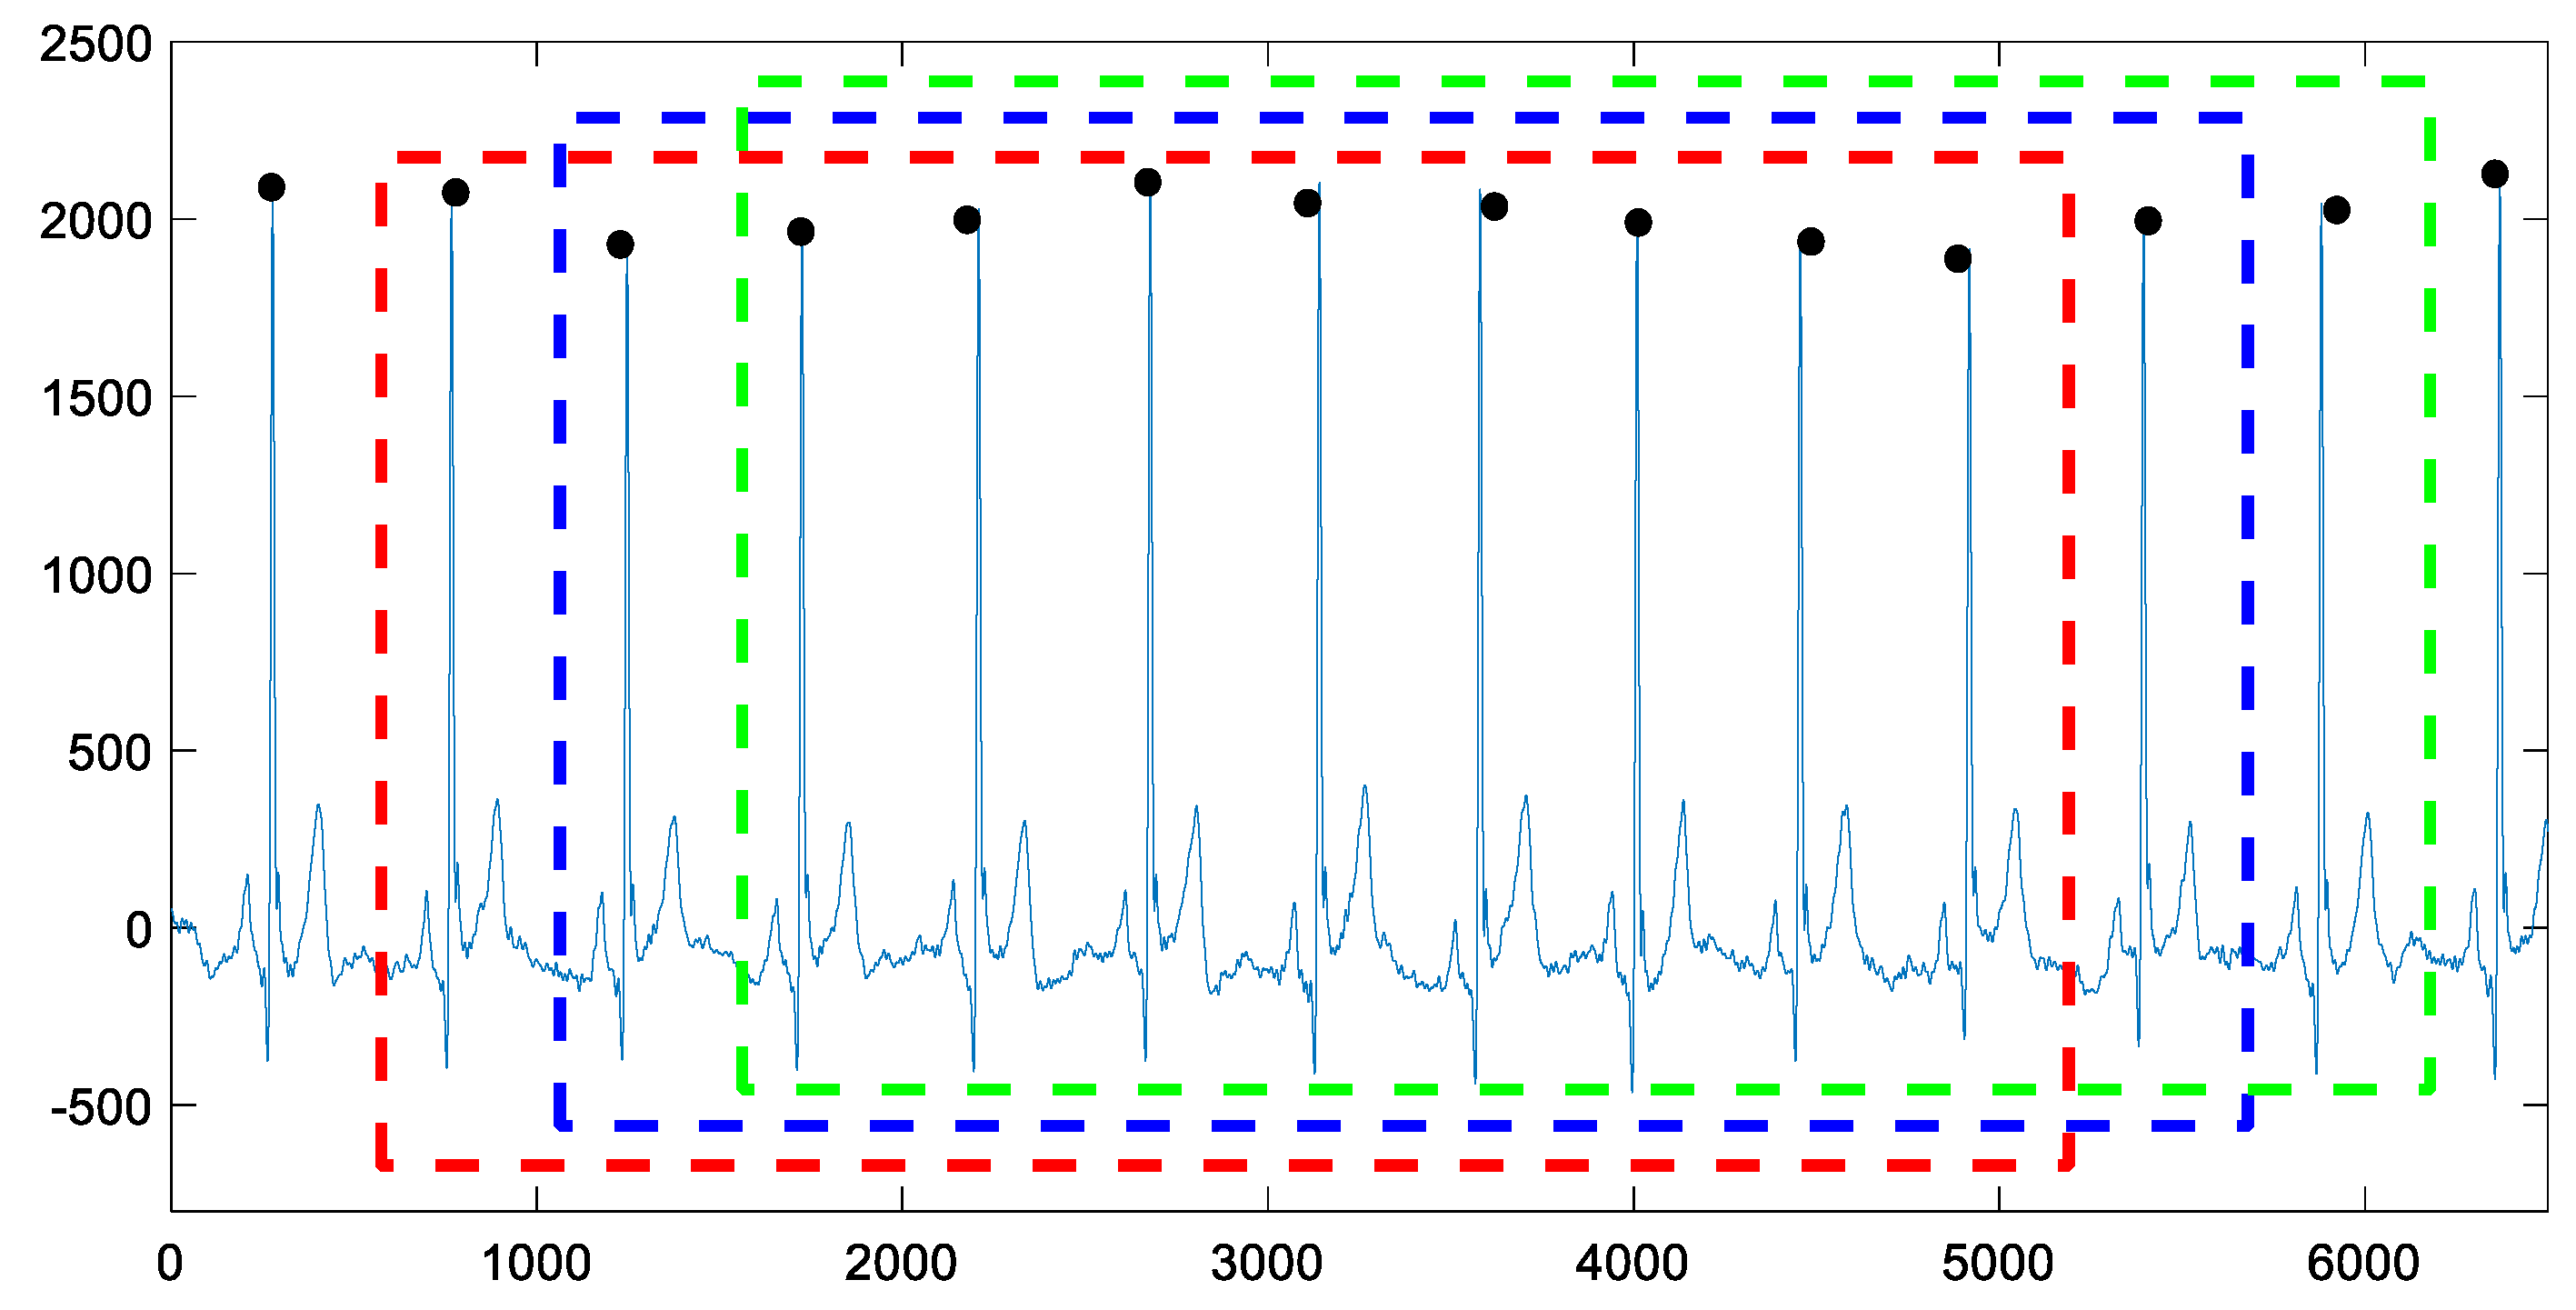
2.2.1. Preprocessing
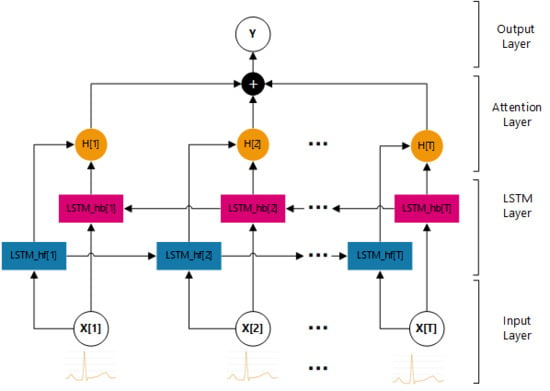
2.2.2. Model
- Input Layer
- LSTM Layer
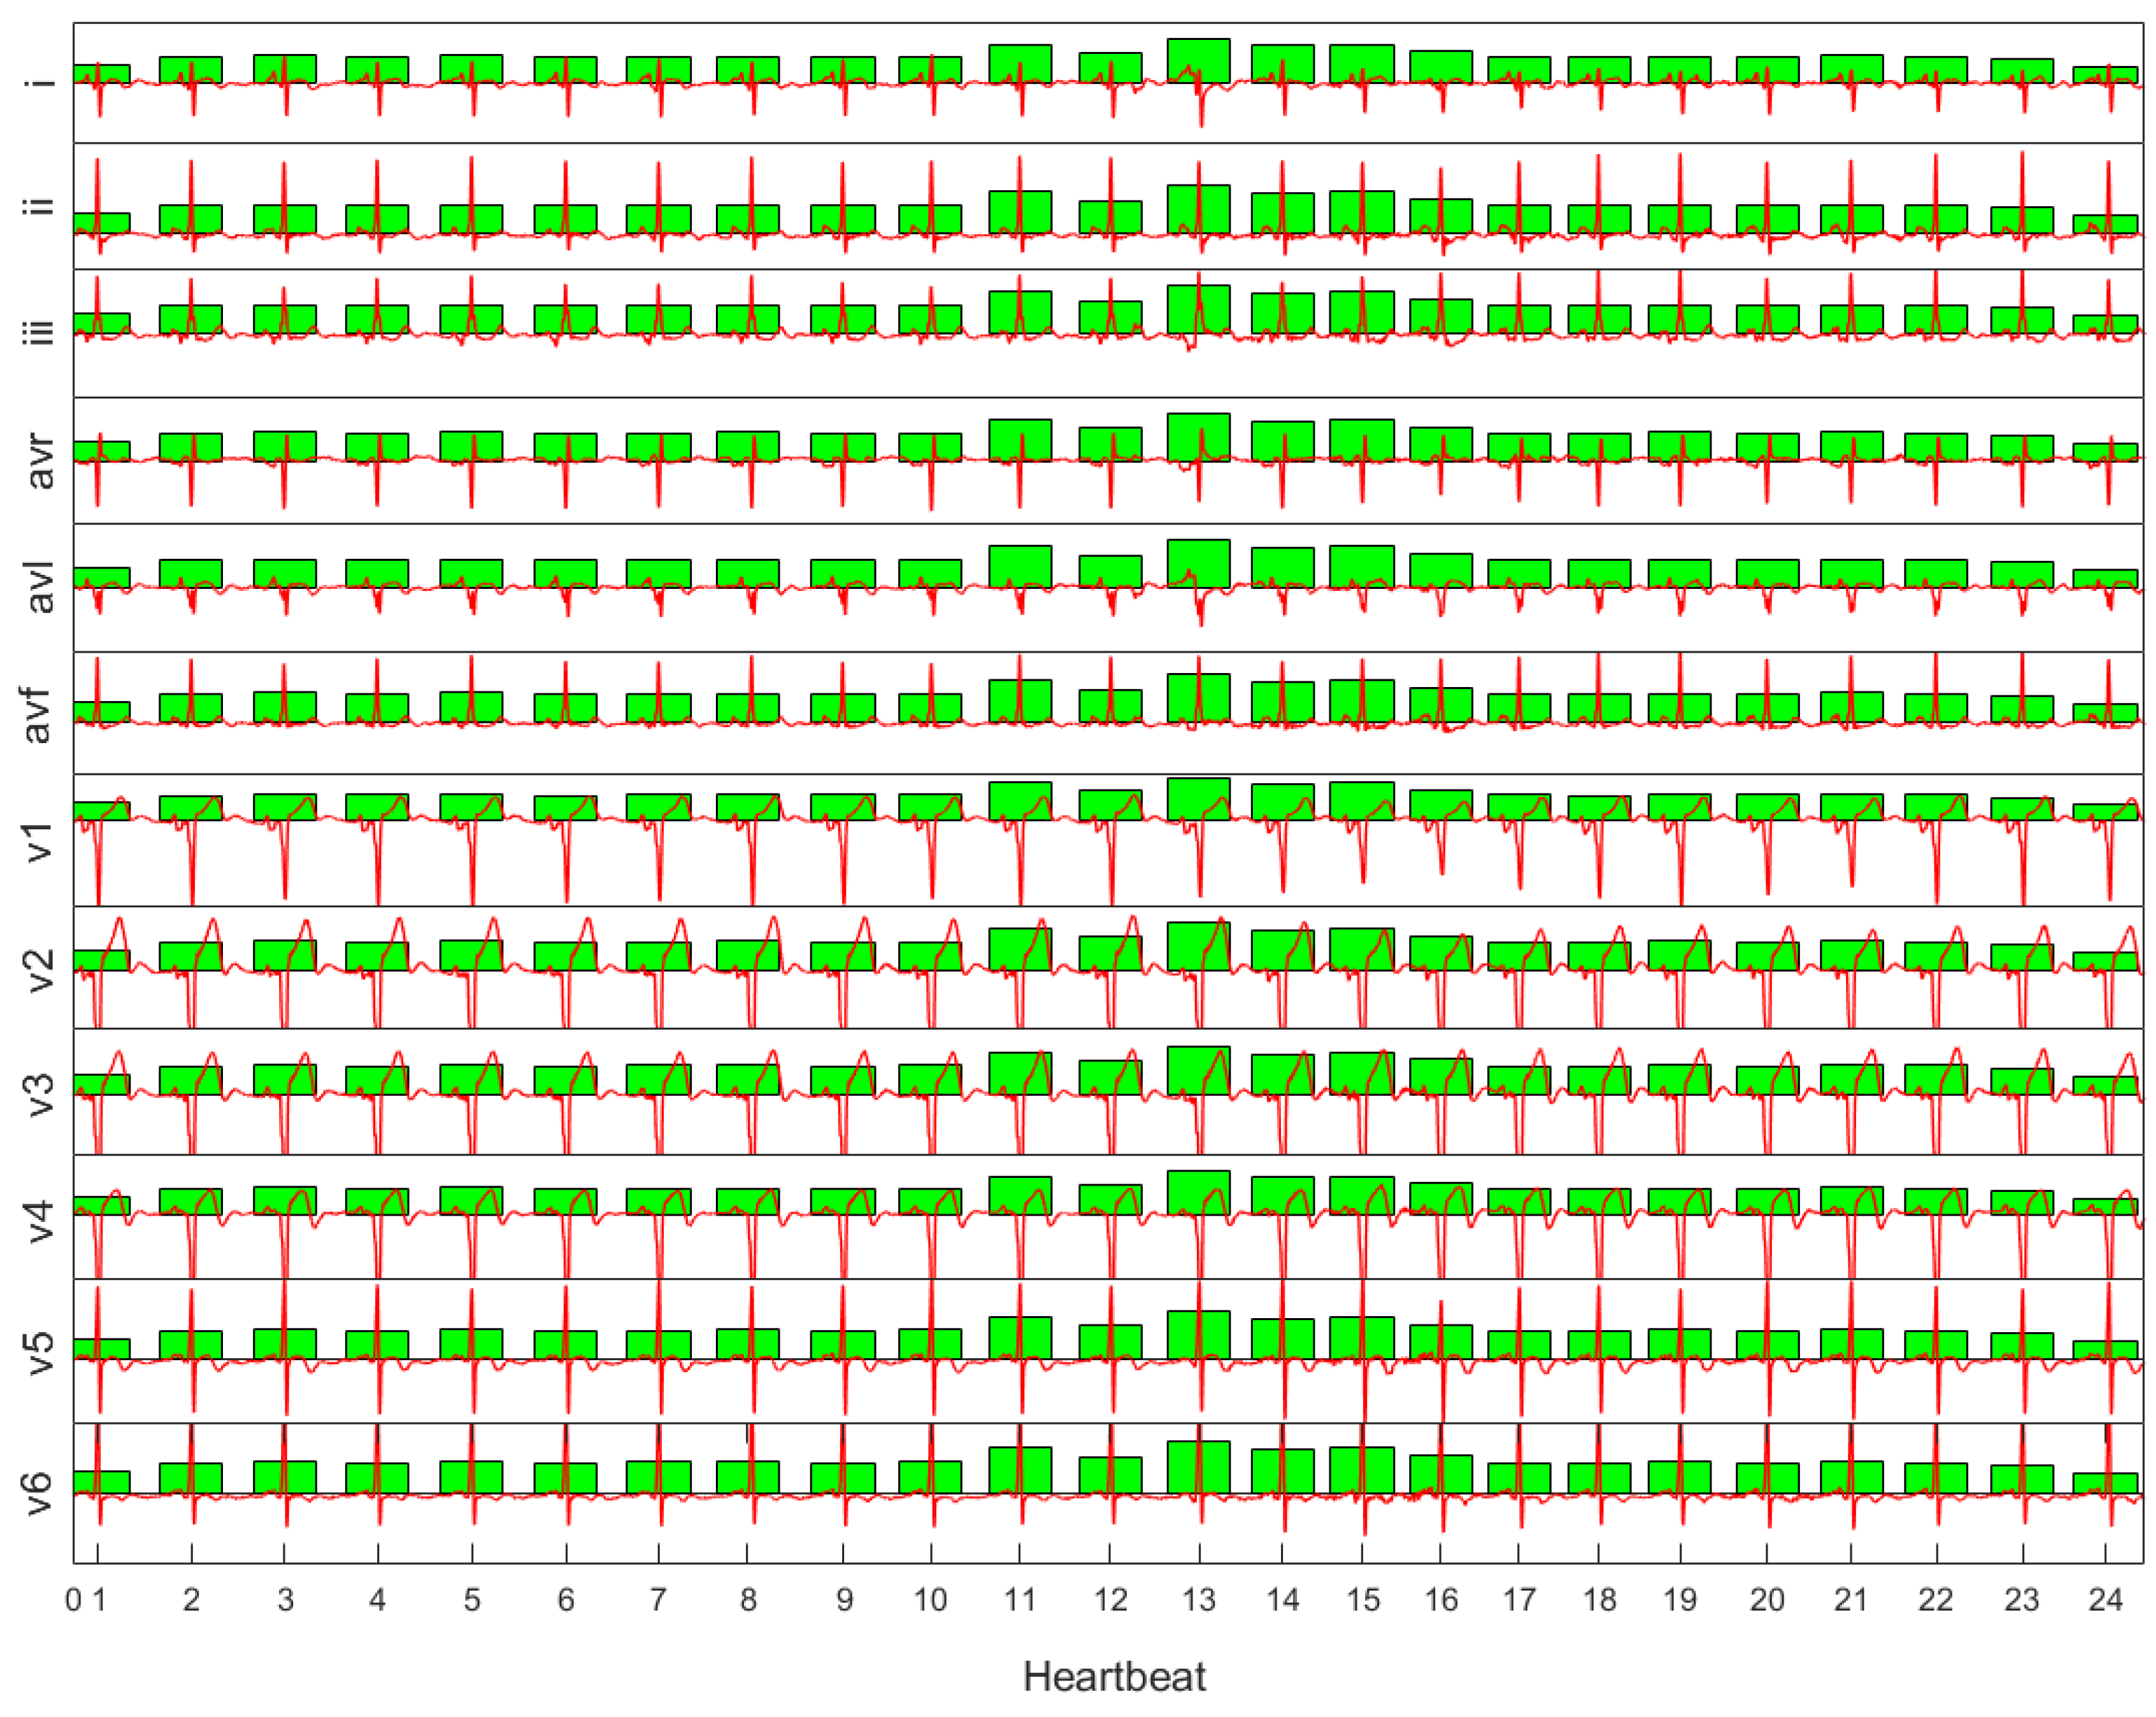
- Attention Layer
- Output Layer
2.2.3. Output
3. Results
3.1. Performance Evaluation
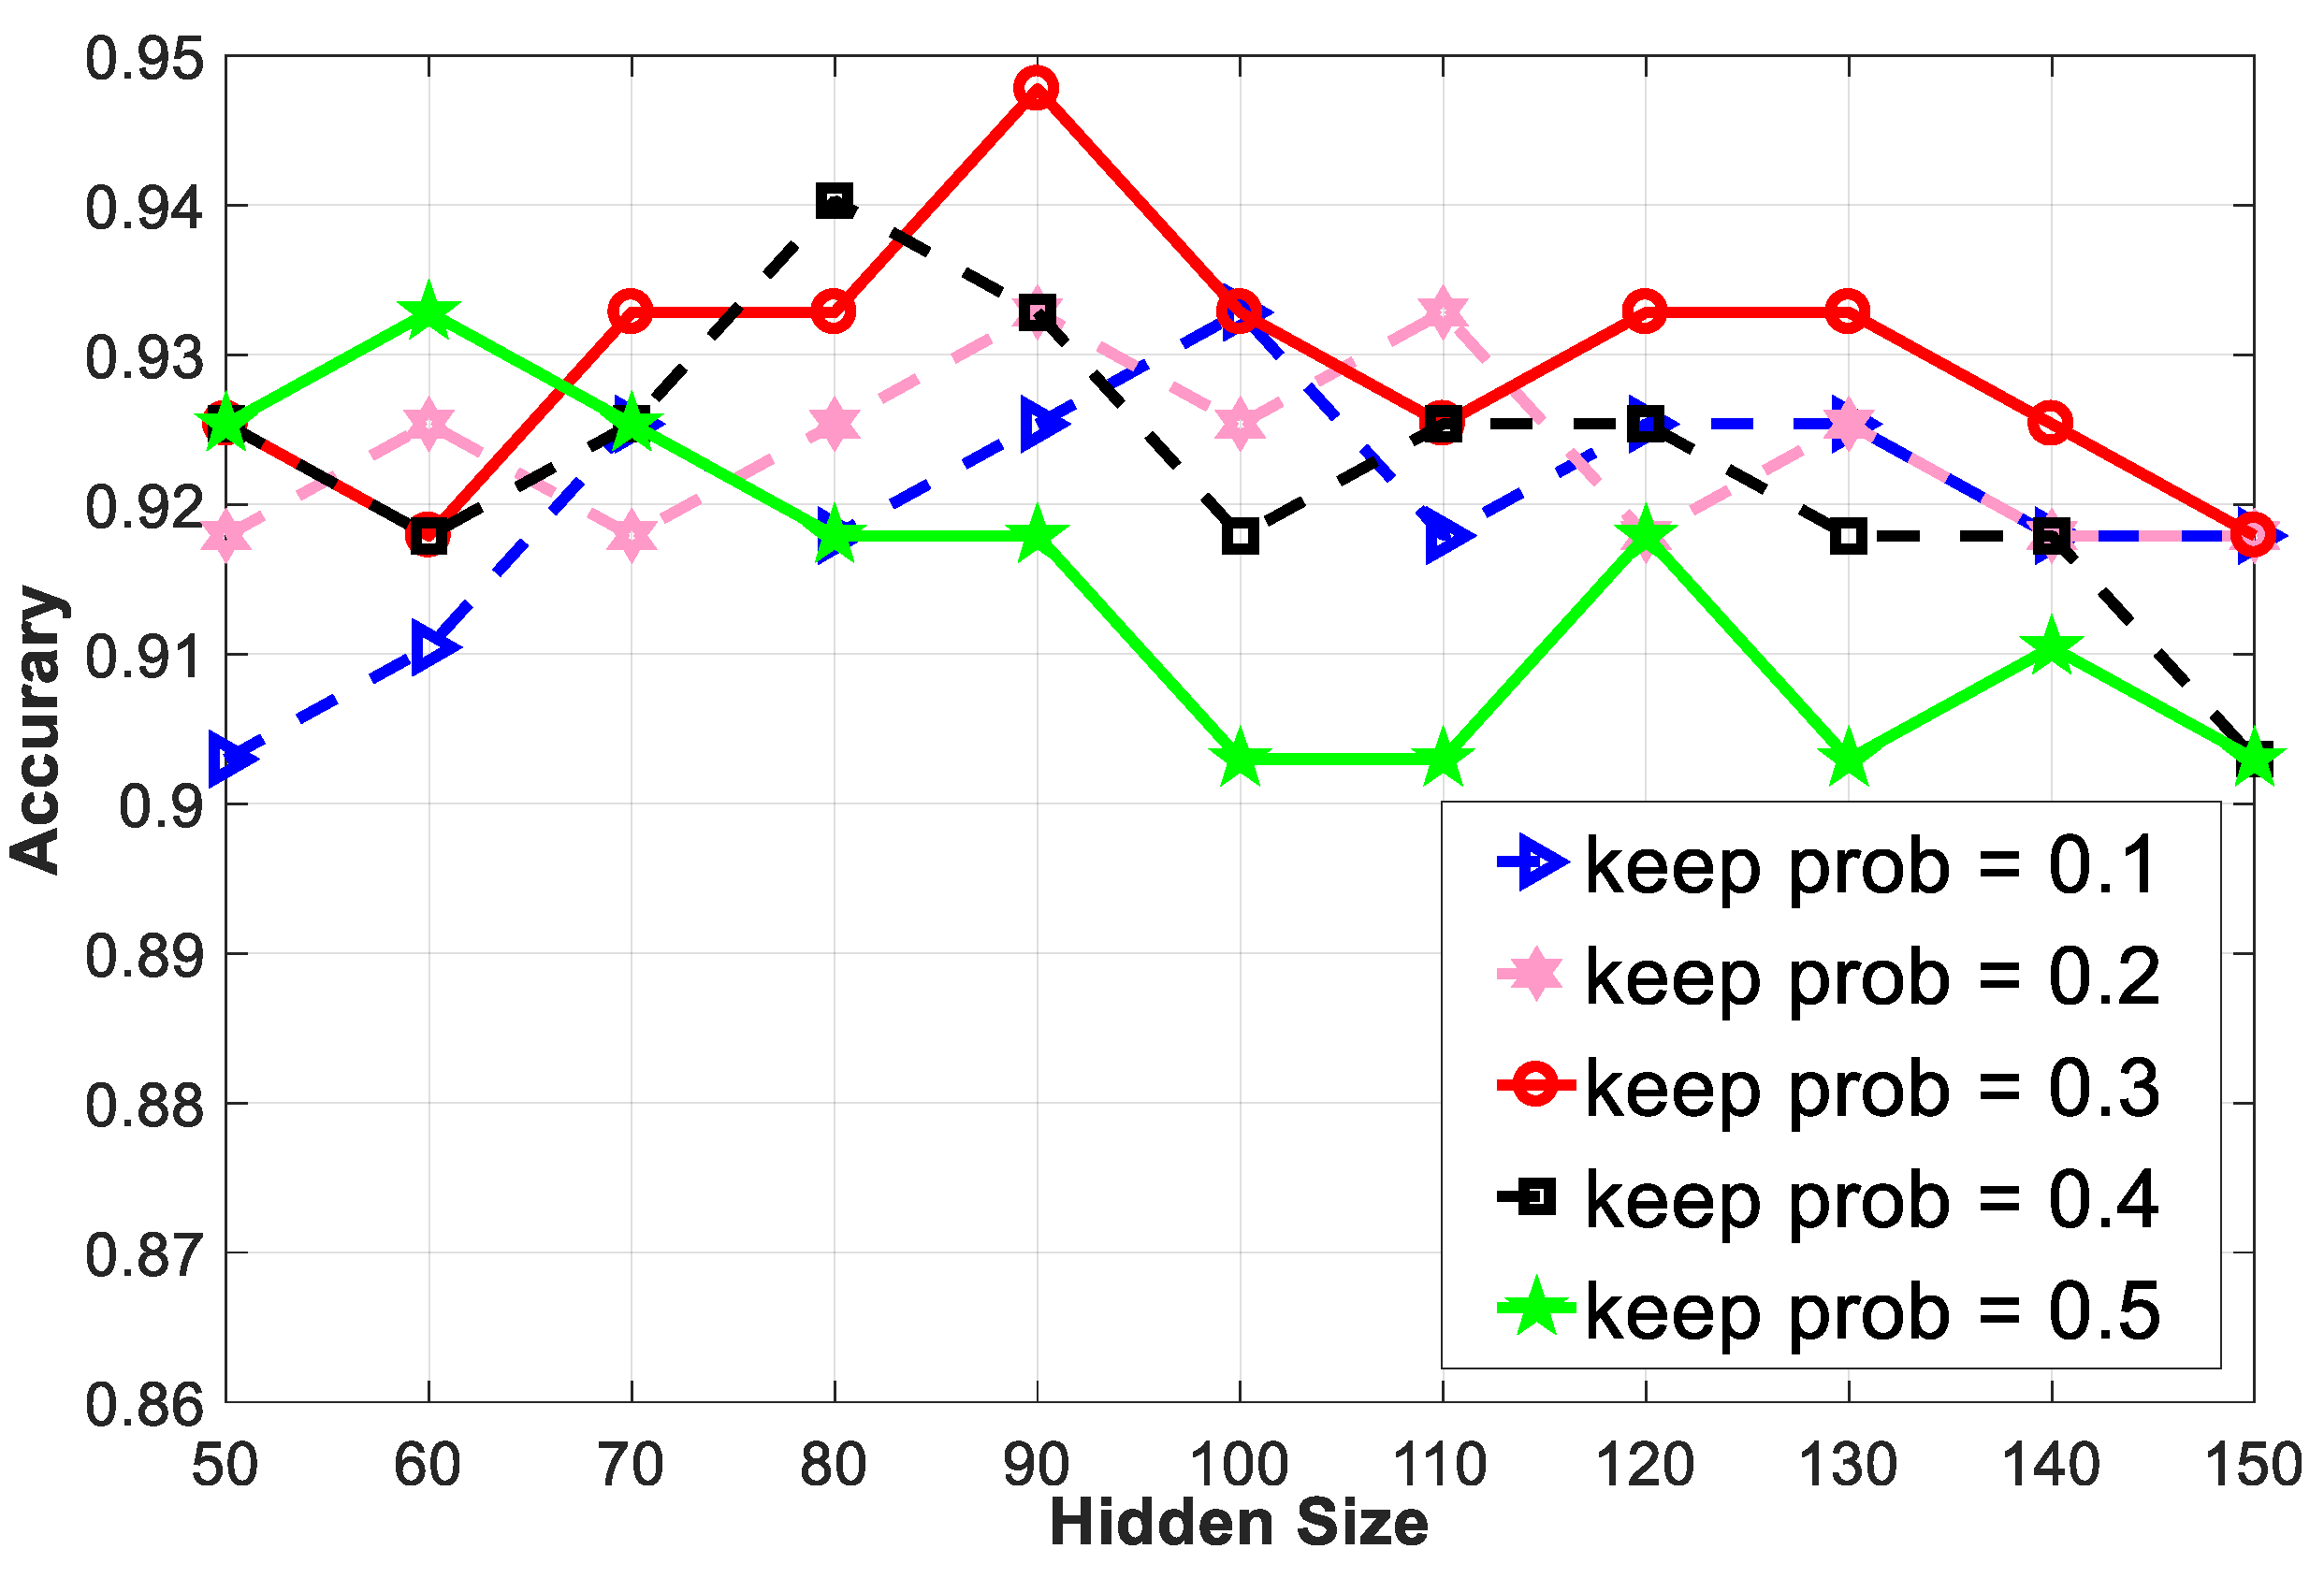
3.2. Parameter Setting
3.3. Experimental Results
4. Discussion
- It does not require any labels of heartbeats and is based on the standard 12-lead ECG records.
- The heartbeat-attention mechanism is implemented to weight different unlabeled heartbeats.
- It requires more data to further improve the performance.
- Its performance is greatly affected by the quality of ECG signals.
5. Conclusions
Author Contributions
Funding
Acknowledgments
Conflicts of Interest
References
- Mozaffarian, E.; Benjamin, E.J.; Go, A.S.; Arnett, D.K.; Blaha, M.J.; Cushman, M.; Das, S.R.; de Ferranti, S.; Després, J.P. Heart disease and stroke statistics–2016 update. Circulation 2016, 133, e38–e48. [Google Scholar] [CrossRef] [PubMed]
- Antman, E.; Bassand, J.P.; Klein, W.; Ohman, M.; Sendon, J.L.L.; Rydén, L.; Simoons, M.; Tendera, M. Myocardial infarction redefined—A consensus document of The Joint European Society of Cardiology/American College of Cardiology committee for the redefinition of myocardial infarction: The Joint European Society of Cardiology/American College of Cardiology Committee. J. Am. Coll. Cardiol. 2000, 36, 959–969. [Google Scholar]
- Sharma, L.N.; Tripathy, R.K.; Dandapat, S. Multiscale Energy and Eigenspace Approach to Detection and Localization of Myocardial Infarction. IEEE Trans. Biomed. Eng. 2015, 62, 1827–1837. [Google Scholar] [CrossRef] [PubMed]
- Reddy, M.R.S.; Edenbrandt, L.; Svensson, J.; Haisty, W.K.; Pahlm, O. Neural network versus electrocardiographer and conventional computer criteria in diagnosing anterior infarct from the ECG. In Proceedings of the Computers in Cardiology, Durham, NC, USA, 11–14 October 1992. [Google Scholar]
- Chang, P.C.; Lin, J.J.; Hsieh, J.C.; Weng, J. Myocardial Infarction Classification with Multi-lead ECG Using Hidden Markov Models and Gaussian Mixture Models. Appl. Soft Comput. 2012, 12, 3165–3175. [Google Scholar] [CrossRef]
- Safdarian, N.; Dabanloo, N.J.; Attarodi, G.A. New Pattern Recognition Method for Detection and Localization of Myocardial Infarction Using T-Wave Integral and Total Integral as Extracted Features from One Cycle of ECG Signal. J. Biomed. Sci. Eng. 2014, 5, 818–824. [Google Scholar] [CrossRef]
- Dohare, A.K.; Kumar, V.; Kumar, R. Detection of Myocardial Infarction in 12 lead ECG using Support Vector Machine. Appl. Soft Comput. 2018, 64, 138–147. [Google Scholar] [CrossRef]
- Acharya, U.R.; Fujita, H.; Oh, S.L.; Hagiwara, Y.; Tan, J.H.; Adam, M. Application of deep convolutional neural network for automated detection of myocardial infarction using ECG signals. Inf. Sci. 2017, 415, 190–198. [Google Scholar] [CrossRef]
- Sun, L.; Lu, Y.; Yang, K.; Li, S. ECG Analysis Using Multiple Instance Learning for Myocardial Infarction Detection. IEEE Trans. Biomed. Eng. 2012, 59, 3348–3356. [Google Scholar] [CrossRef] [PubMed]
- Gallino, A.; Chierchia, S.; Smith, G.; Croom, M.; Morgan, M.; Marchesi, C.; Maseri, A. Computer system for analysis of ST segment changes on 24-hour Holter monitor tapes: Comparison with other available systems. J. Am. Coll. Cardiol. 1984, 4, 245–252. [Google Scholar] [CrossRef]
- Sun, G.; Thomas, C.W.; Liebman, J.; Rudy, Y.; Reich, Y.; Stilli, D.; Macchi, E. Classification of normal and ischemia from BSPM by neural network approach. In Proceedings of the Annual International Conference of the IEEE Engineering in Medicine and Biology Society, New Orleans, LA, USA, 4–7 November 1988; pp. 1504–1505. [Google Scholar]
- Passariello, G.; Mora, F.; De La Cruz, E.; Gotoc, J.; Cerreult, B. Realtime detection and quantification of ischemic ECG changes. In Proceedings of the Twelfth Annual International Conference of the IEEE Engineering in Medicine and Biology Society, Philadelphia, PA, USA, 1–4 November 1990; pp. 809–810. [Google Scholar]
- Krucoff, M.W.; Croll, M.A.; Pendley, L.P.; Burdette, D.L.; Pope, J.E.; Hutchinson, D.D.; Stone, J.S.; Weber, R.A.; Califf, R.M. Continuous computer-assisted electrocardio graphic monitoring in patients with acute myocardial infarction: Early experience. In Proceedings of the Computers in Cardiology, Jerusalem, Israel, 19–22 September 1989; pp. 197–200. [Google Scholar]
- Thakor, N.; Gramatikov, B.; Mita, M. Multiresolution wavelet analysis of ECG during ischemia and reperfusion. In Proceedings of the Computers in Cardiology Conference, London, UK, 5–8 September 1993. [Google Scholar]
- Lemire, D.; Pharand, C.; Rajaonah, J.C.; Dubé, B.; LeBlanc, A.R. Wavelet time entropy, T wave morphology and myocardial ischemia. IEEE Trans. Biomed. Eng. 2000, 47, 967–970. [Google Scholar] [CrossRef] [PubMed]
- Goldberger, A.L.; Amaral, L.A.; Glass, L.; Hausdorff, J.M.; Ivanov, P.C.; Mark, R.G.; Mietus, J.E.; Moody, G.B.; Peng, C.K.; Stanley, H.E. PhysioBank, PhysioToolkit, and PhysioNet: Components of a new research resource for complex physiologic signals. Circulation 2000, 101, e215–e220. [Google Scholar] [CrossRef] [PubMed]
- Donoho, D.L. De-noising by soft-thresholding. IEEE Trans. Inf. Theory 1995, 41, 613–627. [Google Scholar] [CrossRef]
- Pal, S.; Mitra, M. QRS Complex detection using Empirical Mode Decomposition based windowing technique. In Proceedings of the 2010 International Conference on Signal Processing and Communications (SPCOM), Bangalore, India, 18–21 July 2010. [Google Scholar]
- Hochreiter, S.; Schmidhuber, J. Long Short-Term Memory. Neural Comput. 1997, 9, 1735–1780. [Google Scholar] [CrossRef] [PubMed]
- Zhang, D.; Wang, D. Relation Classification via Recurrent Neural Network. arXiv 2015, arXiv:1508.01006. [Google Scholar]
- Bahdanau, D.; Cho, K.; Bengio, Y. Neural Machine Translation by Jointly Learning to Align and Translate. arXiv 2014, arXiv:1508.01006. [Google Scholar]
- Wang, J.Y. A new method for evaluating ECG signal quality for multi-lead arrhythmia analysis. In Proceedings of the Computers in Cardiology, Memphis, TN, USA, 22–25 September 2002. [Google Scholar]
- Sun, X.; Zhang, Y. Design and Implementation of Portable ECG and Body Temperature Monitor. In Proceedings of the 2014 International Symposium on Computer, Taichung, Taiwan, 10–12 June 2014. [Google Scholar]


| No | Class | No. of Subjects | No. of Records |
|---|---|---|---|
| 1 | Myocardial infarction (MI) | 148 | 369 |
| 2 | Cardiomyopathy/Heart failure | 18 | 20 |
| 3 | Bundle branch block | 15 | 17 |
| 4 | Dysrhythmia | 14 | 16 |
| 5 | Myocardial hypertrophy | 7 | 7 |
| 6 | Valvular heart disease | 6 | 6 |
| 7 | Myocarditis | 4 | 4 |
| 8 | Miscellaneous | 4 | 4 |
| 9 | Healthy controls (HC) | 52 | 79 |
| 10 | n/a | 22 | 27 |
| Total | 10 | 290 | 549 |
| Predicted | ||||||
|---|---|---|---|---|---|---|
| HC | MI | Accuracy | Sensitivity | Specificity | ||
| Real | HC | 17 | 3 | 92.54% | 93.86% | 85.00% |
| MI | 7 | 107 | ||||
| Predicted | ||||||
|---|---|---|---|---|---|---|
| HC | MI | Accuracy | Sensitivity | Specificity | ||
| Real | HC | 19 | 2 | 94.77% | 95.58% | 90.48% |
| MI | 5 | 108 | ||||
| Author, Year | Leads Used | Data Used | Method | Performance |
|---|---|---|---|---|
| Reddy et al. [4] 1992 | V2–V4 leads | Normal:320 records AMI:182 records | Morphology feature ANN | Acc = NA Sen = 79.00% Spec = 97.00% |
| Pei et al. [5] 2012 | V1–V4 leads | Normal: 582 MI: 547 (heartbeats) | HMMs with GMMs | Acc = 82.50% Sen = 85.71% Spec = 79.82% |
| Safdarian et al. [6] 2014 | Lead II | 549 records (PTB) | T-wave integral Naive Bayes | Acc = 94.74% Sen = NA Spec = NA |
| Sharma et al. [3] 2015 | 12 leads | 2148 instances (a frame of four heartbeats from PTB) | Multiscale Energy SVM | Acc = 96.00% Sen = 93.00% Spec = 99.00% |
| Dohare et al. [7] 2018 | 12 leads | Normal: 60 records MI: 60 records (selected from PTB) | Morphological examination PCA SVM | Acc = 96.96% Sen = 96.96% Spec = 96.96% |
| Acharya et al. [8] 2017 | Lead II | Normal: 10546 MI: 40182 (heartbeats from PTB) | Convolutional neural network | Acc = 95.22% Sen = 95.49% Spec = 94.19% |
| Sun L et al. [9] 2012 | 12 leads | Normal: 79 records MI: 369 records (PTB) | multiple instance learning SVM | Acc = NA Sen = 92.60% Spec = 82.40% |
| Our method | 12 leads | Normal: 79 records MI: 369 records (PTB) | Bi-LSTM Heartbeat-attention | Acc = 94.77% Sen = 95.58% Spec = 90.48% |
© 2019 by the authors. Licensee MDPI, Basel, Switzerland. This article is an open access article distributed under the terms and conditions of the Creative Commons Attribution (CC BY) license (http://creativecommons.org/licenses/by/4.0/).
Share and Cite
Zhang, Y.; Li, J. Application of Heartbeat-Attention Mechanism for Detection of Myocardial Infarction Using 12-Lead ECG Records. Appl. Sci. 2019, 9, 3328. https://doi.org/10.3390/app9163328
Zhang Y, Li J. Application of Heartbeat-Attention Mechanism for Detection of Myocardial Infarction Using 12-Lead ECG Records. Applied Sciences. 2019; 9(16):3328. https://doi.org/10.3390/app9163328
Chicago/Turabian StyleZhang, Yue, and Jie Li. 2019. "Application of Heartbeat-Attention Mechanism for Detection of Myocardial Infarction Using 12-Lead ECG Records" Applied Sciences 9, no. 16: 3328. https://doi.org/10.3390/app9163328