Intelligibility and Listening Effort of Spanish Oesophageal Speech †


1
Aholab Signal Processing Laboratory, University of the Basque Country (UPV/EHU), 48013 Bilbao, Spain
2
Branch Hearing, Speech and Audio Technology, Fraunhofer Institute for Digital Media Technology, 26129 Oldenburg, Germany
*
Authors to whom correspondence should be addressed.
†
This paper is an extended version of our paper published in IberSPEECH 2018.
Appl. Sci. 2019, 9(16), 3233; https://doi.org/10.3390/app9163233
Submission received: 12 July 2019
/
Revised: 1 August 2019
/
Accepted: 5 August 2019
/
Published: 8 August 2019
(This article belongs to the Special Issue IberSPEECH 2018: Speech and Language Technologies for Iberian Languages)
Abstract
:Communication is a huge challenge for oesophageal speakers, be it for interactions with fellow humans or with digital voice assistants. We aim to quantify these communication challenges (both human–human and human–machine interactions) by measuring intelligibility and Listening Effort (LE) of Oesophageal Speech (OS) in comparison to Healthy Laryngeal Speech (HS). We conducted two listening tests (one web-based, the other in laboratory settings) to collect these measurements. Participants performed a sentence recognition and LE rating task in each test. Intelligibility, calculated as Word Error Rate, showed significant correlation with self-reported LE ratings. Speaker type (healthy or oesophageal) had a major effect on intelligibility and effort. More LE was reported for OS compared to HS even when OS intelligibility was close to HS. Listeners familiar with OS reported less effort when listening to OS compared to nonfamiliar listeners. However, such advantage of familiarity was not observed for intelligibility. Automatic speech recognition scores were higher for OS compared to HS.
1. Introduction
Laryngectomy is the procedure of surgical removal of the larynx for reasons such as laryngeal cancer. Along with the larynx, the vocal folds are also removed and, therefore, it leaves the laryngectomee with a disability to speak. In spite of the absence of vocal folds, laryngectomees can still manage to speak using alternative methods: Elecrolaryngeal Speech (ELS), Tracheoesophageal Speech (TOS), and Oesophageal Speech (OS) [1]. The first two methods require external aids—a tracheoesophageal prosthesis in the case of TOS; and electrolarynx (an external electronic substitute for the vocal folds) for ELS.
OS, on the other hand, does not require any external equipment. It is a skill that is developed with training from a speech therapist and requires several months of practice. It is also of poorer quality compared to TOS or EL [2]. Nonetheless, OS has the advantage that once the skill is mastered, the laryngectomee is self-sufficient in producing speech and this makes it a promising option post-laryngectomy. Moreover, for ELS or TOS users, getting OS skills are beneficial as it can help them communicate during unexpected situations (lost or broken devices, low battery, etc.).
Unlike healthy laryngeal speech (HS), which is produced with vibrations from the vocal folds, OS is produced from the vibrations of the pharyngo-oesophageal segment. Air is swallowed, inhaled, or injected and is introduced into the oesophagus, after which it is expelled with control, thereby producing vibration [2]. This generation mechanism introduces acoustic artefacts and makes OS difficult and effortful to understand [3,4], which greatly affects communication, social activities, and hence, quality of life [5]. Moreover, these less intelligible voices are not well received by machines that are operated by speech input. An increase in the popularity of devices with voice-based interaction means that machine intelligibility is gaining importance too. Therefore, we quantify intelligibility in both Human Speech Recognition (HSR) and Automatic Speech Recognition (ASR) contexts. We know that machine recognition, or ASR performance, is lower compared to HSR performance [6], although better ASR systems are being built increasingly, aiming towards humanlike recognition abilities. However, this is for HS and not for impaired speech, like OS. The difference in ASR–HSR intelligibility for OS and also HS is also something that we have investigated.
Listening to OS is a challenging task, and it demands a lot of attention and effort. While intelligibility can reveal what percentage of the message has been correctly understood, it cannot quantify how much effort was required to understand the message. There is growing interest in research measuring these processing load aspects of speech as it gives another dimension for understanding challenges in speech perception in adverse listening conditions. Listening Effort (LE) has been defined as “the mental exertion required to attend to, and understand, an auditory message” [7]. Therefore, in this study, we have attempted to explore LE in addition to the ASR and HSR intelligibility measurements.
The idea of intelligibility differences between experienced and inexperienced listeners of OS was explored in [8]. The findings were that OS was ranked similarly for intelligibility by both experienced and inexperienced listeners. This was intriguing, and led us to investigate the effect of familiarity on the intelligibility of OS. In addition, as we were collecting LE ratings too, we were interested in seeing if the same was observed for LE ratings, or if they would tell a different story. We consider friends, family (spouse, siblings, children), and caretakers of OS speakers as familiar listeners.
This study contains two experiments. The first experiment was web-based, and was focused on getting preliminary intelligibility and LE metrics for our data. We investigated how intelligibility (both ASR and HSR) and LE differs for the two speech types (OS and HS) and the effect of familiarity. We also investigated to what extent intelligibility and LE are correlated. The second experiment (an extension of Experiment 1) was conducted in a laboratory setting, which allowed us better control of the experiment environment. The aim of this experiment was to find out if more LE is reported for OS even if the intelligibility of OS is close to HS. Additionally, in this experiment, we also investigated if the participants’ performance in the speech perception tasks depended on their cognitive abilities.
To sum up, our preliminary evidences from Experiment 1 are:
- Word Error Rate (WER) is positively correlated with self-reported LE ratings.
- HS is more intelligible and less effortful, compared to OS.
Our hypotheses of Experiment 1 are:
- Listeners familiar with OS find it less effortful to process OS, compared to listeners that are not.
- ASR performs worse for OS than for HS.
Our hypotheses of Experiment 2 are:
- For the case that intelligibility of OS is similar to that of HS, there is still more effort in understanding OS.
- Listeners with better cognitive abilities have better intelligibility scores and report lesser effort.
We begin by describing some background on the research that has been conducted in both intelligibility and LE with a focus on OS. Following this, we describe the materials, methods, and results of Experiments 1 and 2 in Section 3 and Section 4, respectively. Finally, a general discussion and conclusions are presented.
2. Literature Review
2.1. Intelligibility
Speech intelligibility is a widely researched field, and several intelligibility measurement metrics (subjective and objective) have been explored and analysed. Subjective measures are based on the responses or opinions of the listeners. Some metrics in subjective intelligibility tests are Mean Opinion Scores (MOS) and Speech Reception Threshold (SRT). Objective measurements, on the other hand, include measures like Speech Transmission Index (STI), Short Term Objective Intelligibility (STOI) [9], and also ASR. Newer approaches of intelligibility measurement can be found in [10,11,12].
The main advantage of objective measurements is that they are easy to replicate and to implement. Measures such as STOI are useful in cases where there is a degraded speech signal and a clean reference signal. This is not the case of our dataset because our tasks do not involve introducing any external degradation. Therefore, ASR was most suitable for our purposes. A detailed description of the ASR system we have used is presented in Section 3.1.4.
Sentence transcription tasks have been widely used for subjective intelligibility measurements. Authors in [13] reported the agreement of sentence transcription tasks with a wide range of intelligibility quantification techniques and, in [6], the method is described as “human speech recognition”. Moreover, the strengths of sentence repetition tasks are that they are “fairly simple cognitive tasks” and that they are “consistent throughout the age span” in the area of neurophysiological tests [14]. Therefore, we chose this approach to calculate HSR intelligibility. A more recent review of HSR and ASR methods can be found in [15].
Intelligibility measurements for the analysis of pathological speech have been explored in [16,17,18]. Some of them are ASR-based [16,18], while others are not [17].
Some studies have been conducted in measuring the intelligibility of Spanish OS. Authors of [19] studied the voice intelligibility characteristics for Spanish OS and TOS. This HSR study was conducted for two-syllable words, and it reported that nasal sounds resulted in most transcription confusions for OS. Another study [20] showed how the formant frequencies were higher and the duration of vowels was longer for laryngectomees as compared to HS. The work in [21] describes a real time recognition system for vowel segments of Spanish OS.
A lot of these studies focus on the micro-level of words and vowels. Sentence level intelligibility and LE studies on the intelligibility of Spanish oesophageal voice are a less traversed area of investigation. In addition, their focus is usually on one aspect, either ASR or HSR. Therefore, in this study, we used sentences as our stimuli and a combined approach of ASR and HSR intelligibility measurements. Moreover, in case of LE measurements, it is beneficial to have longer stimuli as the listener can make a better judgment of effort.
2.2. Listening Effort
LE has been measured in several contexts where the listeners have to put in extra investment of their neurocognitive resources. This includes understanding of distorted speech signals. Distortion can come from the speaker (e.g., foreign accent, impaired speech), the listener (e.g., hearing impairment) or from the environment or channel (e.g., noise).
LE has been measured in several ways: Self-reporting (questionnaires, ratings); behavioural measures (performance of single tasks, multiple tasks and deriving LE from them); and physiological measures (electroencephalography, pupillometry). A review of LE and various methods of measuring LE is presented in [22].
While there is research on LE in the context of speech in noise [23], non-native or accented speech [24,25], and hearing impairment [26], LE of impaired speech is a less researched field, and physiological LE measurements, even less so.
Amongst pathological speech, we found some LE research for dysarthric speech. Whitehill and Wong [27] conducted a listening experiment to collect LE ratings, and found segmental features and factors of voice quality to be the predictors of LE ratings. The authors of [28] found that severity of speech impairment and listener familiarity had an effect on ’ease of listening’. In [29], words spoken by children with dysarthria were presented and listeners performed a word recognition and subjective LE rating task. The response time (time taken to recognise the words) was a significant predictor of the subjective LE ratings. Words with high accuracy in recognition had shorter response times and lower LE ratings.
We found some research that looked into some subjective processing load-based measures of OS. In [30] the authors measured the acceptability of OS, ELS, and HS. They found that HS was the most acceptable, followed by superior OS and then ELS. In [31], high-intelligibility TOS was played to listeners and they were asked to rate the effort of listening as well as acceptability for each sample and found an inverse correlation between LE and acceptability. Another observation from this study was that even highly intelligible speech can have varying listener effort. We have followed this thread in our second experiment (Section 4).
Therefore, by measuring LE for OS, we hope to expand the literature on processing load-based measurements of impaired speech as well as gain an understanding of OS on a dimension beyond intelligibility.
3. Experiment 1: Preliminary Word Error Rate and Listening Effort Measurements
3.1. Materials and Methods
3.1.1. Experimental Design
The main task for this web-based experiment [32] was the sentence recall and transcription task. Participants listened to a sentence and then typed what they had understood. To collect LE rating measures, we asked the participants to rate the sentences for LE on a 5-point Likert scale. The options were ‘very little’, ‘a little’, ‘some’, ‘quite’, and ‘a lot’. The sentences were played only once (to avoid any possible memory effect) and in a random order (to avoid sentence order bias).
3.1.2. Corpus and Stimuli
The parallel data used for this task contained 100 phonetically-balanced sentences selected from a bigger corpus [33,34]. The selection of sentences was performed with a greedy-algorithm-based tool called corpusCRT [35], with the criteria of maximised diphone coverage and a maximum of 15 words per sentence. We collected recordings of 32 OS speakers in an acoustically isolated room with a studio microphone (Neumann TLM 103). This database (AhoSLABI) is available in Supplementary Materials and in www.elra.info. HS samples were obtained from an online platform [36] and hence, were recorded in variable environments. However, some of them were recorded in the aforementioned acoustically isolated room, although with a different microphone. The number of speakers in the HS database keeps growing as it is an open online platform. There were 35 speakers in the HS database at the time of performing this experiment.
These 100 sentences were chosen to be phonetically balanced to ensure maximum phonetic content variability. They were syntactically and semantically predictable, but had some proper nouns and many unusual words that are hard to guess. This is to be kept in mind while considering intelligibility measurements. Some examples of the sentences are the following: ‘?‘Qué diferencia hay entre el caucho y la hevea?’ What is the difference between rubber and hevea (specific name of rubber tree)?, ‘Unos días de euforia y meses de atonía.’ A few days of euphoria and months of atony (weakness).
Not all the data of these corpora were evaluated in this experiment. A subset of 6 speakers (OS speaker IDs: 01M3, 02M3, 04M3, 25F3; HS speaker IDs: 114, 207) and 30 sentences were used as our stimuli (Sentence list provided in Supplementary Materials). The criteria and the procedure for these choices are described next.
OS speakers to be evaluated were chosen based on two criteria—proficiency and accessibility. Speakers who practised for at least two years after the laryngectomy qualified as proficient speakers. Additionally, an OS voice quality assessment tool [37] was used as a guide to assess proficiency. This tool was based on the factors used in the A4S scale of [38] such as speaking rate, regularity, etc. We also considered accessibility of speakers as a factor, because their willingness and availability to come for follow-up recordings are useful for future research. Based on these criteria, we chose 4 speakers, three male and one female, making it gender-inclusive (there are only 4 women in the whole database and only 2 of them fulfilled our criteria). The criteria for choosing healthy speakers was quality of recording as well as gender balance. One male and one female healthy speaker were chosen.
We conducted a pilot listening test to check if our stimuli were suitable for the sentence transcription task. We played the stimuli to some pilot participants who were not familiar with the stimuli, and hence, not primed. They reported that some sentences were effortful to transcribe as they were too long to remember. Therefore, we decided to use a subset of shorter sentences (maximum 40 phonemes), extracted using the aforementioned CorpusCRT tool. The result was a phonetically balanced set of 30 sentences with 7 to 10 words in each.
To sum up, we had 30 sentences from each of the 6 speakers (4 OS and 2 HS), a total of 180 stimuli. They were normalised to a common peak value (0.8) to achieve a homogeneous and comfortable level of loudness.
3.1.3. Listening Test
We took the following information from the participants: Age group (21–30, 31–40, etc.), presence of hearing impairment, the kind of audio equipment used (‘good quality headphones’, ‘normal quality headphones’, ‘good loudspeakers’, ‘normal loudspeakers’, and ‘bad equipment’) and whether the listener had close contact with laryngectomees.
We had 57 native Spanish participants (from Spain) in this test, out of which 15 had close contact with laryngectomees and hence, were familiar with OS. The listeners were from the age range of 21 to 70. There was no hearing impairment reported for any participant.
Participants listened to 5 randomly chosen stimuli from each of the 6 speakers, a total of 30 stimuli. Each of these 30 stimuli was a different sentence. Using a Latin Square design [39], coverage of all the 180 stimuli was ensured.
The participants were instructed to use headphones, pay close attention to the stimuli, and provide the responses honestly and uninhibitedly. There was a sound sample provided along with the instructions for them to ensure they could hear the sound properly. Participants typed what they heard and provided the LE rating on the aforementioned Likert scale. If they missed some portions or were unsure of what they heard, they were asked to put three dots (...) in that place. The first two sentences were presented as practice sentences (one HS and one OS), to familiarise the participant with the task. These sentences were sampled from the same corpus of 100 sentences but were different from the ones presented in the actual test.
The listening test (https://aholab.ehu.eus/users/sneha/Listening_test.php) was web-based, and it was possible to reach out to a wide range of participants. However, this also meant differences in audio equipment, the effects of this on the responses are reported in the Results section.
3.1.4. Automatic Speech Recognition
We collected ASR WER scores with a Kaldi-based [40] Spanish ASR system. It is implemented with the s5 recipe for the Wall Street Journal database. We used 13 Mel-Frequency Cepstral Coefficients (MFCCs) as acoustic features and a mean and variance normalization (CMVN) to mitigate the effects of the channel. The details of the training procedures are described in [41].
The training material for the ASR system was healthy laryngeal speech, as described in [42]. Some modifications were made to the ASR system to adapt it to the requirements of our experiment. As the sentences we used contained many low-frequency words, as much as of the words were out of vocabulary (OOV) words in the lexicon of the original ASR system, which contained entries. Therefore, we created a new lexicon with the 701 words present in the 100 sentences of the original corpus. Together with this reduced lexicon, a unigram language model with equally probable words was used. The acoustic models were unchanged. A unigram language model is a very simple language model and only considers probabilities of single words. A more sophisticated language model would consider the probabilities of single words and also combinations of words (word pairs, word triplets, etc.), which can result in better ASR performance.
Although the final WER numbers obtained with this simple ASR are not comparable to a sophisticated ASR system, the procedure serves our purpose of evaluating the intelligibility, comparing the performance of healthy and oesophageal speakers, and establishing a baseline reference for other parallel research in the field (such as evaluating the improvements of speech modification algorithms [43]).
3.2. Analysis and Results
Prior to calculating WER, an initial clean-up was performed on the data. This included removing any punctuation or special characters and some typing errors (accented vowels, use of upper and lower case, spelling of proper or foreign names, etc.). The WER was obtained after correcting these transcription errors.
WER was calculated using the Levenshtein distance [44] between the reference sentence and the hypothesis sentence (the sentence transcribed by the listener). The Levenshtein distance takes into account the insertions, deletions, and substitutions that are observed in the hypothesis sentence. The calculation was performed with the Matlab toolbox [45]. The formula used is shown in Equation (1).
Two different WERs were calculated: One, where all words of the sentence were considered; and two, where only content words were considered. In this case, errors in function words like prepositions, pronouns, conjunctions, etc., were overlooked. This helped us see how much of the content of the conversation was correctly understood. We contrasted these content-words-only WERs with the all-inclusive WERs.
We performed a 2 × 2 repeated measures ANOVA with the within-subjects factors speaker type (OS vs. HS) and between-subjects factor familiarity (familiar vs. not familiar) to quantify the effects of speaker type and familiarity on WER and LE ratings using the JASP tool [46]. We ran an additional ANOVA to compare the effect of audio device on WER and LE ratings. Sphericity and homogeneity checks were performed on the data with the JASP tool to ensure that assumptions of an ANOVA test are met.
Finally, we present speakerwise average ASR WERs of the 30 sentences and compare them with the HSR WERs.
3.2.1. Word Error Rates from HSR
Figure 1 shows all the WER results. The blue bars represent ‘All words WER’ from ‘not familiar’ listeners; and the orange bars represent the same from ‘familiar’ listeners. Patterned blue and orange bars represent the ‘content words only WERs’ for the ‘familiar’ and ‘not familiar’ categories, respectively. OM, OF, HM, and HF are acronyms for Oesophageal Male, Oesophageal Female, Healthy Male, and Healthy Female, respectively.
As can be seen in Figure 1, the mean ‘content words only WERs’ and ‘All words WERs’ differ in value, but only by a small number (mean value of 2.73 percentage points). The ‘content words only WERs’ were highly correlated with the ‘All words WERs’ (Pearson’s r = 0.889, p < 0.001 ). Therefore, we can see that the trend of the nonpatterned bars and the patterned bars is similar.
Now, focusing on the speakerwise WERs for familiar and unfamiliar listeners, we can see that mean WER is always higher for OS compared to HS, as expected. There is no major difference in the WER for familiar and unfamiliar listeners in the case of OS. It is confirmed by a two-sample Kolmogorov–Smirnov (KS) test that the data came from the same continuous distributions (Alpha = 0.05). This result corroborates the conclusions in [8], where intelligibility was scored similarly by expert and novice listeners. For HS, there is a slight difference of around 3 points in the mean WER, but, as can be seen in Figure 1, the difference is not meaningful. From a two-sample KS test, we find that the data (HS-familiar and HS-nonfamiliar) came from the same continuous distributions (Alpha = 0.05). Categorical mean WERs can be found in Table 1.
The ANOVA results show that familiarity with OS had no effect on WER (F(1,55) = 0.007, p = 0.934). On the other hand, speaker-type had a strong effect on WER (F(1,55) = 223.593, p < 0.001, ). These results can also be observed in Figure 1.
The audio device used by the listener had no effect on HSR WER (F(3,1256) = 0.707, p = 0.548).
3.2.2. Self-Reported Listening Effort
Mean LE ratings are stated in Table 1. Figure 2 shows the speakerwise LE ratings. As expected, it is higher for OS compared to HS. However, when listening to OS, the LE is significantly lower for familiar listeners than for not familiar listeners. Indeed, ANOVA analysis shows that familiarity with OS has an effect on LE (F(1,55) = 20.22, p < 0.001, ) and Speaker-type has a strong effect on LE (F(1,55) = 315.00, p< 0.001, ).
The audio device used by the listener had no effect on LE (F(3,1256) = 0.705, p = 0.549).
3.2.3. Correlation of Intelligibility and Listening Effort
Correlation between intelligibility (WER) and LE ratings was 0.479 (Spearman’s rho = 0.475, p < 0.001). This is a significant correlation, indicating that sentences with more transcription errors are perceived as more effortful. Spearman’s rho correlation was used as LE rating is an ordinal variable.
3.2.4. Word Error Rates from ASR
The mean ASR score for OS was 49.55 ± 3.39 and for HS it was 19.57 ± 1.50. Mean speakerwise ASRs are shown with corresponding HSRs in Figure 3. It can be observed from the figure that the ASR performs poorly for both HS and OS. The fact that the system used a unigram language model contributes greatly to this poor performance. As expected, WER for OS is significantly higher () than for HS.
We can also observe that HSR and ASR perform differently for different speakers. However, the number of speakers in this experiment is too small to draw any reliable conclusion about the variation of ASR and HSR across speakers.
4. Experiment 2: Listening Effort for High-Intelligibility Oesophageal Speech
4.1. Materials and Methods
4.1.1. Experimental Design
Based on our preliminary intelligibility and self-reported LE experiment (see Experiment 1, Section 3), we had the chance to probe further into our data by designing a study specifically aimed at measuring LE. The aim was to investigate the differences in LE for a set of HS and OS speakers that have comparable intelligibility. As pointed out in [31], even highly intelligible OS speech was found to have different LE ratings. Therefore, this is a methodological decision in order to rule out that observed effects are due to differences in intelligibility.
The experiment was designed for an Electroencephalography (EEG)-based LE measurement. We aimed to record EEG data of participants while they listened to OS and HS to investigate if there are differences in the LE correlates of brain activity. Along with measuring the EEG data, we also collected subjective LE ratings from the listeners. As the participants had an EEG cap on, the stimuli were played on a loudspeaker, and not on headphones. Here, we present the LE ratings findings. EEG data is still being analysed and will be presented in the future.
In addition to the LE experiment, a separate intelligibility test was conducted to replicate the results of Experiment 1 in a laboratory setting. This time we asked the participants to listen to the sentence and repeat out loud what they heard. This is less taxing for the participant as they do not have to type their responses. Also, this resulted in speedier responses and hence less effort from the listeners’ side in memorising the sentence. The advantage of oral response is that typing errors can be excluded as a confounding factor for WER. However, this involves post-processing, i.e., the task of transcription of their oral responses to text to calculate WER.
4.1.2. Stimuli
We picked a subset of one HS speaker and one OS speaker from our dataset of Experiment 1 based on intelligibility similarity. Speaker OF1 and speaker HF1 were the two speakers that had significantly similar intelligibility based on a two-sample KS test. The null hypothesis that they come from same distributions was accepted with a significance of Alpha of 0.01.
All 100 sentences mentioned in Section 3.1.2 were used for this experiment. An intelligibility test was performed on the same 30 sentence subset described in Experiment 1. For the LE rating task, we used the other 70 sentences that were longer.
4.1.3. Listening Test
Sixteen native Spanish speakers (7 female, 9 male; age range: 19–35, mean = 26.56, SD = 4.50) participated in the study. All participants were native Spanish speakers from South America, except one who was from Spain. They were given monetary compensation for participating in the test. Ethics for conducting the experiment was approved by the local ethics committee of the University of Oldenburg. All participants had normal hearing except one participant with a 55 dB hearing loss in the left ear. The inclusion of this participant did not alter the observations of the study and hence, we chose to keep this participant.
The test began with the LE task first, where 60 (30 OS and 30 HS) out of the 70 available LE sentences were played in 3 blocks of 20 sentences (randomised) each. For 15 sentences of each block, participants were prompted to provide LE ratings. In the other 5 sentences (presented at random intervals), they were asked to repeat the last word of the sentence. This was to ensure that they were attentive and actively listening to the stimuli. A 13-point scale from ’Ningún esfuerzo’ (No effort) to ’Muchísimo esfuerzo’ (Extreme effort) was used to rate LE. This scale was based on the one used in [23]. There were 7 labels in all, but also intermediate labels (’–’) that allowed participants to choose in-between options. The LE rating labels, their English translations, and their values are presented in Table 2.
After the LE task, the participants got a break and then they proceeded to the intelligibility task. In this task, they listened to a sentence and received a prompt on the screen to repeat the sentence that they heard. They provided oral responses for the 30 sentences. The whole session of the intelligibility test was recorded with a microphone so that it could be transcribed later.
Stimuli were played at a comfortable listening level of 60 dB SPL.
4.1.4. Cognitive Tasks
We looked for the effect of cognitive capacities on LE and WER. We performed a Flanker task [47] to measure the selective attention ability and a backward digit span task [48] for working memory capacity.
In the Flanker task, participants were presented 24 congruent (“”), 24 incongruent (“”), and 24 neutral (“”) stimuli. They were asked to focus on the middle symbol and correctly identify it by pressing “<” or “>” as quickly as possible. Their responses and reaction times were recorded.
In the backward digit span task, the experimenter read a lists of digits and the participant was asked to repeat them in reverse (For example, experimenter: ‘3 2 9 5’; participant: ‘5 9 2 3’). The digits were read in an even tone at intervals of approximately one second. The experimenter started with the set of three-digit lists. If the participant was able to correctly recall 5 three-digit lists out of 6, they graduated to the set of four-digit lists. This went on until the participant could no longer recall at least 5 lists in a set or until they reached the final nine-digit list set. The digit span score was the maximum number of digits in the list where the participant could recall 5 lists correctly.
4.2. Analysis and Results
Out of the 16 participants, transcriptions were available only for 13 participants as we could not record responses of 3 participants due to technical problems. LE ratings were not available for one other participant, also due to a technical problem with saving data. Flanker effect score was not available for a participant. For analysis purposes, these missing data were filled with the mean values of the responses of other participants. Sphericity and homogeneity checks were performed on the data with the JASP tool to ensure that assumptions of an ANOVA test are met.
4.2.1. Intelligibility
The audio responses of the sentence recognition task were transcribed by a native Spanish speaker, who was also a speech expert. WER was calculated using the same methods as stated in Section 3.2. As the WER was found to be highly correlated with all inclusive WERs in Experiment 1, we decided to proceed with all inclusive WERs only.
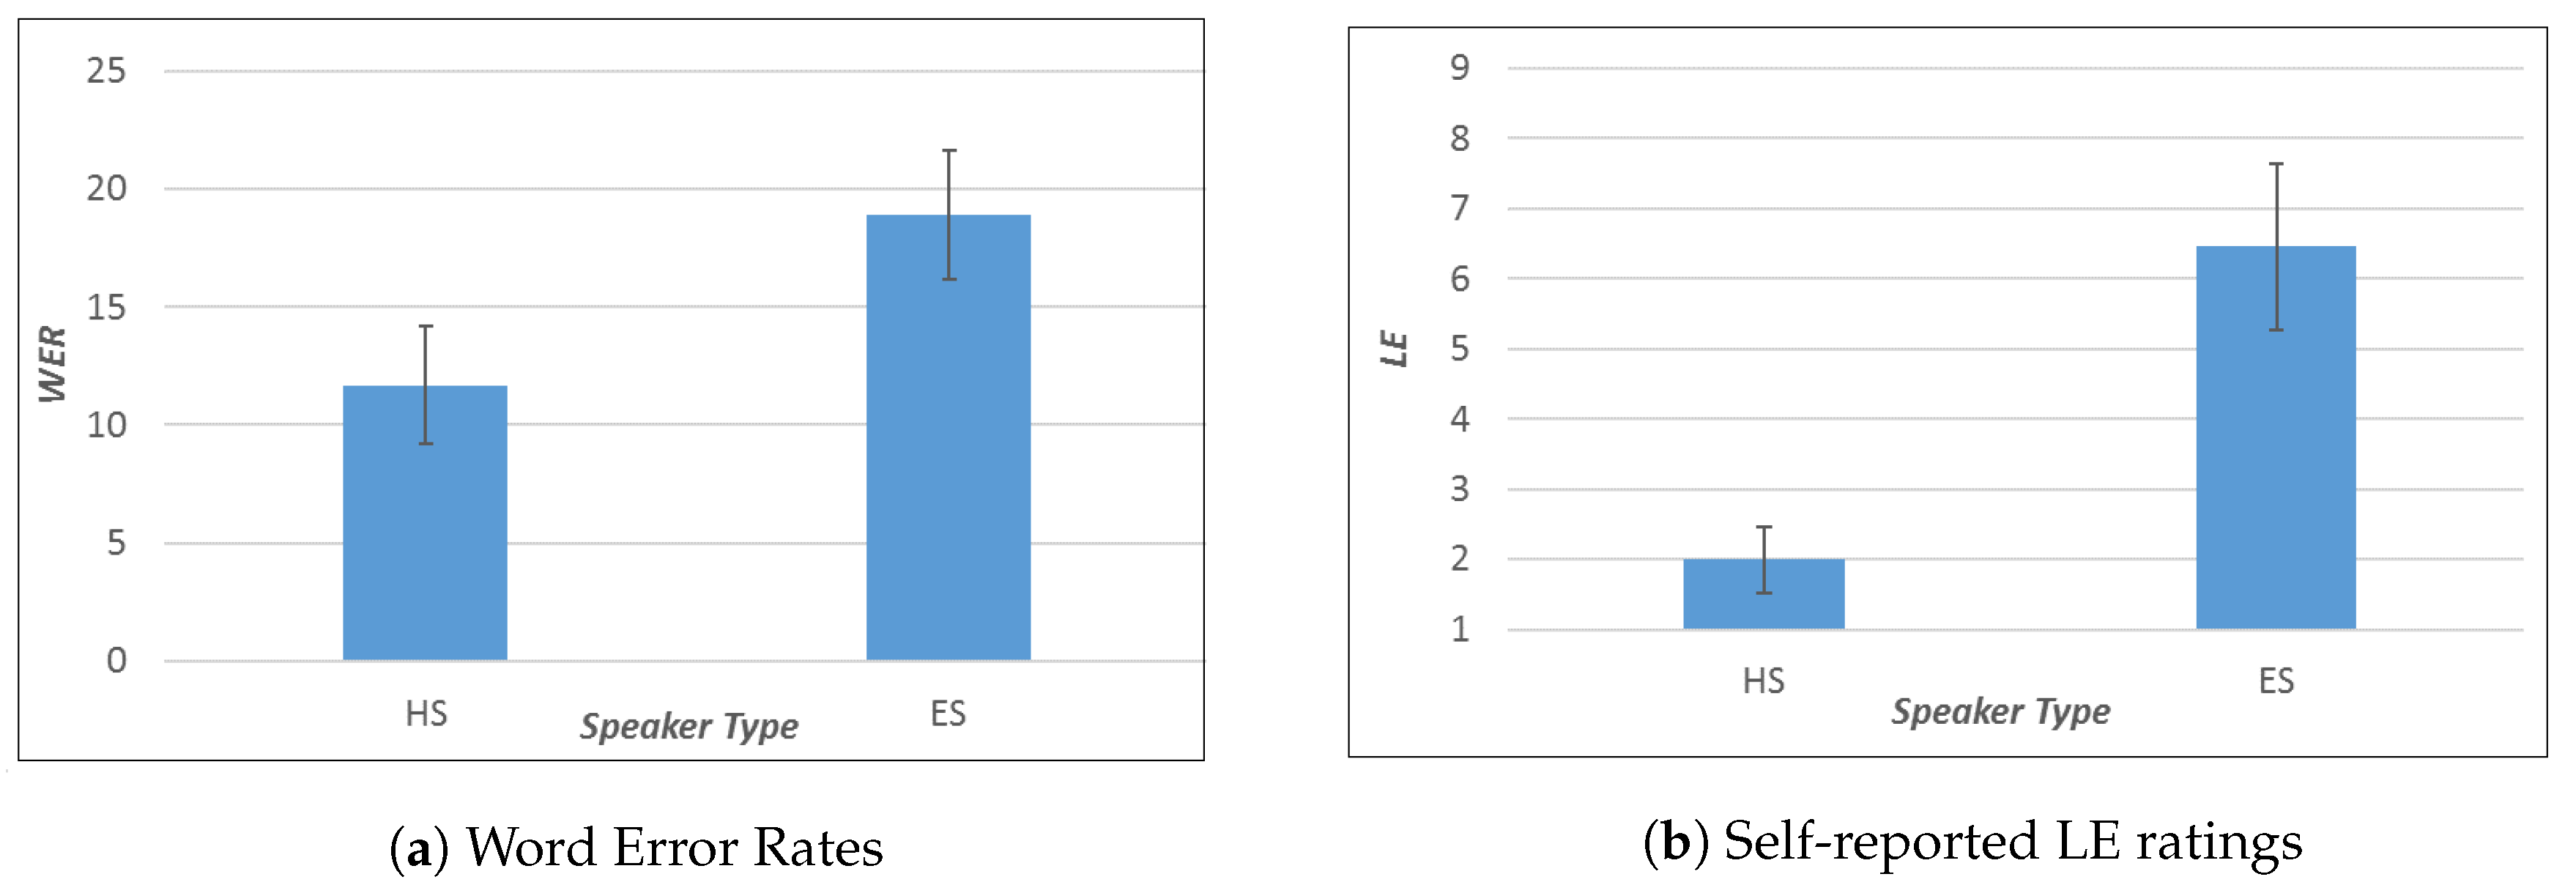
Percentage WER scores for OS was 18.88 ± 21.30 and for the healthy speaker it was 11.69 ± 16.13 (Figure 4a). ANOVA showed that speaker type had an effect on WER (F(1,15) = 27.20, p < 0.001, ).
4.2.2. Listening Effort Ratings
Mean LE (from a 13-point scale) for the OS speaker was 6.457 ± 3.150 and for the healthy speaker it was 1.994 ± 1.611 (Figure 4b). There was a difference of 6 points in median LE for OS and HS. The median LE for HS was 1 (no effort) and for OS speaker it was 7 (moderate effort). ANOVA showed that speaker type had an effect on LE (F(1,15) = 77.55, p< 0.001, ).
There were 15 responses per participant for the task of repeating the last word in the LE task. The average error made in the recognition of the last word was 1.067 response per participant. The total last word recognition error across all the 15 participants was 7 percent. We can tell, therefore, that the participants were attentive during the LE rating task.
4.2.3. LE, WER and Cognitive Tasks
The Flanker effect was calculated as shown in Equation (2). RT_incong and RT_neutral are the average reaction times taken to respond to an incongruent trial (“”) and a neutral trial (“”), respectively. These reactions times are calculated for correct trials only.
The mean Flanker effect score was 0.413 ± 0.019 and the mean digit span score was 4.125 ± 1.258.
Correlations between Flanker effect and mean LE ratings were not significant (Spearman’s rho = −0.432, p = 0.096). Significant negative correlation (Pearson’s r = −0.554, p = 0.049) was found between digit span scores and mean WERs (average of OS and HS).
5. Discussion
In Experiment 1, we were able to show that speaker type (OS or HS) had an effect on both LE and WER. OS speakers had poorer intelligibility compared to HS speakers and also a higher LE. The correlation between LE and WER suggests that more effort was reported as the intelligibility of the speaker worsened. Therefore, a drop in intelligibility caused an increase of LE. A further step in this direction would be to know what aspects of OS contribute to more LE: Its spectral characteristics, lack of fundamental frequency, or poor rhythm in speech, or a combination of these.
Our findings about the effect of familiarity with the listener on intelligibility are in a similar vein to a study investigating the experience of the listener (speech expert vs. novice) on OS intelligibility [8]. However, in this study we were more interested in investigating the experience that comes from constant exposure as family members, close friends, and caretakers. We found that indeed the intelligibility scores were similar for familiar and unfamiliar listeners. However, interestingly, familiar listeners reported less LE. So LE was able to provide more information about listening to OS.
As far as ASR is concerned, we found that ASR WER scores were higher for OS compared to HS. We compared WERs from our ASR system with HSR WERs. ASR WERs were higher compared to HSR WERs, but it could be because our ASR system was based on a unigram language model and focused only on acoustic models. The reason to choose such an ASR was to evaluate the drop in intelligibility owing to acoustic degradations, which is the case for OS.
In Experiment 2, the goal was to measure LE when listening to OS and HS with similar intelligibility scores taken from Experiment 1. Although WER data in Experiment 2 indicate a higher intelligibility for HS than OS, the overall intelligibility for both OS and HS can be considered to be very high. Despite this high intelligibility for both speaker types, we observed a considerable gap in LE, and this suggests that LE is a relevant dimension to be considered in OS evaluation.
The negative correlation of the digit span scores with WER suggests that participants with a poorer working memory (denoted by lower digit span scores) made more errors in recognition. This is understandable, as the ability to hold more information helps in correctly recalling and repeating the stimuli. The correlation with Flanker effect was not significant, suggesting that, in this case, selective inhibition plays a minor role to explain differences in LE. Flanker task is a measure of selective inhibition of distracting signals, such as noise added to the signals or signals with distracting speakers. However, the distraction in our stimuli are not of that nature. It is more in the form of undesired pauses and swallowing sounds that appear within and between words in the OS signal. The increase in LE was observed likely due to poorer quality of speech, rather than due to interfering information that has to be suppressed as is the case in noisy environments. On the whole, we cannot tell from these results alone whether better cognitive abilities mean better performance (low LE and low WER) in OS speech perception. Future studies using different cognitive test batteries are necessary to help us answer that question better.
Finally, the familiarity effect on LE, as reported in Experiment 1, could mean that OS speakers might find it easier communicating with family and close friends as opposed to others. Although this was not investigated in this study, it would be interesting to know at what level of familiarisation does this effect show and also whether there is a ceiling effect to this familiarisation. That is, is there a point where, due to familiarity, they find OS as effortful as HS?
6. Conclusions
We performed two different experiments to collect intelligibility and LE metrics for OS and HS. The first experiment, a web-based one, was used to collect intelligibility and self-reported LE metrics. The conclusions of this experiment were that speaker type (HS or OS) had an effect on both intelligibility and effort. There was significant correlation between WER and LE. Listeners familiar with OS fared the same for intelligibility as people who were not. However, they reported less effort in listening to OS than the not familiar listeners. The ASR intelligibility was poorer for OS compared to HS.
The second experiment was to measure listening effort for HS and OS in a laboratory setting. The conclusions were that even if the intelligibility of OS was close to HS, there was a considerable difference in LE.
LE obtained through these experiments is based on the listener’s own interpretation of ’effort involved in listening’. Our future task involves the analysis of EEG data, which is a direct physiological measure, and looking into its correlation with this self-reported measure of LE.
Another ongoing task is to build an OS restoration system aimed at better ASR and HSR intelligibility and low LE. The methods used in this study will be used to evaluate the outputs of this system.
Both HSR intelligibility and ASR intelligibility play different but important roles in OS evaluation. While improved HSR would enable better human–human interactions, an improved ASR performance would enable better human–machine interactions (e.g., digital voice assistants). Lower LE would also contribute towards improved communication with fellow humans. The evaluation of all these three metrics provides an all-round understanding of OS speech perception.
Supplementary Materials
The following are available at https://www.mdpi.com/2076-3417/9/16/3233/s1, Excel S1: Intelligibility and Listening Effort of Spanish Oesophageal Speech.
Author Contributions
Conceptualization, S.R., I.H., E.N., A.W.; methodology, S.R., I.H., E.N., A.W.; software, L.S., S.R.; validation, S.R.; formal analysis, S.R.; investigation, S.R., I.H., E.N., A.W.; resources, S.R., I.H., E.N., L.S., A.W.; data curation, S.R.; writing–original draft preparation, S.R.; writing–review and editing, S.R., I.H., E.N., A.W.; visualization, S.R.; supervision, I.H., E.N., A.W.; project administration, I.H., E.N.; funding acquisition, I.H.
Funding
This project was supported by funding from the EUs H2020 research and innovation programme under the MSCA GA 67532*4 (the ENRICH network: www.enrich-etn.eu), the Spanish Ministry of Economy and Competitiveness with FEDER support (RESTORE project, TEC2015-67163-C2-1-R) and the Basque Government (DL4NLP KK-2019/00045, PIBA_2018_1_0035 and IT355-19).
Acknowledgments
We would like to thank Amy Hall, Franz Müller, Peio Azkueta, and Niklas Grunewald for helping with the listening test setup of our second experiment.
Conflicts of Interest
The authors declare no conflict of interest. The funders had no role in the design of the study; in the collection, analyses, or interpretation of data; in the writing of the manuscript; or in the decision to publish the results.
Abbreviations
The following abbreviations are used in this manuscript:
| OS | Oesophageal Speech |
| HS | Healthy Speech |
| ELS | Electrolaryngeal Speech |
| TOS | Tracheoesophageal Speech |
| SRT | Speech Reception Threshold |
| STOI | Short Term Objective Intelligibility |
| MOS | Mean Opinion Score |
| ASR | Automatic Speech Recognition |
| HSR | Human Speech Recognition |
| SD | Standard Deviation |
| LE | Listening Effort |
| WER | Word Error Rate |
| MFCC | Mel Frequency Cepstral Coefficients |
| CMVN | Cepstral Mean Variance Normalisation |
| OOV | Out of Vocabulary |
| EEG | Electroencephalography |
| SPL | Sound Pressure Level |
| KS | Kolmogorov–Smirnov |
References
- Koike, M.; Kobayashi, N.; Hirose, H.; Hara, Y. Speech rehabilitation after total laryngectomy. Acta Otolaryngol. 2002, 122, 107–112. [Google Scholar] [CrossRef]
- Štajner-katušić, S.; Horga, D.; Mušura, M.; Globlek, D. Voice and speech after laryngectomy. Clin. Linguist. Phon. 2006, 20, 195–203. [Google Scholar] [CrossRef] [PubMed]
- Weinberg, B. Acoustical Properties of Esophageal and Tracheoesophageal Speech. In Laryngectomee Rehabilitation; College Hill Press: San Diego, CA, USA, 1986; pp. 113–127. [Google Scholar]
- Most, T.; Tobin, Y.; Mimran, R.C. Acoustic and perceptual characteristics of esophageal and tracheoesophageal speech production. J. Commun. Disord. 2000, 33, 165–181. [Google Scholar] [CrossRef]
- Mohide, E.A.; Archibald, S.D.; Tew, M.; Young, J.E.; Haines, T. Postlaryngectomy quality-of-life dimensions identified by patients and health care professionals. Am. J. Surg. 1992, 164, 619–622. [Google Scholar] [CrossRef]
- Lippmann, R.P. Speech recognition by machines and humans. Speech Commun. 1997, 22, 1–15. [Google Scholar] [CrossRef] [Green Version]
- Pichora-Fuller, M.K.; Kramer, S.E.; Eckert, M.A.; Edwards, B.; Hornsby, B.W.; Humes, L.E.; Lemke, U.; Lunner, T.; Matthen, M.; Mackersie, C.L.; et al. Hearing impairment and cognitive energy: The framework for understanding effortful listening (FUEL). Ear Hear. 2016, 37, 5S–27S. [Google Scholar] [CrossRef]
- Cullinan, W.L.; Brown, C.S.; Blalock, P.D. Ratings of intelligibility of esophageal and tracheoesophageal speech. J. Commun. Disord. 1986, 19, 185–195. [Google Scholar] [CrossRef]
- Steeneken, H.J. The measurement of speech intelligibility. Proceedings of Institute of Acoustics; Institute of Acoustics: Milton Keynes, UK, 2001; Volume 23, pp. 69–76. [Google Scholar]
- Andersen, A.H.; de Haan, J.M.; Tan, Z.H.; Jensen, J. A non-intrusive short-time objective intelligibility measure. In Proceedings of the 2017 IEEE International Conference on Acoustics, Speech and Signal Processing (ICASSP), New Orleans, LA, USA, 5–9 March 2017; IEEE: Piscataway, NJ, USA, 2017; pp. 5085–5089. [Google Scholar]
- Sharma, D.; Wang, Y.; Naylor, P.A.; Brookes, M. A data-driven non-intrusive measure of speech quality and intelligibility. Speech Commun. 2016, 80, 84–94. [Google Scholar] [CrossRef]
- Van Kuyk, S.; Kleijn, W.B.; Hendriks, R.C. An evaluation of intrusive instrumental intelligibility metrics. IEEE/ACM Trans. Audio Speech Lang. Process. 2018, 26, 2153–2166. [Google Scholar] [CrossRef]
- Yorkston, K.M.; Beukelman, D.R. A comparison of techniques for measuring intelligibility of dysarthric speech. J. Commun. Disord. 1978, 11, 499–512. [Google Scholar] [CrossRef]
- Meyers, J.E.; Volkert, K.; Diep, A. Sentence repetition test: Updated norms and clinical utility. Appl. Neuropsychol. 2000, 7, 154–159. [Google Scholar] [CrossRef] [PubMed]
- Scharenborg, O. Reaching over the gap: A review of efforts to link human and automatic speech recognition research. Speech Commun. 2007, 49, 336–347. [Google Scholar] [CrossRef] [Green Version]
- Maier, A.; Haderlein, T.; Eysholdt, U.; Rosanowski, F.; Batliner, A.; Schuster, M.; Nöth, E. PEAKS—A system for the automatic evaluation of voice and speech disorders. Speech Commun. 2009, 51, 425–437. [Google Scholar] [CrossRef]
- Middag, C.; Bocklet, T.; Martens, J.P.; Nöth, E. Combining phonological and acoustic ASR-free features for pathological speech intelligibility assessment. In Proceedings of the 12th Annual Conference of the International Speech Communication Association, Florence, Italy, 27–31 August 2011. [Google Scholar]
- Middag, C.; Martens, J.P.; Van Nuffelen, G.; de Bodt, M. Dia: A tool for objective intelligibility assessment of pathological speech. In Proceedings of the 6th International Workshop on Models and Analysis of Vocal Emissions for Biomedical Applications, Florence, Italy, 14–16 December 2009; Firenze University Press: Florence, Italy, 2009; pp. 165–167. [Google Scholar]
- Miralles, J.L.; Cervera, T. Voice intelligibility in patients who have undergone laryngectomies. J. Speech Lang. Hear. Res. 1995, 38, 564–571. [Google Scholar] [CrossRef]
- Cervera, T.; Miralles, J.L.; González-Àlvarez, J. Acoustical analysis of Spanish vowels produced by laryngectomized subjects. J. Speech Lang. Hear. Res. 2001, 44, 988–996. [Google Scholar] [CrossRef]
- Mantilla, A.; Pérez-Meana, H.; Mata, D.; Angeles, C.; Alvarado, J.; Cabrera, L. Recognition of vowel segments in Spanish esophageal speech using hidden Markov models. In Proceedings of the 15th International Conference on Computing, Mexico City, Mexico, 21–24 November 2006; pp. 115–120. [Google Scholar]
- McGarrigle, R.; Munro, K.J.; Dawes, P.; Stewart, A.J.; Moore, D.R.; Barry, J.G.; Amitay, S. Listening effort and fatigue: What exactly are we measuring? A British society of audiology cognition in hearing special interest group ‘white paper’. Int. J. Audiol. 2014, 53, 433–445. [Google Scholar] [CrossRef] [PubMed]
- Rennies, J.; Schepker, H.; Holube, I.; Kollmeier, B. Listening effort and speech intelligibility in listening situations affected by noise and reverberation. J. Acoust. Soc. Am. 2014, 136, 2642–2653. [Google Scholar] [CrossRef] [PubMed]
- Borghini, G.; Hazan, V. Listening effort during sentence processing is increased for non-native listeners: A pupillometry study. Front. Neurosci. 2018, 12, 152. [Google Scholar] [CrossRef]
- Van Engen, K.J.; Peelle, J.E. Listening effort and accented speech. Front. Hum. Neurosci. 2014, 8, 577. [Google Scholar] [CrossRef] [Green Version]
- Hicks, C.B.; Tharpe, A.M. Listening effort and fatigue in school-age children with and without hearing loss. J. Speech Lang. Hear. Res. 2002, 45, 573–584. [Google Scholar] [CrossRef]
- Whitehill, T.L.; Wong, C.C.Y. Contributing factors to listener effort for dysarthric speech. J. Med. Speech Lang. Pathol. 2006, 14, 335–342. [Google Scholar]
- Landa, S.; Pennington, L.; Miller, N.; Robson, S.; Thompson, V.; Steen, N. Association between objective measurement of the speech intelligibility of young people with dysarthria and listener ratings of ease of understanding. Int. J. Speech Lang. Pathol. 2014, 16, 408–416. [Google Scholar] [CrossRef] [PubMed] [Green Version]
- Cote-Reschny, K.J.; Hodge, M.M. Listener effort and response time when transcribing words spoken by children with dysarthria. J. Med. Speech Lang. Pathol. 2010, 18, 24–35. [Google Scholar]
- Bennett, S.; Weinberg, B. Acceptability ratings of normal, esophageal, and artificial larynx speech. J. Speech Lang. Hear. Res. 1973, 16, 608–615. [Google Scholar] [CrossRef]
- Nagle, K.F.; Eadie, T.L. Listener effort for highly intelligible tracheoesophageal speech. J. Commun. Disord. 2012, 45, 235–245. [Google Scholar] [CrossRef] [PubMed] [Green Version]
- Raman, S.; Hernaez, I.; Navas, E.; Serrano, L. Listening to laryngectomees: A study of intelligibility and self-reported listening effort of Spanish oesophageal speech. In Proceedings of the IberSPEECH 2018, Barcelona, Spain, 21–23 November 2018; pp. 107–111. [Google Scholar]
- Sainz, I.; Erro, D.; Navas, E.; Hernáez, I.; Sanchez, J.; Saratxaga, I.; Odriozola, I. Versatile speech databases for high quality synthesis for Basque. In Proceedings of the 8th International Conference on Language Resources and Evaluation (LREC), Istanbul, Turkey, 21–27 May 2012; pp. 3308–3312. [Google Scholar]
- Erro, D.; Hernáez, I.; Navas, E.; Alonso, A.; Arzelus, H.; Jauk, I.; Hy, N.Q.; Magarinos, C.; Pérez-Ramón, R.; Sulír, M.; et al. ZureTTS: Online platform for obtaining personalized synthetic voices. In Proceedings of the eNTERFACE’14, Bilbao, Spain, 9 June–4 July 2014; pp. 1178–1193. [Google Scholar]
- Sesma, A.; Moreno, A. Corpuscrt 1.0: Diseno de Corpus Orales Equilibrados. Computer Program. 2000. Available online: http://gps-tsc.upc.es/veu/personal/sesma/CorpusCrt.php3 (accessed on 7 August 2019).
- Erro, D.; Hernaez, I.; Alonso, A.; Garcí-Lorenzo, D.; Navas, E.; Ye, J.; Arzelus, H.; Jauk, I.; Hy, N.Q.; Magariñ, C.; et al. Personalized synthetic voices for speaking impaired: Website and app. In Proceedings of the 16th Annual Conference of the International Speech Communication Association, Dresden, Germany, 6–10 September 2015. [Google Scholar]
- Tits, N. Exploring the Parameters Describing the Quality and Intelligibility of Alaryngeal Voices. Master’s Thesis, University of Mons, Mons, Belgium, June 2017. [Google Scholar]
- Drugman, T.; Rijckaert, M.; Janssens, C.; Remacle, M. Tracheoesophageal speech: A dedicated objective acoustic assessment. Comput. Speech Lang. 2015, 30, 16–31. [Google Scholar] [CrossRef]
- Preece, D.A. Latin squares, Latin cubes, Latin rectangles. In Wiley StatsRef: Statistics Reference Online; Wiley Online Library: Hoboken, NJ, USA, 2014. [Google Scholar]
- Povey, D.; Ghoshal, A.; Boulianne, G.; Burget, L.; Glembek, O.; Goel, N.; Hannemann, M.; Motlicek, P.; Qian, Y.; Schwarz, P.; et al. The Kaldi speech recognition toolkit. In Proceedings of the IEEE Workshop on Automatic Speech Recognition and Understanding, Hilton Waikoloa Village, HI, USA, 11–15 December 2011. [Google Scholar]
- Rath, S.P.; Povey, D.; Veselỳ, K.; Cernockỳ, J. Improved feature processing for deep neural networks. In Proceedings of the 14th Annual Conference of the International Speech Communication Association, Lyon, France, 25–29 August 2013; pp. 109–113. [Google Scholar]
- Serrano, L.; Tavarez, D.; Odriozola, I.; Hernaez, I.; Saratxaga, I. Aholab system for Albayzin 2016 search-on-speech evaluation. In Proceedings of the IberSPEECH 2016, Lisbon, Portugal, 23–25 November 2016; pp. 33–42. [Google Scholar]
- Serrano, L.; Tavarez, D.; Sarasola, X.; Raman, S.; Saratxaga, I.; Navas, E.; Hernaez, I. LSTM Based Voice Conversion for Laryngectomees. In Proceedings of the IberSPEECH 2018, Barcelona, Spain, 21–23 November 2018; pp. 122–126. [Google Scholar]
- Levenshtein, V.I. Binary codes capable of correcting deletions, insertions, and reversals. Sov. Phys. Dokl. 1966, 10, 707–710. [Google Scholar]
- Polityko, E. Word Error Rate. Available online: https://www.mathworks.com/examples/matlab/community/19873-word-error-rate (accessed on 20 February 2018).
- JASP Team. JASP (Version 0.8.6); Computer Software. Available online: https://jasp-stats.org/ (accessed on 20 February 2018).
- Eriksen, C.W. The flankers task and response competition: A useful tool for investigating a variety of cognitive problems. Vis. Cognit. 1995, 2, 101–118. [Google Scholar] [CrossRef]
- Hilbert, S.; Nakagawa, T.T.; Puci, P.; Zech, A.; Bühner, M. The digit span backwards task. Eur. J. Psychol. Assess. 2015, 31, 174–180. [Google Scholar] [CrossRef]
Figure 1.
Mean speakerwise ‘All words’ and ‘content words only’ Word Error Rates (WER) for ‘familiar’ and ‘not familiar’ listeners. OM1, OM2, OM3, OF1 are oesophageal speakers; HM1 and HF1 are healthy speakers. Higher WER corresponds to lower intelligibility. Error bars show 95% confidence intervals.
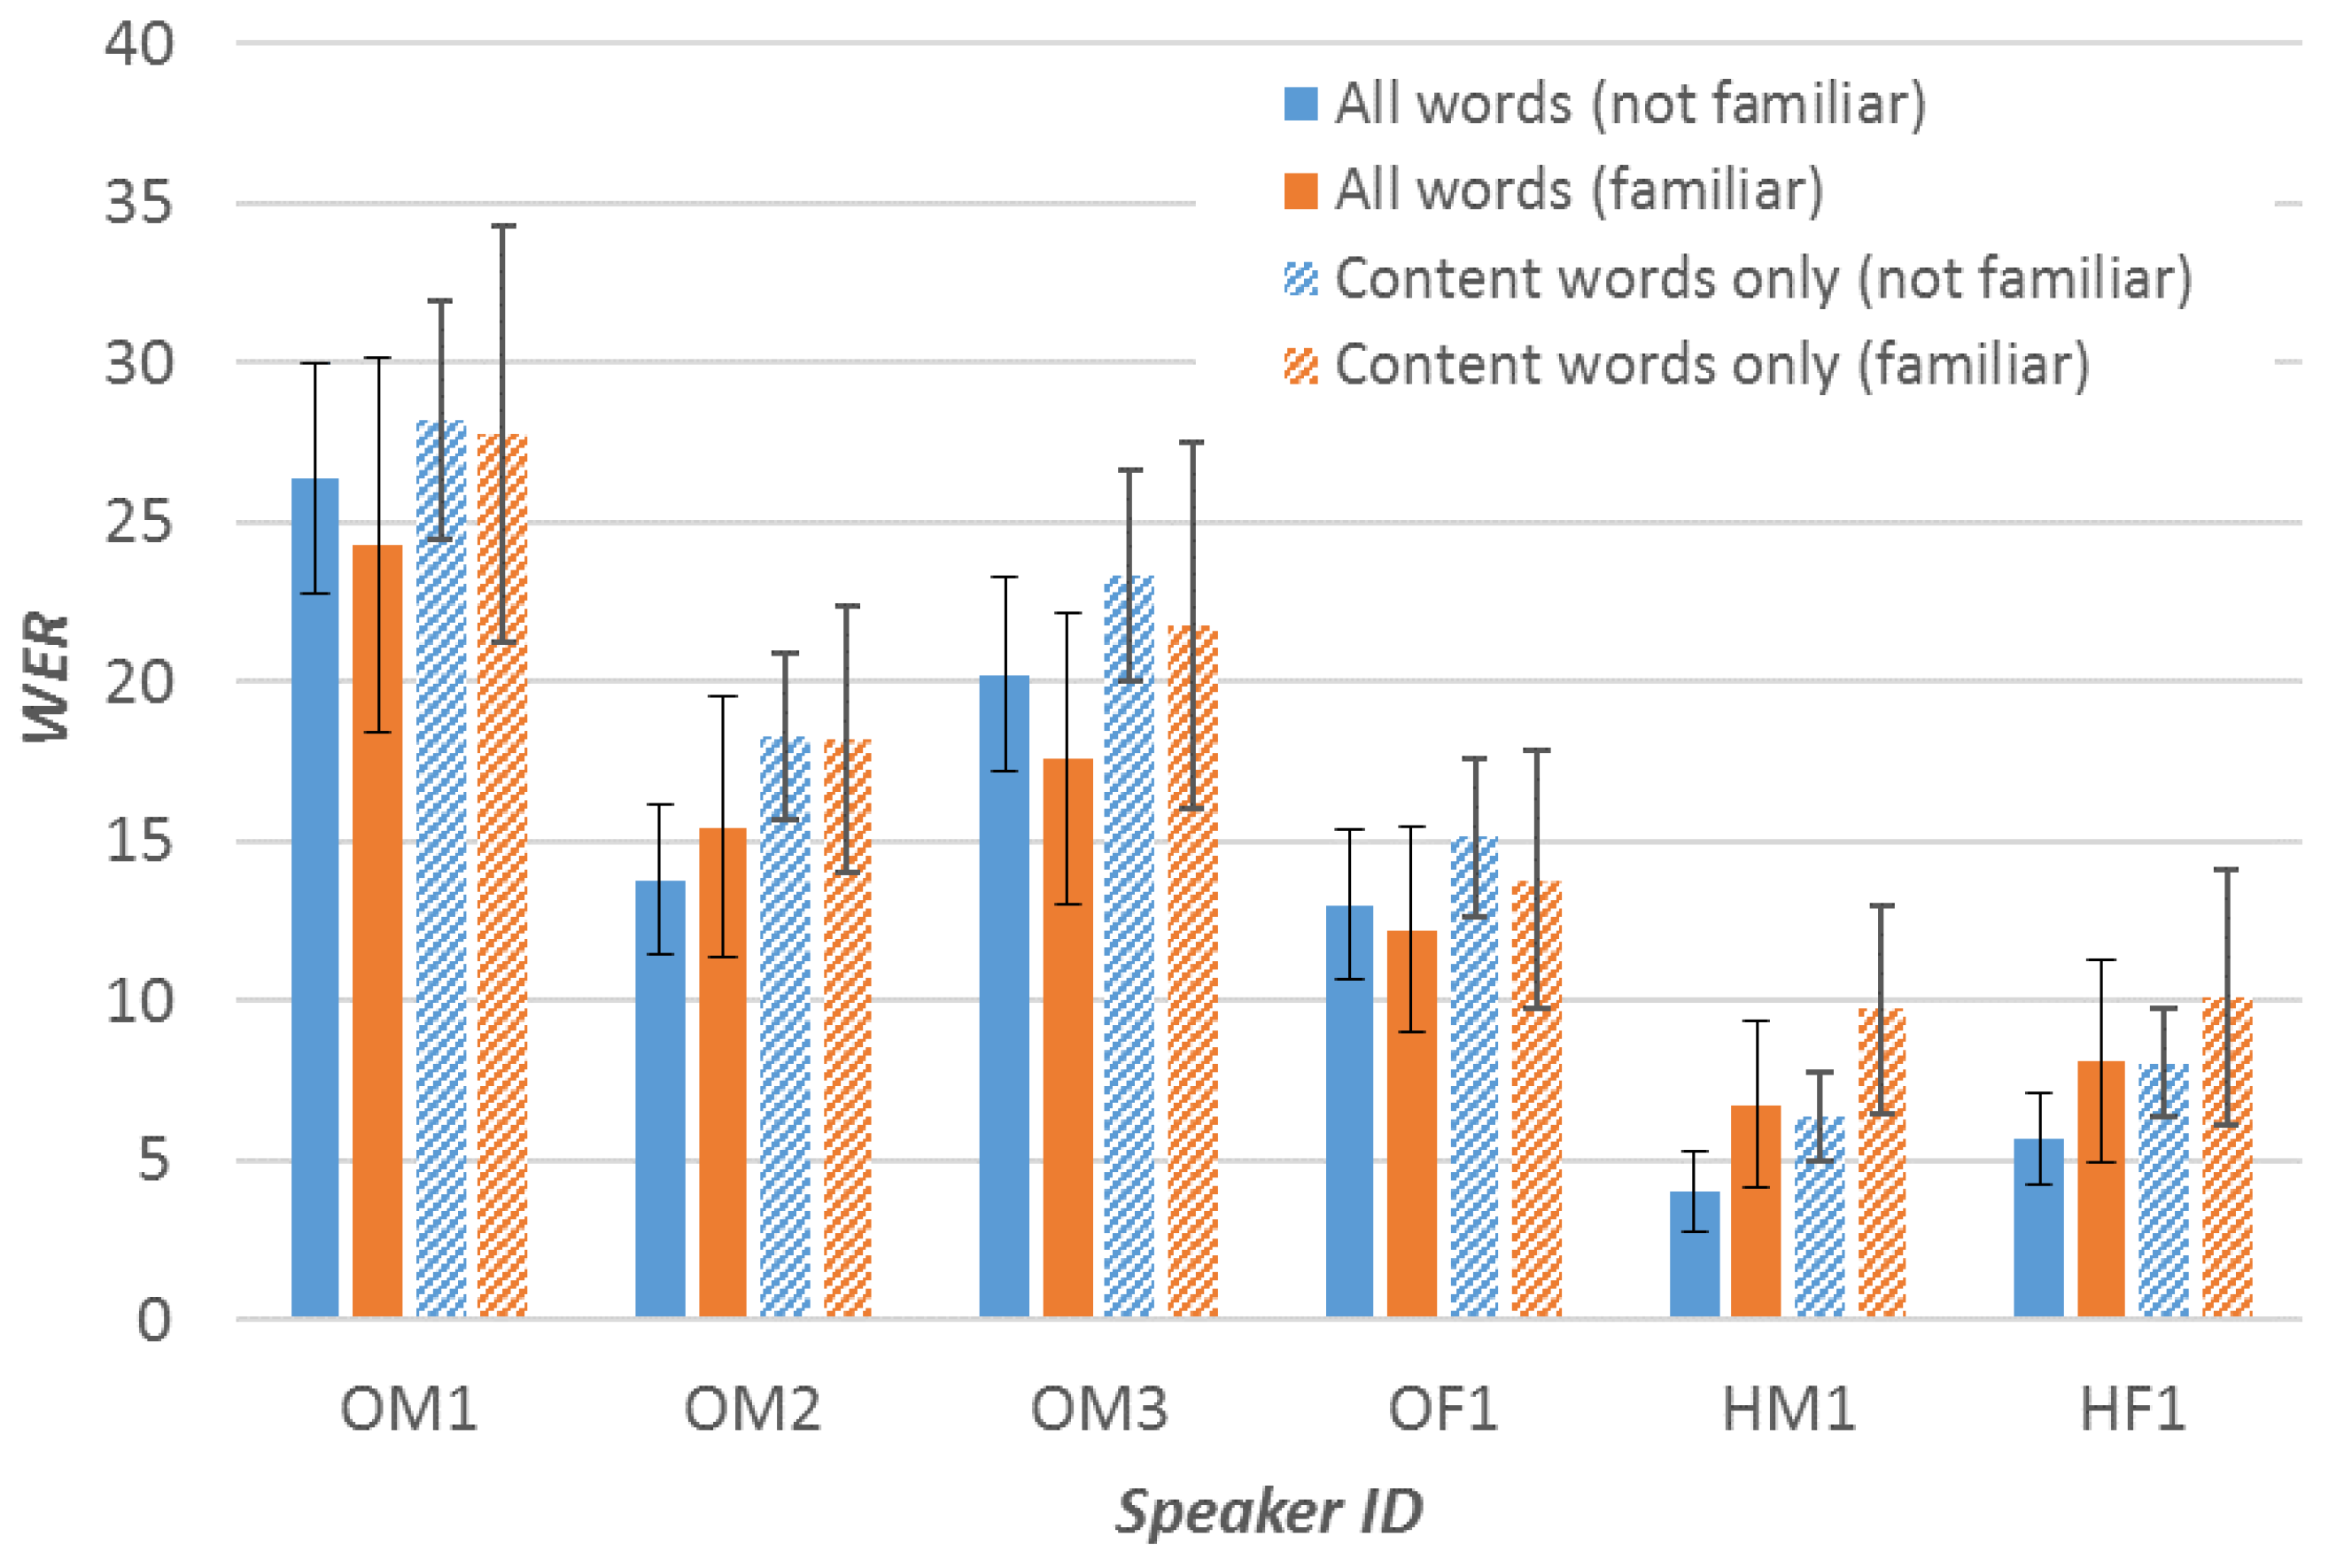
Figure 2.
Mean speakerwise Listening Effort for oesophageal (OM1, OM2, OM3, OF1) and healthy (HM1, HF1) speakers. On the y-axis, 1 corresponds to least effortful and 5 to most effortful. Error bars show 95% confidence intervals.
Figure 2.
Mean speakerwise Listening Effort for oesophageal (OM1, OM2, OM3, OF1) and healthy (HM1, HF1) speakers. On the y-axis, 1 corresponds to least effortful and 5 to most effortful. Error bars show 95% confidence intervals.
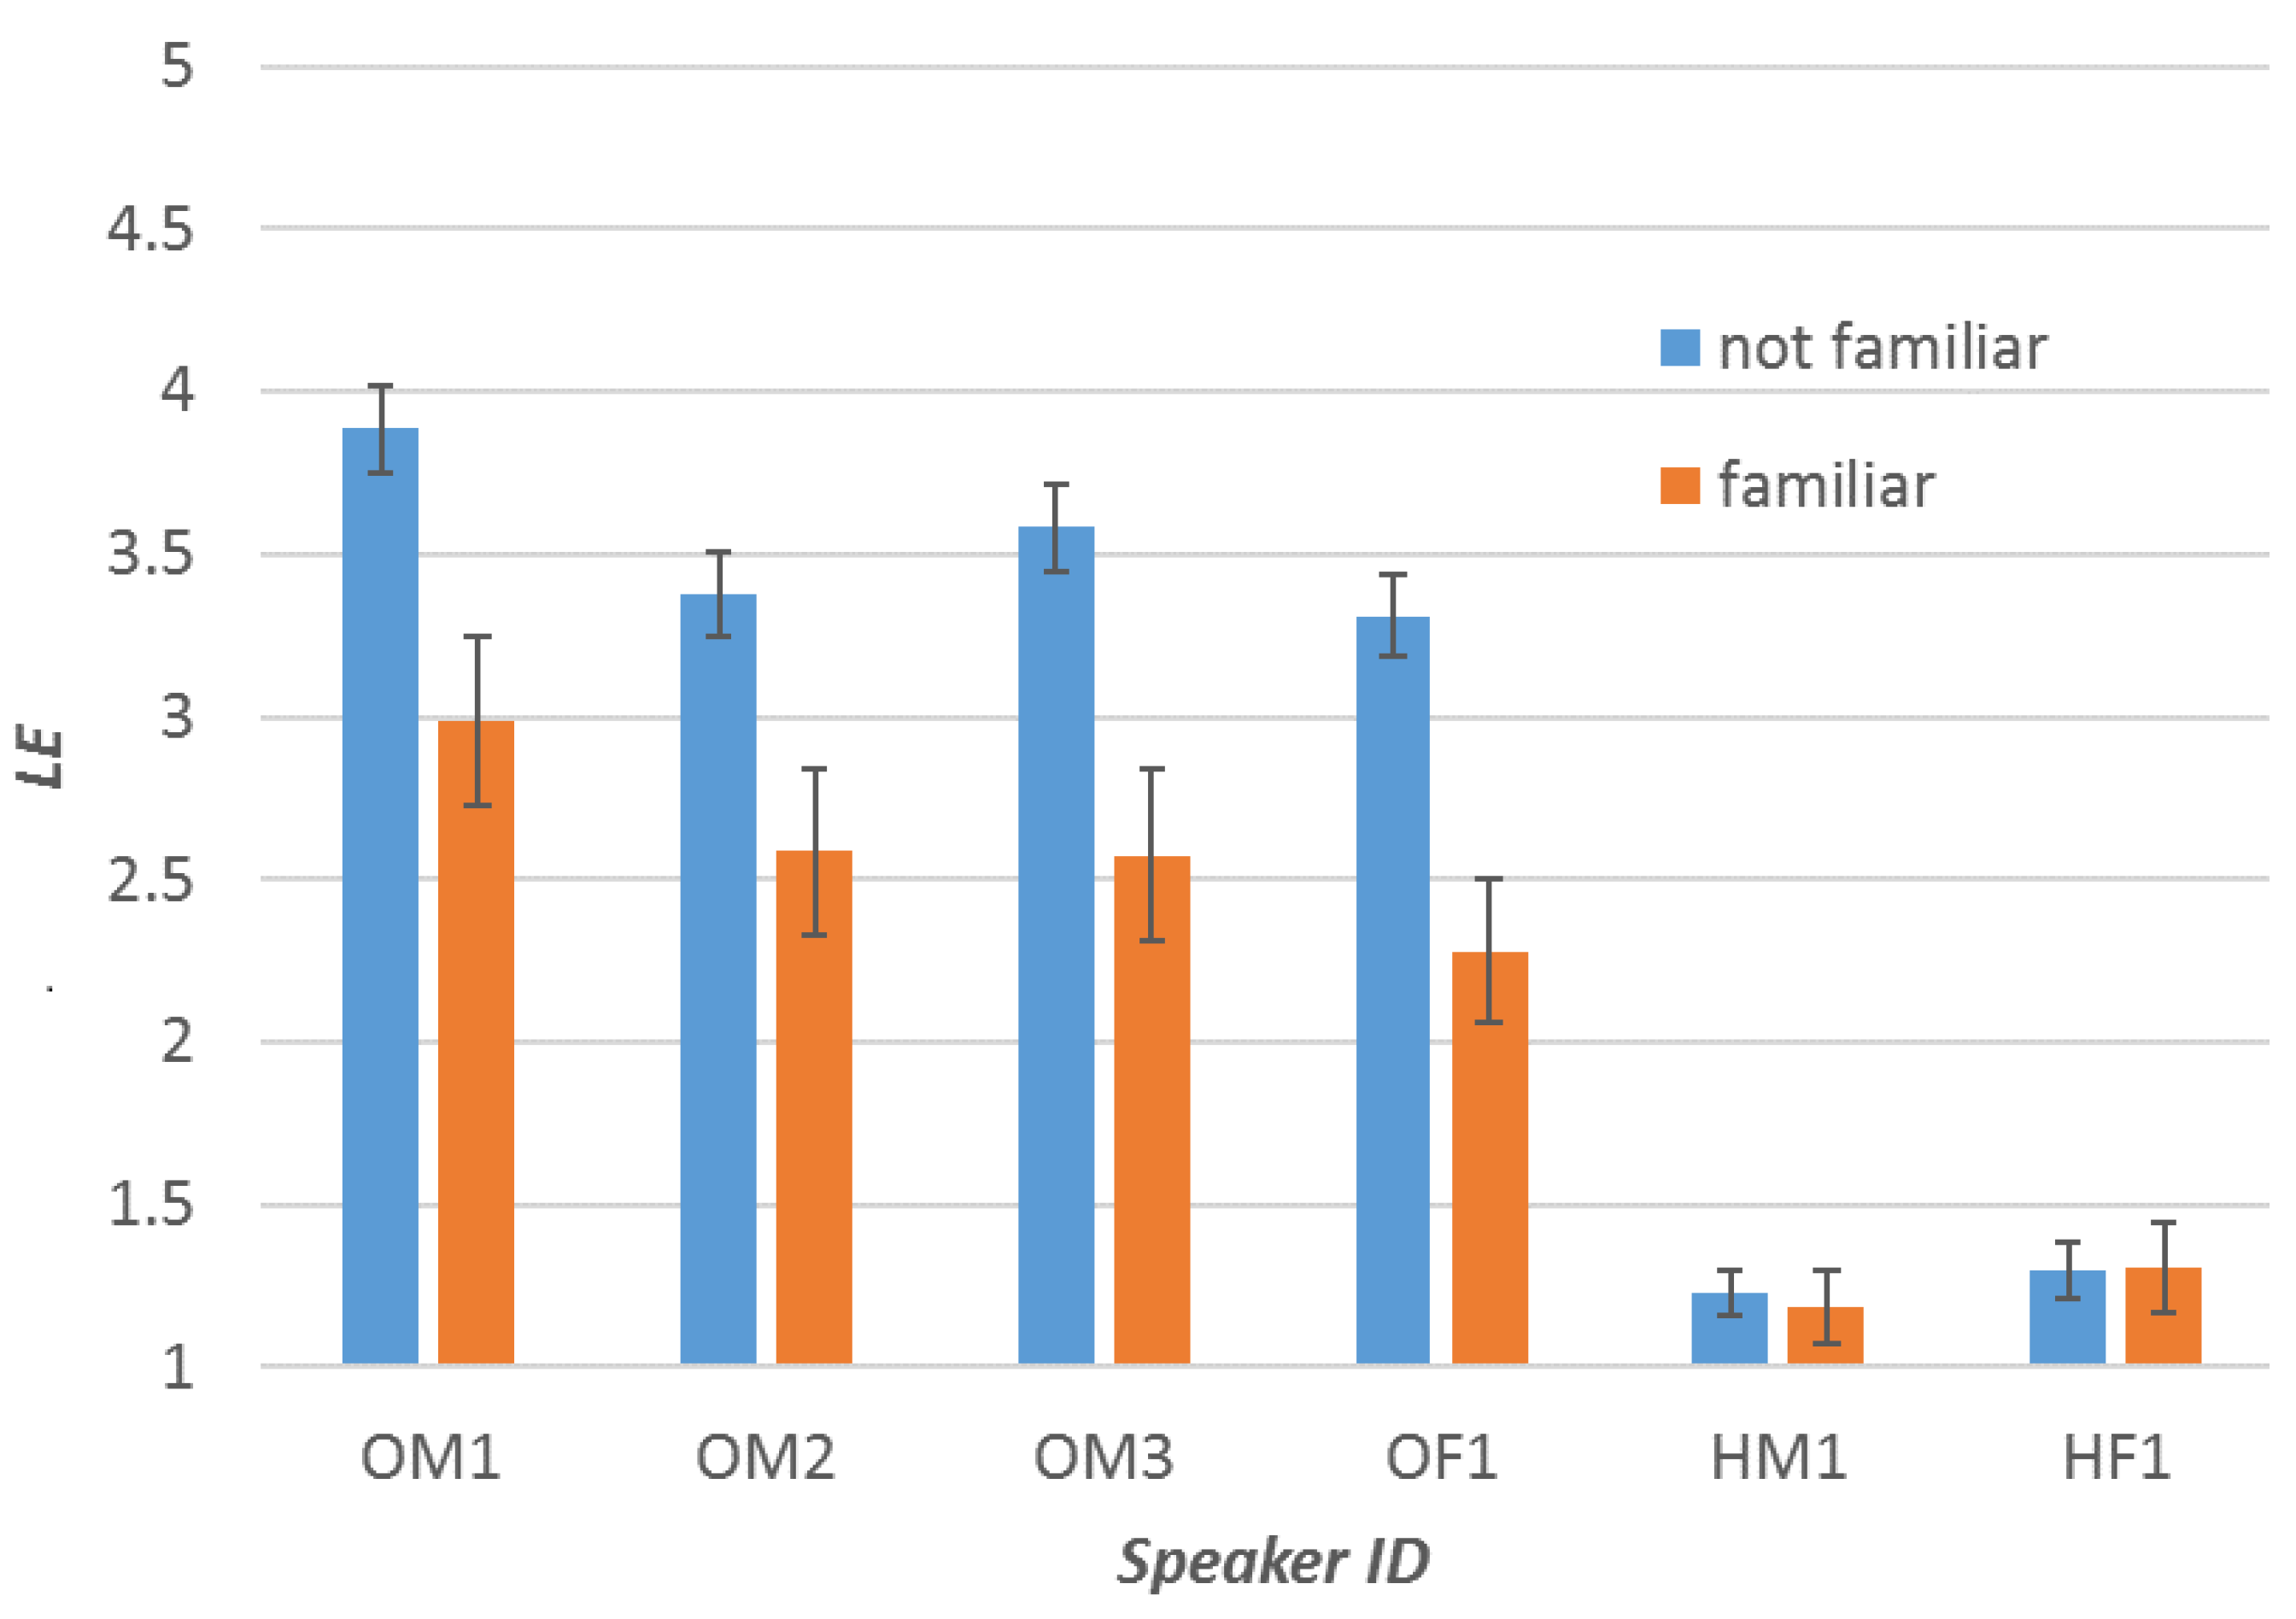
Figure 3.
Word Error Rates (WER) for Human Speech Recognition (HSR) and Automatic Speech Recognition (ASR) for oesophageal (OM1, OM2, OM3, OF1) and healthy (HM1, HF1) speakers.
Figure 3.
Word Error Rates (WER) for Human Speech Recognition (HSR) and Automatic Speech Recognition (ASR) for oesophageal (OM1, OM2, OM3, OF1) and healthy (HM1, HF1) speakers.
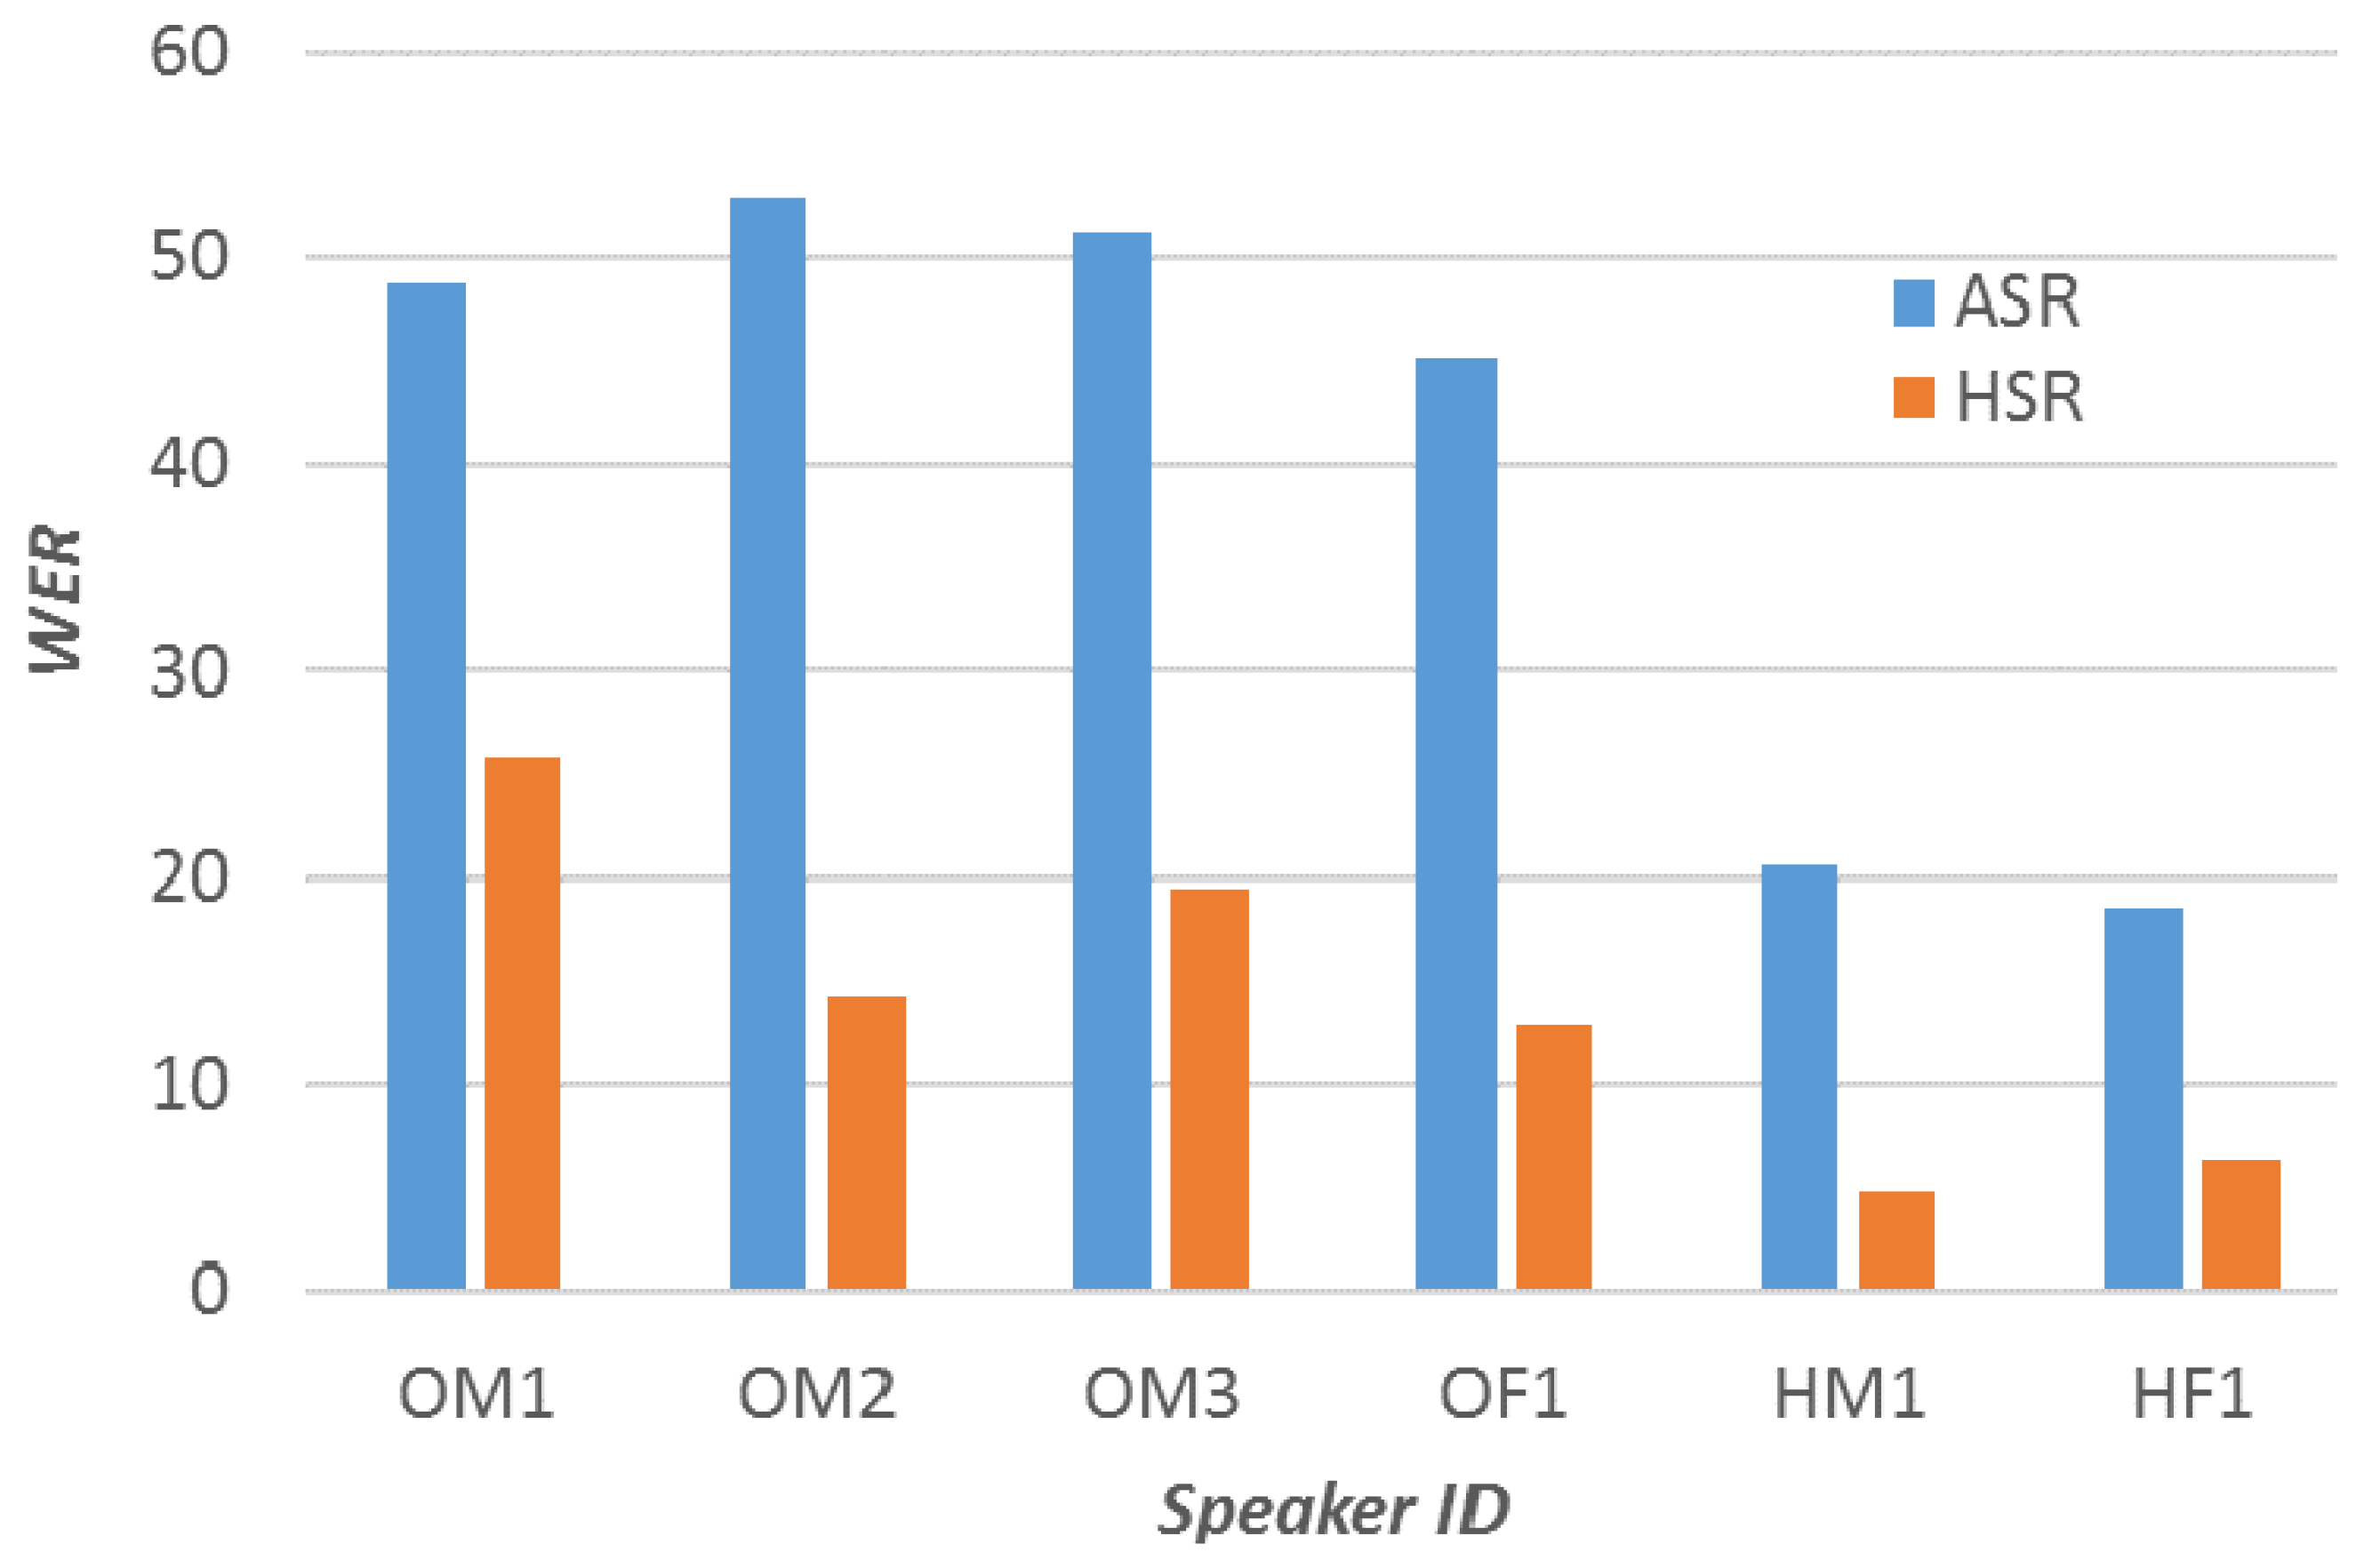
Figure 4.
WER and LE for oesophageal (OF1) and healthy (HF1) speakers. Error bars show 95% confidence intervals.
Figure 4.
WER and LE for oesophageal (OF1) and healthy (HF1) speakers. Error bars show 95% confidence intervals.

Table 1.
Mean Word Error Rate (WER) and Listening Effort (LE) of Oesophageal Speech (OS) and Healthy Speech (HS) for familiar and not familiar listeners.
Table 1.
Mean Word Error Rate (WER) and Listening Effort (LE) of Oesophageal Speech (OS) and Healthy Speech (HS) for familiar and not familiar listeners.
| OS | HS | ||
|---|---|---|---|
| WER (in %) | Familiar | 17.39 | 7.42 |
| Not familiar | 18.35 | 4.85 | |
| Total mean WER | 17.87 | 6.16 | |
| LE | Familiar | 2.61 | 1.25 |
| Not familiar | 3.54 | 1.26 | |
| Total mean LE | 3.07 | 1.255 |
Table 2.
LE rating labels, their English translations, and the values assigned.
| LE Rating Labels | English Translations | Values Assigned |
|---|---|---|
| Muchísimo esfuerzo | Extreme effort | 13 |
| – | – | 12 |
| Mucho esfuerzo | A lot of effort | 11 |
| – | – | 10 |
| Esfuerzo considerable | Considerable effort | 9 |
| – | – | 8 |
| Esfuerzo moderado | Moderate effort | 7 |
| – | – | 6 |
| Poco esfuerzo | Little effort | 5 |
| – | – | 4 |
| Muy poco esfuerzo | Very little effort | 3 |
| – | – | 2 |
| Ningún esfuerzo | No effort | 1 |
© 2019 by the authors. Licensee MDPI, Basel, Switzerland. This article is an open access article distributed under the terms and conditions of the Creative Commons Attribution (CC BY) license (http://creativecommons.org/licenses/by/4.0/).
Share and Cite
MDPI and ACS Style
Raman, S.; Serrano, L.; Winneke, A.; Navas, E.; Hernaez, I. Intelligibility and Listening Effort of Spanish Oesophageal Speech. Appl. Sci. 2019, 9, 3233. https://doi.org/10.3390/app9163233
AMA Style
Raman S, Serrano L, Winneke A, Navas E, Hernaez I. Intelligibility and Listening Effort of Spanish Oesophageal Speech. Applied Sciences. 2019; 9(16):3233. https://doi.org/10.3390/app9163233
Chicago/Turabian StyleRaman, Sneha, Luis Serrano, Axel Winneke, Eva Navas, and Inma Hernaez. 2019. "Intelligibility and Listening Effort of Spanish Oesophageal Speech" Applied Sciences 9, no. 16: 3233. https://doi.org/10.3390/app9163233
Note that from the first issue of 2016, this journal uses article numbers instead of page numbers. See further details here.