TIR-MS: Thermal Infrared Mean-Shift for Robust Pedestrian Head Tracking in Dynamic Target and Background Variations


Department of Electronics Engineering, Yeungnam University, 280 Daehak-ro, Gyeongsan-si 38541, Korea
*
Author to whom correspondence should be addressed.
Appl. Sci. 2019, 9(15), 3015; https://doi.org/10.3390/app9153015
Submission received: 29 May 2019
/
Revised: 16 July 2019
/
Accepted: 19 July 2019
/
Published: 26 July 2019
(This article belongs to the Special Issue Intelligence Systems and Sensors)
Abstract
:Thermal infrared (TIR) pedestrian tracking is one of the major issues in computer vision. Mean-shift is a powerful and versatile non-parametric iterative algorithm for finding local maxima in probability distributions. In existing infrared data, and mean-shift-based tracking is generally based on the brightness feature values. Unfortunately, the brightness is distorted by the target and background variations. This paper proposes a novel pedestrian tracking algorithm, thermal infrared mean-shift (TIR-MS), by introducing radiometric temperature data in mean-shift tracking. The thermal brightness image (eight-bits) was distorted by the automatic contrast enhancement of the scene such as hot objects in the background. On the other hand, the temperature data was unaffected directly by the background change, except for variations by the seasonal effect, which is more stable than the brightness. The experimental results showed that the TIR-MS outperformed the original mean-shift-based brightness when tracking a pedestrian head with successive background variations.
Keywords:
pedestrian tracking; infrared; temperature; brightness; background contrast; radiometry; mean shift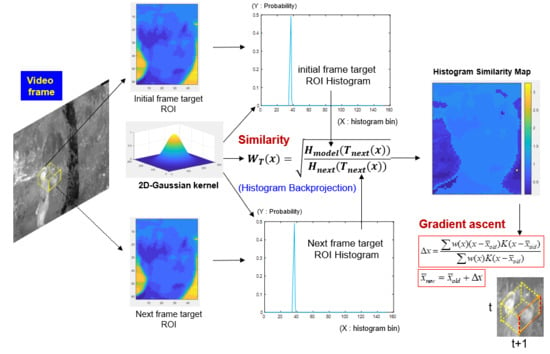
1. Introduction
Many studies have attempted to solve pedestrian tracking problems, but challenging issues still remain due to a range of factors, such as Region of Interest (ROI) size and background variation, background clutter, pedestrian motion, and drifting of object. Mean-shift is a kernel object tracking of non-rigid objects based on visual features, such as color and/or brightness, whose statistical distributions characterize the object of interest [1]. In the case of infrared pedestrian tracking, pedestrians, whose images are captured by a single stationary infrared camera, are represented based on the pixel brightness. In particular, Wang has raised the opinion that mean-shift-based IR object tracking becomes increasingly difficult due to the target variations, background clutter, and the lack of homogeneity of brightness in the background area [2]. Extracting the characteristic information of the object separated from the background is very difficult when the brightness values of the background and object are equal. Previous studies have focused on methods using image pre-processing [3,4,5], optimizing parameter settings [6,7,8] and combining tracking algorithms [9,10,11]. The conventional methodologies, such as brightness-based baseline methods, have limitations in solving poor imaging contrast issues [12]. On the other hand, the temperature data is unaffected directly by the image contrast and target variation because the pedestrian temperature does not change abruptly and is limited to a specific thermal range with thermoregulation [13]. Therefore, this paper addresses the pedestrian tracking method using the temperature, which is a further development from previous work.
This paper presents three main contributions. First, the temperature information feature is used based on the 14-bit digital count value instead of converting the histogram based on the existing eight-bit relative brightness feature. This method is robust against background change, poor image contrast, and target variation when the temperature information feature is applied to the mean-shift. Finally, if there is no temperature information, the histogram bin is extracted from the digital count to assess the tracking performance and speed improvement.
The remainder of this paper is organized as follows. Section 2 briefly introduces previous studies related to the IR brightness-based method weak point of brightness. Section 3 outlines the proposed temperature infrared mean-shift called TIR-MS. Section 4 introduces various experimental results and finally, Section 5 reports the conclusion.
2. Related Works
2.1. Pedestrian Tracking for Thermal Infrared Image
Thermal infrared (TIR) pedestrian tracking has a major advantage. The main advantages of thermal sensors are their ability to see in complete darkness, their robustness to illumination changes and shadow effects. It has wide applications such as surveillance, driving assistance, and rescue at night [14]. In particular, multiple-target tracking is generally researched using tracking-by-detection method [15,16,17]. These were introduced for a real-time pedestrian detection and tracking from a moving vehicle in night time. Also, many single TIR trackers, such as Adaptive Structural Local Appearance Model tracker (ASLA) [18], Enhanced Distribution Field Tracking (EDFT) [19], Sparsity-based Collaborative Model tracker (SCM) [20], Discriminative Scale Space Tracking (DSST) [21] introduced in the Visual Object Tracking (VOT) challenge. Most trackers based on spatial structure and/or sparse representations are ranked better on visual imagery than they are on thermal imagery [22]. Additionally, 24 trackers were introduced in the VOT-TIR2015 challenge. The following trackers were based on various features such as color, or histogram of oriented gradient (HOG) [23]. The tracking-by-detection approach commonly uses HOG features, especially in the advanced driver assistance systems (ADASs) [24]. From the result of the VOT-TIR2015 challenge, it was demonstrated is that tuning of input features is more important to maintain good performance. However, there is not yet introduced temperature feature-based trackers.
2.2. Pedestrian Tracking Based Mean-Shift Using Brightness
The problem of tracking objects and pedestrians has been studied for almost two decades and remains a major challenge for crowded scenes [25]. One major difficulty in pedestrian tracking is to choose suitable features and models to recognize and track the target. Common choices of features to characterize visual objects include color, intensity, shape, and feature points. The most popular pedestrian tracking approach is mean-shift [1,26] which uses color histogram. A simple color histogram is used to encode the appearance of the object to be tracked, while a gradient ascent optimization scheme moves the tracker to the best location in the next frame of the video sequence [27]. Mean-shift is simple to implement and consumes less computational time. Long-term tracking-based mean-shift is commonly researched, especially in the pedestrian tracking field [28]. Pedestrian tracking-based mean-shift remains a challenge in part because there is a large variability in their appearance and illumination, which makes it difficult for color-based template tracking algorithms to consistently track them. In addition, there is a limitation that the histogram distribution varies according to the target size and shape. Recently, many approaches have been proposed for recurrent neural network (RNN) and Convolutional Neural Network (CNN)-based pedestrian tracking [29,30,31]. This approach appears to be very interesting and powerful because the steps required for feature extraction from the segmented ROIs are overcome because of the deep learning architectures that make use of deep classifiers. In a more complex environment, however, visual tracking with deep learning requires a huge deep network. This can result in complex and time consuming calculations, making it is difficult to achieve efficient tracking.
2.3. Limitation of Brightness
Figure 1 shows the change in target brightness and target variation problems. Panels (a) and (b) show that the background brightness is bright and dark when the background temperature is hot or cold, respectively. The-target of (a) has a comparatively high brightness value while the target of (b) has a low brightness value, when the histogram is extracted based on the brightness information feature because the tracking performance is low because of the image contrast. In addition, the front and rear of the pedestrian head, as shown in (c) and (d), respectively, is expected to extract different brightness histograms. Target variations also causes changes in the histogram distribution when the brightness-based mean-shift is applied. These brightness-based mean-shift tracking problems can be solved using the temperature information feature.
3. Proposed Method
This section introduces how to convert the temperature histogram using blackbody-based radiometric calibration method. Figure 2 presents a flow chart of TIR-MS which is temperature-based mean-shift tracking algorithm.
3.1. Temperature Extraction
Figure 2 compares the existing grayscale mean-shift tracking with the proposed temperature-based mean-shift tracking algorithm. The 14-bit digital count values should be converted to a Planck radiance () value through a blackbody-based radiometric calibration to extract the temperature data. The temperature can be obtained based on the converted Planck radiance value. In this paper, the blackbody apparent temperature information provided by the FLIR camera was used.
3.2. 8-Bit Brightness Extraction
In this paper, we need to compare between eight-bit brightness and temperature feature information. The eight-bit brightness is generally acquired by the raw 14-bit DC values.
Equation (1) presents the grayscale mapping method using a histogram where x is the 14-bit DC data for mapping to the eight-bit gray-level and min(x) is the minimum value of x and max(x) is maximum value of x. The parameter u is the mean value of x, is the standard deviation of x, and and are the contrast-streched degree parameters [13]. This mapping method has more stable background variation and image contrast than min-max grayscale mapping method since it includes mean and standard deviation values.
3.2.1. Blackbody-Based Radiometric Calibration
Blackbody radiation is the thermal electromagnetic radiation within or surrounding a body in thermodynamic equilibrium with its environment, or emitted by a black body (an opaque and non-reflective body) [32]. This has a specific spectrum and intensity that depends only on the body’s temperature, which is assumed for the sake of calculations and theory to be uniform and constant [13].
Collecting information on the target’s blackbody through the IR sensor is important for calculating the temperature value, as shown in Figure 3. First, thermal energy is collected through a thermal detector in the IR sensor. The collected thermal energy is converted to a digital count value by an the A/D converter. (In the case of a FLIR IR camera, the A/D converter with a 14-bit dynamic range is used to generate a count value between 0 and 16,383.) Second, the generated digital count is converted to a radiant energy. Finally, the blackbody temperature measurement can be obtained by applying a radiometric calibration, temperature versus radiant energy model, and emissivity of the object or scene to the radiant energy measurements.
Figure 4 shows the detailed process in which a 14-bit digital count is converted to a radiance energy. First of all, G value which is refer to as 14-bit digital count is inserted from the IR camera sensor. Digital Level (DL) is synonymous with the digital count. Then, the radiance values can be expressed as a linear function in the digital count vs. Planck radiance calibration graph. and are 14-bit digital count. They correspond to cold and hot values. and are also cold and hot blackbody temperature. The range between and is important because it controls the histogram bin of the temperature data. In this paper, is set to and is set to in order to reflect the temperature of the all seasons.
We can get calibration parameters (A, B) as Equations (4) and (5) from the value of , , and in Equations (2) and (3). In Equation (6), h, as defined by the Plack Constant, is set to []. , as defined by Boltzmann Constant, is set to []. And, c, as defined by the speed of light, is set to []. , can be calculated through , and constant values. Based on the Equations (4) and (5), A and B can be calculated through L and X. corresponding to can be calculated based on the A and B. Finally, is obtained in Equation (6).
3.2.2. Comparison Brightness Histogram and Temperature Histogram
Figure 5 compares the temperature histogram and brightness histogram. In the case of an eight-bit image, the distribution of the brightness histogram bin is ranges from 0 to 255, while the temperature histogram bin has a value of 151 (0–). The temperature histogram is more concentrated in the specific values than the brightness histogram, as shown in Figure 5. Therefore, the temperature histogram is unaffected directly by the background change and is more stable than the brightness because of the limitation to the specific thermal range with thermoregulation [13].
3.3. Proposed Temperature-Based Mean-Shift Tracking
This paper proposes a novel mean-shift algorithm to track temperature feature information. In the case of conventional mean-shift IR tracking, the histogram similarity is calculated by histogram modeling based on the target brightness feature. In the case of the TIR-MS, the histogram model is based on the temperature feature, as shown in Figure 6. The kernel function is a 2D-Gaussian kernel, which is a representative type of symmetric function, to reduce the weight as it moves away from the center of the ROI. The histogram similarity, , is calculated based on the histogram model for each frame and the ROI is shifted in the gradient direction where the value is large.
3.3.1. Temperature-Based Histogram Backprojection
This section introduces the temperature-based histogram backprojection method and temperature histogram model conversion. First, a target ROI was determined in the initial frame, and a temperature histogram was obtained for the corresponding selected ROI, and the ROI was stored as an initial frame target ROI histogram model. In the next frame, the temperature-based histogram model was also calculated for the next target ROI. A temperature histogram was used for the continuous data, where the bin ranged from 0 to 150, while a bar chart was a plot of the temperature value corresponding to each pixel of the current frame ROI image. Secondly, the weight value was calculated by dividing the calculated and histogram models as Equation (7), .
Equation (8) presents the kernel density function (KDF). The kernel function was used to reduce the influence of the background. The symmetric function had the highest value in the center of the window and a smaller value in the outline. In this paper, the Epanechnikov function, which is the most representative symmetric function, was used. Finally, the next ROI position was calculated corresponding to the weighted average value of the pixel coordinates in the current ROI area.
3.3.2. Temperature-Based Gradient Ascent
This section explains temperature-based gradient ascent. This part was not much different from the baseline. However, the gradient calculated based on the temperature histogram similarity weight was different compared with the baseline. The gradient ascent algorithm moves in the direction of the gradient maxima point dense region evaluated at each frame. As explained above, mean-shift treats the feature space as a probability density function. So, we perform gradient ascent on the local estimated density until convergence for each video sequence.
To explain the variables in the above equations, and are center coordinate of ROI (x, y) of the prior frame and next frame, respectively. The parameter x is all of the pixels’ coordinates of the present image. is the gradient of the present ROI. and are temperature histogram similarity weight and kernel density function, respectively. In short, is calculated by summing and each frame.
4. Experimental Result
In this section, the experimental results are presented according to the change in brightness and contrast in the gray scale image. The tracking performance of the proposed TIR-MS was compared with the brightness-based MS performance in the IR pedestrian head tracking. The experiment had a range of scenarios, such as target, image contrast variation, and background changes.
4.1. YU TIR Pedestrian Tracking Dataset
FLIR T620 was used for the IR camera sensor in this experiment. Figure 7 shows the appearance of the T620 model. Additionally, Table 1 lists the specifications of the T620. The video sequence was obtained mainly in the campus and urban traffic road to collect diverse single pedestrians. In Table 2, the data was captured mostly from 3 to 6 pm in February–March. The total shooting time was approximately one to three minutes and eight effective video sequences were selected from a total of 6864 frames that were not mirrored. For the radiometric calibration, FLIR atlas SDK 3.0 for Matlab, thermo-vision toolbox, was used.
Ground truth annotation. A total of 6864 frames were annotated manually to make the ground truths. At most, a single pedestrian was in the scene and the bounding boxes for the annotations were set manually [33].
4.2. Qualitative Performance Evaluation
The test with the FIR camera sensor showed that the proposed method tracks the pedestrian’s head accurately. The experimental environment, in which the image contrast changes according to the temperature change in the background, and the temperature and brightness data in the target ROI was visualized as a histogram. The tracking performance of the brightness-based MS and TIR-MS was compared in each camera sequence and the temperature-based method is robust to background and image contrast variations.
4.2.1. Limitation of the Brightness Histogram in IR Pedestrian Tracking
Figure 8 shows the image contrast variation as a background temperature change. The brightness value of the pedestrian changes to a considerably large value in an environment where the ambient temperature changes. Panels (c)–(h) show how the distribution of the brightness, 14-bit DC and temperature histogram of the target ROIs in (a) and (b) respectively. The brightness histogram was distributed mainly between 50 and 230 among a total of 256 bin values, as shown in (c), (d). In addition, the distribution of histograms (e) and (f) was different. The brightness histogram shows that the average histogram similarity in meanshift tracking was low because of the background temperature change in the IR pedestrian-tracking environment. On the other hand, (e), (f), (g) and (h) which show the 14-bit DC and temperature histogram bin values, are distributed mainly same shape when extracted in (a) and (b), respectively. In the IR pedestrian tracking environment, the temperature histogram and 14-bit DC values had more stable histogram similarity than the brightness histogram.
Figure 9 shows that the temperature histogram is robust to the target variation problem by comparing the brightness histogram. The brightness, 14-bit DC and temperature histograms of the front, left, and back of the pedestrian head were extracted and compared. In particular, the brightness histogram distribution of (b) was clearly different from (a)–(d). Additionally, the 14-bit DC histograms of (a) and (c) were also different from (b) and (d). Whereas, all temperature histograms showed a similar distribution, i.e., the temperature histogram has a certain degree of histogram similarity, irrespective of the target variation.
4.2.2. Quantitative Comparison
In this section, the performance of the method using temperature was compared with the performance of the method based on the brightness. Additionally, 14-bit digital count-based mean-shift also evaluated because it can be extracted histogram. Total histogram bin of the 14-bit digital count is the 16,384 (). Any calibration process and image preprocessing were not included, just 14-bit raw data was used as input. The proposed TIR-MS was found to be more stable than baseline (eight-bit, 14-bit) using histogram average similarity, which is the average similarity of each histogram. In addition, the tracking accuracy was evaluated for each of the baseline and proposed TIR-MS method using the central difference and intersection over union (IOU). The central difference is an indicator of the degree of inconsistency between GT () and the target ROI pixel coordinates.
Figure 10 compares baseline and the proposed in an environment when the image contrast changes due to the temperature difference between the background and target. Each video sequence was captured as a frame image when the image contrast changed with the background clutter, object variation or ROI size variations. Blue and red dotted bounding boxes are the mean-shift-based eight-bit brightness and mean-shift-based the 14-bit digital count respectively. The green box is the proposed method. Finally, the purple circle is the ground truth. It was originally the rectangle and had matrix array including x, y, width and height of the rectangle. It has been displayed as a circle type in order to better express the ground truth since the pedestrian’s head has a rounded shape. But, this is just for visualization purpose. As shown in Figure 10, even though the baseline methods failed in tracking due to changes in image contrast, the proposed method succeeded in tracking all the sequences.
Figure 11 shows the average histogram similarity calculated for each frame in each video sequence from Figure 10. When the temperature was used as a feature, the histogram similarity was better and more stable than when the brightness was used. The histogram similarity measure was defined as the metric distance between the candidate and target model. First, the target and candidate model are represented as a histogram model by its PDF in the feature space, as shown in Equations (11) and (12). The histogram similarity was calculated using the similarity function, as shown in Equation (13).
Figure 12 presents the tracking accuracy comparing the ground truth and shows that the temperature has a smaller error rate than the brightness.
The central difference is defined as the tracking accuracy between the ground truth and tracking algorithm. As shown in Equation (14), the x and y pixel coordinates values, which is a center of the ROI coordinates at the ground truth, baseline and proposed method were obtained first. The parameters and were then subtracted from the x and y values of the baseline and the proposed method, respectively. Finally, the absolute value of the total equation was obtained.
The intersection over union is defined as the size of the intersection divided by the size of the union of the ROI sets. As shown in Equations (15) and (16), A and B are ROI coordinates of ground truth and the tracking algorithm. The coordinate of upper left corner be (,) and bottom right corner be (,). The IOU, which measure dissimilarity between ground truth and tracking algorithm, is calculated by dividing the difference of the sizes of the union and the intersection of two sets by the size of the union, as shown in Equation (17).
Figure 13 presents the intersection over union which is the most popular evaluation metric used in the object tracking accuracy between ground truth and tracking method.
Table 3 and Table 4 list the tracking performance of each of the average similarity and central difference baseline (eight-bit, 14-bit) and proposed (TIR-MS) in the video sequence when the image contrast and target changes. For each of the eight-bit and 14-bit baseline, the standard deviation of the histogram average similarity of the entire video sequence was each and , respectively. However, the standard deviation of the TIR-MS method was , as shown in Table 3, which suggests that two baseline methods are more unstable than proposed. In addition, Table 4 shows that the central difference values of the baseline methods are larger than that of the proposed in all video sequences, which indicates that the proposed method has higher tracking accuracy than two baselines. Addionally, 14-bit-based baseline is sometimes stable, especially in the poor image contrast scenario since it has also 14-bit absolute values from the raw data. But, it is much affected by distance because there is no physical meaning. For example, the sky has a temperature of , while pedestrian head has a temperature of about –. The 14-bit digital count (DC) is not as robust as the temperature data when object is included in background clutter such as sea, tree, ground. In the Table 4, the mean and standard deviation of the two baseline methods are , , and , respectively, whereas those for the proposed method were and , respectively. This suggests that the temperature data is robust in the IR pedestrian tracking environment when the image contrast and target changes.
Table 5 and Table 6 list the tracking accuracy and speed of each of the intersection over union (IOU) and frame per second (FPS) baseline (eight-bit, 14bit) and proposed (TIR-MS) in the video sequence when the image contrast and target changes. For each of the eight-bit and 14-bit baseline, the standard deviation of the IOU of the entire video sequence was each and , respectively. Also, the mean of the two baseline methods was each and , as shown in Table 5. However, the mean and standard deviation of the proposed method were and , respectively, which suggests that two baseline methods were more unstable than proposed. In addition, Table 6 shows that FPS value of the proposed method are larger than that two baseline methods in all video sequences, which indicates that the proposed method has higher tracking speed than two baseline. Additionally, 14-bit digital count had 16,384 total histogram bin range and it records the lowest FPS rate, as shown in Table 6. This suggests that FPS rate is depending on the histogram bin range.
4.2.3. Limitations of the Proposed Method
In this section, two limitations of the proposed method are introduced. First, the proposed method failed, when the pedestrian head was completely occluded for just a few frames. But, it succeeded when the pedestrian head was partially occluded. Second, it failed also when a pedestrian was located far away about 50 m from the IR camera.
Full occlusion is most important issues in the pedestrian tracking field. In the Figure 14a presents the scenario of the complete pedestrian occlusion. Figure 14b,c presents the partially occluded scenario. The temperature information helps to track the pedestrian head when the pedestrian head is occluded partially but it fails to track when the head is completely occluded. The conventional mean-shift algorithm is vulnerable to occlusion problem and temperature feature is hardly extract when object is completely occluded. However, if a temperature feature is extracted based on a deep learning network that handles the prior frames, such as a RNN, temperature feature can be much robust in the occlusion issue.
Remote sensing of the temperature information is another limitation of the proposed method. Figure 15 shows that pedestrian head tracking using the temperature information is somewhat successful at distances from 5 m to 50 m. However, Figure 15d shows that the information of the object to distinguish the background are very scarce. This suggests that tracking can fail easily even if small noise occurred. In conclusion, proposed method is difficult to track if it is more than 50 m away.
5. Conclusions
This paper proposed a novel temperature-based mean-shift tracking algorithm (TIR-MS) in IR-based pedestrian tracking. A search of the IR-based pedestrian tracking techniques showed that the most research focused on the brightness feature-based tracking algorithm. On the other hand, the brightness can be distorted easily by the image contrast, causing degradation of the pedestrian tracking performance. This paper presents the radiometric temperature-based method and how to convert the histogram. In addition, the histogram similarity map is based on the temperature histogram model and Epanechnikov kernel function. The temperature data-based histogram was more stable and compact than the brightness histogram, i.e., the temperature data has a high weight value and enables a more efficient kernel density estimation. In the experiments, temperature improved the mean-shift tracking performance for the pedestrian by the discriminative IR feature with thermoregulation and the physical normalized temperature enhanced the pedestrian tracking performance [13]. The temperature histogram was evaluated by comparing the image contrast with the brightness and 14-bit digital count histogram. In future work, because the temperature was not applied to the various tracking algorithms, particularly deep learning, will be used in models, such as RNN-based and CNN-based deep learning tracking algorithms, to improve the tracking performance. In addition, the radiometric temperature-based deep neural network model will be developed with the construction of a large database to track pedestrians and drones, and the results will be compared with the brightness-based deep neural network, such as re3 [34], GOTURN [33], and ADNet [35].
Author Contributions
Conceptualization, S.Y. and S.K.; methodology, S.Y.; software, S.Y.; validation, S.Y. and S.K.; formal analysis, S.Y.; investigation, S.Y.; resources, S.K.; data curation, S.Y.; writing—original draft preparation, S.Y.; writing—review and editing, S.Y. and S.K.; visualization, S.Y.; supervision, S.K.; project administration, S.K.; funding acquisition, S.K.
Funding
This research was supported by Basic Science Research Program through the National Research Foundation of Korea (NRF) funded by the Ministry of Education (NRF-2018R1D1A3B07049069).
Acknowledgments
This work was supported by the Civil Military Technology Cooperation Research Fund (19-SN-MU-03, Development of Military Technology for Intelligent Ship Navigation Information) of Agency for Defense Development. This research was funded and conducted under the Competency Development Program for Industry Specialists of the Korean Ministry of Trade, Industry and Energy (MOTIE), operated by Korea Institute for Advancement of Technology (KIAT). (No. P0008473, The development of high skilled and innovative manpower to lead the Innovation based on Robot)
Conflicts of Interest
The authors declare no conflict of interest.
References
- Comaniciu, D.; Ramesh, V.; Meer, P. Real-time tracking of non-rigid objects using mean shift. Comput. Vis. Pattern Recognit. 2000, 2, 142–149. [Google Scholar]
- Wang, Z.; Hou, Q.; Hao, L. Improved infrared target-tracking algorithm based on mean shift. Appl. Opt. 2012, 51, 5051–5059. [Google Scholar] [CrossRef] [PubMed]
- Du, K.; Ju, Y.; Jin, Y.; Li, G.; Qian, S.; Li, Y. MeanShift tracking algorithm with adaptive block color histogram. In Proceedings of the 2012 2nd International Conference on Consumer Electronics, Communications and Networks (CECNet), Piscataway, NJ, USA, 21–23 April 2012; pp. 2692–2695. [Google Scholar]
- An, X.; Kim, J.; Han, Y. Optimal colour-based mean shift algorithm for tracking objects. IET Comput. Vis. 8.3 2014, 8, 235–244. [Google Scholar] [CrossRef]
- Feng, F.; Wu, X.J.; Xu, T. Object tracking with kernel correlation filters based on mean shift. In Proceedings of the 2017 International Smart Cities Conference (ISC2), Wuxi, China, 14–17 September 2017; pp. 1–7. [Google Scholar]
- Ning, J.; Zhang, L.; Zhang, D.; Wu, C. Robust mean-shift tracking with corrected background-weighted histogram. IET Comput. Vis. 6.1 2012, 6, 62–69. [Google Scholar] [CrossRef] [Green Version]
- Ning, J.; Zhang, L.; Zhang, D.; Wu, C. Scale and orientation adaptive mean shift tracking. IET Comput. Vis. 6.1 2012, 6, 52–61. [Google Scholar] [CrossRef] [Green Version]
- Zhang, X.; Zhang, X.; Wang, Y.; Yu, H. Extended social force model-based mean shift for pedestrian tracking under obstacle avoidance. In Proceedings of the IEEE International Conference on Consumer Electronics-Asia (ICCE-Asia), Seoul, Korea, 26–28 October 2016; pp. 1–9. [Google Scholar]
- Sahi, A.; Jammoussi, A.Y. Object tracking system using Camshift, Meanshift and Kalman filter. World Acad. Sci. Eng. Technol. 2012, 6, 674–679. [Google Scholar]
- Ali, A.; Jalil, A.; Ahmed, J.; Iftikhar, M.A.; Hussain, M. Robust Correlation, Kalman filter and adaptive fast mean shift based heuristic approach for robust visual tracking. Signal Image Video Process. 2015, 9, 1567–1585. [Google Scholar] [CrossRef]
- Jeong, J.; Yoon, T.S.; Park, J.B. Mean shift tracker combined with online learning-based detector and Kalman filtering for real-time tracking. Expert Syst. Appl. 2017, 79, 194–206. [Google Scholar] [CrossRef]
- Xu, F.; Liu, X.; Fujimura, K. Pedestrian detection and tracking with night vision. IEEE Trans. Intell. Transp. Syst. 2005, 6, 63–71. [Google Scholar] [CrossRef]
- Kim, T.; Kim, S. Pedestrian detection at night time in FIR domain: Comprehensive study about temperature and brightness and new benchmark. Pattern Recognit. 2018, 79, 44–54. [Google Scholar] [CrossRef]
- Gade, R.; Moeslund, T.B. Thermal cameras and applications: a survey. Mach. Vis. Appl. 2014, 25, 245–262. [Google Scholar] [CrossRef]
- Li, C.; Wang, W. Detection and tracking of moving targets for thermal infrared video sequences. Sensors 2018, 18, 3944. [Google Scholar] [CrossRef] [PubMed]
- Ma, Y.; Wu, X.; Yu, G.; Xu, Y.; Wang, Y. Pedestrian detection and tracking from low-resolution unmanned aerial vehicle thermal imagery. Sensors 2016, 16, 446. [Google Scholar] [CrossRef] [PubMed]
- Brunetti, A.; Buongiorno, D.; Trotta, G.F.; Bevilacqua, V. Computer vision and deep learning techniques for pedestrian detection and tracking: A survey. Neurocomputing 2018, 300, 17–33. [Google Scholar] [CrossRef]
- Jia, X.; Lu, H.; Yang, M.H. Visual tracking via adaptive structural local sparse appearance model. In Proceedings of the 2012 IEEE Conference on Computer Vision and Pattern Recognition, Providence, RI, USA, 16–21 June 2012; pp. 1822–1829. [Google Scholar]
- Felsberg, M. Enhanced distribution field tracking using channel representations. In Proceedings of the IEEE International Conference on Computer Vision Workshops, Sydney, Australia, 1–8 December 2013; pp. 121–128. [Google Scholar]
- Zhong, W.; Lu, H.; Yang, M.H. Robust object tracking via sparsity-based collaborative model. In Proceedings of the 2012 IEEE Conference on Computer Vision and Pattern Recognition, Providence, RI, 16–21 June 2012; pp. 1838–1845. [Google Scholar]
- Danelljan, M.; Häger, G.; Khan, F.; Felsberg, M. Accurate scale estimation for robust visual tracking. In Proceedings of the British Machine Vision Conference, Nottingham, UK, 1–5 September 2014. [Google Scholar]
- Berg, A.; Ahlberg, J.; Felsberg, M. A thermal object tracking benchmark. In Proceedings of the 2015 12th IEEE International Conference on Advanced Video and Signal Based Surveillance (AVSS), Karlsruhe, Germany, 25–28 August 2015; pp. 1–6. [Google Scholar]
- Felsberg, M.; Berg, A.; Hager, G.; Ahlberg, J.; Kristan, M.; Matas, J.; Nebehay, G. The thermal infrared visual object tracking VOT-TIR2015 challenge results. In Proceedings of the IEEE International Conference on Computer Vision Workshops, Santiago, Chile, 7–13 December 2015; pp. 76–88. [Google Scholar]
- Prioletti, A.; Møgelmose, A.; Grisleri, P.; Trivedi, M.M.; Broggi, A.; Moeslund, T.B. Part-based pedestrian detection and feature-based tracking for driver assistance: Real-time, robust algorithms, and evaluation. IEEE Trans. Intell. Transp. Syst. 2013, 14, 1346–1359. [Google Scholar] [CrossRef]
- Gandhi, T.; Trivedi, M.M. Pedestrian protection systems: Issues, survey, and challenges. IEEE Trans. Intell. Transp. Syst. 2007, 8, 413–430. [Google Scholar] [CrossRef]
- Comaniciu, D.; Ramesh, V.; Meer, P. Kernel-based object tracking. IEEE Trans. Pattern Anal. Mach. Intell. 2003, 25, 564–577. [Google Scholar] [CrossRef]
- Caulfield, D. Mean-Shift Tracking for Surveillance: Evaluations and Enhancements. Ph.D. Thesis, University of Dublin, Dublin, Ireland, 2011. [Google Scholar]
- Gorry, B.; Chen, Z.; Hammond, K.; Wallace, A.; Michaelson, G. Using mean-shift tracking algorithms for real-time tracking of moving images on an autonomous vehicle testbed platform. Proceedings of World Academy of Science, Engineering and Technology. 2007. Available online: https://pdfs.semanticscholar.org/4eed/a6bcee928e4ed1e1b497a6420127748424d0.pdf (accessed on 26 July 2019).
- Milian, A.; Rezatofighi, S.H.; Dick, A.R.; Reid, I.D.; Schindler, K. Online Multi-Target Tracking Using Recurrent Neural Networks. arXiv 2017, arXiv:1604.03635. [Google Scholar]
- Yi, S.; Li, H.; Wang, X. Pedestrian behavior understanding and prediction with deep neural networks. In Proceedings of the European Conference on Computer Vision, Amsterdam, The Netherlands, 8–16 October 2016; Springer: Cham, Switzerland; pp. 263–279. [Google Scholar]
- Fan, J.; Xu, W.; Wu, Y.; Gong, Y. Human tracking using convolutional neural networks. IEEE Trans. Neural Netw. 2010, 21, 1610–1623. [Google Scholar] [PubMed]
- Jacobs, P.A. Society of Photo-optical Instrumentation Engineers. In Thermal infrared Characterization of Ground Targets and Backgrounds; SPIE: Bellingham, WA, USA, 2006. [Google Scholar]
- Held, D.; Thrun, S.; Savarese, S. Learning to track at 100 fps with deep regression networks. In Proceedings of the European Conference on Computer Vision, Amsterdam, The Netherlands, 11–14 October 2016; pp. 749–765. [Google Scholar]
- Gordon, D.; Farhadi, A.; Fox, D. Re 3: Re al-Time Recurrent Regression Networks for Visual Tracking of Generic Objects. IEEE Robot. Autom. Lett. 2018, 3, 788–795. [Google Scholar] [CrossRef]
- Yun, S.; Choi, J.; Yoo, Y.; Yun, K.; Young Choi, J. Action-decision networks for visual tracking with deep reinforcement learning. In Proceedings of the IEEE Conference on Computer Vision and Pattern Recognition, Honolulu, HI, USA, 21–26 July 2017; pp. 2711–2720. [Google Scholar]
Figure 1.
Change in the target brightness due to background temperature change.

Figure 2.
Flow chart of thermal infrared (TIR)-mean-shift (MS): (a) brightness-based MS, (b) temperature-based MS.
Figure 2.
Flow chart of thermal infrared (TIR)-mean-shift (MS): (a) brightness-based MS, (b) temperature-based MS.

Figure 3.
Remote hot/cold blackbody measure.

Figure 4.
Digital count versus Planck radiance.

Figure 5.
Comparison brightness histogram and temperature histogram: (a) target Region of Interest (ROI) template, (b) brightness-based histogram, (c) temperature-based histogram.
Figure 5.
Comparison brightness histogram and temperature histogram: (a) target Region of Interest (ROI) template, (b) brightness-based histogram, (c) temperature-based histogram.

Figure 6.
Overview of the TIR-MS tracking.

Figure 7.
FLIR T620.

Figure 8.
Comparison of the eight-bit brightness, 14-bit DC and temperature histogram when the background temperature changes: (a) target of high temperature blackbody (BB); (b) target of low temperature BB; (c,d) brightness histogram of (a,b); (e,f) 14-bit DC histogram of (a,b); (g,h) temperature histogram of (a,b).

Figure 9.
Comparison of the brightness histogram and temperature histogram.

Figure 10.
Video frame images of the track results were extracted using the method of the top performance using the brightness, 14-bit digital count and temperature for each sequence. The temperature data was visualized by grayscale mapping with a histogram. In the experimental results, the temperature information helps track the pedestrian head but not track using the two baseline methods: (a) among a total of 1146 frames, each frame was 1, 200, 450, 780, and 1020, (b) among total 400 frame, each frame was 1, 52, 120, 285, and 380, (c) among a total of 568 frames, each frame was 1, 100, 250, 400, and 560.

Figure 11.
Histogram average similarity of each video sequence: (a) average histogram similarity. Sequence (a,b), average histogram similarity (b,c), average histogram similarity (c).
Figure 11.
Histogram average similarity of each video sequence: (a) average histogram similarity. Sequence (a,b), average histogram similarity (b,c), average histogram similarity (c).

Figure 12.
Central difference of each video sequence: (a) central difference (Figure 11a), (b) central difference (Figure 11b), (c) central difference (Figure 11c).

Figure 13.
Intersection over union (IOU) of each video sequence: (a) IOU (Figure 11a), (b) IOU (Figure 11b), and (c) IOU (Figure 11c).

Figure 14.
Tracking performance of brightness, 14-bit DC, and proposed in occlusion scenario: (a) complete occlusion, (b) and (c) partial occlusion.
Figure 14.
Tracking performance of brightness, 14-bit DC, and proposed in occlusion scenario: (a) complete occlusion, (b) and (c) partial occlusion.

Figure 15.
Tracking performance in different distances: (a) 5 m, (b) 15 m, (c) 35 m, (d) 50 m.


Table 1.
IR camera sensor specification.
| FEATURES | FLIR T620 |
|---|---|
| Spectral range | 7.5–14 um |
| Temperature range | to |
| Thermal sensitivity (N.E.T.D) | < at |
| Frame rate | 30FPS |
| Resolution | pixels (14-bit) |
| Field of view (FOV) | Horizontal |
Table 2.
Data acquisition and capturing.
| Date | Season | Total Frame | Time | Temperature | ROI Size | Scenario | |
|---|---|---|---|---|---|---|---|
| S1 | 18.08.14 | Summer | 723 | 17 s | / | Image contrast | |
| S2 | 19.01.21 | Winter | 390 | 11 s | / | Image contrast, Background clutter | |
| S3 | 19.02.02 | Winter | 417 | 13 s | / | Image contrast, Object variation | |
| S4 | 19.02.26 | Winter | 520 | 17 s | / | Image contrast, Object variation | |
| S5 | 19.02.26 | Winter | 568 | 18 s | / | Image contrast, Size variation | |
| S6 | 19.03.06 | Spring | 400 | 12 s | / | Image contrast, Background clutter | |
| S7 | 19.03.08 | Spring | 601 | 19 s | / | Image contrast, Background clutter | |
| S8 | 19.03.15 | Spring | 650 | 24 s | / | Image contrast |
Table 3.
Comparison of tracking stability: average similarity.
| Algorithm | Baseline (8-bit) | Baseline (14-bit) | Proposed (TIR-MS) |
|---|---|---|---|
| S1 | |||
| S2 | |||
| S3 | |||
| S4 | |||
| S5 | |||
| S6 | |||
| S7 | |||
| S8 | |||
| Mean | |||
| STDEV |
Table 4.
Comparison of tracking accuracy: central difference.
| Algorithm | Baseline (8-bit) | Baseline (14-bit) | Proposed (TIR-MS) |
|---|---|---|---|
| S1 | 138 | 33 | 29 |
| S2 | 21 | 7 | 8 |
| S3 | 40 | 96 | 21 |
| S4 | 17 | 15 | 11 |
| S5 | 137 | 18 | 13 |
| S6 | 11 | 47 | 9 |
| S7 | 23 | 16 | 10 |
| S8 | 43 | 22 | 16 |
| Mean | |||
| STDEV |
Table 5.
Comparison of tracking accuracy: intersection over union (IOU).
| Algorithm | Baseline (8-bit) | Baseline (14-bit) | Proposed (TIR-MS) |
|---|---|---|---|
| S1 | |||
| S2 | |||
| S3 | |||
| S4 | |||
| S5 | |||
| S6 | |||
| S7 | |||
| S8 | |||
| Mean | |||
| STDEV |
Table 6.
Comparison of tracking speed: frame per second (FPS).
| Algorithm | Baseline (8-bit) | Baseline (14-bit) | Proposed (TIR-MS) |
|---|---|---|---|
| S1 | |||
| S2 | |||
| S3 | |||
| S4 | |||
| S5 | |||
| S6 | |||
| S7 | |||
| S8 | |||
| Mean | |||
| STDEV |
© 2019 by the authors. Licensee MDPI, Basel, Switzerland. This article is an open access article distributed under the terms and conditions of the Creative Commons Attribution (CC BY) license (http://creativecommons.org/licenses/by/4.0/).
Share and Cite
MDPI and ACS Style
Yun, S.; Kim, S. TIR-MS: Thermal Infrared Mean-Shift for Robust Pedestrian Head Tracking in Dynamic Target and Background Variations. Appl. Sci. 2019, 9, 3015. https://doi.org/10.3390/app9153015
AMA Style
Yun S, Kim S. TIR-MS: Thermal Infrared Mean-Shift for Robust Pedestrian Head Tracking in Dynamic Target and Background Variations. Applied Sciences. 2019; 9(15):3015. https://doi.org/10.3390/app9153015
Chicago/Turabian StyleYun, Sungmin, and Sungho Kim. 2019. "TIR-MS: Thermal Infrared Mean-Shift for Robust Pedestrian Head Tracking in Dynamic Target and Background Variations" Applied Sciences 9, no. 15: 3015. https://doi.org/10.3390/app9153015
Note that from the first issue of 2016, this journal uses article numbers instead of page numbers. See further details here.