Hygrothermal Behaviour of Continuous Air Chambers on Stone Panels Façades through CFD and IRT


Abstract
:1. Introduction
2. Methods
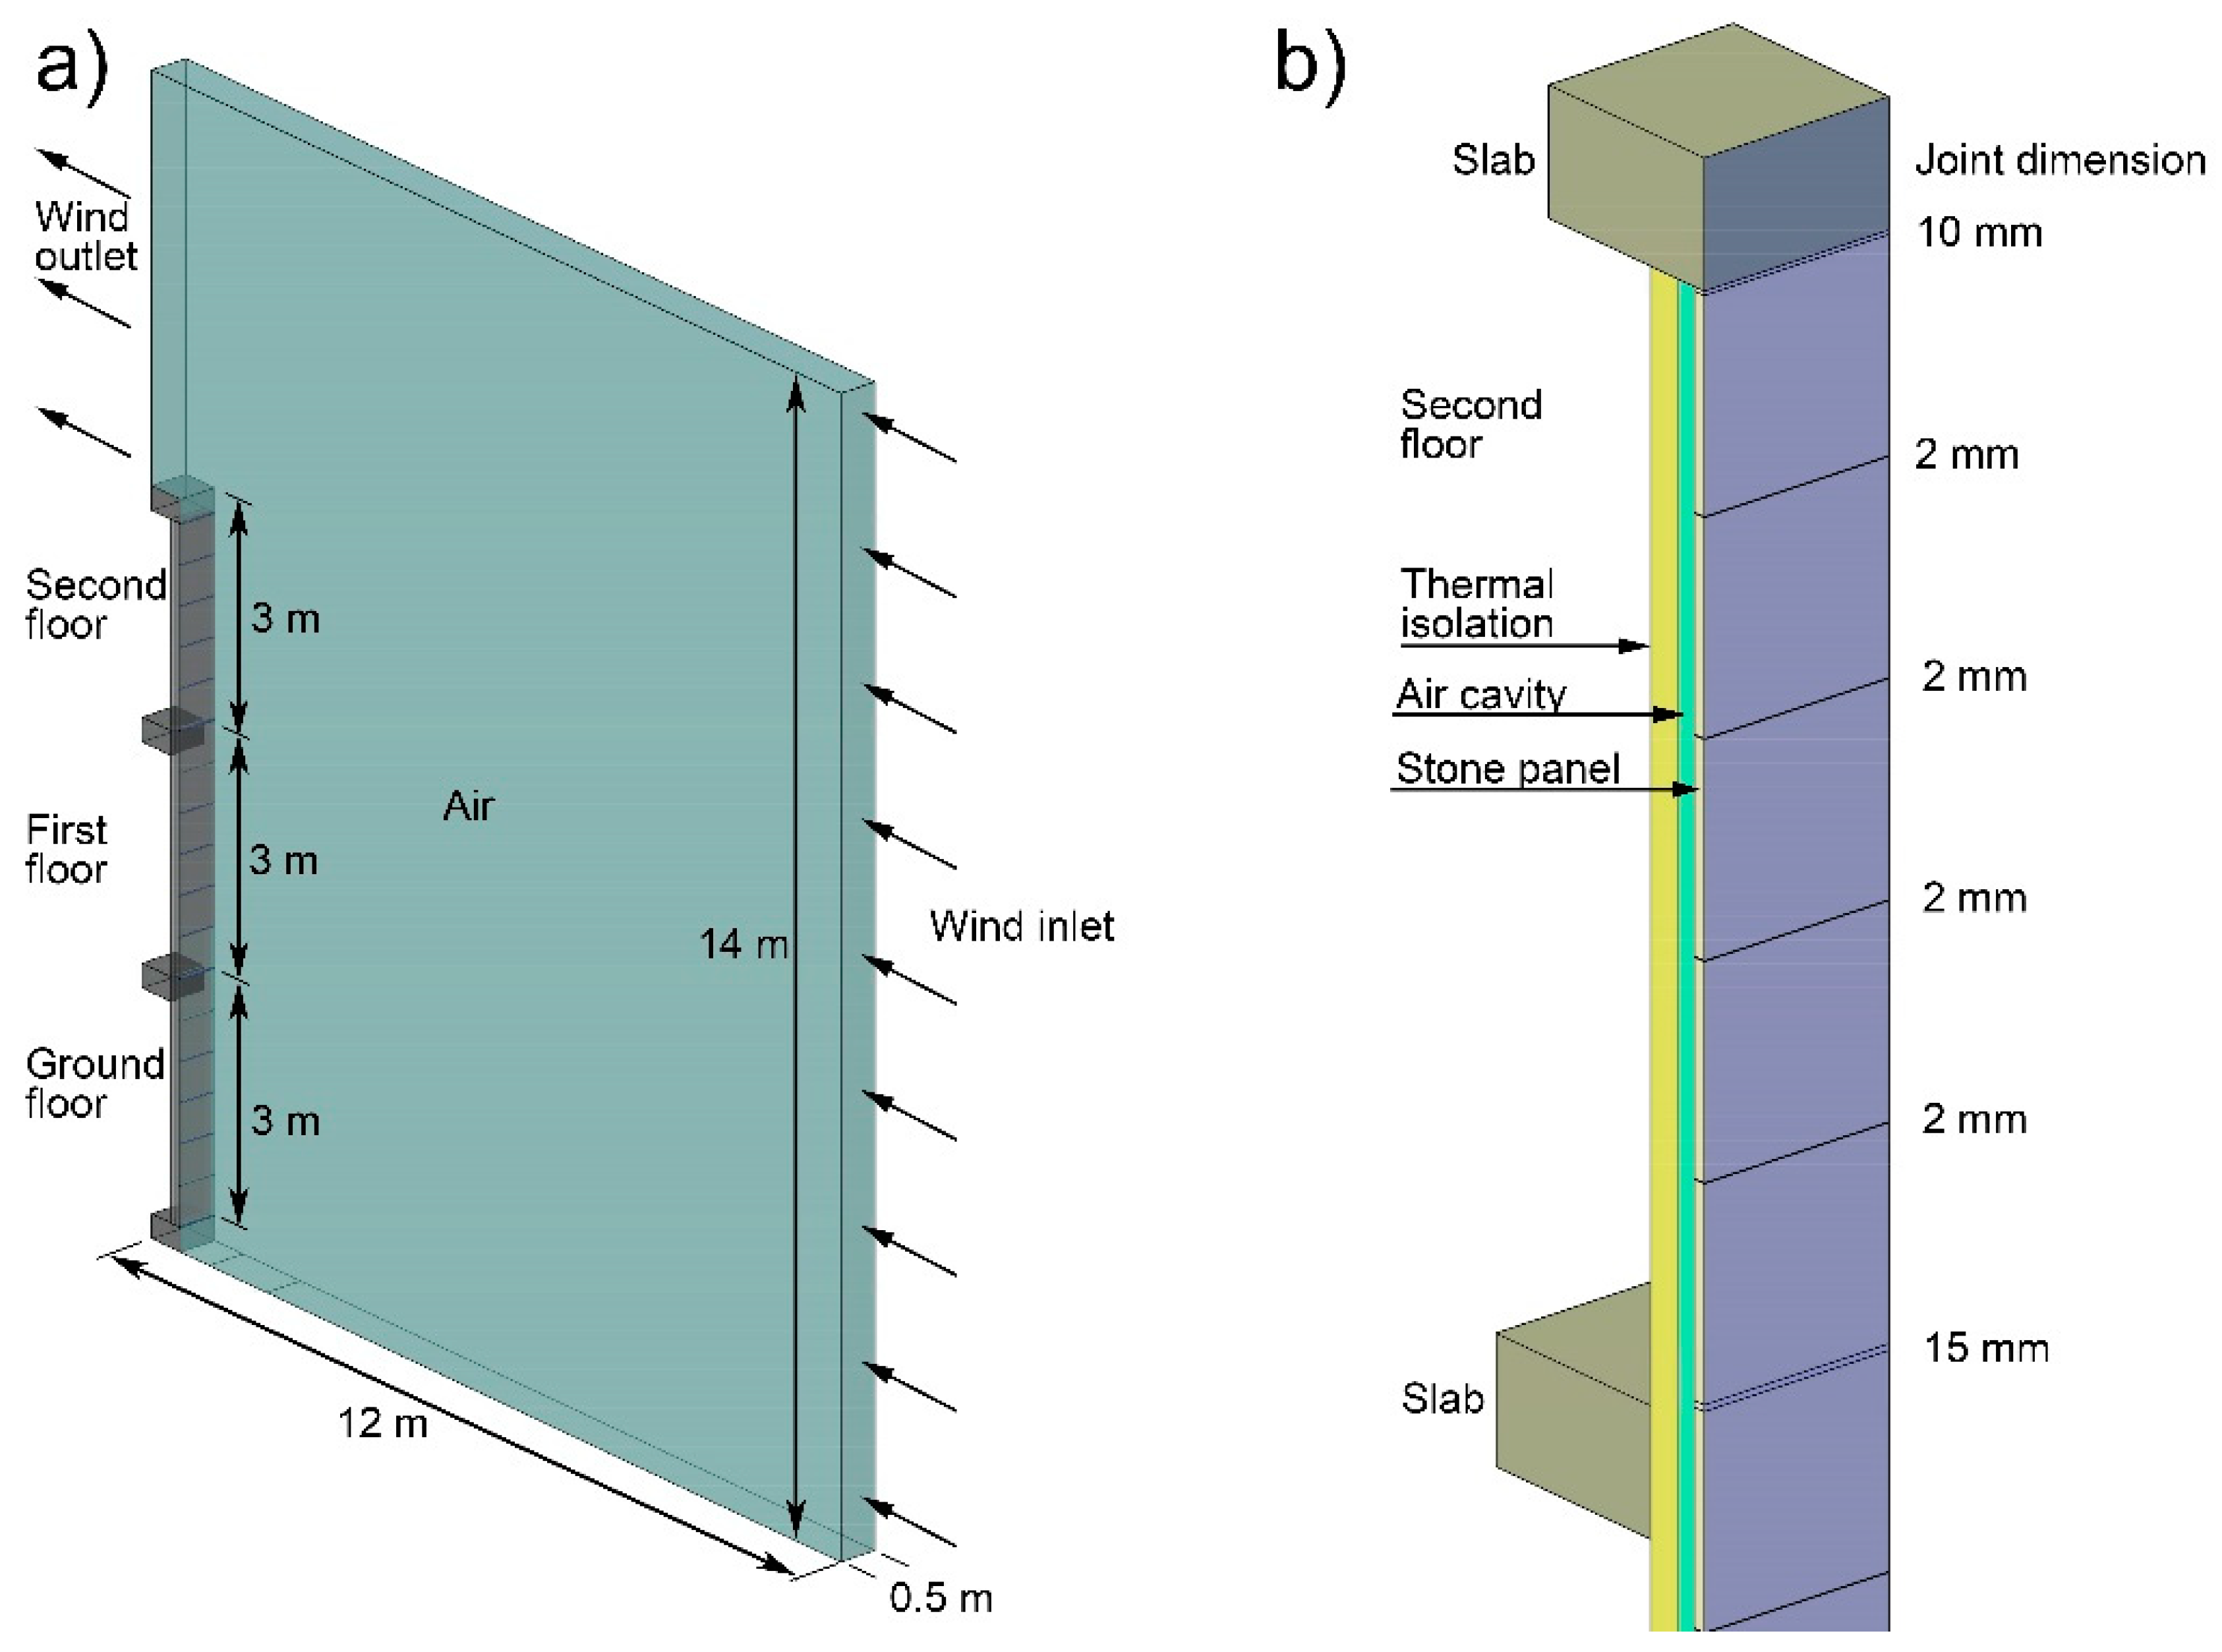
2.1. Case Study
2.2. Methodology
2.3. Validation
3. Results
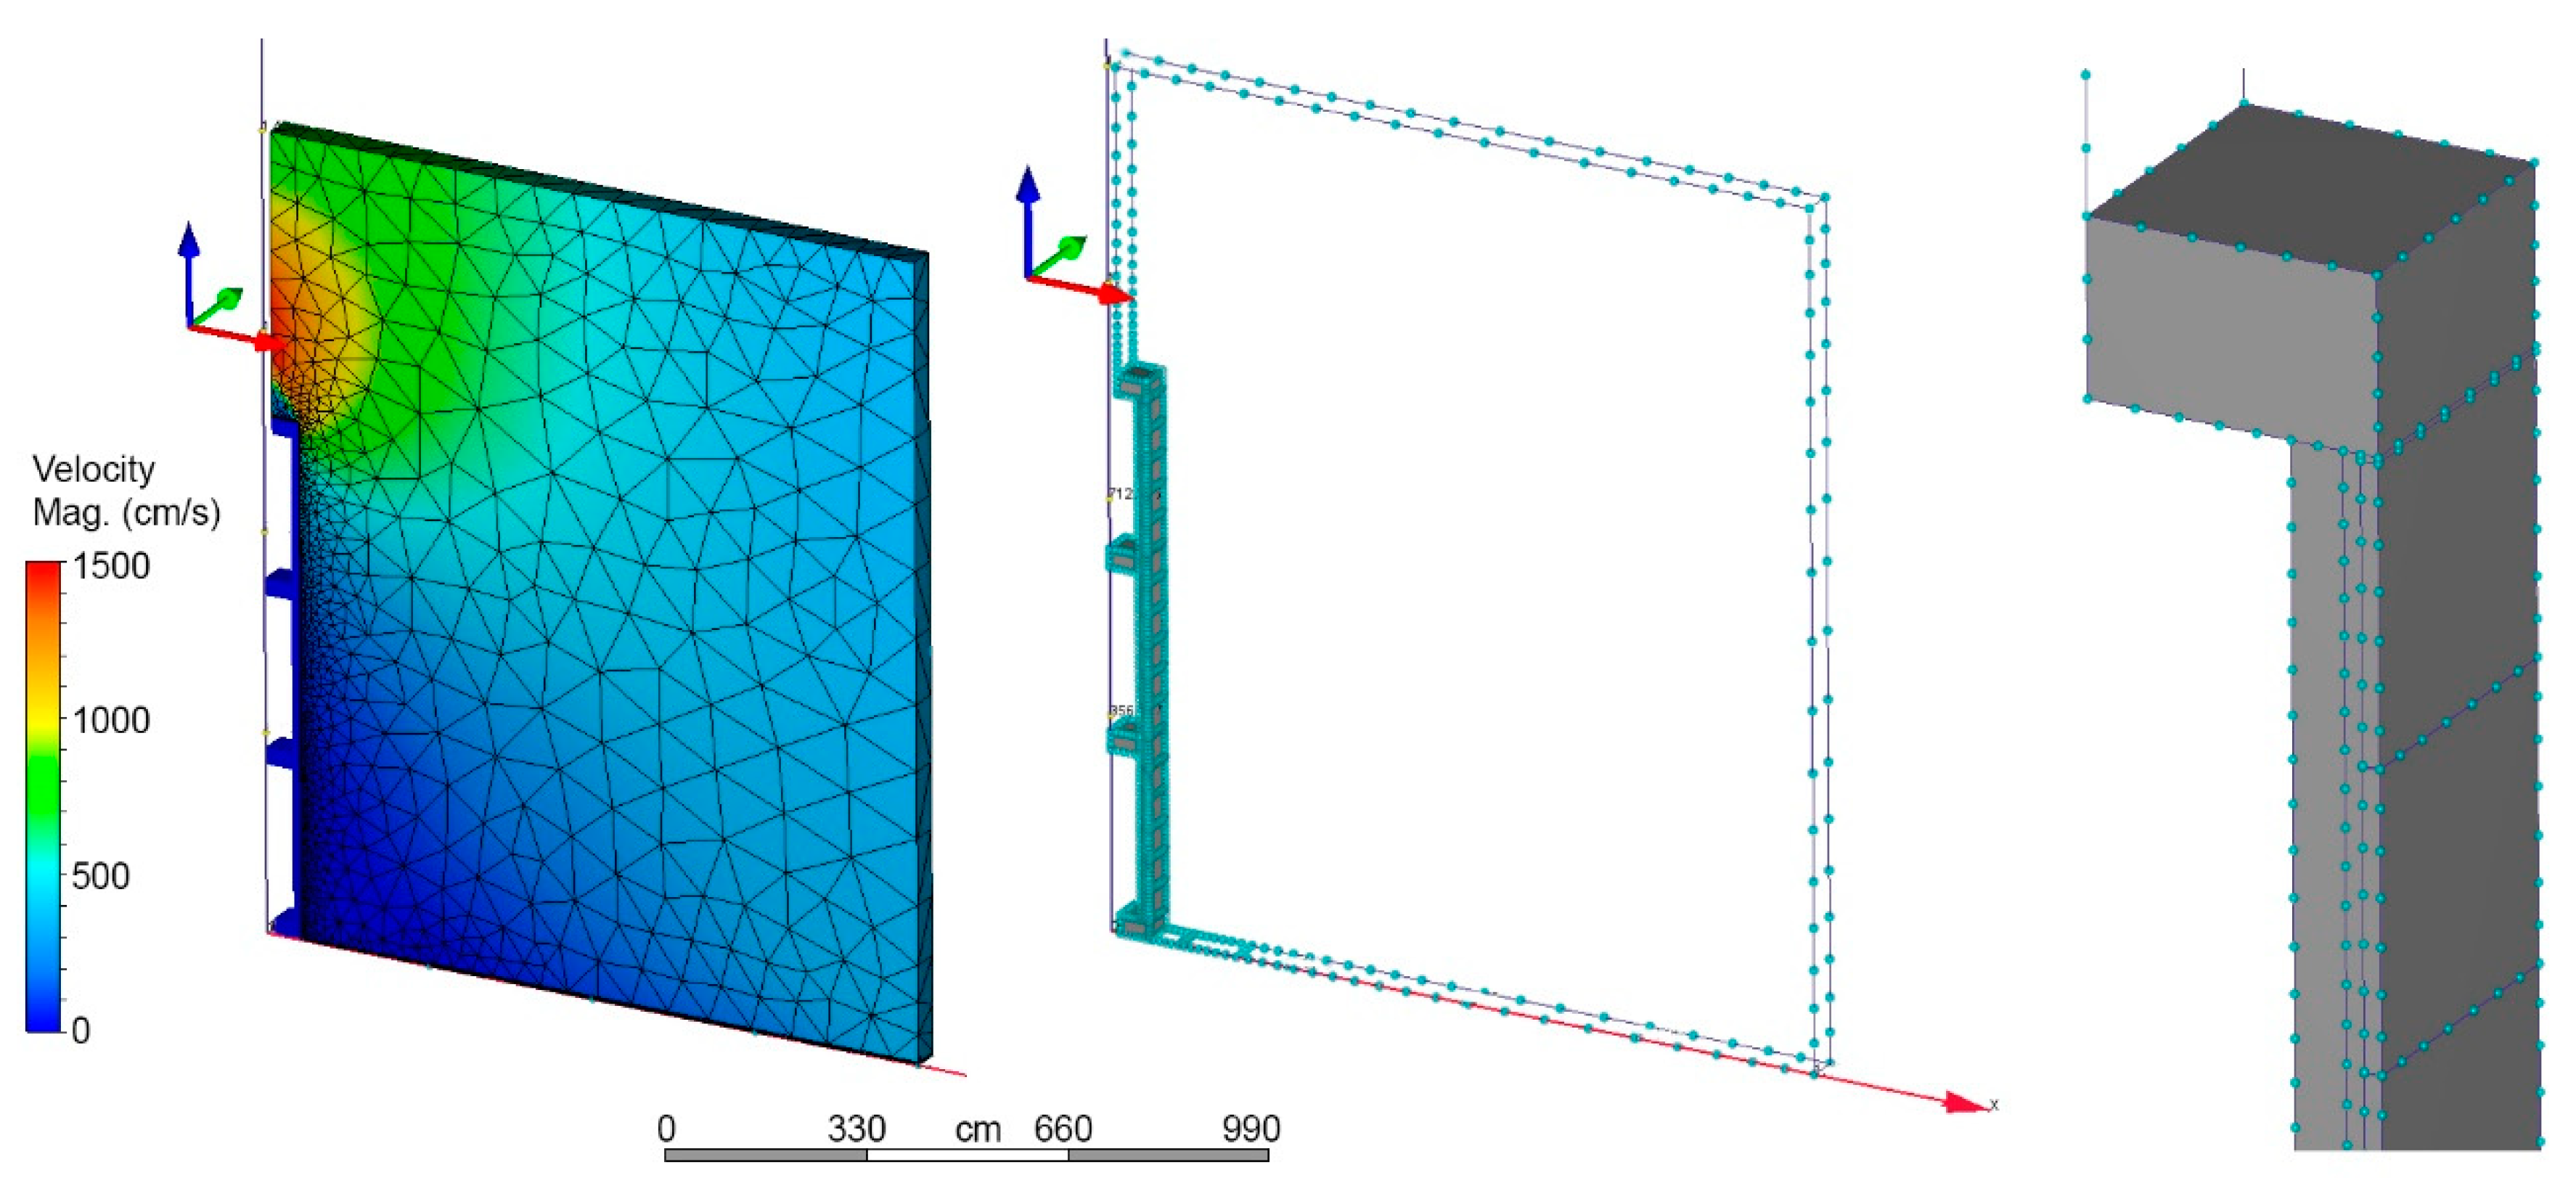
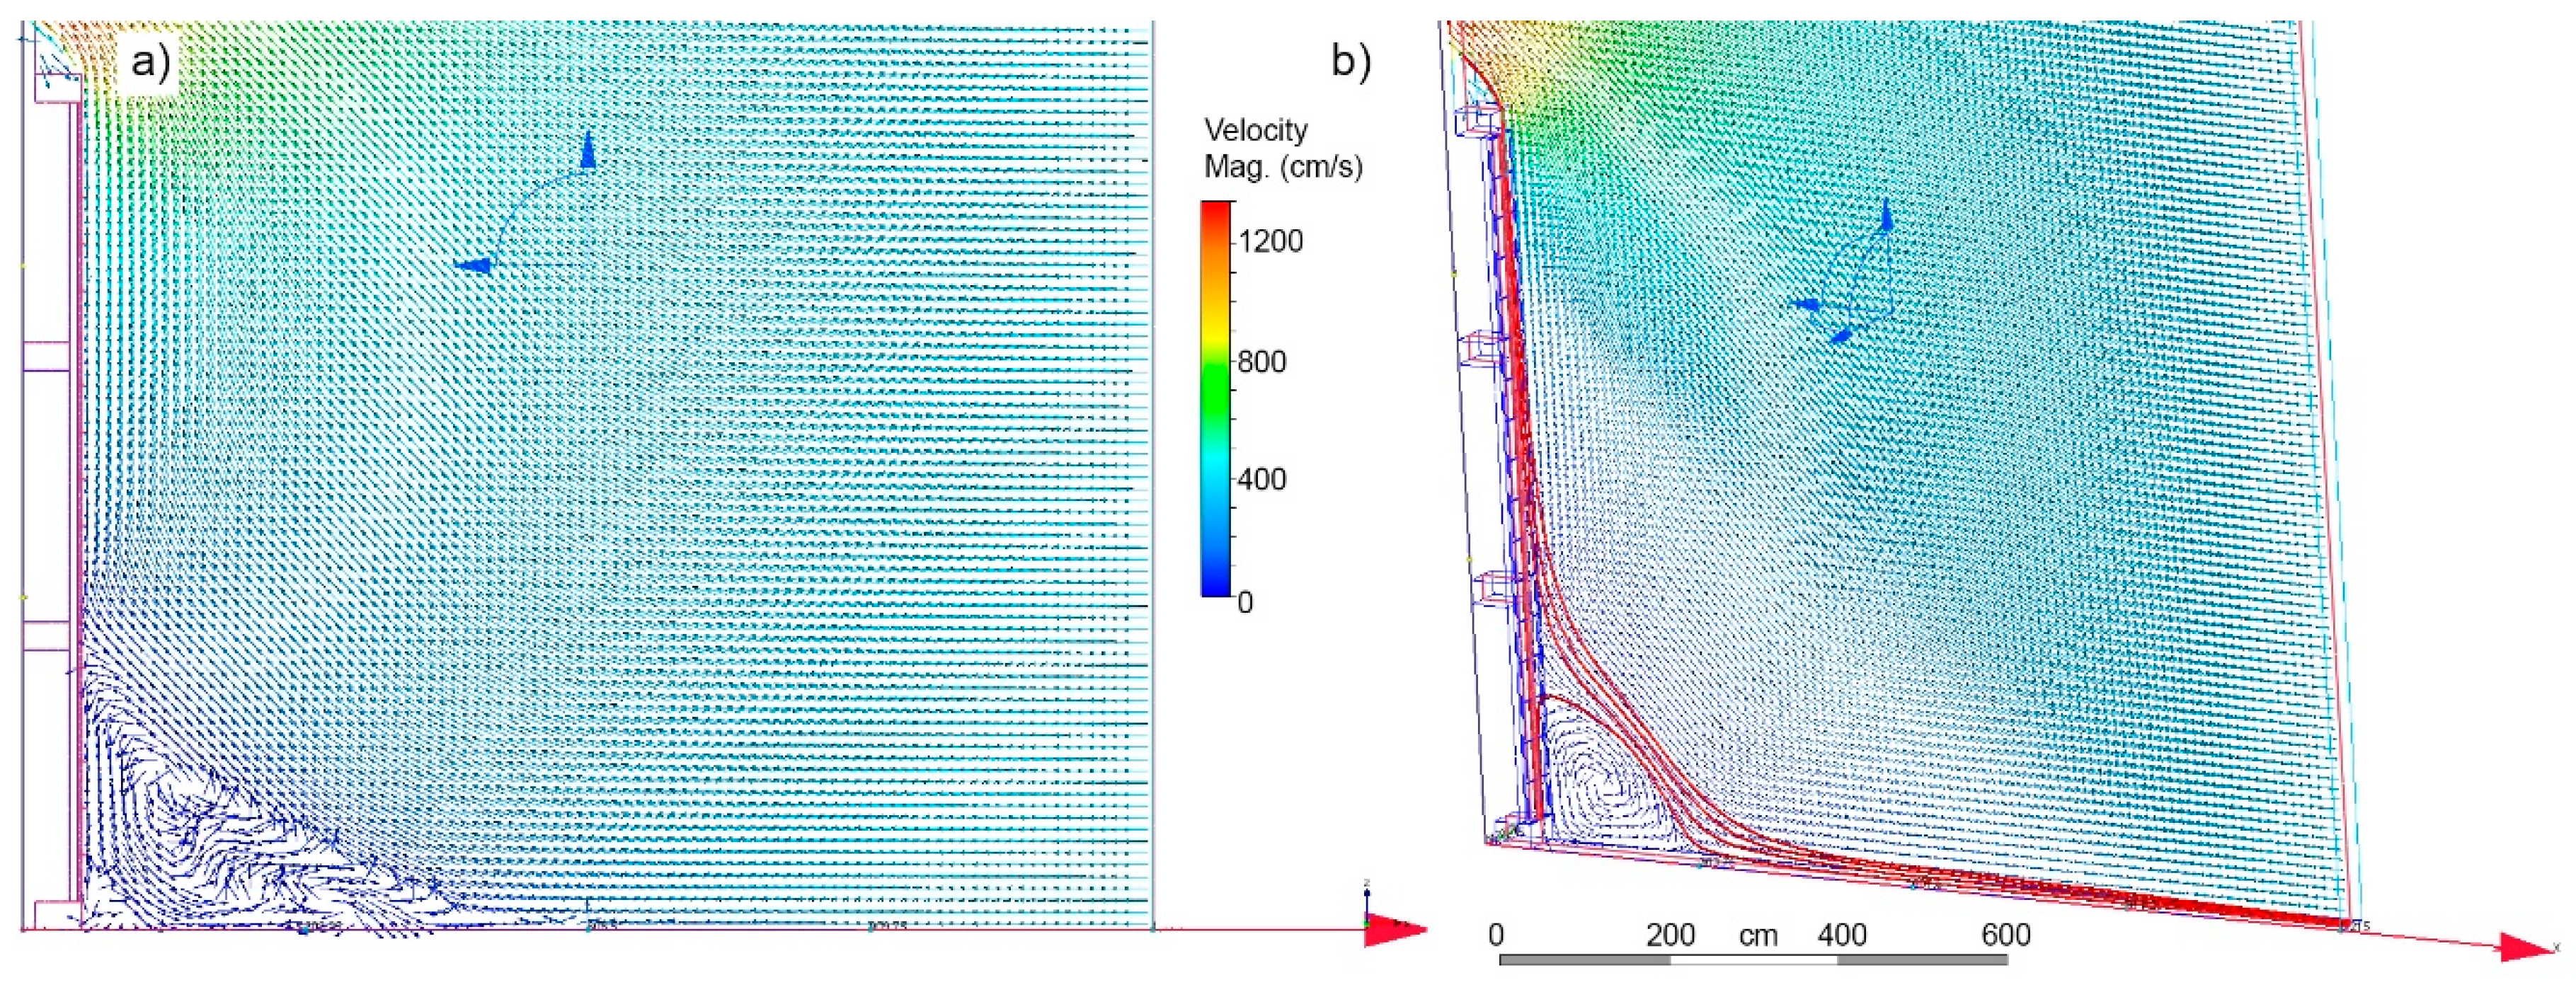
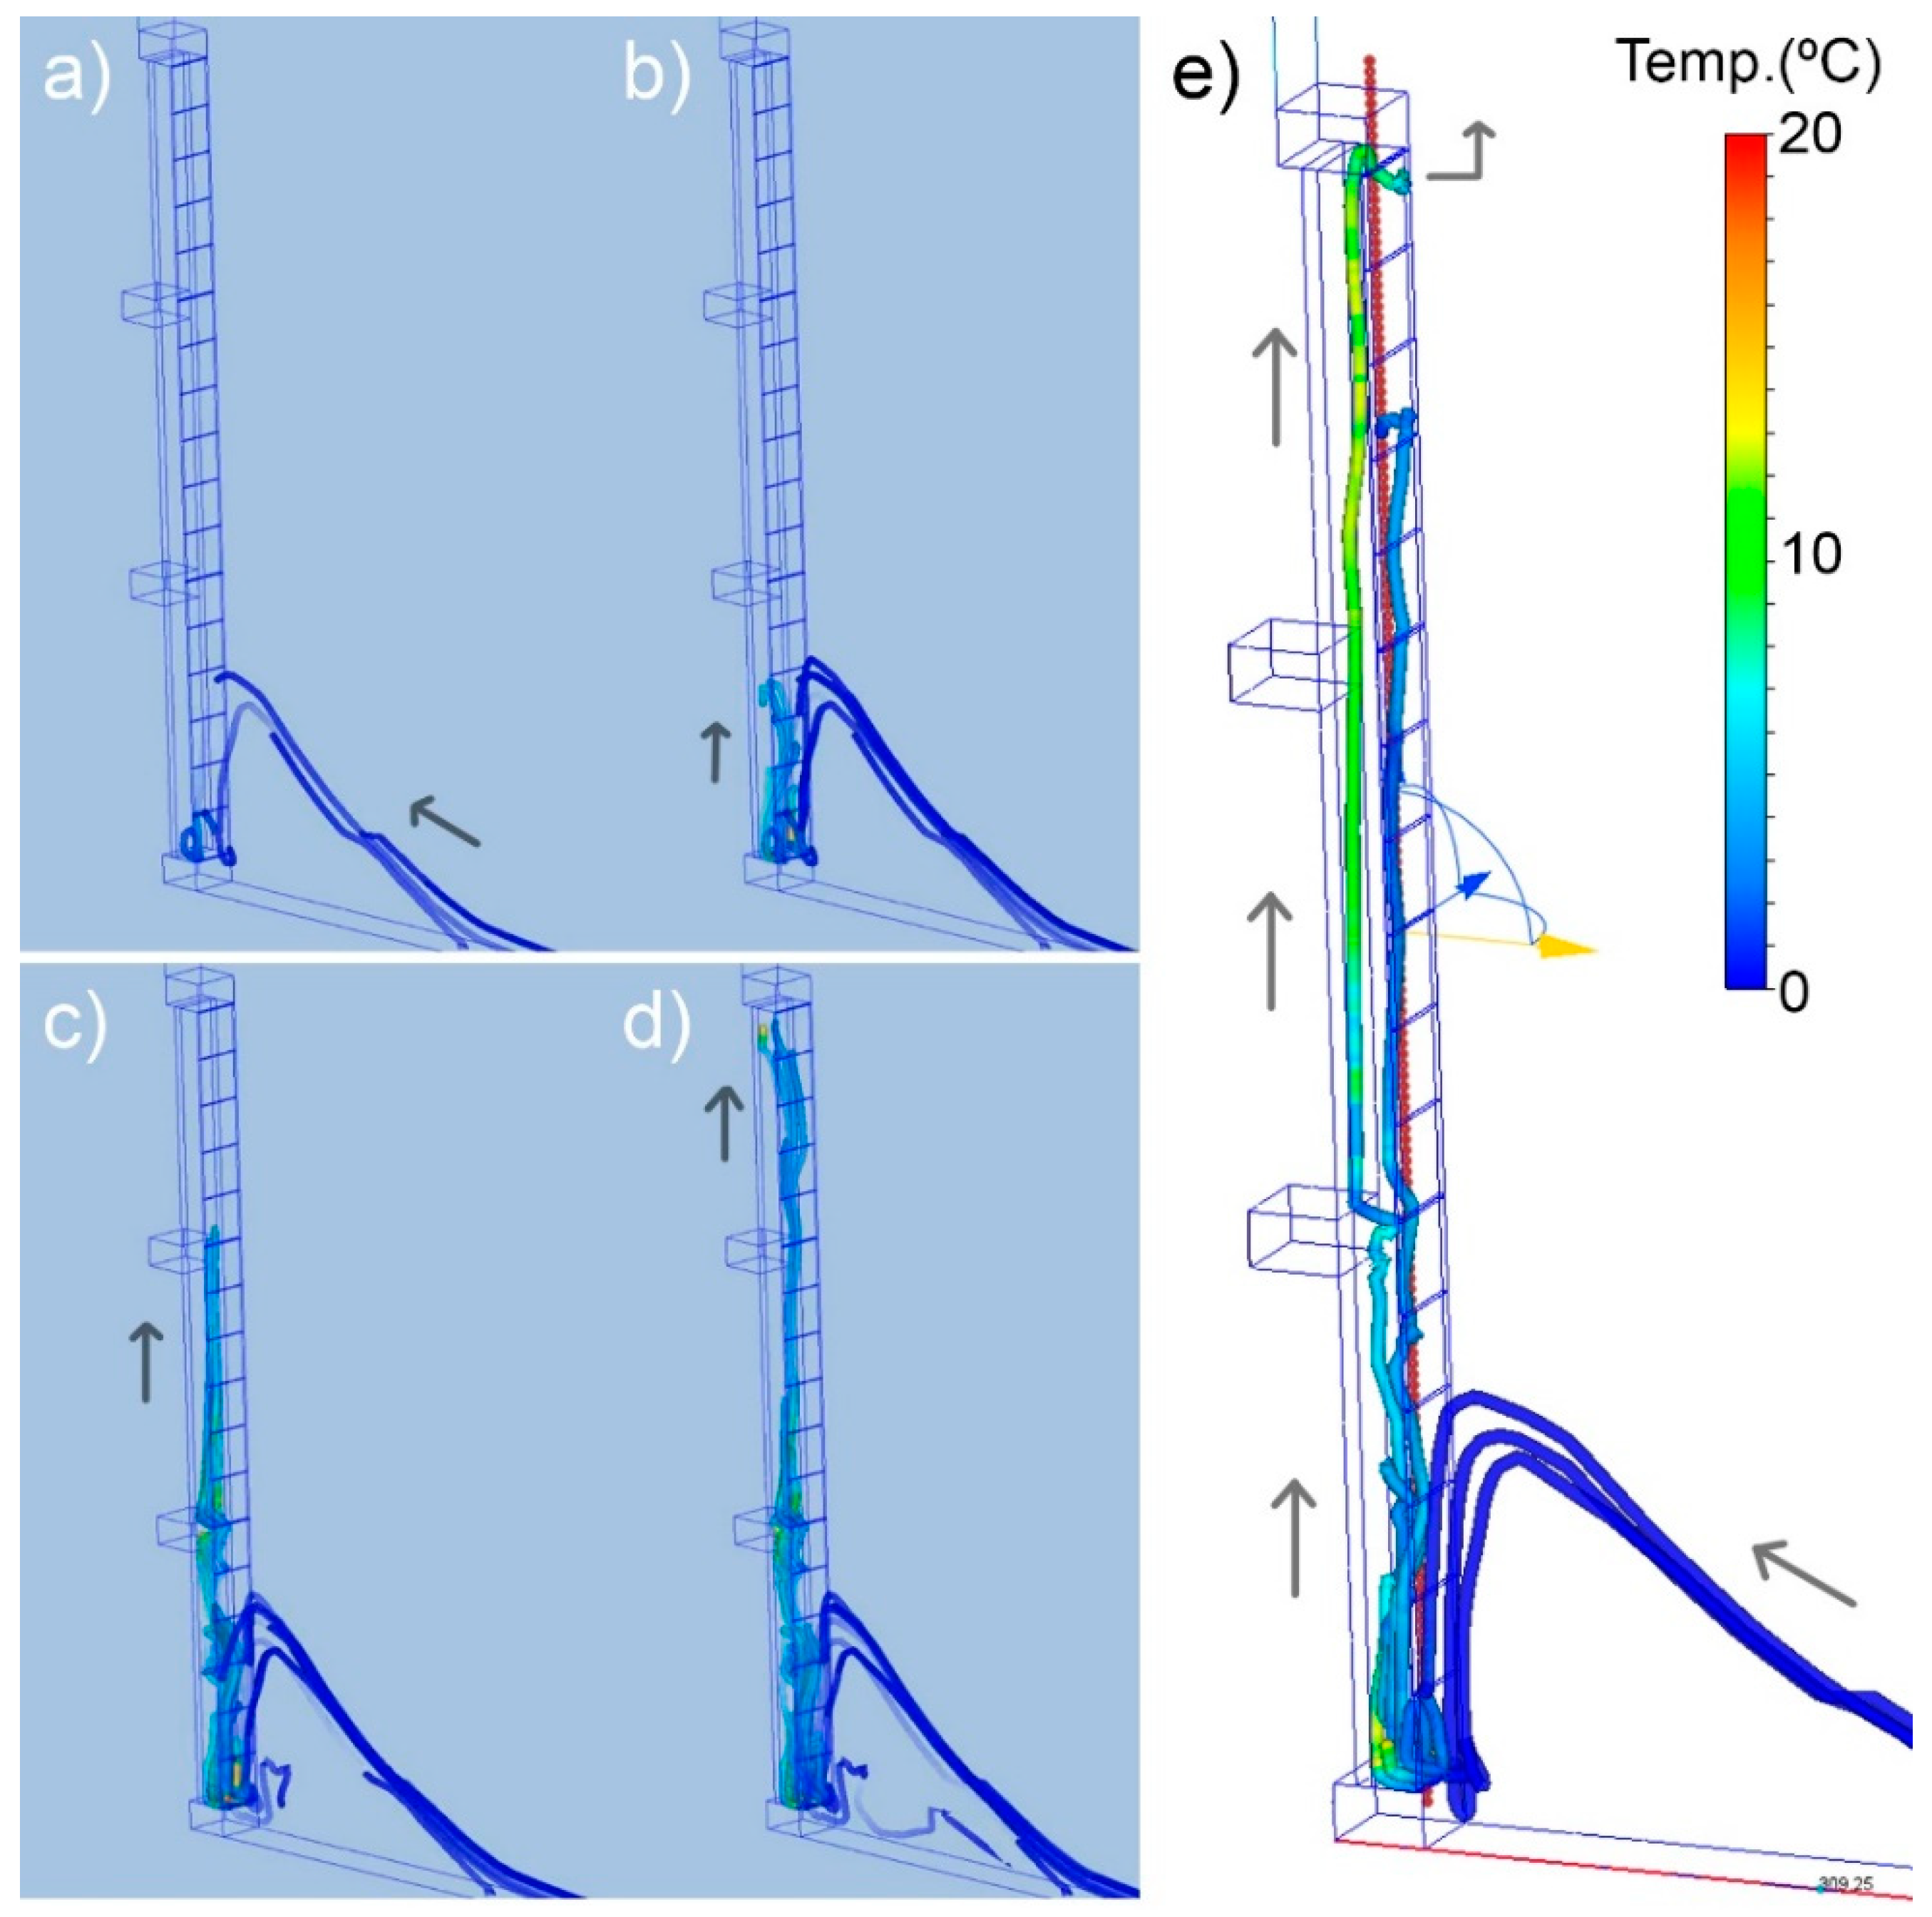
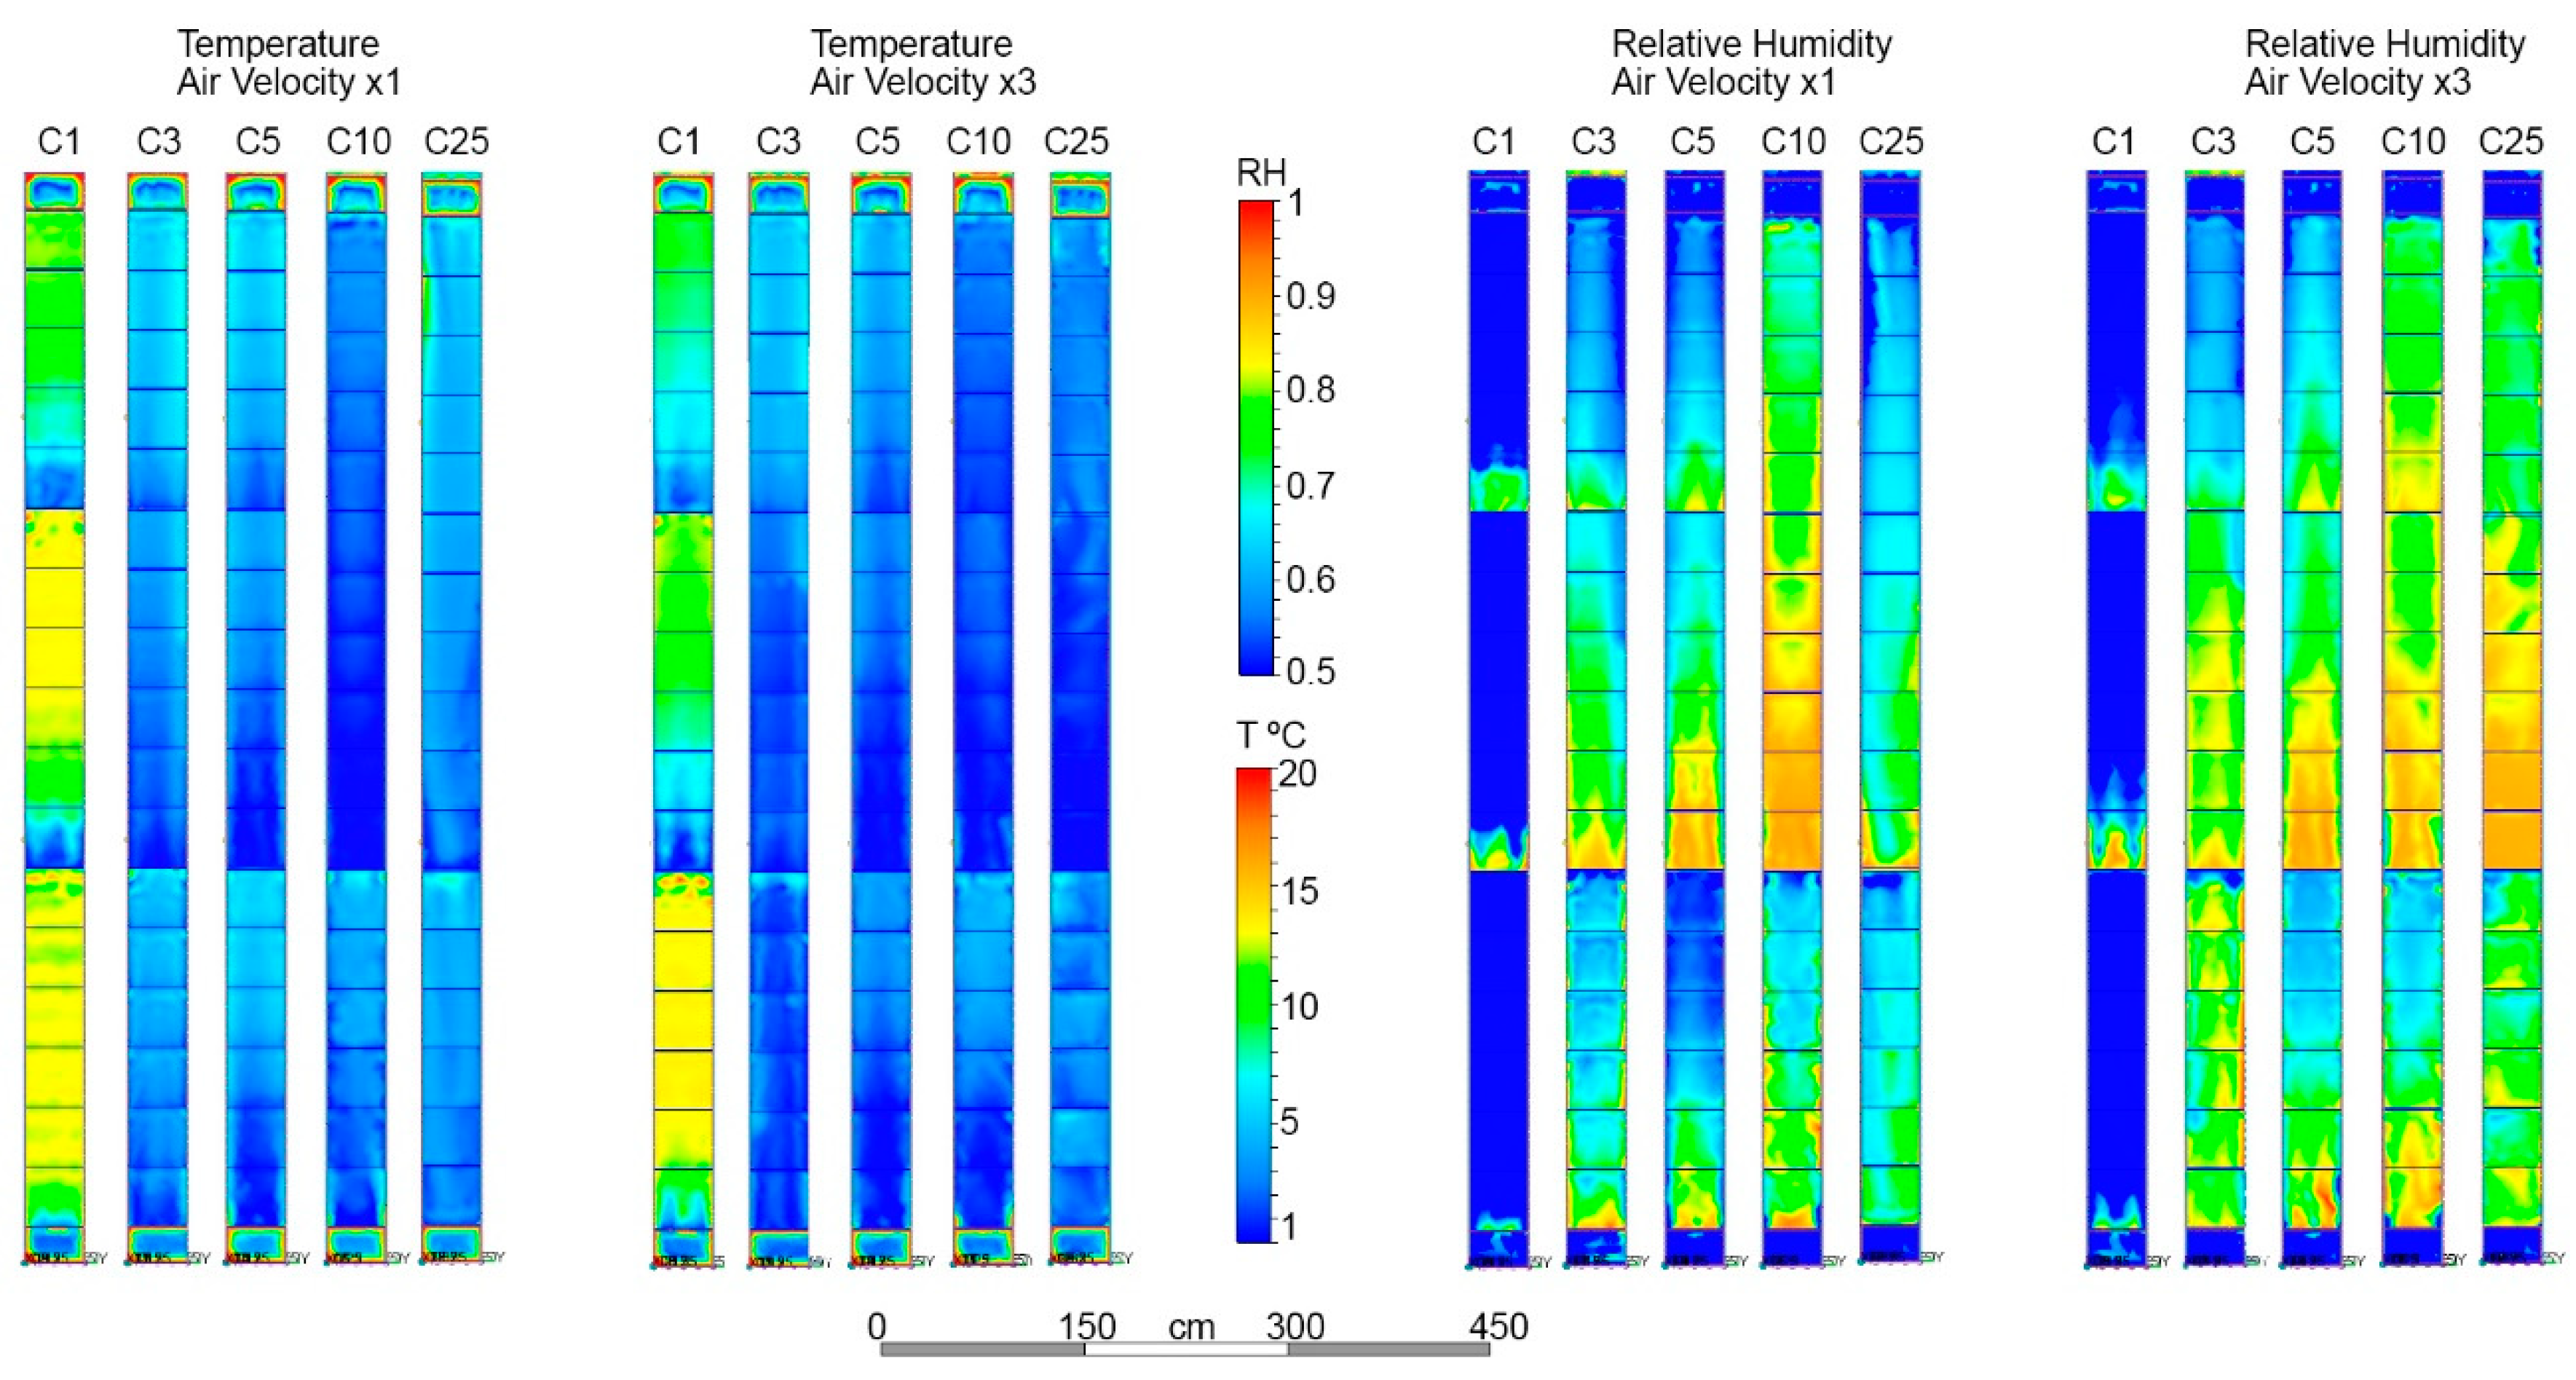
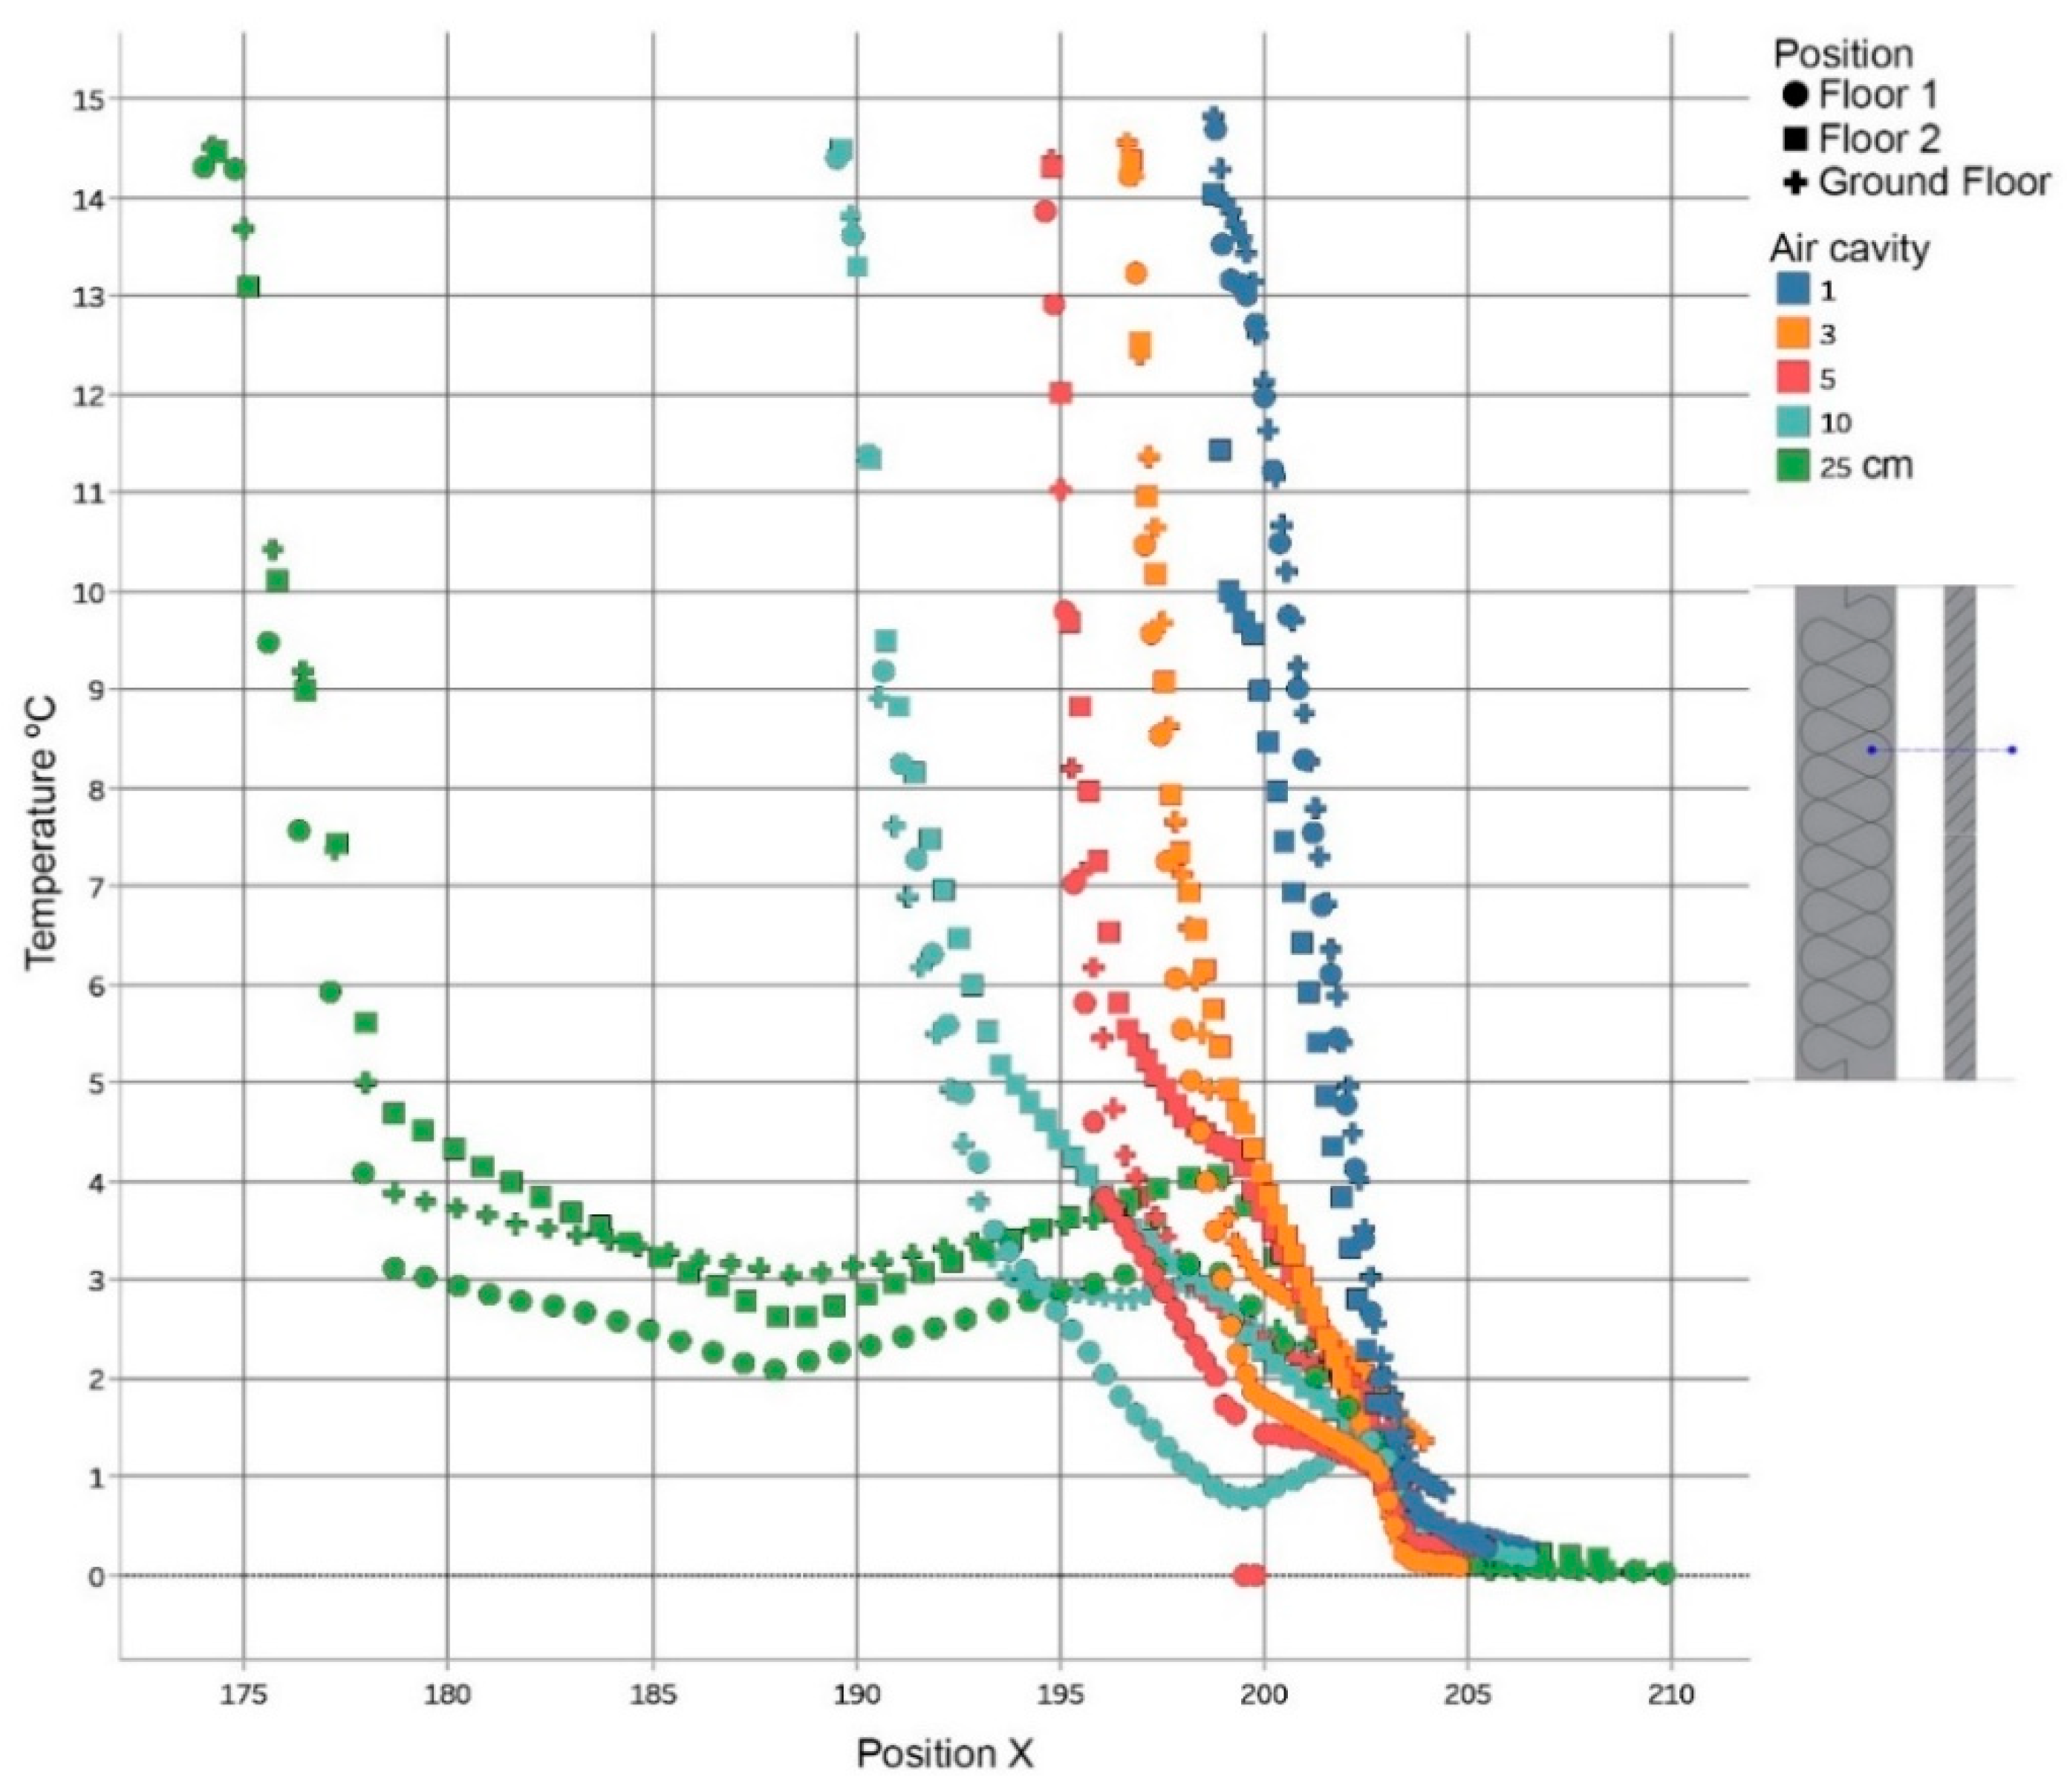
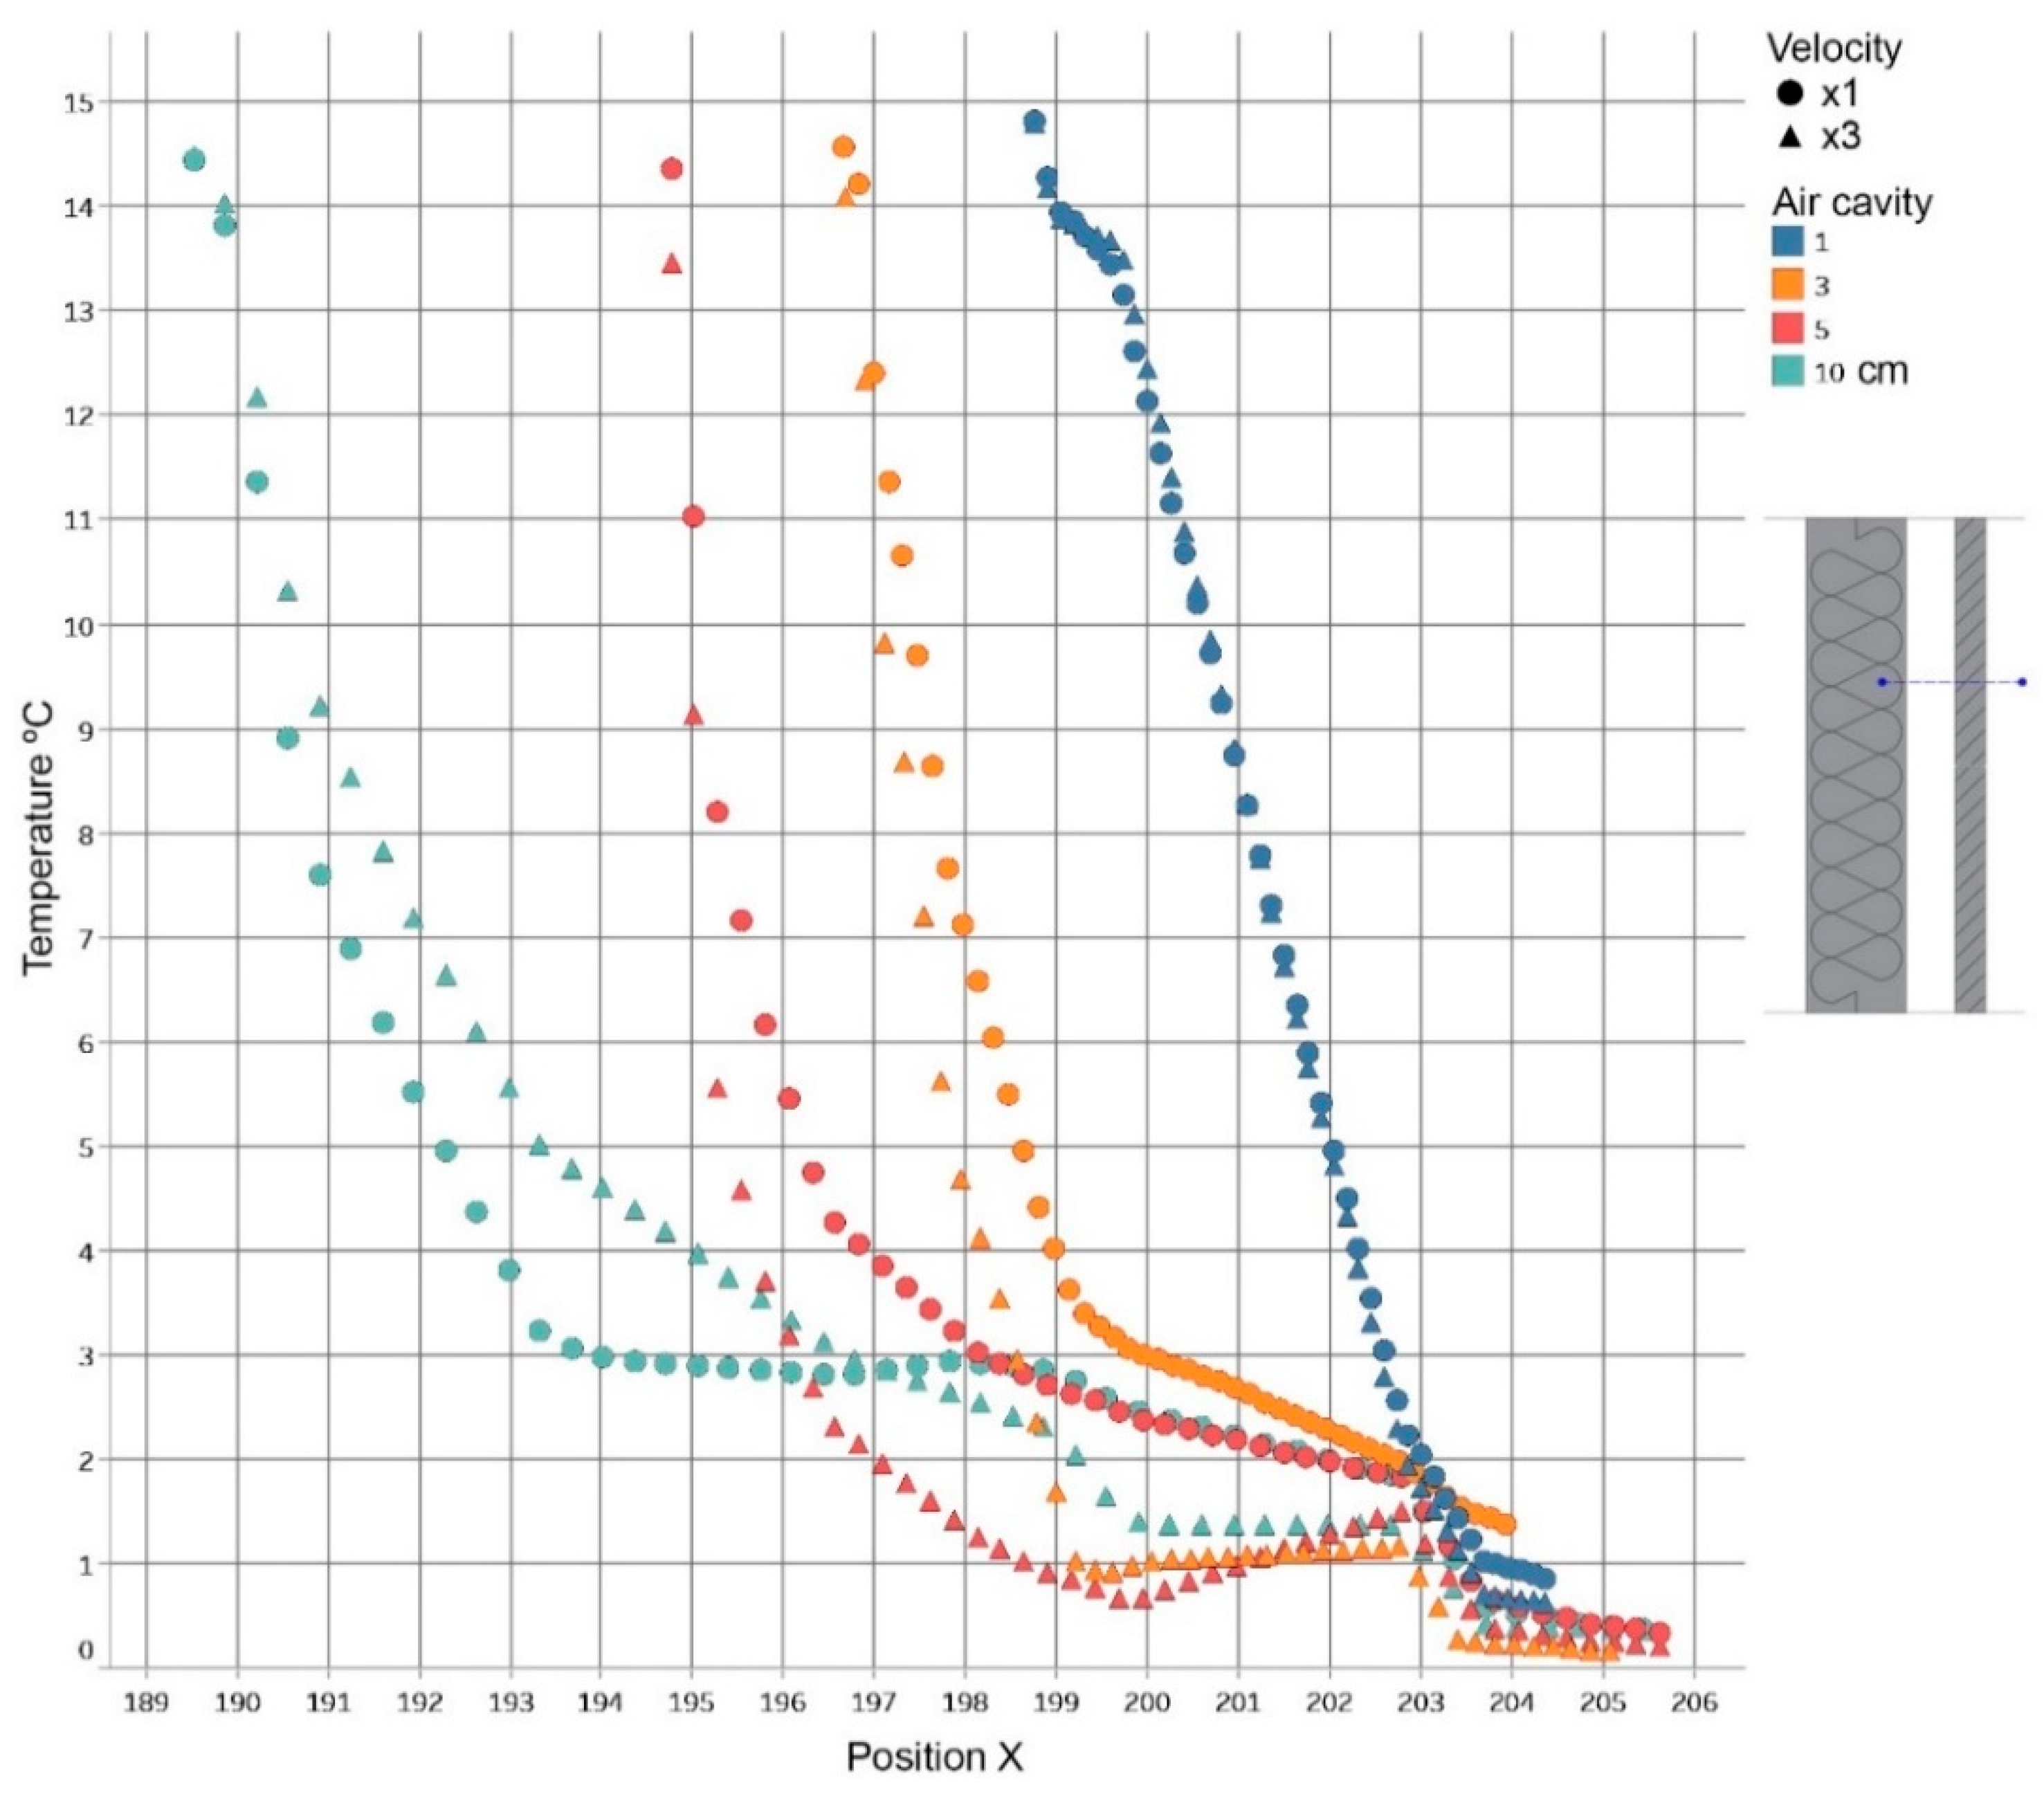
3.1. CFD numerical simulation
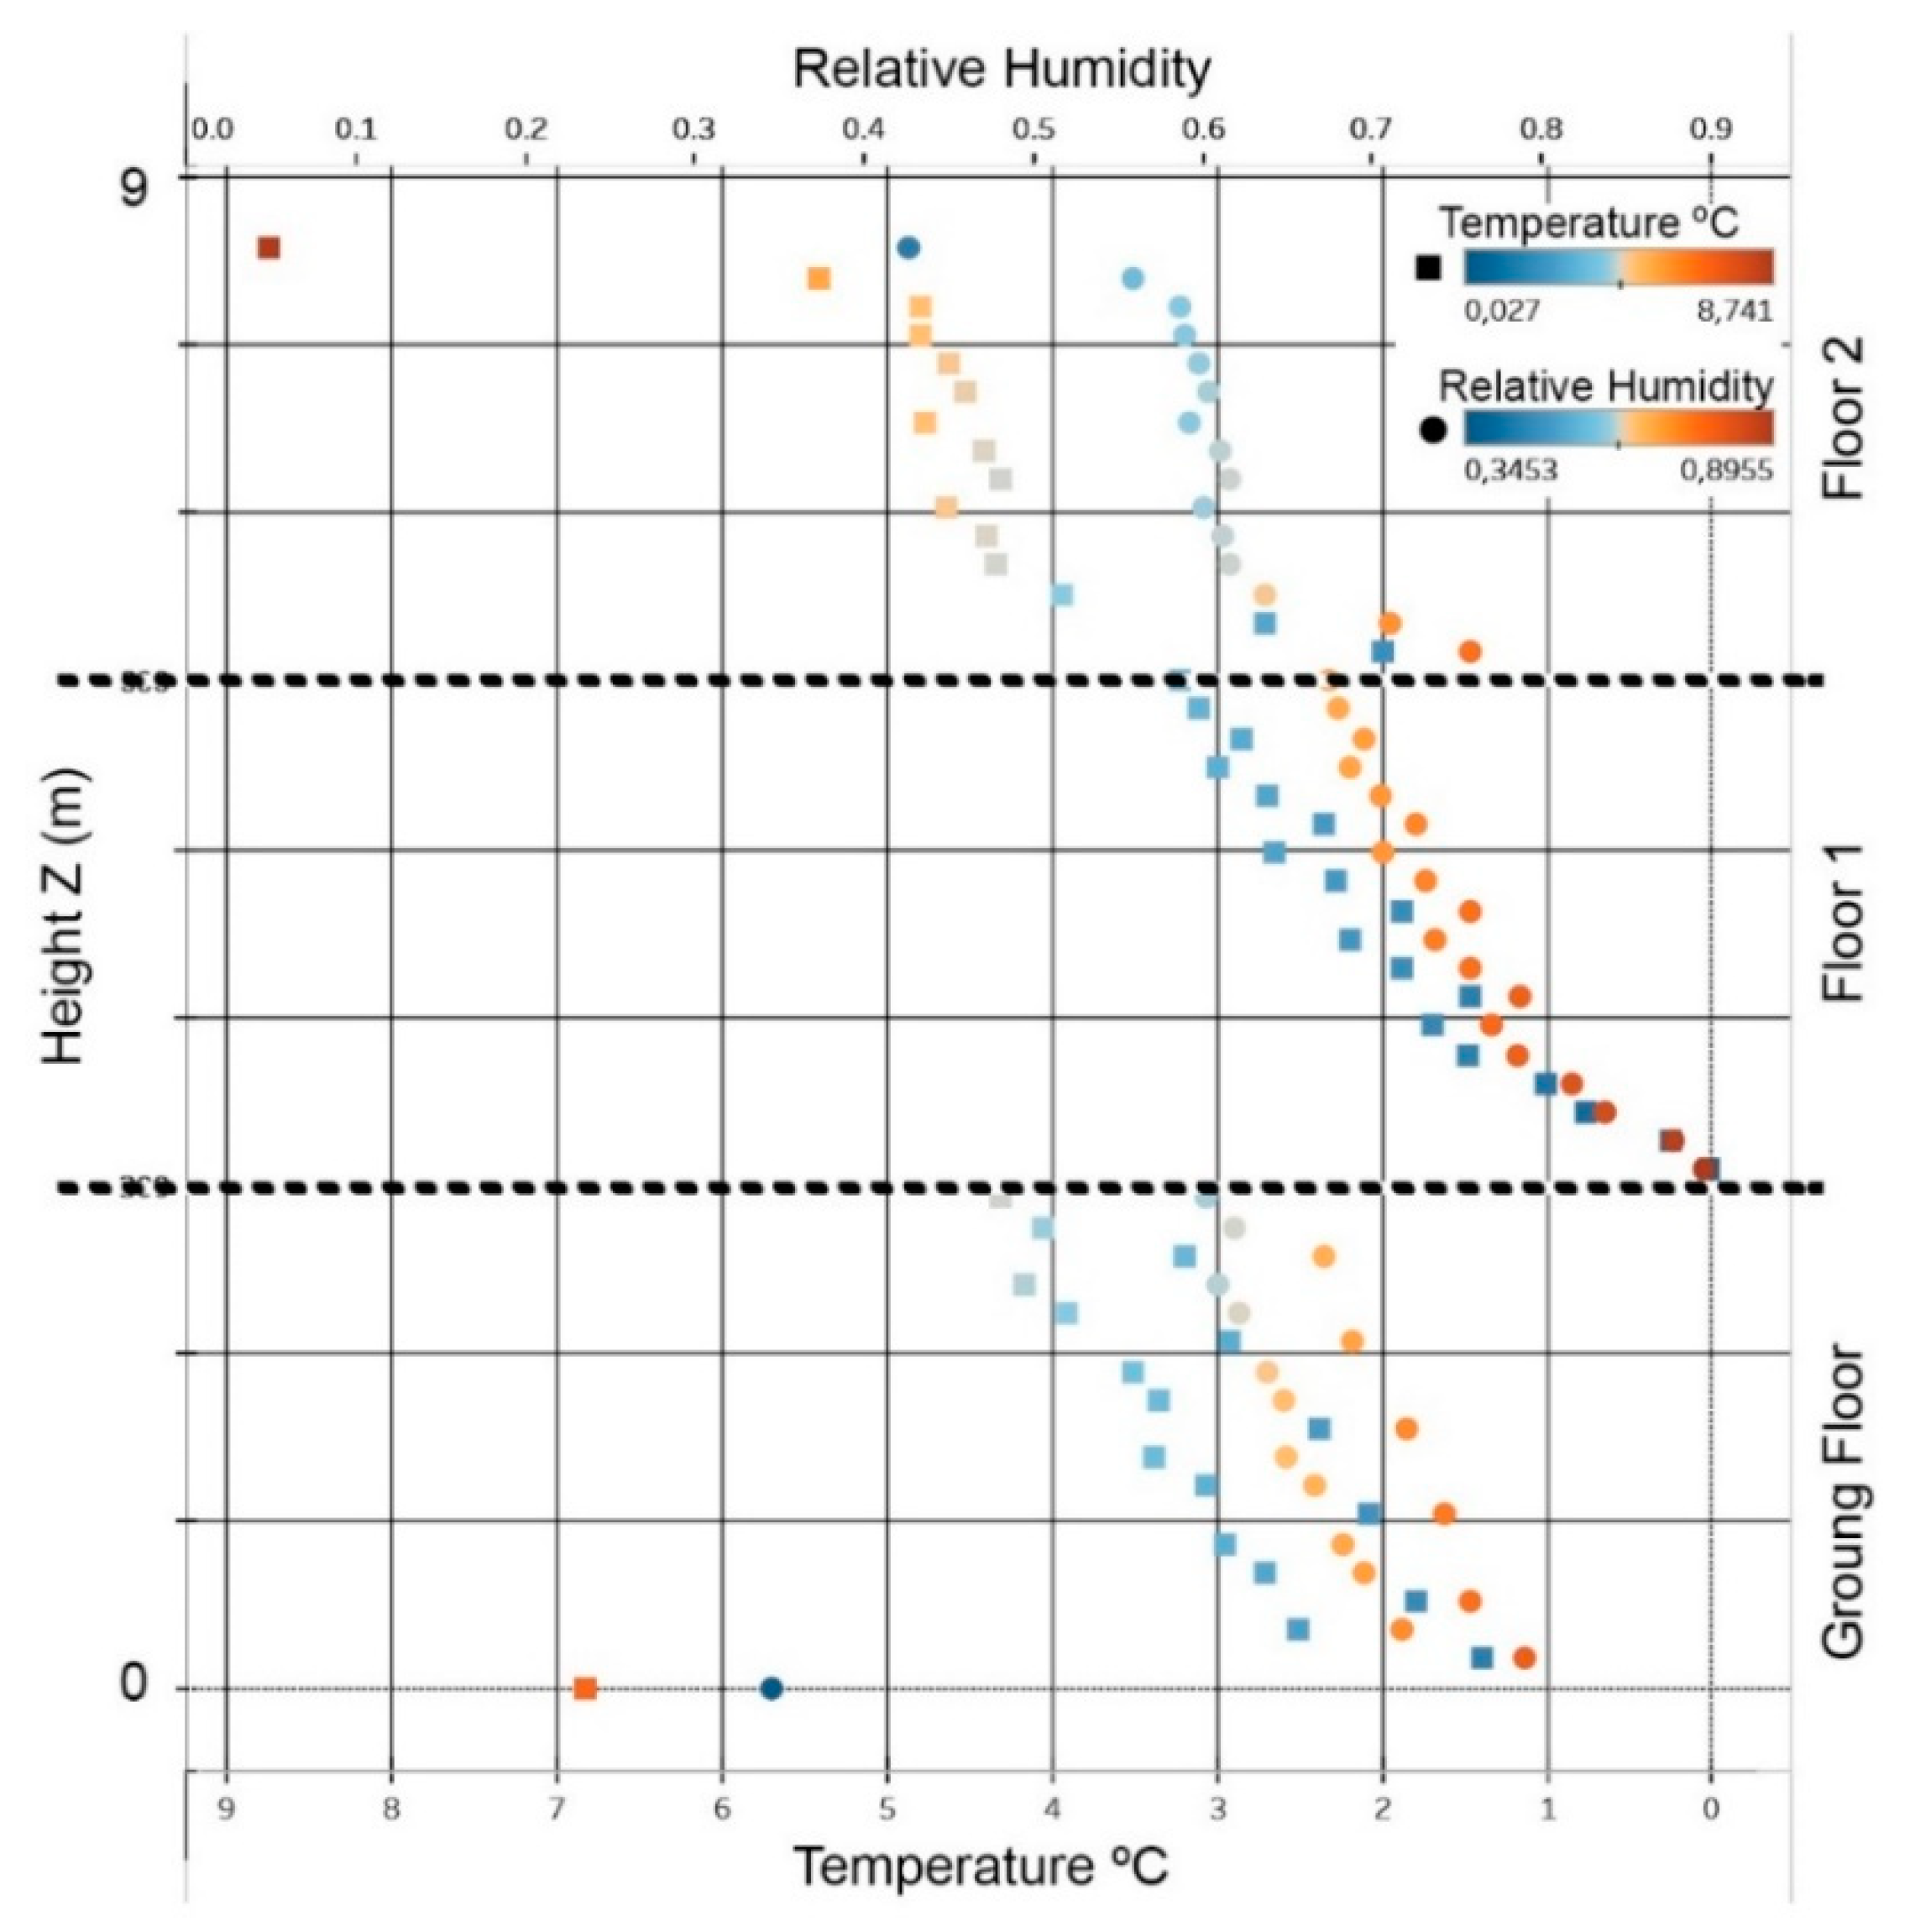
3.2. Application of IRT
4. Conclusions
Author Contributions
Conflicts of Interest
References
- Garden, G.K. Rain penetration and its control. National Research Council of Canada. Can. Build. Dig. 1963, 40, 4. [Google Scholar]
- De Vahl Davis, G. Natural convection of air in a square cavity. Int. J. Numer. Methods Fluids 1983, 3, 249–264. [Google Scholar] [CrossRef]
- Kaminski, D.A.; Prakash, C. Conjugate natural convection problem in the enclosure with one thick vertical wall. Int. J. Heat Mass Transf. 1986, 12, 1979–1988. [Google Scholar] [CrossRef]
- Du, Z.G.; Bilgen, E. Coupling of wall conductivity with natural convection during a rectangular enclosure. Int. J. Heat Mass Transf. 1992, 35, 1962–1975. [Google Scholar] [CrossRef]
- Hakyemez, E.; Mobedi, M.; Oztop, H.F. Effects of wall- located heat barrier on conjugate conduction and natural convection heat transfer and fluid flow in enclosures. Numer. Heat Transf. 2008, 54, 197–220. [Google Scholar] [CrossRef]
- Kuehn, T.H.; Maldonado, E.A.B. Two-dimensional transient heat transfer through composite wood frame walls—Field measurements and modeling. Energy Build. 1984, 6, 55–66. [Google Scholar] [CrossRef]
- Al-Sanea, S.A.; Zedan, M.F. Effect of thermal bridges on transmission loads and thermal resistance of building walls under dynamic conditions. Appl. Energy 2012, 98, 584–593. [Google Scholar] [CrossRef]
- Vercher, J.; Lerma, C.; Vidal, M.; Gil, E. Analysis of energy efficiency in construction solutions at the façade-slab connection. Adv. Mater. Res. 2013, 787, 731–735. [Google Scholar] [CrossRef]
- Mas, Á.; Gutiérrez, J.; Gil, E.; Gil, A.; Galvañ, V. Design and construction recommendations to improve impermeability in rainscreen walls built with natural Stone coverings. Constr. Build. Mater. 2011, 25, 1753–1761. [Google Scholar] [CrossRef]
- Kumar Patidar, A.; Kannan, M.R. Simulation of conjugate heat transfer and natural convection in the unfilled cavity-walls of building using ADINA-CFD. Int. J. Civ. Struct. Environ. Infrastruct. Eng. Res. Dev. (IJCSEIERD) 2013, 3, 165–174. [Google Scholar]
- Kersten, B.; Schijndel, J. Modeling the heat exchange in cavities of building constructions using comsol multiphysics®. In Proceedings of the 2013 COMSOL Conference in Rotterdam, Rotterdam, The Netherlands, 23–25 October 2013. [Google Scholar]
- Rousseau, M.Z. Facts and fictions of rain-screen walls. Constr. Can. 1990, 32, 42–44. [Google Scholar]
- Salonvaara, M.H.; Karagiozis, A.N.; Pazera, M.; Miller, W. Air cavities behind claddings—What have we learned? In Proceedings of the Thermal Performance of the Exterior Envelopes of Whole Buildings Tenth International Conference, Clearwater Beach, FL, USA, 2–7 December 2007. [Google Scholar]
- Finch, G.; Straube, J. Ventilated wall claddings: Review, field performance and hygrothermal modeling. In Proceedings of the Thermal Performance of the Exterior Envelopes of Whole Buildings Tenth International Conference, Clearwater Beach, FL, USA, 2–7 December 2007; ASHRAE Publications: Atlanta, GA, USA. [Google Scholar]
- Falk, J.; Sandin, K. Ventilated rainscreen cladding: Measurements of cavity air velocities, estimation of air change rates and evaluation of driving forces. Build. Environ. 2013, 59, 164–176. [Google Scholar] [CrossRef]
- Cumo, F.; Astiaso Garcia, D.; Stefanini, V.; Tiberi, M. Technologies and strategies to design sustainable tourist accommodations in areas of high environmental value not connected to the electricity grid. Int. J. Sustain. Dev. Plan. 2015, 10, 20–28. [Google Scholar] [CrossRef]
- Pagliaro, F.; Cellucci, L.; Burattini, C.; Bisegna, F.; Gugliermetti, F.; de Lieto Vollaro, A.; Salata, F.; Golasi, I. A methodological comparison between energy and environmental performance evaluation. Sustainability 2015, 7, 10324–10342. [Google Scholar] [CrossRef]
- Odewole, A.; Edwards, R. The characteristics of the velocity field in a slot-ventilated wall cavity. ARPN J. Eng. Appl. Sci. 2011, 6, 47–55. Available online: http://www.arpnjournals.com/jeas/research_papers/rp_2011/jeas_1011_570.pdf (accessed on 25 June 2019).
- Autodesk Simulation CFD Help Desk. 2019. Available online: https://knowledge.autodesk.com/support/cfd/downloads/caas/downloads/content/cfd-2016-download-and-install-help-documentation.html (accessed on 15 July 2019).
- Moropoulou, A.; Avdelidis, N.P.; Karoglou, M.; Delegou, E.T.; Alexakis, E.; Keramidas, V. Multispectral Applications of Infrared Thermography in the Diagnosis and Protection of Built Cultural Heritage. Appl. Sci. 2018, 8. [Google Scholar] [CrossRef]
- Fitzner, B. Técnicas de Diagnóstico Aplicadas a la Conservación de los Materiales de Construcción en los Edificios Históricos; Junta de Andalucía: Seville, Spain, 1996. [Google Scholar]
- Lerma, C. Análisis Arquitectónico y Constructivo del Real Colegio de Corpus Christi de Valencia. Ph.D. Thesis, Universitat Politècnica de València, Valencia, Spain, 2012. [Google Scholar]
- De Freitas, S.S.; De Freitas, V.P.; Barreira, E. Detection of façade plaster detachments using infrared thermography—A nondestructive technique. Constr. Build. Mater. 2014, 70, 80–87. [Google Scholar] [CrossRef]
- Danese, M.; Demsar, U.; Masini, N.; Charlton, M. Investigating material decay of historic buildings using visual analytics with multi-temporal infrared thermographic data. Archaeometry 2010, 52, 482–501. [Google Scholar] [CrossRef]
- Campbell, J.B. Introduction to Remote Sensing, 2nd ed.; Taylor & Francis: London, UK, 1996. [Google Scholar]
- Lerma, C.; Barreira, E.; Almeida, R.M.S.F. A discussion concerning active infrared thermography in the evaluation of buildings air infiltration. Energy Build. 2018, 168, 56–66. [Google Scholar] [CrossRef]
- Meola, C.; Carlomagno, G.M.; Giorleo, L. The use of infrared thermography for materials characterization. J. Mater. Process. Technol. 2004, 155, 1132–1137. [Google Scholar] [CrossRef]
- AENOR. UNE 22203-2011 Standard. Natural Stone Products. Construction of Slabs for Façade with Natural Stone; AENOR: Madrid, Spain, 2011. [Google Scholar]
- Ministerio de Fomento. Spanish Standard CTE-DB-HS: Código Técnico de la Edificación, Documento Básico, Salubridad; Ministerio de Fomento: Madrid, Spain, 2017; Available online: https://www.codigotecnico.org/images/stories/pdf/salubridad/DBHS.pdf (accessed on 15 June 2019).
- IDAE, Spanish Institute for Diversification and Energy Saving. Technical Guide for the External Climatic Conditions of the Project. Available online: https://www.idae.es/uploads/documentos/documentos_12_Guia_tecnica_condiciones_climaticas_exteriores_de_proyecto_e4e5b769.pdf (accessed on 17 July 2019).
- Ministerio de Fomento. Spanish Standard CTE-SE-AE: Código Técnico de la Edificación, Documento Básico, Seguridad Estructural, Acciones en la Edificación; Ministerio de Fomento: Madrid, Spain, 2017; Available online: https://www.codigotecnico.org/images/stories/pdf/seguridadEstructural/DBSE-AE.pdf (accessed on 15 June 2019).
- IDEA. Spanish Institute for Diversification and Energy Saving. Available online: https://www.idae.es/uploads/documentos/documentos_Guia_007_Frecuencias_horarias_repeticion_en_temperatura_Intervalo_24_h_a7945051.pdf (accessed on 17 July 2019).
- Martínez, F.; Moya, C.; Rodríguez, M.; Requena, R.; Briz, Á.; Moshuk, M.; Morales, T.; Rivas, G.; Morala, J.F.; Badenes, J.; et al. Statistics Summary of the City of Valencia (Spain); Valencia City Council: Valencia, Spain, 2018; Available online: http://www.valencia.es/ayuntamiento/webs/estadistica/Recull/Recull2018_Ingles.pdf (accessed on 17 July 2019).
- Weather Online. Relative Humidity Values 2015–2019. Available online: https://www.woespana.es/weather/maps/city?LANG=es&WMO=08284&ART=RLF&CONT=eses&R=0&LEVEL=150®ION=0005&LAND=SP&NOREGION=1&MOD=&TMX=&TMN=&SON=&PRE=&MONAT=&OFFS=&SORT=&MM=01&YY=2019&WEEK=200 (accessed on 15 July 2019).
- Olgyay, V. Design with Climate, Bioclimatic Approach to Architectural Regionalism; Princeton University Press: Princeton, NJ, USA, 2015; ISBN 9780691169736. Available online: https://press.princeton.edu/titles/10603.html (accessed on 17 July 2019).
- Autodesk Simulation CFD Help Desk. 2019. Available online: https://knowledge.autodesk.com/support/cfd/learn-explore/caas/CloudHelp/cloudhelp/2018/ENU/SimCFD-Learning/files/GUID-83A92AE5-0E9E-4E2D-B61F-64B3696E5F66-htm.html (accessed on 15 July 2019).
- Rodríguez Liñán, C. Inspección mediante técnicas no destructivas de un edificio histórico: Oratorio San Felipe Neri (Cádiz). Inf. Constr. 2011, 63, 13–22. [Google Scholar] [CrossRef]
- Cañas, I. Thermal-physical aspects of materials used for the construction or rural buildings in Soria (Spain). Constr. Build. Mater. 2005, 19, 197–211. [Google Scholar]
- Doggett, M.S.; Brunjes, R.F. Simulation of Convective Heat Loss through Mineral Wool in a Rainscreen Façade. Presentation to Minnesota Building Enclosure Council, 24 May 2016. Available online: https://bec-mn.org/wp-content/uploads/2016/05/convective-heat-loss-through-mineral-wool-in-rainscreen-facades-0526161.pdf (accessed on 16 July 2019).

| CASE | Dim. Chamber | Air Veloc. | Joint Dim. | Season | Direction |
|---|---|---|---|---|---|
| 1 | C1: 1 cm | ×1 | 2 mm | winter | leeward |
| 2 | C1: 1 cm | ×3 | 2 mm | winter | leeward |
| 3 | C3: 3 cm | ×1 | 2 mm | winter | leeward |
| 4 | C3: 3 cm | ×3 | 2 mm | winter | leeward |
| 5 | C5: 5 cm | ×1 | 2 mm | winter | leeward |
| 6 | C5: 5 cm | ×3 | 2 mm | winter | leeward |
| 7 | C10: 10 cm | ×1 | 2 mm | winter | leeward |
| 8 | C10: 10 cm | ×3 | 2 mm | winter | leeward |
| 9 | C25: 25 cm | ×1 | 2 mm | winter | leeward |
| 10 | C25: 25 cm | ×3 | 2 mm | winter | leeward |
| Property | Moist Air | Stone | Polystyrene |
|---|---|---|---|
| Density (Kg/m3) | incompressible | 2306 | 55 |
| Viscosity (Pa·s) | 0.001817 | - | - |
| Conductivity (W/m K) | 0.02563 | 1.1 | 0.027 |
| Specific heat (J/g K) | 1.004 | 0.837 | 1.21 |
| Emissivity | 1 | 0.92 | 0.5 |
| Flux (W/(m2·K)) | |||||
|---|---|---|---|---|---|
| Horizontal | Vertical | ||||
| Upward | Downward | ||||
| OUT | IN | OUT | IN | OUT | IN |
| 4 | 35 | 4 | 35 | 4 | 35 |
| (a) | Temperature | Air Velocity ×1–×3 | ||||
| C1 | C3 | C5 | C10 | C25 | ||
| Floor 2 | −20% | −12% | −17% | −14% | −13% | |
| Floor 1 | −26% | −26% | −18% | −18% | −1% | |
| Ground Floor | −2% | −27% | −29% | −8% | −8% | |
| (b) | RH | Air Velocity ×1–×3 | ||||
| C1 | C3 | C5 | C10 | C25 | ||
| Floor 2 | 18% | 6% | 8% | 13% | 7% | |
| Floor 1 | 29% | 10% | 6% | 8% | 3% | |
| Ground Floor | 5% | 17% | 7% | 3% | 9% | |
| (a) | Temperature | Air Velocity ×1 | (c) | Temperature | Air Velocity ×3 | ||||||
| C3–C1 | C5–C3 | C10–C5 | C25–C10 | C3–C1 | C5–C3 | C10–C5 | C25–C10 | ||||
| Floor 2 | −31% | −7% | −11% | 4% | Floor 2 | −24% | −12% | −7% | 4% | ||
| Floor 1 | −47% | −18% | 0% | 7% | Floor 1 | −47% | −8% | −1% | 29% | ||
| Ground Floor | −46% | −22% | 4% | 11% | Ground Floor | −60% | −24% | 35% | 11% | ||
| (b) | RH | Air Velocity ×1 | (d) | RH | Air Velocity ×3 | ||||||
| C3–C1 | C5–C3 | C10–C5 | C25–C10 | C3–C1 | C5–C3 | C10–C5 | C25–C10 | ||||
| Floor 2 | 36% | 3% | 4% | 5% | Floor 2 | 23% | 5% | 9% | −1% | ||
| Floor 1 | 96% | −10% | −1% | 21% | Floor 1 | 67% | −13% | 0% | 16% | ||
| Ground Floor | 57% | 4% | 7% | 5% | Ground Floor | 74% | −5% | 2% | 11% | ||
© 2019 by the authors. Licensee MDPI, Basel, Switzerland. This article is an open access article distributed under the terms and conditions of the Creative Commons Attribution (CC BY) license (http://creativecommons.org/licenses/by/4.0/).
Share and Cite
Lerma, C.; Mas, Á.; Gil, E.; Vercher, J. Hygrothermal Behaviour of Continuous Air Chambers on Stone Panels Façades through CFD and IRT. Appl. Sci. 2019, 9, 3001. https://doi.org/10.3390/app9153001
Lerma C, Mas Á, Gil E, Vercher J. Hygrothermal Behaviour of Continuous Air Chambers on Stone Panels Façades through CFD and IRT. Applied Sciences. 2019; 9(15):3001. https://doi.org/10.3390/app9153001
Chicago/Turabian StyleLerma, Carlos, Ángeles Mas, Enrique Gil, and Jose Vercher. 2019. "Hygrothermal Behaviour of Continuous Air Chambers on Stone Panels Façades through CFD and IRT" Applied Sciences 9, no. 15: 3001. https://doi.org/10.3390/app9153001
APA StyleLerma, C., Mas, Á., Gil, E., & Vercher, J. (2019). Hygrothermal Behaviour of Continuous Air Chambers on Stone Panels Façades through CFD and IRT. Applied Sciences, 9(15), 3001. https://doi.org/10.3390/app9153001