Article

Sublethal Injury Caused to Listeria monocytogenes by Natural Plant Extracts: Case Study on Grape Seed Extract and Garlic Extract

1
BioTeC+, Chemical and Biochemical Process Technology and Control, Department of Chemical Engineering, KU Leuven, 9000 Ghent, Belgium
2
OPTEC, Optimization in Engineering Center of Excellence, KU Leuven, 9000 Ghent, Belgium
3
CPMF2, Flemish Cluster Predictive Microbiology in Foods—www.cpmf2.be, 9000 Ghent, Belgium
*
Author to whom correspondence should be addressed.
Appl. Sci. 2019, 9(13), 2731; https://doi.org/10.3390/app9132731
Submission received: 6 June 2019 / Revised: 28 June 2019 / Accepted: 1 July 2019 / Published: 5 July 2019
(This article belongs to the Special Issue Natural Antimicrobial Preservatives)

Abstract

:

Featured Application

Studies focusing on the development of novel (antibacterial) food preservation technologies involving natural plant extracts rarely take into account the sublethal injury induced to bacterial cells. In the current study, sublethal injury caused by two such natural plant extracts (i.e., grape seed and garlic extract) was quantified, disclosing the possible overestimation of the antibacterial effect of some of these novel food preservation technologies. Consequently, the use of those extracts without taking into account the extent of sublethal injury could result in serious food safety issues.

Abstract

Natural antimicrobials, such as grape seed extract (GSE) and garlic extract (GE), are often used as (a part of) novel food preservation technologies, especially due to their antilisterial effect. However, little is known on the extent of sublethal injury (SI) these extracts cause to Listeria monocytogenes, possibly leading to overestimated efficacies for such novel technologies. The influence of both extracts on the sublethal injury of L. monocytogenes strain LMG23775 was investigated, also using propidium iodide staining to investigate the nature of the injury. Minimum inhibitory concentrations were 500 mg gallic acid equivalents (GAE)/L and 7.5 μg allicin/mL for GSE and GE, respectively. These concentrations slowed down the growth of L. monocytogenes, while only causing a significant amount of SI for GSE. Pure extracts caused inactivation of the cells, with GSE being the most effective. Sublethal injury from pure GSE was mainly caused by membrane damage. In pure GE, a significant amount of SI, not caused by membrane damage, was also present, albeit less pronounced than in pure GSE. In conclusion, both extracts cause a significant amount of sublethal injury to L. monocytogenes, which is not taken into account in relevant studies investigating novel food preservation applications involving natural plant extracts.

1. Introduction

Food preservation strategies to which foodborne pathogens are subjected throughout the food chain may result in physiological alterations of varying degrees, i.e., sublethal injury (SI) [1,2]. Hurst [3] defined SI as “a consequence of exposure to a chemical or physical process that damages but does not kill a microorganism”. Since the selective media which are commonly used to detect pathogenic microorganisms are unable to support the growth of sublethally injured target microorganisms, SI causes serious limitations in food diagnostics due to the possible underestimation of contamination and false negative results [2]. Moreover, injured microorganisms might be able to recover and exhibit enhanced resistance to antimicrobial treatments [1]. Cells can become sublethally injured due to the specific food environment, processing or preservation technologies, and the injury can be either structural (i.e., altered membrane permeability), metabolic (i.e., damage to functional cell components), or a combination of both [1].
Various preservation technologies are used to prevent the outgrowth of pathogens in food products. Nowadays, consumers show an increased interest in natural, nutritious, minimally processed food products, which are still safe to eat. Most traditional food preservation technologies fail to succeed in retaining the nutritional aspects of foods (e.g., loss of vitamins), resulting in a need for novel food preservation technologies [4]. Recently, food researchers are investigating natural antimicrobial compounds like natural plant extracts as possible alternatives [5,6]. Grape seed extract (GSE) and garlic extract (GE) are examples of natural plant extracts which have shown promising antimicrobial effects [7,8]. GSE and GE owe their antimicrobial properties to phenolic compounds [9] and allicin (an oxygenated organic sulfur compound) [10], respectively.
Among the common foodborne pathogens, Listeria monocytogenes is very relevant for the validation of antimicrobial treatments due to its high resistance to various stresses [11]. Furthermore, the bacterium is especially dangerous due to its high fatality rate, e.g., 13.8% of infected people died in Europe in 2017 [12]. Symptoms of the disease range from mild clinical features like fever and diarrhea to severe infections like meningitis and septicemia [13]. Both GSE and GE are commonly investigated for novel multiple-hurdle applications against L. monocytogenes. In this regard, GSE is studied for its antilisterial effect in edible antimicrobial food coatings [14,15,16,17] and as a preservative replacement in food products [18,19]. An example of a novel application of GE is the encapsulation of the extract in order to overcome common applicability limitations of allicin, e.g., heat sensitivity and strong odor [20,21,22].
Despite the extensive amount of studies that focused on promising novel antibacterial applications of natural plant extracts like GSE and GE, none of these (to the best knowledge of the authors) took into account the effect of those extracts on SI of Listeria. Consequently, the antibacterial (i.e., growth inhibition or inactivation) effect of those novel applications could be overestimated, leading to serious food safety issues. In this study, the separate effect of GSE and GE on the occurrence of SI in L. monocytogenes was therefore investigated, both for the pure extracts and the extracts at their minimum inhibitory concentration (MIC). The extracts at their MIC and the pure extracts were used to simulate applications resulting in growth reduction and inactivation (of L. monocytogenes), respectively. In order to understand the nature of the sublethal injury caused by the extracts, possible membrane damage was investigated using propidium iodide (PI) staining.

2. Materials and Methods

2.1. Microorganisms and Preculture Conditions

L. monocytogenes LMG23775 strain, was acquired from the BCCM/LMG bacteria collection of Ghent University in Belgium. A stock culture was stored at −80 °C in Tryptone Soy Broth supplemented with 6 g/L yeast extract (TSBYE, Oxoid, Basingstoke, UK) and 200 mL/L glycerol (Acros Organics, Geel, Belgium). Inocula were prepared by transferring a loopful of the stock culture into 20 mL of TSBYE. After incubating for 24 h at 30 °C under static conditions (Binder KB-series incubator; Binder Inc., New York, NY, USA), 20 μL of the stationary phase culture was inoculated into 20 mL of fresh TSBYE and incubated for 24 h under the same conditions. This resulted in a stationary phase L. monocytogenes culture with cell density of approximately 109 CFU/mL, as evidenced by plate counting on Tryptone Soy Agar supplemented with 6 g/L yeast extract (TSAYE, Oxoid, Basingstoke, UK).

2.2. Preparation of Bioactive Extracts

The procedure to prepare GSE was based on the protocol reported by Silván et al. [8]. Briefly, GSE powder (Laboratories GSN, Madrid, Spain) was dissolved in distilled water (500 mg per 10 mL) and vortexed for 5 min at room temperature. The resulting suspension was centrifuged at 2600× g for 10 min at 4 °C. The supernatant was collected and filter-sterilized with a pore size membrane of 0.22 μm (TPP, Trasadingen, Switzerland). The pure GSE was used immediately or stored at room temperature in the dark. The total phenolic content of the pure extract was approximately 2500 mg gallic acid equivalents (GAE)/L and its phenolic profile consisted mainly of flavonols, phenolic acids, anthocyanins, catechins, and proanthocyanidins, among which the catechins and proanthocyanidins represented 77.6% of the phenolic compounds [8]. Readers are referred to Silván et al. [8] for a more detailed description of the composition of the extract.
The procedure to prepare GE was based on the protocol reported by Prasad et al. [23]. Solgar Garlic Powder capsules (Solgar inc., Leonia, NJ, USA), each containing 5000 μg of alliin (an allicin precursor) with an allicin yield of 750 μg, were carefully opened and the powder was dissolved in distilled water (500 mg per 5 mL). The suspension was vortexed for 5 min and centrifuged at 4600× g for 10 min at 4 °C. Afterwards, the supernatant was centrifuged at the same conditions and filter-sterilized. The pure GE was immediately used or stored at 4 °C in the dark. The theoretical allicin concentration of the pure extract was 150 μg/mL.

2.3. Minimum Inhibitory Concentration (MIC)

The minimum inhibitory concentration (MIC) of the extracts was defined as the lowest concentration of extract that inflicts a significant quantitative decrease (P ≤ 0.05) in viability of L. monocytogenes cells as compared to the control after 24 h [8]. Mixtures of the respective extract and TSBYE with different bioactive concentrations (i.e., 10–20–50–100–250–500–1000–1200–1400–1500–1600–1800–2000–2250 and 2500 mg GAE/L for GSE and 7.5–15.0–30.0–45.0–60.0–75.0–90.0–112.5–127.5 and 150.0 μg allicin/mL for GE) and a control in TSBYE were inoculated under aseptic conditions to yield a final L. monocytogenes concentration of approximately 107 CFU/mL. This high inoculation level was chosen in order to be able to effectively study inactivation dynamics during challenge testing. The mixtures were incubated at 30 °C and 180 rpm (Orbital shaker PSU-10i, Grant-bio, Cambridge, UK) for 24 h. Afterwards, a sample from each mixture was taken and decimally diluted using an aqueous saline solution containing 9 g/L NaCl. The different dilutions were plated on TSAYE using the drop technique [24]. For dilutions 10−1 to 10−6, this method involved the careful deposit of 20 μL drops onto the corresponding agar plates, resulting in a considerable reduction in workload and consumable consumption. For undiluted samples, drops of 100 µL were plated and spread using an L-shaped spreader in order to acquire a lower detection limit. Plates were incubated at 30 °C for 24 h, after which the colonies were counted. Total viable counts for each mixture were compared with the control and significant statistical differences were determined as discussed in more detail in Section 2.7 “Statistical Analysis”.

2.4. Challenge Testing

GSE-MIC, GE-MIC, pure GSE, pure GE, and a control in TSBYE not containing any extract were inoculated with 200 μL of a stationary phase culture of L. monocytogenes (to a concentration of approximately 107 CFU/mL), and incubated at 30 °C while shaking at 180 rpm. Samples were taken at different time intervals, decimally diluted and plated on a nonselective and a selective medium with the drop technique. TSAYE and Listeria selective agar—Oxford formulation (Oxford, VWR Chemicals, Leuven, Belgium) were used as a nonselective and selective medium, respectively. The plates were incubated at 30 °C for 24 h, after which the colonies were counted. The experimental data were plotted as a function of time. To model the growth and inactivation of L. monocytogenes, the primary models of Baranyi and Roberts [25] and Geeraerd et al. [26] were fitted to the experimental data, respectively.
The growth model of Baranyi and Roberts [25] is described by Equations (1)–(3).
d N ( t ) d t = ( Q ( t ) 1 + Q ( t ) ) · μ m a x · ( 1 N ( t ) N m a x ) · N ( t )
d Q ( t ) d t = μ m a x · Q ( t )
λ · μ m a x = ln ( 1 + 1 Q ( 0 ) )
With N(t) [CFU/mL], the cell density at time t; Nmax [CFU/mL], the maximum cell density; μmax [1/h], the maximum specific growth rate; Q(t) [−], representing the physiological state of the cells; Q(0) [−], a measure of the initial physiological state of the cells; and λ [h], the lag phase duration. Since experiments were conducted at static environmental conditions, the model was simplified to
ln ( N ( t ) ) = ln ( N ( 0 ) ) + μ m a x · A ( t ) ln ( 1 + e μ m a x · A ( t ) 1 e ( N m a x N ( 0 ) ) )
A ( t ) = t + 1 μ m a x ln ( e μ m a x · t + Q ( 0 ) 1 + Q ( 0 ) )
The inactivation model of Geeraerd et al. [26] is described by Equations (6)–(8).
d N ( t ) d t = ( 1 1 + C c ( t ) ) · k m a x · ( 1 N r e s N ( t ) ) · N ( t )
d C C ( t ) d t = k m a x · C C ( t )
C C ( 0 ) = e k m a x S L 1
With N(t) [CFU/mL], the cell density at time t; Nres [CFU/mL], the residual cell density (or stress resistant subpopulation); kmax [1/h], the maximum specific inactivation rate; CC(t) [−], representing a critical intracellular or extracellular component for cell survival; Cc(0) [–], the initial concentration of this critical component; and SL [h], the shoulder length. Since experiments were conducted at static environmental conditions, the model was simplified to
N ( t ) = ( N 0 N r e s ) · e k m a x t · ( e k m a x S L 1 + ( e k m a x S L 1 ) · e k m a x t ) + N r e s
Parameters of the models were estimated via the minimization of the sum of squared errors, using the lsqnonlin routine of the Optimization Toolbox of MATLAB version R2018b (The Mathworks, Inc., Natick, MA, USA). For fitting purposes the results were logarithmically transformed. For the growth model of Baranyi and Roberts [25], results were expressed as ln (CFU/mL), because the model involves the natural exponential function to describe the growth phase. For the inactivation model of Geeraerd et al. [26], results were expressed as log (CFU/mL), because the model, as all inactivation models, requires the reduction of microorganisms to be expressed in log units. In order to avoid apparent SI caused by small fitting differences, the initial cell density N0 was set to be equal to the average of the cell densities at time zero of the individual replicates on the selective and nonselective medium for each condition, i.e., approximately 7 log (CFU/mL) or 16 ln (CFU/mL).

2.5. Assessment of Sublethal Injury

The theoretical data, obtained from the respective models, was used to calculate the SI using Equation (10), according to the formula of Busch and Donnelly [27]. TSAYE and Oxford served as a nonselective and selective medium, respectively.
SI = CFU   on   nonselective   agar CFU   on   selective   agar CFU   on   nonselective   agar · 100 %
In order to compare SI for the different conditions, the Time-averaged Injured Cells Coefficient (TICC) was determined, by taking the average of the total SI over the total treatment time. TICC was calculated using Equation (11), according to the formula of Miller et al. [28].
T I C C = 0 t f S I ( t ) d t t f
With t [h], the treatment time; tf [h], the total duration of the treatment; and SI [%], the percentage of sublethal injury at each time point, calculated according to Equation (10).

2.6. Determination of Propidium Iodide Uptake

In order to detect possible membrane damage induced by the extracts, the propidium iodide (PI) uptake was determined for L. monocytogenes cultures in pure GSE, pure GE, and a control in TSBYE not containing any extract, based on the protocol of Coder [29]. To prevent binding between proteins of TSBYE and GSE polyphenols and further precipitation, the preculture in TSBYE was first centrifuged at 15,000× g for 10 min and the pellet was rinsed twice with phosphate buffered saline (PBS). Three 50 mL Erlenmeyers, containing 20 mL of TSBYE, pure GSE or pure GE, were inoculated with 200 μL of the microbial suspension in PBS and incubated at 180 rpm and 30 °C. The sampling times for both extracts were selected based on the results of the challenge testing. Samples were first centrifuged at 15,000× g for 10 min. The supernatants were discarded and the cell pellets were rinsed twice with PBS. PI (Sigma-Aldrich, Saint Louis, MO, USA) was added to a final concentration of 2 μg/mL. After incubating for 10 min in the dark at room temperature, samples were centrifuged and washed twice with PBS to remove the excess dye. Fluorescence was measured with a FilterMax F5 Multi-Mode Microplate Reader (Molecular Devices, Sunnyvale, CA, USA) at an excitation wavelength of 495 nm and an emission wavelength of 615 nm. In order to take the total number of cells (i.e., dead and viable) into account, fluorescence data for each sample were normalized with the optical density (OD) at 600 nm. Data were acquired and processed using Filtermax software. The ratio of fluorescence to OD was calculated separately and averaged for each sample.

2.7. Statistical Analysis

Significant differences were determined using analysis of variance (ANOVA, single variance) test at a 95.0% confidence level (α = 0.05). Fisher’s Least Significant Difference (LSD) test was used to distinguish which means were significantly different from others. The standardised skewness and standardised kurtosis were used to assess if data sets came from normal distributions. The analyses were performed using Statgraphics Centurion 17 Package (Statistical Graphics, Washington, USA). Test statistics were regarded as significant when p ≤ 0.05.

3. Results and Discussion

3.1. Minimum Inhibitory Concentration (MIC)

The minimum inhibitory concentration (MIC) of GSE and GE against L. monocytogenes LMG23775 was assessed. For GSE and GE, the MIC was expressed as mg gallic acid equivalents (GAE)/L and μg allicin/mL, respectively, since gallic acid and allicin have been identified as the main antibacterial compounds of the respective extracts [10,30]. In further experiments, GSE and GE at their MIC were referred to as GSE-MIC and GE-MIC, respectively.
The MIC of GSE was equal to 500 mg GAE/L, corresponding to 25% of the concentration of the pure GSE. Silván et al. [8] investigated the effect of GSE, prepared according to the same protocol as in the current study, against Campylobacter jejuni, reporting a MIC of 20 mg GAE/l. Since the MIC of GSE depends on different variables including extract composition, concentration of bioactive compounds, the solvent used, and also on the used definition of MIC [8], the comparison of results with other studies involving different GSE preparation protocols is not straightforward. Taking these limitations into account, Anastasiadi et al. [30] reported that the MIC of their (Voidomato) GSE against L. monocytogenes was approximately 210 mg GAE/L. Effective GSE concentrations in other studies ranged from 160 mg GAE/L to higher values for microorganisms such as Aeromonas hydrophila, Bacillus cereus, Enterobacter Aerogenes, Enterococcus faecalis, Escherichia coli, Pseudomonas aeruginosa, Salmonella Typhimurium, and Staphylococcus aureus [8,31,32]. Consequently, the GSE used in the current study exhibits similar antimicrobial activity to those used in similar studies.
The MIC of GE was equal to 7.5 μg allicin/mL, corresponding to merely 0.05% of the concentration of pure GE. This MIC is lower than the 30.8 μg allicin/mL reported by Gomes et al. [22] for their GE against L. monocytogenes. The MIC in the current study is, however, similar to the MIC against different Salmonella serovars ranging from 8.1 to 10.1 μg allicin/mL, as reported by Belguith et al. [7] for their aqueous GE. MICs reported in other studies ranged from 4.1 to 27.5 μg allicin/mL for oral bacteria [33] and from 0.15 to 1.9 μg allicin/mL for various fungal pathogens [34]. Hence, the GE used in the current study also exhibits similar antimicrobial activity to those used in similar studies.

3.2. Challenge Testing

In Figure 1, the effect of the bioactive extracts on L. monocytogenes kinetics is demonstrated by the results of the challenge tests that were conducted in the control (A) (i.e., TSBYE without antimicrobial extracts), GSE-MIC (B), pure GSE (C), GE-MIC (D), and pure GE (E). L. monocytogenes exhibited growth in the control, GSE-MIC, and GE-MIC. An overview of the growth parameters (i.e., the lag phase λ, the maximum specific growth rate µmax, and the maximum cell density Nmax) of the Baranyi and Roberts [25] model is provided in Table 1. A comparison of those growth parameters demonstrates that both GSE-MIC (Figure 1B) and GE-MIC (Figure 1D) exerted a growth-inhibiting effect on L. monocytogenes, with the inhibition in GE-MIC being the most severe. In this regard, the most glaring effect is the significantly longer λ in GE-MIC compared to in GSE-MIC, both for the total population of injured and uninjured cells (i.e., enumerated on TSAYE plates) and the population of uninjured cells (i.e., enumerated on Oxford plates). For the total population of uninjured and injured cells, the maximum specific growth rate µmax was lower in GE-MIC than in GSE-MIC, while no significant differences were observed for the population of uninjured cells. Concerning Nmax, no significant differences were observed between GSE-MIC and GE-MIC.
L. monocytogenes was inactivated in pure GSE (Figure 1C) and pure GE (Figure 1E). An overview of the inactivation parameters (i.e., the shoulder length SL, the maximum specific inactivation rate kmax, and the residual cell population Nres) of the Geeraerd et al. [26] model is provided in Table 2. The inactivation in pure GSE was more pronounced than in pure GE, both for the total population of injured and uninjured cells and the population of uninjured cells. This observation was confirmed by the significantly shorter SL, the significantly higher kmax, and the significantly smaller Nres in pure GSE. In general, log reductions observed for pure GSE and pure GE were also similar to those observed in liquid media containing these respective extracts in other studies [17,35].

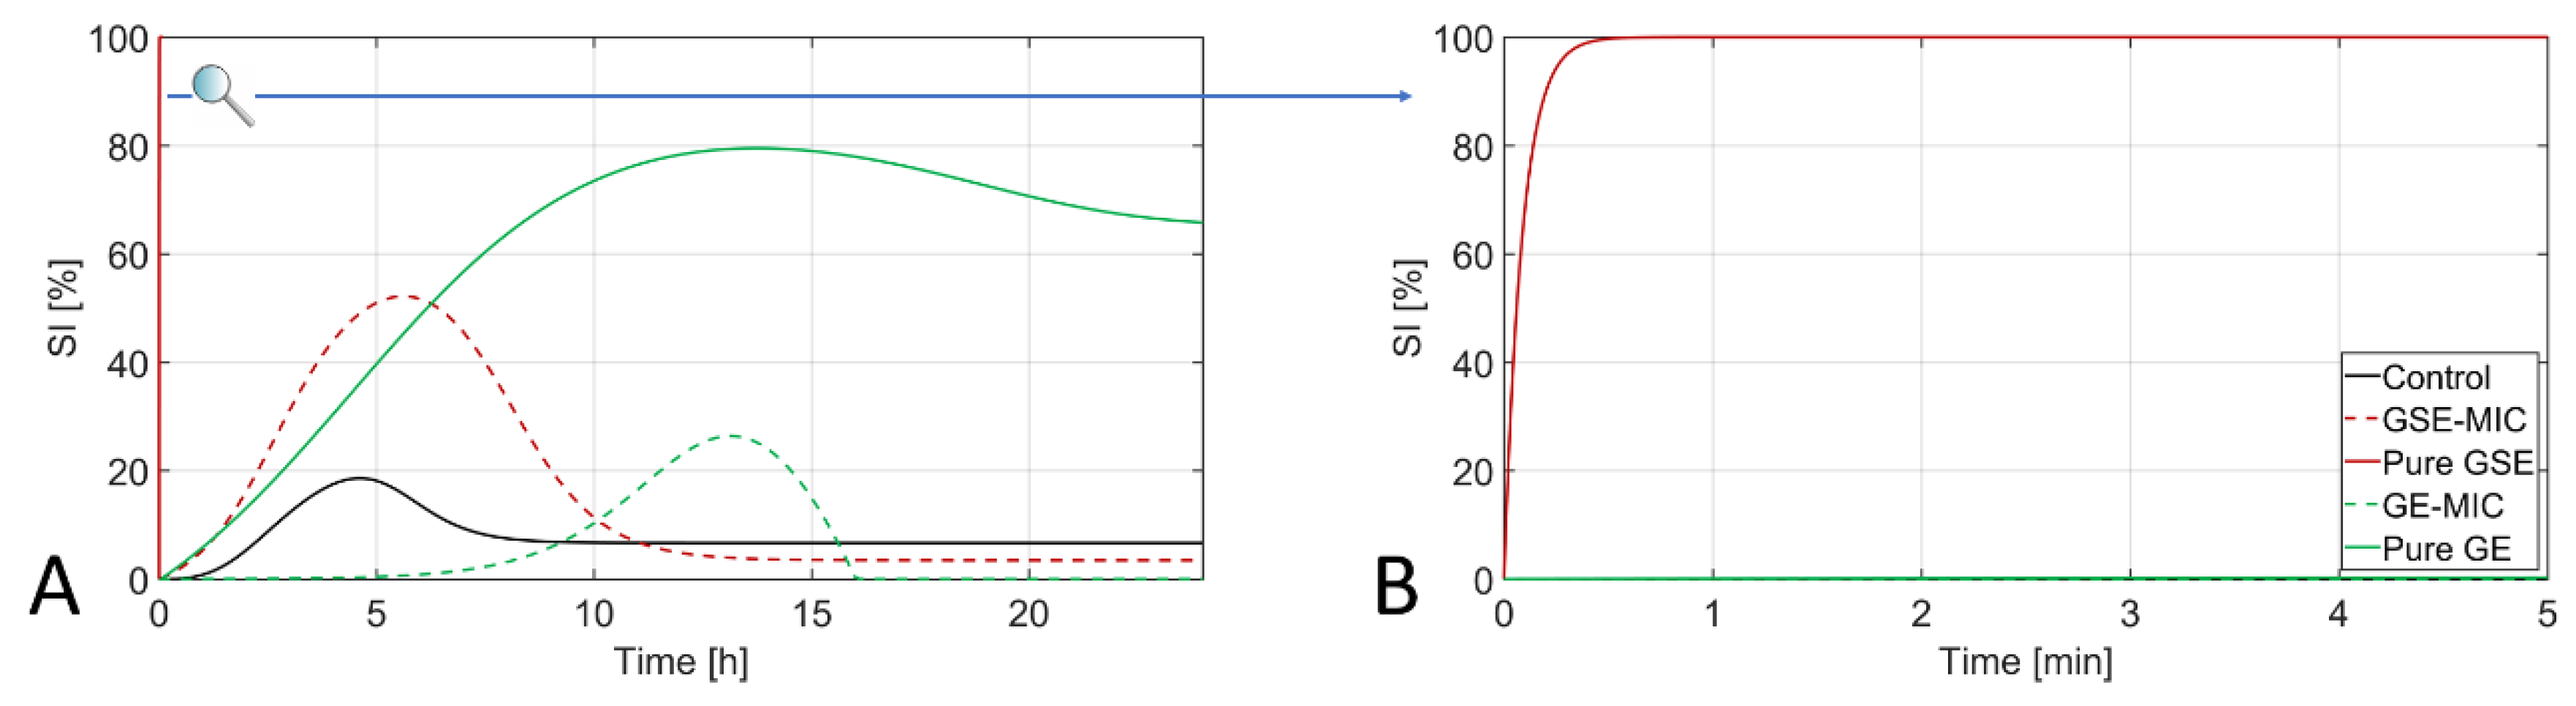
3.3. Assessment of Sublethal Injury

Figure 2 illustrates the SI of L. monocytogenes for the different conditions mentioned in the previous section. In the case of growth (i.e., control, GSE-MIC, and GE-MIC), a peak in SI (i.e., approximately 20, 50, and 25%, in the control, GSE-MIC, and GE-MIC, respectively) always occurred when the cells were in their exponential growth phase. By the time the cells reached the stationary phase, they had recovered from almost all SI. This phenomenon was probably caused by the synthesis of stress proteins by the cells in their early stationary phase, causing them to be more stress-resistant than exponentially growing cells [2]. In pure GSE, SI increased radically until a treatment time of approximately 0.5 min. Afterwards, SI reached a constant level of approximately 100%. After 5 min, no viable counts were observed on the selective medium, meaning that all surviving cells were from that moment on sublethally injured. These cells were further inactivated, until a treatment time of 3 h, after which no more viable cells were detected on the nonselective medium, as seen in Figure 1C. In the case of inactivation in pure GE, SI increased during the loglinear part of the inactivation, with a peak of approximately 80%, and decreased again in the tailing phase. This phenomenon was possibly caused by a mechanism of injury accumulation that culminates in cell death [36]. A similar behavior was observed by Noriega et al. [2] for Listeria innocua subjected to mild heating.
Table 3 shows the Time-averaged Injured Cells Coefficient (TICC) for each condition, enabling a quantitative comparison of SI among the different conditions. It can be observed that TICC was always higher in GSE than in GE, both for the pure extracts and the extracts at their MIC, a trend which was confirmed by the height of the SI peaks in Figure 2.
TICC was quite similar in GE-MIC and in the control, with TICC in GE-MIC even being slightly lower. Consequently, the risk of underestimating food contamination due to SI would be rather limited when GE is used to inhibit Listeria growth at a low extract concentration (e.g., as part of a hurdle approach). The use of free or encapsulated GE in milk to inhibit L. monocytogenes growth, as studied by Pinilla and Brandelli [21] and Pinilla et al. [20] is an example of this situation. In the aforementioned studies, free GE resulted in growth reductions ranging from 1.5 to 3.0 log. According to the findings of the current study, this growth reduction would probably not involve a significant amount of SI.
In GSE-MIC, SI of L. monocytogenes was higher than in the control and in GE-MIC. As evidenced by the SI peak in Figure 2, SI in GSE-MIC was especially relevant during the exponential growth phase of the cells. This phenomenon could result in food safety risks when low GSE concentrations are used during extended food storage at a low temperature (i.e., causing the cells to be in their exponential growth phase for a rather long period), as there might be a significant number of sublethally injured cells present which could not be enumerated on selective media. For example, Moradi et al. [16] reported that the growth of L. monocytogenes was reduced by approximately 1.5 log when GSE-impregnated chitosan films were applied to mortadella-type sausages which were stored at 4 °C for 21 days. As another example, Perumalla et al. [18] reported L. monocytogenes growth reductions ranging from 1 to 2 log in hotdog model systems in which preservatives were replaced by green tea extract and GSE. Since the growth-inhibiting effect in the two aforementioned studies was only quantified by means of viable plate counts on a selective medium, the presence of sublethally injured cells was not taken into account, possibly resulting in an overestimation of these growth-inhibiting effects.
TICC in pure GSE and pure GE was significantly higher than in the control, GSE-MIC and GE-MIC. This observation indicates that higher concentrations of the bioactive compounds also resulted in an increased SI. This phenomenon can introduce a possible overestimation of the antilisterial potential of both extracts in food applications at higher extract concentrations. Even though these high concentrations of natural extracts have limited applications in food industry due to the drastic effect on taste and odor of food products, a general trend in which an antimicrobial treatment that causes a more evident and acute inactivation also causes a higher SI is illustrated. In addition, the inactivation of L. monocytogenes caused by the pure extracts in the current study could be comparable to L. monocytogenes inactivation caused by novel applications involving lower extract concentrations.
For pure GSE, the largest amount of SI was observed, implying a risk of overestimating the efficacy of novel antilisterial applications involving GSE. This risk is rather small when high GSE concentrations are used, as evidenced by the log reduction of approximately 5 log after 1 h treatment time which was observed in Figure 1C, implying that the surviving population of (injured) cells would be limited. Nevertheless, the high degree of SI could be more relevant when using lower extract concentrations which result in a less severe bactericidal (i.e., inactivation) effect. In this regard, Bisha et al. [37] investigated the potential of GSE-based aqueous media as a produce wash, reporting log reductions ranging from 2.0 to 3.6. In the study of Kakaei and Shahbazi [15], Chitosan-gelatin films incorporated with GSE and Ziziphora clinopodioides essential oil applied to minced trout fillet resulted in L. monocytogenes log reductions of approximately 1 log. Similar log reductions were reported by Tajik et al. [19] for the use of GSE and Zataria multiflora Boiss essential oil in raw buffalo patty. Gadang et al. [14] reported L. monocytogenes log reductions of up to 4 log when whey protein isolate coating incorporated with nisin, GSE, malic acid, and EDTA was applied to turkey frankfurter systems. Finally, log reductions of up to 2 log were reported by Theivendran et al. [17] for Turkey frankfurters coated with soy protein films containing GSE and nisin. Similar to what was mentioned before for the studies involving growth reductions, the inactivation of L. monocytogenes in the five aforementioned studies was solely studied by means of viable plate counts on a selective medium. Since sublethal injury was hence not taken into account, the antilisterial effect of those novel applications was possibly overestimated.
For pure GE, the amount of SI induced to L. monocytogenes was also significant, albeit less pronounced than in pure GSE. While some laboratory-scale studies have reported the inactivation of L. monocytogenes at relatively high concentrations of GE [35,38], to the best knowledge of the authors, no studies have reported inactivation of the bacterium using novel applications involving GE concentrations suitable for food products. At those GE concentrations, a bacteriostatic effect (i.e., no growth of L. monocytogenes, but also no inactivation) is reported at best [39,40,41,42]. However, inactivation of L. monocytogenes has been reported for combinations of GE and nisin (e.g., in milk, soymilk, and hummus) [39,40,42]. Log reductions ranging from 1 to 4 log have been accomplished using this GE–nisin combination, which is similar to or higher than the log reductions observed for pure GE in the current study. Taking into account the observed trend that more severe inactivation treatments entail more SI, SI caused by GE–nisin combinations could be even more pronounced than SI caused solely by pure GE. Since the occurrence of sublethally injured cells was also not taken into account in the mentioned studies, reported antilisterial effects (i.e., both bacteriostatic and bactericidal) were possibly also overestimated.
Even though the current study only focused on SI inflicted to one specific strain of L. monocytogenes (i.e., LMG23775) and results should also be validated for other strains, the large amount of SI observed after treatments with GSE-MIC, pure GSE, and pure GE confirms the risk of over-estimating the antibacterial effect of natural plant extracts in novel food preservation applications. However, real food products contain background microflora, making it impossible to use a combination of nonselective and selective media to quantify SI, since the growth of nontarget microorganisms is also supported on nonselective media. In order to take SI into account when assessing the antilisterial effect of natural plant extracts, future research in the field should therefore include a resuscitation step to allow the quantification of both injured and healthy cells. Examples of such resuscitation techniques include liquid-repair (e.g., two-fold dilution) and solid-repair (e.g., thin agar overlay) methods [43]. In addition, the large amount of SI related to the use of natural plant extracts at relatively high concentrations confirms the advantages of using extra antilisterial measures (i.e., as part of a hurdle approach) in order to enable the use of lower extract concentrations which entail a limited amount of SI.

3.4. Determination of Propidium Iodide Uptake

In order to investigate possible membrane damage induced by the plant extracts, cells were stained with propidium iodide (PI), a component which binds to single and double stranded nucleic acids. Since PI only penetrates cells with damaged membranes, it can be used as an indicator of cytoplasmic membrane damage [44]. Figure 3 illustrates the evolution of the amount of membrane damage of L. monocytogenes in the control, pure GSE, and pure GE, employing the ratio of fluorescence (indicating cells with a damaged cell membrane) over optical density (OD) (indicating the total amount of living and dead cells).
In the control, membrane damage was detected at time 0 min. The damage decreased over time, disappearing almost completely at sampling times of 12, 18, and 24 h. Since this membrane damage was observed at time 0 min, it originated from membrane damage present in the preculture, probably caused mostly by cell death after the cells had reached the stationary phase. In this regard, precultures of 24 h were used for this experiment, while a Listeria preculture already reaches the stationary phase after approximately 9 h at 30 °C [45], resulting in a considerable amount of dead cells. The membranes of these dead cells are damaged [46], causing an increase of the total membrane damage, which is detected by the PI staining, similarly to what is the case in live/dead staining. The apparent decrease in membrane damage over time in the control was due to the growth of the cells. Since the total amount of cells increased, OD increased over time. In comparison, the amount of dead cells did not increase significantly and fluorescence remained constant. Therefore, fluorescence/OD decreased. As a consequence, no conclusions can be drawn about the nature of the small SI in the control during the exponential growth phase, observed in Figure 2. If this SI would be caused by membrane damage, an increase in membrane damage between sampling times of 0 min and 2 h would be expected in Figure 3. The absence of this increase would mean that the increase of SI in the control was caused by metabolic damage. However, due to the membrane damage in the dead cells, this increase might not have been detectable by this experimental method.
Similar to the cells in the control, the cell membranes in pure GSE were also damaged at the start of the experiment due to the dead cells originating from the preculture. However, the statistical analysis indicates that a clear increase in membrane damage occurred after 15 min, remaining approximately constant until a treatment time of 2 h. No samples were taken of cells in GSE at 12, 18, and 24 h, but the challenge tests (as seen in Figure 1C) demonstrated that the cells did not recover from their damage in pure GSE, since no viable cells were observed after 3 h in GSE. Therefore, it can be concluded that GSE causes a significant amount of membrane damage to L. monocytogenes. The membrane damage caused to microorganisms by GSE is described extensively in literature, since the phenolic compounds in GSE are reported to be detrimental for the membrane stability of bacteria as they interact with bacterial cell walls in three different ways: (i) physical disruption of the membrane, (ii) dissipation of the proton motive force, and (iii) inhibition of membrane-associated enzyme activity [9]. In Figure 2, it is demonstrated that SI in pure GSE already reached a level of approximately 100% after 1 min, while Figure 3 illustrates that the maximum amount of membrane damage only occurred after 15 min. Since the amount of membrane damage of cells in GSE remained constant during the first 10 min, the rapid increase of SI in the first minute was most likely caused by damage of a metabolic nature. In future studies, evaluation of this metabolic damage could be accomplished by a combination of nuclear magnetic resonance spectroscopy and gas chromatography-coupled mass spectrometry, using principle component analysis to distinguish between the metabolite profiles of treated and untreated bacteria [47].
A different behavior was observed for pure GE. There was an initial presence of dead cells with damaged membranes in GE and the statistical analysis indicates that this membrane damage remained approximately constant over time. This observation suggests that GE does not induce membrane damage to L. monocytogenes. In this regard, there have also been no previous reported cases of membrane damage induced to microorganisms by GE. Allicin, which is the main antimicrobial compound in GE, has not been reported to cause membrane leakage, fusion, or aggregation [10]. The antimicrobial effect of allicin is caused by the chemical reaction of allicin with the thiol groups of several enzymes inside the bacterial cells. As a consequence, allicin delays and inhibits DNA, RNA and protein synthesis [10,48]. Therefore, it can be concluded that the SI caused by pure GE, demonstrated in Figure 2, was of a metabolic nature.

4. Conclusions

Natural plant extracts such as GSE and GE are commonly used in novel food preservation techniques against L. monocytogenes. It was demonstrated that both extracts induce a significant amount of SI to the bacterial cells, especially at relatively high extract concentrations. PI staining indicated that this SI was mostly due to membrane damage caused by the phenolic compounds present in GSE. However, some SI was also caused by damage of a metabolic nature, which should be characterized further in future studies. Researchers should take this into account when developing novel antilisterial applications that involve natural plant extracts, since limitations in food diagnostics due to SI are well known and might lead to an overestimation of the efficacy of certain techniques. Consequently, future studies investigating novel food preservation methods involving natural plant extracts would benefit from the inclusion of a cell resuscitation step. Furthermore, unravelling the SI causing mechanisms of natural plant extracts might also help in identifying more novel hurdle approaches for food preservation.

Author Contributions

Individual contributions of each of the authors to the research are the following: conceptualization, D.V., M.B., and J.F.M.V.I.; methodology, D.V.; software, D.V.; validation, D.V.; formal analysis, D.V.; investigation, D.V.; resources, J.F.M.V.I.; data curation, D.V.; writing—original draft preparation, D.V.; writing—review and editing, D.V., M.B. and J.F.M.V.I.; visualization, D.V.; supervision, D.V., M.B., and J.F.M.V.I.; project administration, D.V.; funding acquisition, J.F.M.V.I.

Funding

This research was funded by FWO Vlaanderen (grant G.0863.18) and the KU Leuven Research Fund (Center of Excellence OPTEC-Optimization in Engineering and project C24/18/046). Author Maria Baka was funded by the Post-Doctoral Mandate by the research council of KU Leuven for post-doctoral researchers (grant PDM/16/125).

Conflicts of Interest

The authors declare no conflict of interest.

References

  1. Brashears, M.M.; Amezquita, A.; Stratton, J. Validation of methods used to recover Escherichia coli O157: H7 and Salmonella spp. subjected to stress conditions. J. Food Prot. 2001, 64, 1466–1471. [Google Scholar] [CrossRef] [PubMed]
  2. Noriega, E.; Velliou, E.G.; Van Derlinden, E.; Mertens, L.; Van Impe, J. Effect of cell immobilization on heat-induced sublethal injury of Escherichia coli, Salmonella Typhimurium and Listeria innocua. Food Microbiol. 2013, 36, 355–364. [Google Scholar] [CrossRef] [PubMed]
  3. Hurst, A. Bacterial injury: A review. Can. J. Microbiol. 1977, 23, 935–944. [Google Scholar] [CrossRef] [PubMed]
  4. Devlieghere, F.; Vermeiren, L.; Debevere, J. New preservation technologies: Possibilities and limitations. Int. Dairy J. 2004, 14, 273–285. [Google Scholar] [CrossRef]
  5. Hintz, T.; Matthews, K.K.; Di, R. The use of plant antimicrobial compounds for food preservation. BioMed. Res. Int. 2015, 2015, 246264. [Google Scholar] [CrossRef] [PubMed]
  6. Negi, P.S. Plant extracts for the control of bacterial growth: Efficacy, stability and safety issues for food application. Int. J. Food Microbiol. 2012, 156, 7–17. [Google Scholar] [CrossRef] [PubMed]
  7. Belguith, H.; Kthiri, F.; Chati, A.; Sofah, A.A.; Hamida, J.B.; Landoulsi, A. Study of the effect of aqueous garlic extract (Allium sativum) on some Salmonella serovars isolates. Emir. J. Food Agric. 2010, 22, 189–206. [Google Scholar] [CrossRef]
  8. Silván, J.M.; Mingo, E.; Hidalgo, M.; de Pascual-Teresa, S.; Carrascosa, A.V.; Martinez-Rodriguez, A.J. Antibacterial activity of a grape seed extract and its fractions against Campylobacter spp. Food Control. 2013, 29, 25–31. [Google Scholar] [CrossRef]
  9. Perumalla, A.V.S.; Hettiarachchy, N.S. Green tea and grape seed extracts—Potential applications in food safety and quality. Food Res. Int. 2011, 44, 827–839. [Google Scholar] [CrossRef]
  10. Miron, T.; Rabinkov, A.; Mirelman, D.; Wilchek, M.; Weiner, I. The mode of action of allicin: Its ready permeability through phospholipid membranes may contribute to its biological activity. Biochim. Biophys. Acta Biomembr. 2000, 1463, 20–30. [Google Scholar] [CrossRef]
  11. Baka, M.; Noriega, E.; Tsakali, E.; Van Impe, J.F. Influence of composition and processing of Frankfurter sausages on the growth dynamics of Listeria monocytogenes under vacuum. Food Res. Int. 2015, 70, 94–100. [Google Scholar] [CrossRef]
  12. EFSA and ECDC (European Food Safety Authority and European Centre for Disease Prevention and Control). The European Union summary report on trends and sources of zoonoses, zoonotic agents and food-borne outbreaks in 2017. EFSA J. 2018, 16, 5500. [Google Scholar] [CrossRef]
  13. Jones, D. Foodborne listeriosis. Lancet 1990, 336, 1171–1174. [Google Scholar] [CrossRef]
  14. Gadang, V.P.; Hettiarachchy, N.S.; Johnson, M.G.; Owens, C. Evaluation of antibacterial activity of whey protein isolate coating incorporated with nisin, grape seed extract, malic acid, and EDTA on a turkey frankfurter system. J. Food Sci. 2008, 73, 389–394. [Google Scholar] [CrossRef] [PubMed]
  15. Kakaei, S.; Shahbazi, Y. Effect of chitosan-gelatin film incorporated with ethanolic red grape seed extract and Ziziphora clinopodioides essential oil on survival of Listeria monocytogenes and chemical, microbial and sensory properties of minced trout fillet. Food Sci. Technol. 2016, 72, 432–438. [Google Scholar] [CrossRef]
  16. Moradi, M.; Tajik, H.; Rohani, S.M.R.; Oromiehie, A.R. Effectiveness of Zataria multiflora Boiss essential oil and grape seed extract impregnated chitosan film on ready-to-eat mortadella-type sausages during refrigerated storage. J. Sci. Food Agric. 2011, 91, 2850–2857. [Google Scholar] [CrossRef] [PubMed]
  17. Theivendran, S.; Hettiarachchy, N.S.; Johnson, M.G. Inhibition of Listeria monocytogenes by nisin combined with grape seed extract or green tea extract in soy protein film coated on turkey frankfurters. J. Food Sci. 2006, 71, 39–44. [Google Scholar] [CrossRef]
  18. Perumalla, A.V.S.; Hettiarachchy, N.S.; Over, K.; Ricke, S.C.; Slavik, M.F.; Gbur, E.; Davis, B.; Acosta, S. Effect of partial replacement of potassium lactate and sodium diacetate by natural green tea and grape seed extracts and postpackaging thermal treatment on the growth of Listeria monocytogenes in hotdog model system. Int. J. Food Sci. Technol. 2013, 48, 918–926. [Google Scholar] [CrossRef]
  19. Tajik, H.; Aminzare, M.; Raad, T.M.; Hashemi, M.; Azar, H.H.; Raeisi, M.; Naghili, H. Effect of Zataria Multiflora Boiss essential oil and grape seed extract on the shelf life of raw buffalo patty and fate of inoculated Listeria monocytogenes. J. Food Process Preserv. 2015, 39, 3005–3013. [Google Scholar] [CrossRef]
  20. Pinilla, C.M.B.; Noreña, C.P.Z.; Brandelli, A. Antimicrobial activity of nanoliposomes co-encapsulating nisin and garlic extract against Gram-positive and Gram-negative bacteria in milk. Innov. Food Sci. Emerg. Technol. 2016, 36, 287–293. [Google Scholar] [CrossRef]
  21. Pinilla, C.M.B.; Brandelli, A. Development and characterization of phosphatidylcholine nanovesicles, containing garlic extract, with antilisterial activity in milk. Food Chem. 2017, 220, 470–476. [Google Scholar] [CrossRef] [PubMed]
  22. Gomes, C.; Moreira, R.G.; Castell-Perez, E. Microencapsulated antimicrobial compounds as a means to enhance electron beam irradiation treatment for inactivation of pathogens on fresh spinach leaves. J. Food Sci. 2011, 76, 479–488. [Google Scholar] [CrossRef] [PubMed]
  23. Prasad, K.; Laxdal, V.A.; Yu, M.; Raney, B.L. Antioxidant activity of allicin, an active principle in garlic. Mol. Cell. Biochem. 1995, 148, 183–189. [Google Scholar] [CrossRef] [PubMed]
  24. Herigstad, B.; Hamilton, M.; Heersink, J. How to optimize the drop plate method for enumerating bacteria. J. Microbiol. Methods 2001, 44, 121–129. [Google Scholar] [CrossRef]
  25. Baranyi, J.; Roberts, T.A. A dynamic approach to predicting bacterial growth in food. Int. J. Food Microbiol. 1994, 23, 277–294. [Google Scholar] [CrossRef]
  26. Geeraerd, A.H.; Herremans, C.H.; Van Impe, J.F. Structural model requirements to describe microbial inactivation during a mild heat treatment. Int. J. Food Microbiol. 2000, 59, 185–209. [Google Scholar] [CrossRef]
  27. Busch, S.V.; Donnelly, C.W. Development of a repair-enrichment broth for resuscitation of heat-injured Listeria monocytogenes and Listeria innocua. Appl. Environ. Microbiol. 1992, 58, 14–20. [Google Scholar]
  28. Miller, F.A.; Brandão, T.R.S.; Teixeira, P.; Silva, C.L.M. Recovery of heat-injured Listeria innocua. Int. J. Food Microbiol. 2006, 112, 261–265. [Google Scholar] [CrossRef]
  29. Coder, D.M. Current Protocols in Cytometry; John Wiley & Sons Inc.: Hoboken, NJ, USA, 1997; pp. 9.2.1–9.2.14. [Google Scholar]
  30. Anastasiadi, M.; Chorianopoulos, N.G.; Nychas, G.J.E.; Haroutounian, S.A. Antilisterial activities of polyphenolic-rich extracts of grapes and vinification byproducts. J. Agric. Food Chem. 2009, 57, 457–463. [Google Scholar] [CrossRef]
  31. Baydar, N.G.; Sagdic, O.; Ozkan, G.; Cetin, S. Determination of antibacterial effects and total phenolic contents of grape (Vitis vinifera L.) seed extracts. Int. J. Food Sci. Technol. 2006, 41, 799–804. [Google Scholar] [CrossRef]
  32. Yigit, D.; Yigit, N.; Mavi, A.; Yildirim, A.; Güleryüz, M. Antioxidant and antimicrobial activities of methanol and water extracts of fruits, leaves and seeds of Vitis vinifera L. cv. Karaerik. Asian J. Chem. 2009, 21, 183–194. [Google Scholar]
  33. Bakri, I.M.; Douglas, C.W.I. Inhibitory effect of garlic extract on oral bacteria. Arch. Oral Biol. 2005, 50, 645–651. [Google Scholar] [CrossRef]
  34. Ankri, S.; Mirelman, D. Antimicrobial properties of allicin from garlic. Microbes Infect. 1999, 2, 125–129. [Google Scholar] [CrossRef]
  35. Rohani, S.M.R.; Moradi, M.; Mehdizadeh, T.; Saei-Dehkordi, S.S.; Griffiths, M.W. The effect of nisin and garlic (Allium sativum L.) essential oil separately and in combination on the growth of Listeria monocytogenes. Food Sci. Technol. 2011, 44, 2260–2265. [Google Scholar] [CrossRef]
  36. Perni, S.; Chalise, P.R.; Shama, G.; Kong, M.G. Bacterial cells exposed to nanosecond pulsed electric fields show lethal and sublethal effects. Int. J. Food Microbiol. 2007, 120, 311–314. [Google Scholar] [CrossRef] [PubMed]
  37. Bisha, B.; Weinsetel, N.; Brehm-Stecher, B.F.; Mendonca, A. Antilisterial effects of gravinol-S grape seed extract at low levels in aqueous media and its potential application as a produce wash. J. Food Prot. 2010, 73, 266–273. [Google Scholar] [CrossRef] [PubMed]
  38. Amin, M.; Kapadnis, B.P. Heat stable antimicrobial activity of Allium ascalonicum against bacteria and fungi. Indian. J. Exp. Biol. 2005, 43, 751–754. [Google Scholar] [PubMed]
  39. Hsieh, Y.-H.; Yan, M.; Liu, J.-G.; Hwang, J.C. The synergistic effect of nisin and garlic shoot juice against Listeria spp. in soymilk. J. Taiwan Inst. Chem. Eng. 2011, 42, 576–579. [Google Scholar] [CrossRef]
  40. Kim, E.L.; Choi, N.H.; Bajpai, V.K.; Kang, S.C. Synergistic effect of nisin and garlic shoot juice against Listeria monocytogenes in milk. Food Chem. 2008, 110, 375–382. [Google Scholar] [CrossRef]
  41. Leuschner, R.G.K.; Ielsch, V. Antimicrobial effects of garlic, clove and red hot chilli on Listeria monocytogenes in broth model systems and soft cheese. Int. J. Food Sci. Nutr. 2003, 54, 127–133. [Google Scholar] [CrossRef]
  42. Singh, B.; Falahee, M.B.; Adams, M.R. Synergistic inhibition of Listeria monocytogenes by nisin and garlic extract. Food Microbiol. 2001, 18, 133–139. [Google Scholar] [CrossRef]
  43. Wu, V.C.H. A review of microbial injury and recovery methods in food. Food Microbiol. 2008, 25, 735–744. [Google Scholar] [CrossRef] [PubMed]
  44. Ferreira, C.; Pereira, A.M.; Pereira, M.C.; Melo, L.F.; Simões, M. Physiological changes induced by the quaternary ammonium compound benzyldimethyldodecylammonium chloride on Pseudomonas fluorescens. J. Antimicrob. Chemother. 2011, 66, 1036–1043. [Google Scholar] [CrossRef] [PubMed]
  45. Lobete, M.M.; Noriega, E.; Batalha, M.A.; De Beurme, S.; Van de Voorde, I.; Van Impe, J.F. Effect of tagatose on growth dynamics of Salmonella Typhimurium and Listeria monocytogenes in media with different levels of structural complexity and in UHT skimmed milk. Food Control. 2017, 73, 31–42. [Google Scholar] [CrossRef]
  46. Yang, Y.; Xu, F.; Xu, H.; Zoraida, P.A.; Niu, R.; Yuan, Y.; Sun, J.; You, X.; Lai, W.; Xiong, Y.; et al. Magnetic nano-beads based separation combined with propidiummonoazide treatment and multiplex PCR assay for simultaneous detection of viable Salmonella Typhimurium, Escherichia coli O157: H7 and Listeria monocytogenes in food products. Food Microbiol. 2013, 34, 418–424. [Google Scholar] [CrossRef] [PubMed]
  47. Drazic, A.; Kutzner, E.; Winter, J.; Eisenreich, W. Metabolic response of Escherichia coli upon treatment with Hypchlorite at sub-lethal concentrations. PLoS ONE 2015, 10, e0125823. [Google Scholar] [CrossRef] [PubMed]
  48. Feldberg, R.; Chang, S. In vitro mechanism of inhibition of bacterial cell growth by allicin. Antimicrob. Agents Chemother. 1988, 32, 1763–1768. [Google Scholar] [CrossRef] [PubMed] [Green Version]
Figure 1. Effect of bioactive extracts and their concentration on Listeria monocytogenes kinetics as indicated for cells in the control (A), GSE-MIC (B), pure GSE (C), GE-MIC (D), and pure GE (E). Symbols correspond to the experimental data, both for the nonselective (x) and the selective medium (). Counts on the nonselective medium represent the total viable population of healthy and injured cells, while counts on the selective medium represent the viable population of healthy cells. Lines correspond to the global fit of the Baranyi and Roberts [25] model for growth [ln(CFU/mL)] or the Geeraerd et al. [26] model for inactivation [log(CFU/mL)], both for the nonselective (-) and the selective medium (--). Nondetectable cell counts are indicated as ND.
Applsci 09 02731 g001
Figure 2. Sublethal injury (SI) of Listeria monocytogenes for different bioactive extracts and their concentration as indicated for the control, GSE-MIC, pure GSE, GE-MIC, and pure GE. Since SI for Pure GSE could only be calculated up until a treatment time of 5 min, SI is represented over a period of 24 h (A) and 5 min (B). SI was calculated using Equation (9) with the modeled values from Figure 1 as input.
Applsci 09 02731 g002
Figure 3. Permeability of Listeria monocytogenes to PI after exposure to the control, pure GSE and pure GE. For GSE, samples are taken after 0 min, 5 min, 10 min, 15 min, 30 min, 1 h, and 2 h. For GE, samples are taken after 0, 12, 18, and 24 h. For the control, samples are taken at all aforementioned time points. Results are expressed as Fluorescence/OD ± standard deviation (n = 6). For the same medium (control, GSE, or GE), bars bearing different uppercase letters are significantly different (p ≤ 0.05). For the same exposure time, bars bearing different lowercase letters are significantly different (p ≤ 0.05).
Applsci 09 02731 g003
Table 1. Growth parameters (i.e., the lag phase λ, the maximum specific growth rate µmax, and the maximum cell density Nmax) according to the model of Baranyi and Roberts [25] for challenge tests of L. monocytogenes. For the different growth conditions (i.e., control, GSE-MIC, or GE-MIC) on one specific plating medium (i.e., TSAYE or Oxford), values bearing different uppercase letters are significantly different (p ≤ 0.05). For the different plating media at one specific growth condition, values bearing different lowercase letters are significantly different (p ≤ 0.05).
Growth ParameterControlGSE-MICGE-MIC
TSAYEOxfordTSAYEOxfordTSAYEOxford
λ [h]1.7 ± 0.21.7 ± 0.22.5 ± 0.33.2 ± 0.212.3 ± 0.413.1 ± 0.5
A,aA,aB,aB,bC,aC,a
µmax [1/h]1.46 ± 0.091.40 ± 0.081.04 ± 0.100.959 ± 0.0650.725 ± 0.0680.907 ± 0.122
C,aB,aB,aA,aA,aA,a
Nmax [(CFU/mL)]21.6 ± 0.021.6 ± 0.021.2 ± 0.121.2 ± 0.121.3 ± 0.221.6 ± 0.3
B,aB,aA,aA,aA,aAB,a
Table 2. Inactivation parameters (i.e., the shoulder length SL, the maximum specific inactivation rate kmax, and the residual cell population Nres) according to the model of Geeraerd et al. [26] for challenge tests of L. monocytogenes. For the different inactivation conditions (i.e., pure GSE and pure GE) on one specific plating medium (i.e., TSAYE or Oxford), values bearing different uppercase letters are significantly different (p ≤ 0.05). For the different plating media at one specific inactivation condition, values bearing different lowercase letters are significantly different (p ≤ 0.05).
Inactivation ParameterPure GSEPure GE
TSAYEOxfordTSAYEOxford
SL [h]0.0 ± 0.10 ± 0.011.4 ± 0.75.2 ± 1.7
A,aA,aB,bB,a
kmax [1/h]11.4 ± 2.8698 ± 2470.420 ± 0.0550.341 ± 0.061
B,aB,bA,aA,a
Nres [log(CFU/mL)]2.7 ± 0.22.2 ± 0.35.7 ± 0.15.2 ± 0.2
A,aA,aB,bB,a
Table 3. Time-average Injured Cells Coefficient (TICC) of L. monocytogenes, according to Equation (10), for challenge tests in the control (TSBYE), GSE-MIC, GE-MIC, pure GSE, and pure GE.
Treatment ConditionTICC [–]
Control7.8
GSE-MIC15.1
GE-MIC5.4
Pure GSE98.3
Pure GE59.3

