Analysis of Basic Failure Scenarios of a Truss Tower in a Probabilistic Approach


Faculty of Civil Engineering and Architecture, Kielce University of Technology, 25-314 Kielce, Poland
*
Author to whom correspondence should be addressed.
Appl. Sci. 2019, 9(13), 2662; https://doi.org/10.3390/app9132662
Submission received: 4 June 2019
/
Revised: 22 June 2019
/
Accepted: 25 June 2019
/
Published: 29 June 2019
(This article belongs to the Special Issue Short-Term Forecasting in Civil Engineering with Multidisciplinary Approaches: Combined Numerical, Experimental and Statistical Methods)
Abstract
:Featured Application
Failures and collapses of steel truss towers may be caused by various factors, which often occur simultaneously. The evaluation of truss tower reliability when single elements fail constitutes an important research area. It may happen that the failure of a single element of the structure leads to a redistribution of internal forces that results in the exceedance of the capacity of subsequent bars. This brings about the occurrence of a mechanism, i.e., the structure failure. In this paper, the impact of the failure of individual elements on the overall reliability of the tower is analyzed. The literature lacks research using a system approach to complex truss structures. This article describes the original procedure for assessing the reliability of truss towers after the failure of a single element. This method can be used to assess the safety of truss towers with damaged elements.
Abstract
This paper concerns the system reliability analysis of steel truss towers. Due to failures of towers, the assessment of their reliability seems to be a very important problem. In the analysis, two cases are examined: when the buckling coefficient is a deterministic value and when it is a random variable. The impact of failures of single elements on the structure reliability was investigated. Calculations of the standard deviation of the capacity and reliability indexes were made using author-developed programs in the Mathematica environment.
1. Introduction
Truss towers are multi-element, self-supporting structures, rigidly fixed to the base. Due to many factors such as large height, relatively low material consumption, and simple erection process, steel truss towers are the most obvious choice for a tower structure. With respect to their use, a number of types can be identified [1], namely, antenna towers, architectural towers, transmission towers, chimney towers, light towers, viewing towers, or water towers.
The experience shows steel truss tower failures may be attributed to different reasons. Such issues were explored in many studies [2,3,4,5]. The truss performance in a potentially dangerous condition may result in the structural collapse of the whole tower. Examples of failures of truss towers were discussed in study [6]. Failures and collapses of steel truss towers may be caused by various factors, which often occur simultaneously. The most common causes are related to errors in design, such as inappropriate determination of external loads or wrong loading diagram of the structure. Flaws in erection include, among others, faulty workmanship of connections, the weakening of individual bars, attachment of additional gear (unaccounted for in the design). A common cause of failures of towers with main legs made from closed sections is water freezing in them, which leads to the bursting of sections. In such cases, the indirect cause lies in careless workmanship of welded connections, which allows water penetration into the section. Another cause of failure may be the action of abnormal wind or snow loads, or both loads combined. Because of a large range of load variation, the design assumptions sometimes do not account for abnormal natural phenomena like vehement storms, whirlwinds, or hurricanes. Another important failure-contributing factor is the corrosion of steel sections and connections, which leads to their reduced capacity. The action of corrosion depends, to a large extent, on the provision of adequate anticorrosion protection and the severity of the corrosion environment. Other factors that can lead to the failure of truss towers include non-uniform settlement of the ground underneath main leg foundations, mining-induced damages, failures of connections, and vehicles crashing into the structure.
Taking into account the threats mentioned above, it is clear that computer simulations of truss towers deformations and failures represent a relevant research focus [7,8,9,10]. Full-scale investigations provide equally important findings [8,9]. An important issue is also proper condition evaluation of existing truss structures [5,11], which aims at the identification of a potentially dangerous state. In case a failure of the structure element that might result in the collapse is found, it is necessary to design proper strengthening of the structure to ensure its safe performance [2,4]. The subject of failure scenarios includes work on progressive failure, in which local failure of a structural component can cause failure of the whole structure [12,13].
The reliability analysis of truss structures has been investigated in many studies, e.g., in [14,15,16,17], where various methods of estimating the reliability index have been proposed. The evaluation of truss tower reliability when individual single elements fail also constitutes an important research area. In study [18], the author emphasises the need for investigations into the failure of statically indeterminate structures. It may happen that a failure of a single element of the structure leads to a redistribution of internal forces that results in the exceedance of the capacity of subsequent bars, bringing about the occurrence of a mechanism, i.e., the structure failure. In this paper, the impact of the failure of individual elements on the overall reliability of the tower is analyzed.
2. Materials and Methods
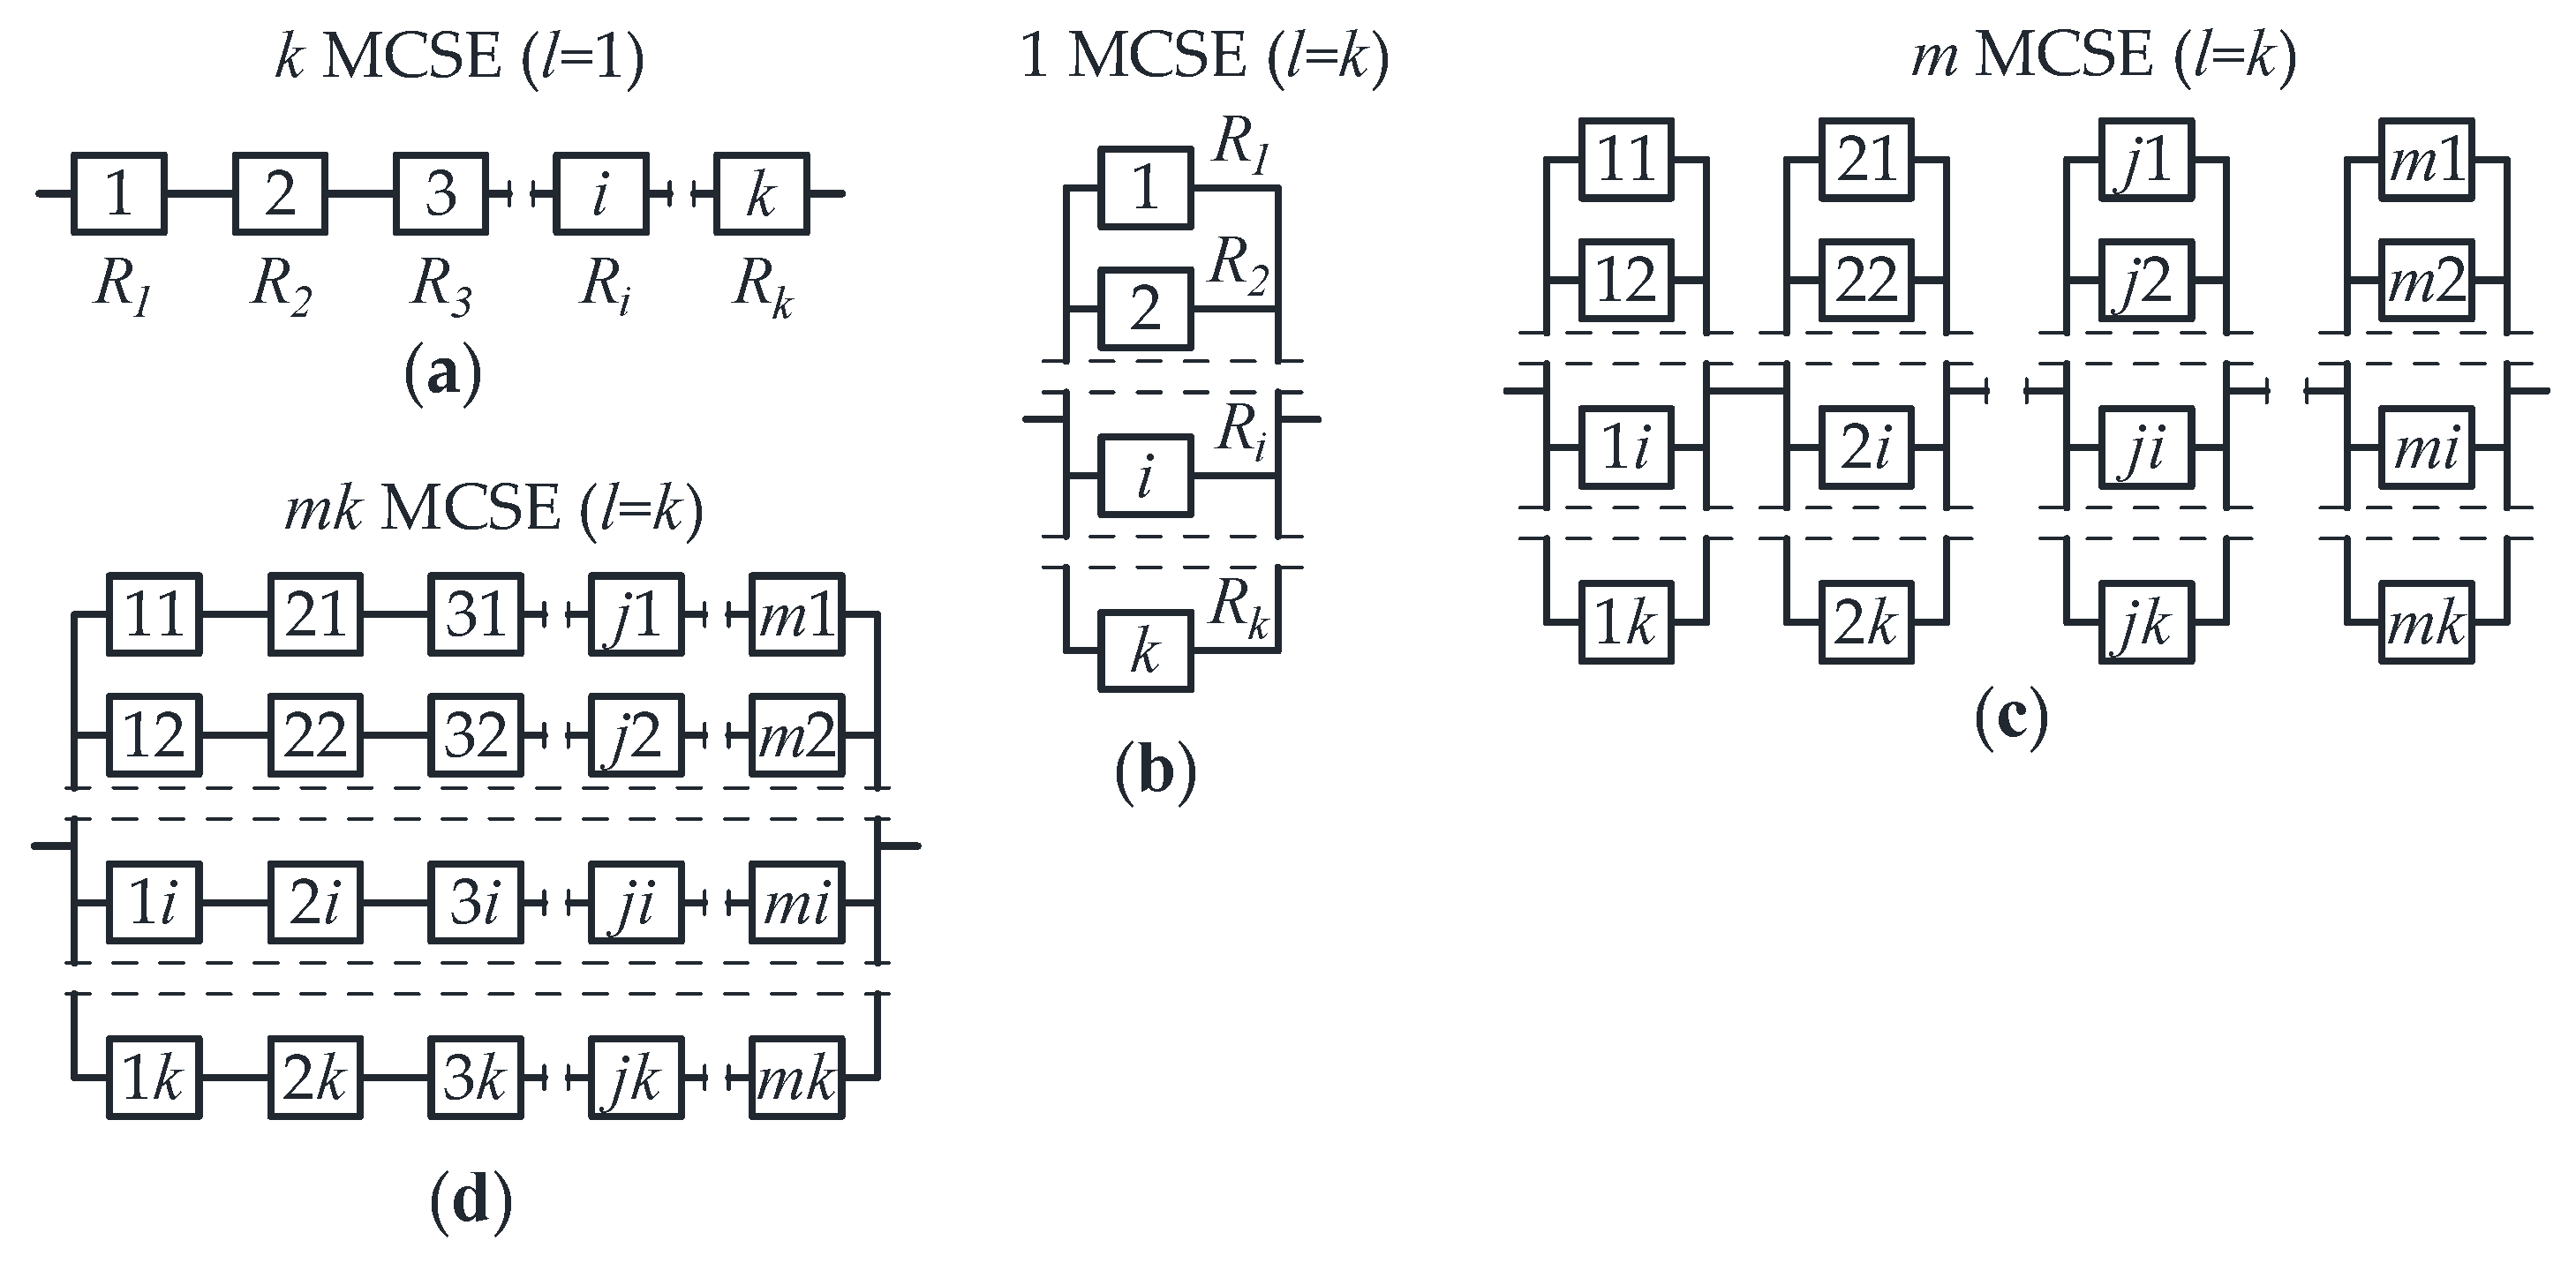
There are many methods to assess the reliability of a structure. In the paper, the system approach is used for reliability analysis. In this case, structural characteristics of the truss structure are taken into account, i.e., interaction of the structural elements in the load-carrying system [19,20,21,22,23,24]. In the reliability theory, there are three models: serial, parallel, and mixed (parallel-serial and serial-parallel) systems. To identify the reliability model, the kinematically admissible failure mechanisms (KAFMs) should be specified. Each KAFM contains the minimal critical sets of elements (MCSE), which have a particular number of tshe causative elements (l).
The serial system consists of k minimal critical sets of elements (k MCSE), each of which has one causative element (l = 1). The serial system (Figure 1a) is operable if all elements are operable. Reliability R of the serial system is calculated from the formula
where Ri—reliability of a single element and k—number of the system elements.
In the case of a parallel system, there is one minimal critical set of elements (1 MCSE) and it consists of k causative elements (l = k). The parallel system (Figure 1b) is operable if at least one element is operable. Reliability R of the parallel system is calculated from the formula
For more complex truss structures forming mixed systems, the reliability is evaluated by assuming actual connections and interactions between the elements. To identify the reliability model, it is necessary to analyze how the elements are coupled, i.e., what relations hold between them. Mixed systems consist of parallel-serial and serial-parallel arrangements.
The parallel-serial system (Figure 1c) consists of m MCSEs, each of which includes k causative elements (l = k). Reliability R of the parallel-serial system is calculated from the formula
For the last serial-parallel system (Figure 1d), the number of MCSEs is m⸱k and each MCSE consists of k causative elements (l = k). Reliability R of the serial-parallel system is calculated from the formula
To carry out the spectral analysis of the linear stiffness matrix (identify the reliability model) and to calculate the reliability index, the program developed by the authors in the Mathematica environment was applied.
To determine the reliability of the system, it is necessary to calculate the reliability of a single element. The procedure that leads to the determination of the reliability of a single element Ri was presented, for example, in [21,22]. The first step is to determine the effect of action Ei, and capacity Ni. The next step is to determine the safety margin Zi. It is a difference between the effect of action Ei and capacity Ni. To compute reliability of the single element, it is necessary to determine expected value and standard deviation of the safety margin. A subsequent step is computing the reliability index for a single element and probability of the element failure , where Φ is the Laplace function. Finally, the reliability of a single element is estimated from the formula . To compute the reliability of the system R, it is necessary to identify the reliability model. After that, the probability of failure of whole structure and reliability index of whole structure are computed.
In this paper, the algorithm described above was used to assess the reliability of a steel truss tower. The influence of randomness is taken into account in the capacity and the effect of actions. As in publication [22], both values have a normal distribution. The coefficient of variation for the effect of actions is equal to 6%. In this paper, two cases of load capacity description are considered. In the first case, coefficient of variation for the capacity is equal to 10%. In the second case, it was taken into account that the capacity is a function of several random variables (area of cross section, yield strength, modulus of elasticity, minimum moment of inertia, and length of element). Each random variable describing the capacity of an element may have a different value of the coefficient of variation. This causes difficulties in calculating the standard deviation of the capacity, which can be solved using the following approximation [25,26]:
where f—is the function of uncorrelated variables, Xi—single random variable, and m—number of variables.
The values of variation coefficients from Table 1 were used in the calculation of the standard deviation of the buckling coefficient and capacity. Values of coefficients of variation are defined on the basis of the following papers [27,28]. Calculations of these values for each types of elements (compression and tension) were carried out in the Mathematica program.
3. Results
The article presents an analysis of the reliability truss tower with the number of repeating sections lm = 6 and topology shown in Figure 2. Towers are designed from S235 steel with the yield strength fy = 235 MPa. The structure is designed according to the standards [29,30,31]. The reliability index is calculated according to the assumption of parallel-serial connections. This assumption is more appropriate than the assumption of serial connections. It is due to taking into account the real performance of the structure. The study investigated the effect of removing each individual element on the reliability structure. The first step, however, involved the assessment of the reliability of the structure in its original state and number of elements being le. This analysis includes the following:
- Input data (static scheme, load on the structure for the dominant combination, and capacity Ni of individual elements)—shown in Figure 2;
- Spectral analysis of linear stiffness matrix KL (determination the number of KAFMs and MCSEs)—shown in Figure 3;
- Checking the effort of individual elements—μEi/μNi (Table 2);
- Calculation of the reliability index for elements Ri and assessment of the structure reliability.
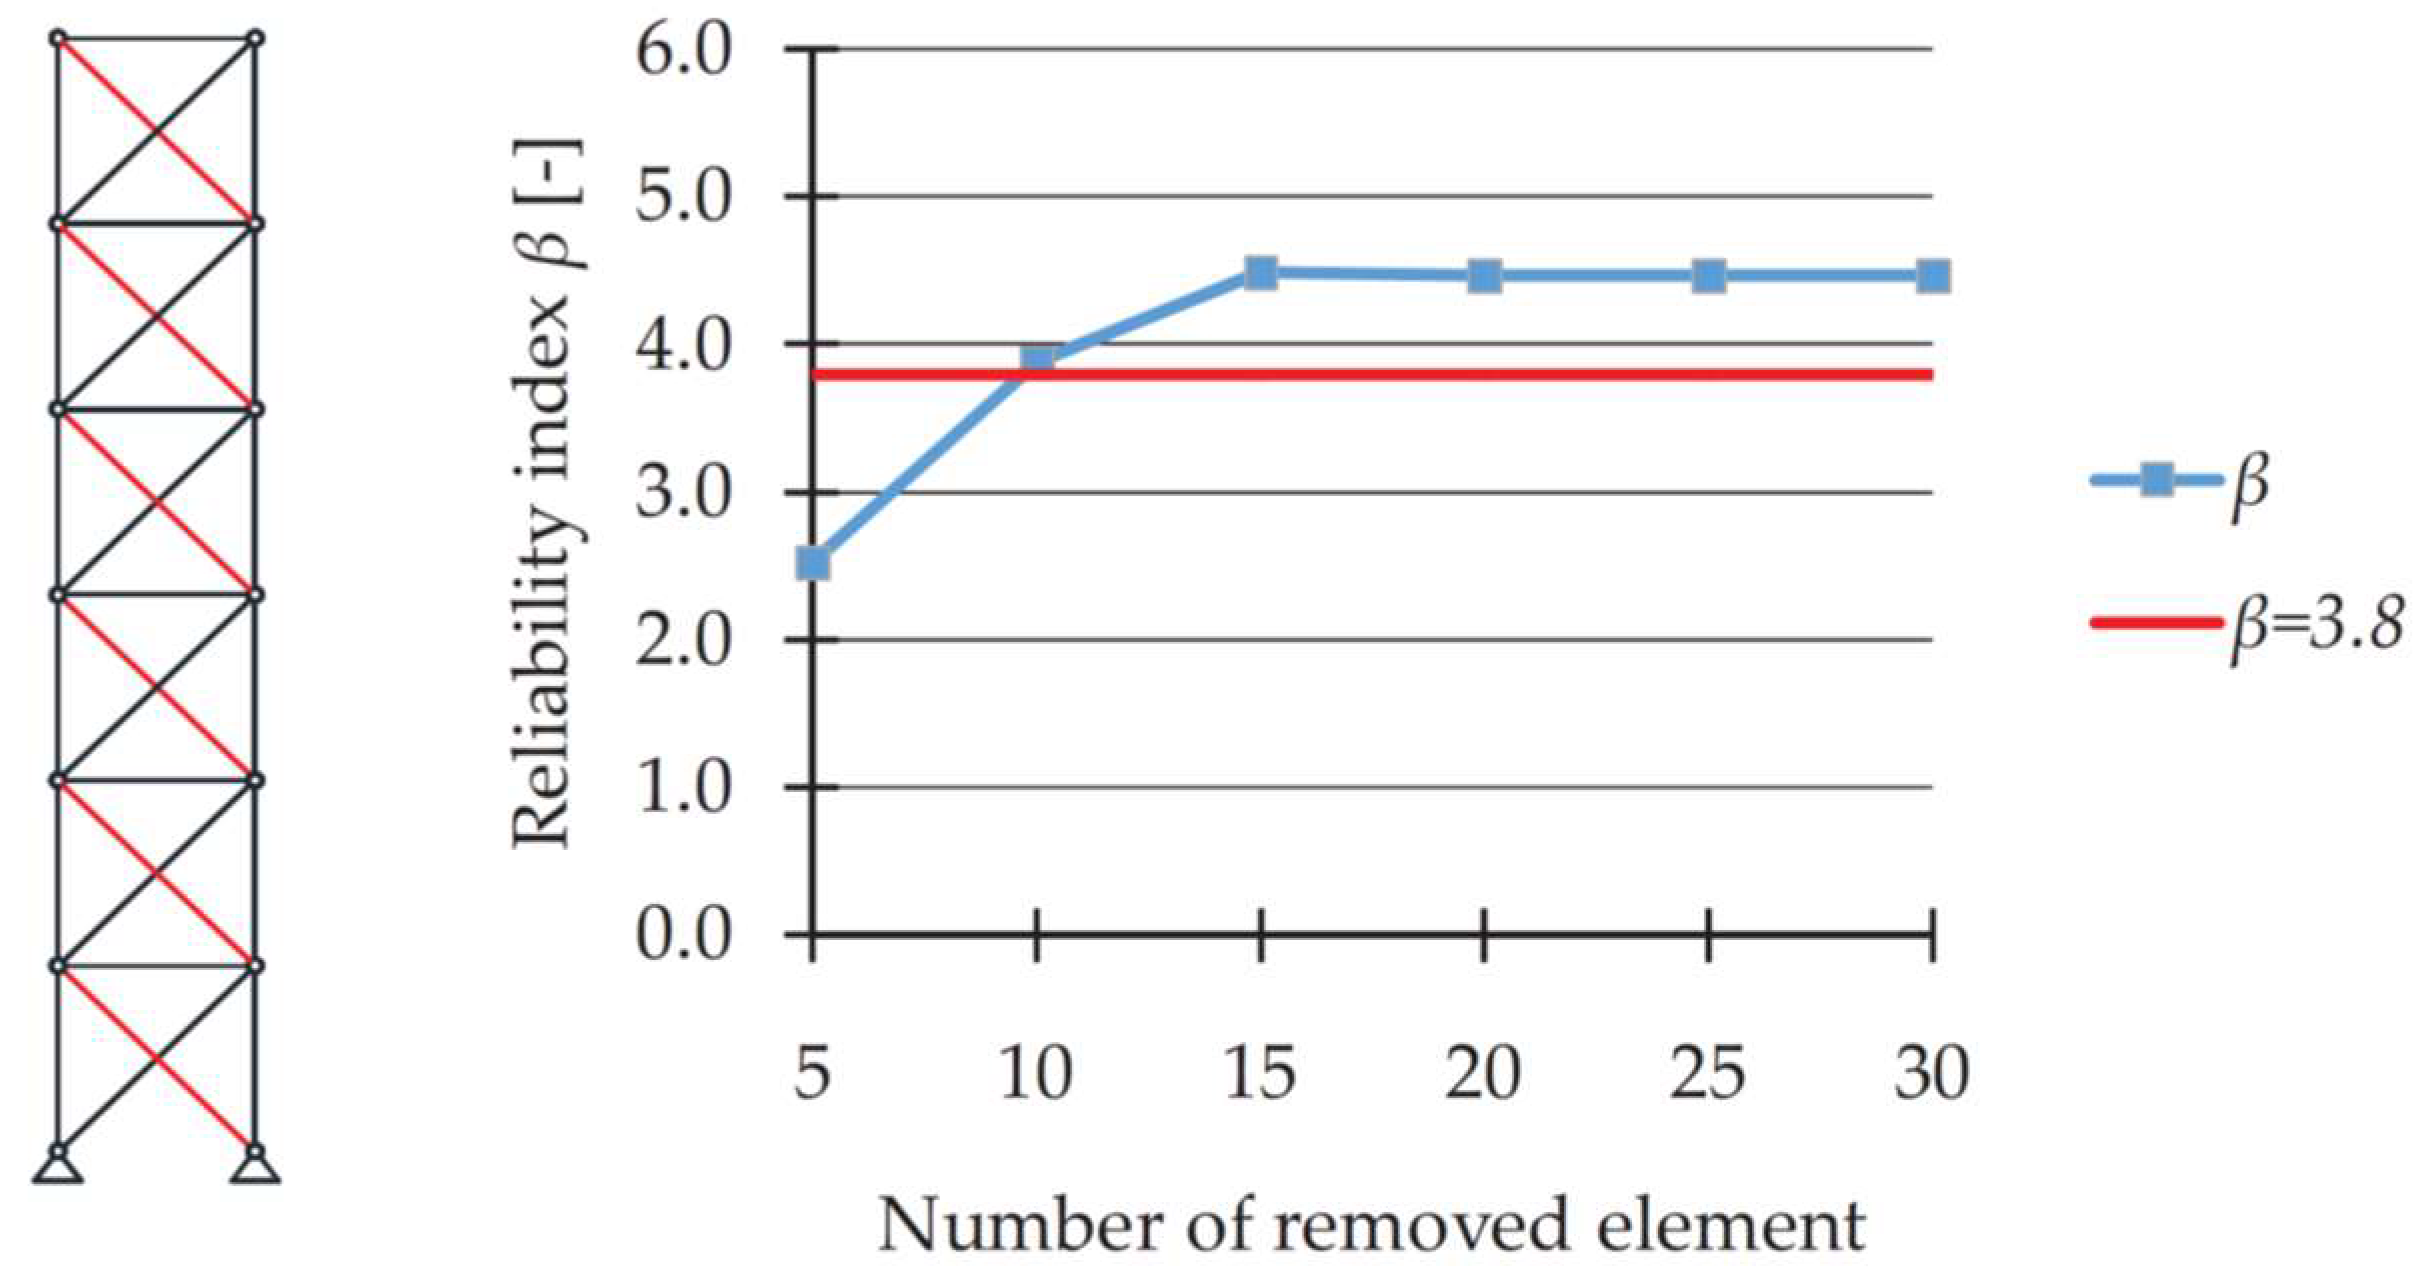
In the case when there is no failure mechanism, the reliability assessment consists in comparing the reliability index of the structure with the required value of the reliability index. The required value of the reliability index was chosen for the RC2 reliability class (50 years reference period). In accordance with the standard [29], “Three reliability classes (RC1, RC2, and RC3) may be associated with the three consequence classes CC1, CC2, and CC3”. The tower’s construction was classified as a structure with the consequence class CC2. This means that “Medium consequence for loss of human life and economic, social, or environmental consequences are considerable”. The required value for the reliability class RC2 is βEC = 3.8. The reliability index for parallel-serial system is 4.471. The structure is sufficiently safe, because the reliability index β is greater than 3.8.
The next step is to analyze the effect of removing each individual element of the truss tower. The algorithm for the reliability analysis of truss structure with number of elements le − 1 is shown together with an example of the effect of element No. 1 removal, as follows:
- Input data (new static scheme, load on the structure for the dominant combination, and capacity Ni of individual elements)—shown in Figure 4;
- Spectral analysis of linear stiffness matrix KL for new static scheme (determination of the new number of KAFMs and MCSEs);
- Determination of the effect of actions Ei for individual elements under new static scheme—μEi (Table 3);
The removal of element No.1 from the structure results in exceeding the capacity of element No. 2. However, it does not cause a failure mechanism. Therefore, it is necessary to check the reliability of the system after removing elements No. 1 and No. 2:
- Input data (new static scheme, load on individual elements Ei for the dominant combination, and load capacity of Ni individual elements)—shown in Figure 5;
- Spectral analysis of the linear stiffness matrix KL for new static scheme (determination of the number of KAFMs and MCSEs);
- Determination of the effect of actions Ei for individual elements under new static scheme—μEi (Table 4);
It turns out that the consequence of the removal of the elements No. 1 and No. 2 is exceeding the capacity in elements No. 9 and No. 10. This is the cause of the failure mechanism of the structure. The same analysis was carried out for all thirty cases when single elements were removed from the tower. The results are shown in Table 5 and Table 6.
Based on the results presented in Table 5 and Table 6, it can be concluded that the description of the buckling coefficient has a large influence on the reliability. When the buckling coefficient is treated as a probabilistic variable, the results are lower. Therefore, these results are treated as representative and compared in the form of graphs (Figure 6, Figure 7, Figure 8, Figure 9 and Figure 10). The results refer to the required value of the reliability index for the reliability class RC2 (βEC = 3.8). The graphs in Figure 6, Figure 7, Figure 8, Figure 9 and Figure 10 show the data from Table 6. For each of the figures on the left, the removed elements are underlined. Figure 6 shows the results for removed left main legs (elements no. 1, 6, 11, 16, 21, and 26). Removal of item no. 1 causes failure of the whole structure. Removal of item no. 6 causes failure of the whole structure. Removal of element number 6 causes the reliability index is insufficient (β = 1.484 < βEC = 3.8). Removal of elements no. 11, 16, 21, and 26 does not cause the reliability index to drop below the required level. The graphs on the following figures (Figure 7, Figure 8, Figure 9 and Figure 10) should be interpreted as shown in Figure 6.
4. Discussion
The aim of the paper was to analyze the reliability of the steel truss tower after the failure of individual elements. The analyses carried out for the study led to some valid conclusions.
An important issue is the impact of the description of the buckling coefficient (probabilistic or deterministic) on the results of the reliability index. The difference in the results of the reliability index β is up to approximately 37%. Coefficients of variation of random variables, on which the buckling coefficient depends, play a key role. Therefore, determining the appropriate values of variability coefficients is an important issue in future studies.
The failure of individual elements of a truss tower can bring about different effects. In the case of the analyzed tower, the removal of six individual elements leads to the failure of the whole structure. For a buckling coefficient being a probabilistic value, six cases of a single element removal result in the insufficient value of the reliability index β (below 3.8).
The analysis of the impact of removing individual elements of the truss tower makes it possible to determine elements that can be additionally strengthened due to their major significance for safety. For the analyzed case, they are all elements whose removal causes the failure of the whole structure. It should be emphasized that the results obtained cannot be treated as a reference, because the reliability analysis should be carried out individually for each structure.
Analysis of failure scenarios of truss structures is a highly time-consuming task. In order to study more complex cases, it is necessary to develop an additional program that would allow automation of calculations.
Author Contributions
Introduction was prepared by W.M. and U.R. Mathematical description was written by W.M. and U.R. Results were obtained by W.M. The analysis of the results and conclusions were written by W.M. and U.R.
Funding
This research received no external funding.
Conflicts of Interest
The authors declare no conflict of interest.
References
- Rykaluk, K. Steel Structures. Chimneys, Towers, Masts; Oficyna Wydawnicza Politechniki Wrocławskiej: Wrocław, Poland, 2005. (In Polish) [Google Scholar]
- Błaszczyński, T.; Sumigała, M.; Polus, Ł. Analysis of damage of two steel antenna towers with repair proposal. Mater. Bud. 2014, 5, 48–50. [Google Scholar]
- Paczkowska, T.; Paczkowski, W. A designer mistake as a reason for the threat of loosing the bearing capacity by a steel tower. Przegląd Bud. 2013, 12, 52–56. [Google Scholar]
- Skwarek, M.; Tomska, D.; Hulimka, J.; Kozłowski, M. Some problems with steel latticed telecommunication towers structure strengthening. In Proceedings of the 26th Conference on Structural Failures, Szczecin, Międzyzdroje, Poland, 20–24 May 2013. (In Polish). [Google Scholar]
- Skwarek, M.; Hulimka, J. Is the steel latticed tower for telecommunication threatened failure? About estimate of load capacity of latticed towers in diagnostics of constructions. In Proceedings of the 25th Conference on Structural Failures, Międzyzdroje, Poland, 24–27 May 2011. (In Polish). [Google Scholar]
- Davies, D.K. North American Tower Failures: Causes and Cures; Consolidated Engineering Inc.: Evansville, IN, USA, 2011. [Google Scholar]
- Eslamlou, S.D.; Asgarian, B. Determining critical areas of transmission towers due to sudden removal of members. Case Stud. Eng. Fail. Anal. 2017, 9, 138–147. [Google Scholar] [CrossRef] [Green Version]
- Lee, P.S.; McClure, G. Elastoplastic large deformation analysis of a lattice steel tower structure and comparison with full-scale tests. J. Constr. Steel Res. 2007, 63, 709–717. [Google Scholar] [CrossRef]
- Ramalingam, R. Failure analysis of lattice tower like structures. IOP Conf. Ser. Earth Environ. Sci. 2017, 80, 012024. [Google Scholar] [CrossRef] [Green Version]
- Rao, N.P.; Knight, G.M.S.; Mohan, S.J.; Lakshmanan, N. Studies on failure of transmission line towers in testing. Eng. Struct. 2012, 35, 55–70. [Google Scholar]
- Wichtowski, B. The rectification of steel aerial towers on the ground the periodical inspections. In Proceedings of the 23rd Conference on Structural Failures, Szczecin, Międzyzdroje, Poland, 23–26 May 2007. (In Polish). [Google Scholar]
- Papavasileiou, G.S.; Pnevmatikos, N.G. The Cost of Retrofitting Steel-Concrete Composite Buildings Against Progressive Collapse With Steel Cables. Int. J. Progress. Sci. Technol. 2017, 6, 103–115. [Google Scholar]
- Papavasileiou, G.S.; Pnevmatikos, N.G. Optimized design of steel buildings against earthquake and progressive collapse using cables. Int. J. Progress. Sci. Technol. 2017, 6, 213–220. [Google Scholar]
- Kamiński, M.; Szafran, J. On computer modelling of reliability of steel telecommunication towers. Zesz. Nauk. Bud./Politech. Łódzka 2010, 62, 51–66. [Google Scholar]
- Dudzik, A. Reliability Assessment of Steel-Aluminium Lattice Tower. IOP Conf. Ser. Mater. Sci. Eng. 2017, 245, 032072. [Google Scholar] [CrossRef] [Green Version]
- Park, S.; Choi, S.; Sikorsky, C.; Stubbs, N. Efficient method for calculation of system reliability of a complex structure. Int. J. Solids Struct. 2004, 41, 5035–5050. [Google Scholar] [CrossRef]
- Winkelmann, K.; Oziębło, M. Reliability assessment of truss towers using Monte Carlo Method, PEM and RSM. In Proceedings of the PCM-CMM-2015—3rd Polish Congress of Mechanics & 21st Computer Methods in Mechanics, Gdańsk, Poland, 8–11 September 2015. [Google Scholar]
- Kolanek, K. Reliability Analysis and Optimisation of Structures with Adaptive Simulation Methods. Ph.D. Thesis, IPPT PAN, Warsaw, Poland, 2006. (In Polish). [Google Scholar]
- Biegus, A. Probabilistic Analysis of Steel Structures; PWN: Warsaw-Wroclaw, Poland, 1977. (In Polish) [Google Scholar]
- Kłosowska, J.; Obara, P.; Turant, J. Kinematically admissible failure mechanisms for plane trusses. IOP Conf. Ser. Mater. Sci. Eng. 2017, 245, 022022. [Google Scholar] [CrossRef]
- Kubicka, K.; Radoń, U. Proposal for the assessment of steel truss reliability under fire conditions. Arch. Civ. Eng. 2015, 61, 141–154. [Google Scholar] [CrossRef]
- Mochocki, W.; Obara, P.; Radoń, U. System-reliability analysis of steel truss towers. MATEC Web Conf. 2018, 219. [Google Scholar] [CrossRef]
- Thoft-Christensen, P.; Baker, M. Structural Reliability Theory and Its Applications; Springer: Berlin/Heidelberg, Germany, 1982. [Google Scholar]
- Woliński, S.; Wróbel, K. Reliability of Building Structures; Oficyna Politechniki Rzeszowskiej: Rzeszów, Poland, 2001. (In Polish) [Google Scholar]
- Bołotin, W.W. Statistical Methods in Structural Mechanics; Holden Day: San Francisco, CA, USA, 1968. [Google Scholar]
- Kubicka, K.; Radoń, U. Influence of the buckling coefficient randomness on the reliability index value under fire conditions. Arch. Civ. Eng. 2018, 64, 173–179. [Google Scholar] [CrossRef]
- Gwóźdź, M.; Machowski, A. Selected Studies and Calculations of Building Structures with Probabilistic Methods; Wydawnictwo Politechniki Krakowskiej: Kraków, Poland, 2011. (In Polish) [Google Scholar]
- JCSS. Probabilistic Model Code; Joint Committee of Structural Safety, 2001. Available online: https://www.jcss.byg.dtu.dk (accessed on 28 June 2019).
- PN-EN 1990:2004. Eurocode: Basis of Structural Design; PKN: Warszawa, Poland, 2004.
- PN-EN 1993-1-1. Eurocode 3: Design of Steel Structures. Part 1-1: General Rules and Rules for Buildings; PKN: Warszawa, Poland, 2006.
- PN-EN 1993-3-1. Eurocode 3: Design of Steel Structures. Part 3-1: Towers, Masts and Chimneys—Towers and Masts; PKN: Warszawa, Poland, 2008.
Figure 1.
Types of reliability models: (a) serial system, (b) parallel system, (c) parallel-serial system, and (d) serial-parallel system.
Figure 1.
Types of reliability models: (a) serial system, (b) parallel system, (c) parallel-serial system, and (d) serial-parallel system.

Figure 2.
Static scheme of the studied truss tower: (a) topology and dimensions, (b) vertical load, and (c) horizontal load.
Figure 2.
Static scheme of the studied truss tower: (a) topology and dimensions, (b) vertical load, and (c) horizontal load.

Figure 3.
All of 300 kinematically admissible failure mechanisms for the studied truss tower.

Figure 4.
The new static scheme after the removal of element No. 1: (a) topology and dimensions, (b) vertical load, and (c) horizontal load.
Figure 4.
The new static scheme after the removal of element No. 1: (a) topology and dimensions, (b) vertical load, and (c) horizontal load.

Figure 5.
New static scheme after the removal of the elements No. 1 and No. 2: (a) topology and dimensions, (b) vertical load, and (c) horizontal load.
Figure 5.
New static scheme after the removal of the elements No. 1 and No. 2: (a) topology and dimensions, (b) vertical load, and (c) horizontal load.

Figure 6.
Reliability index when the buckling coefficient is a random variable for removed elements 1, 6, 11, 16, 21, and 26 (left main legs).
Figure 6.
Reliability index when the buckling coefficient is a random variable for removed elements 1, 6, 11, 16, 21, and 26 (left main legs).

Figure 7.
Reliability index when the buckling coefficient is a random variable for removed elements 2, 7, 12, 17, 22, and 27 (horizontal bracings).
Figure 7.
Reliability index when the buckling coefficient is a random variable for removed elements 2, 7, 12, 17, 22, and 27 (horizontal bracings).

Figure 8.
Reliability index when the buckling coefficient is a random variable for removed elements 3, 8, 13, 18, 23, and 28 (right main legs).
Figure 8.
Reliability index when the buckling coefficient is a random variable for removed elements 3, 8, 13, 18, 23, and 28 (right main legs).

Figure 9.
Reliability index when the buckling coefficient is a random variable for removed elements 4, 9, 14, 19, 24, and 29 (diagonal bracings).
Figure 9.
Reliability index when the buckling coefficient is a random variable for removed elements 4, 9, 14, 19, 24, and 29 (diagonal bracings).

Figure 10.
Reliability index when the buckling coefficient is a random variable for removed elements 5, 10, 15, 20, 25, and 30 (diagonal bracings).
Figure 10.
Reliability index when the buckling coefficient is a random variable for removed elements 5, 10, 15, 20, 25, and 30 (diagonal bracings).


Table 1.
Coefficients of variation for random variables describing the capacity of elements.
| Random Variable | Coefficient of Variation |
|---|---|
| area of cross section (A) | 6% |
| yield strength (fy) | 8% |
| modulus of elasticity (E) | 5% |
| minimum moment of inertia (Jmin) | 6% |
| length of element (L) | 6% |
Table 2.
Initial reliability analysis.
| Element | Profile | Expected Value of the Effect of Actions of the ith Element μEi [kN] | Standard Deviation of the Effect of Action σEi (6%) [kN] | Expected Value of the Capacity of the ith Element μNi [kN] | Standard Deviation of the Capacity σNi [kN] | Effort of the ith Element μEi/μNi [%] | Probability of the Failure of the ith Element Pfi [-] | Reliability of the ith Element Ri [-] |
|---|---|---|---|---|---|---|---|---|
| 1 | L60 × 6 | 25.979 | 1.55874 | 162.385 | 16.23850 | 16.0 | 0.0000000000 | 1.0000000000 |
| 2 | L40 × 4 | 0.678 | 0.04068 | 72.380 | 7.23800 | 0.9 | 0.0000000000 | 1.0000000000 |
| 3 | L60 × 6 | 35.021 | 2.10126 | 64.304 | 8.68104 | 54.5 | 0.0005217330 | 0.9994782670 |
| 4 | L45 × 6 | 6.393 | 0.38358 | 119.615 | 11.96150 | 5.3 | 0.0000000000 | 1.0000000000 |
| 5 | L45 × 6 | 9.163 | 0.54978 | 15.430 | 2.51509 | 59.4 | 0.0074607216 | 0.9925392784 |
| 6 | L60 × 6 | 16.699 | 1.00194 | 162.385 | 16.23850 | 10.3 | 0.0000000000 | 1.0000000000 |
| 7 | L40 × 4 | 0.319 | 0.01914 | 72.380 | 7.23800 | 0.4 | 0.0000000000 | 1.0000000000 |
| 8 | L60 × 6 | 24.301 | 1.45806 | 64.304 | 8.68104 | 37.8 | 0.0000027541 | 0.9999972459 |
| 9 | L45 × 6 | 5.376 | 0.32256 | 119.615 | 11.96150 | 4.5 | 0.0000000000 | 1.0000000000 |
| 10 | L45 × 6 | 7.352 | 0.44112 | 15.430 | 2.51509 | 47.6 | 0.0007793554 | 0.9992206446 |
| 11 | L60 × 6 | 9.620 | 0.57720 | 162.385 | 16.23850 | 5.9 | 0.0000000000 | 1.0000000000 |
| 12 | L40 × 4 | 0.127 | 0.00762 | 72.380 | 7.23800 | 0.2 | 0.0000000000 | 1.0000000000 |
| 13 | L60 × 6 | 15.380 | 0.92280 | 64.304 | 8.68104 | 23.9 | 0.0000000105 | 0.9999999895 |
| 14 | L45 × 6 | 4.073 | 0.24438 | 119.615 | 11.96150 | 3.4 | 0.0000000000 | 1.0000000000 |
| 15 | L45 × 6 | 5.827 | 0.34962 | 15.430 | 2.51509 | 37.8 | 0.0000778524 | 0.9999221476 |
| 16 | L60 × 6 | 4.507 | 0.27042 | 162.385 | 16.23850 | 2.8 | 0.0000000000 | 1.0000000000 |
| 17 | L40 × 4 | 0.084 | 0.00504 | 14.400 | 2.26080 | 0.6 | 0.0000000001 | 0.9999999999 |
| 18 | L60 × 6 | 8.493 | 0.50958 | 64.304 | 8.68104 | 13.2 | 0.0000000001 | 0.9999999999 |
| 19 | L45 × 6 | 2.819 | 0.16914 | 119.615 | 11.96150 | 2.4 | 0.0000000000 | 1.0000000000 |
| 20 | L45 × 6 | 4.252 | 0.25512 | 15.430 | 2.51509 | 27.6 | 0.0000048967 | 0.9999951033 |
| 21 | L60 × 6 | 1.410 | 0.08460 | 162.385 | 16.23850 | 0.9 | 0.0000000000 | 1.0000000000 |
| 22 | L40 × 4 | 0.347 | 0.02082 | 14.400 | 2.26080 | 2.4 | 0.0000000003 | 0.9999999997 |
| 23 | L60 × 6 | 3.590 | 0.21540 | 64.304 | 8.68104 | 5.6 | 0.0000000000 | 1.0000000000 |
| 24 | L45 × 6 | 1.542 | 0.09252 | 119.615 | 11.96150 | 1.3 | 0.0000000000 | 1.0000000000 |
| 25 | L45 × 6 | 2.701 | 0.16206 | 15.430 | 2.51509 | 17.5 | 0.0000002202 | 0.9999997798 |
| 26 | L60 × 6 | 0.243 | 0.01458 | 162.385 | 21.92198 | 0.1 | 0.0000000000 | 1.0000000000 |
| 27 | L40 × 4 | 0.257 | 0.01542 | 14.400 | 2.26080 | 1.8 | 0.0000000002 | 0.9999999998 |
| 28 | L60 × 6 | 0.757 | 0.04542 | 64.304 | 8.68104 | 1.2 | 0.0000000000 | 1.0000000000 |
| 29 | L45 × 6 | 0.363 | 0.02178 | 119.615 | 11.96150 | 0.3 | 0.0000000000 | 1.0000000000 |
| 30 | L45 × 6 | 1.051 | 0.06306 | 15.430 | 2.51509 | 6.8 | 0.0000000055 | 0.9999999945 |
Table 3.
Reliability analysis after the removal of element No. 1.
| Element | Profile | Expected Value of the Effect of Actions of the ith Element μEi [kN] | Standard Deviation of the Effect of Action σEi (6%) [kN] | Expected Value of the Capacity of the ith Element μNi [kN] | Standard Deviation of the Capacity σNi [kN] | Effort of the ith Element μEi/μNi [%] | Probability of the Failure of the ith Element Pfi [-] | Reliability of the ith Element Ri [-] |
|---|---|---|---|---|---|---|---|---|
| - | - | - | - | - | - | - | - | - |
| 2 | L40 × 4 | 21.078 | 1.26468 | 14.400 | 2.26080 | 146.4 | failure of the element | |
| 3 | L60 × 6 | 61.000 | 3.66000 | 64.304 | 8.68104 | 94.9 | 0.3629051144 | 0.6370948856 |
| 4 | L45 × 6 | 43.134 | 2.58804 | 119.615 | 11.96150 | 36.1 | 0.0000000002 | 0.9999999998 |
| 5 | L45 × 6 | 27.577 | 1.65462 | 119.615 | 11.96150 | 23.1 | 0.0000000000 | 1.0000000000 |
| 6 | L60 × 6 | 20.922 | 1.25532 | 162.385 | 16.23850 | 12.9 | 0.0000000000 | 1.0000000000 |
| 7 | L40 × 4 | 3.855 | 0.23130 | 72.380 | 7.23800 | 5.3 | 0.0000000000 | 1.0000000000 |
| 8 | L60 × 6 | 20.078 | 1.20468 | 64.304 | 8.68104 | 31.2 | 0.0000002253 | 0.9999997747 |
| 9 | L45 × 6 | 0.596 | 0.03576 | 15.430 | 2.51509 | 3.9 | 0.0000000018 | 0.9999999982 |
| 10 | L45 × 6 | 13.324 | 0.79944 | 15.430 | 2.51509 | 86.4 | 0.2124343328 | 0.7875656672 |
| 11 | L60 × 6 | 8.934 | 0.53604 | 162.385 | 16.23850 | 5.5 | 0.0000000000 | 1.0000000000 |
| 12 | L40 × 4 | 0.448 | 0.02688 | 14.400 | 2.26080 | 3.1 | 0.0000000003 | 0.9999999997 |
| 13 | L60 × 6 | 16.066 | 0.96396 | 64.304 | 8.68104 | 25.0 | 0.0000000167 | 0.9999999833 |
| 14 | L45 × 6 | 5.044 | 0.30264 | 119.615 | 11.96150 | 4.2 | 0.0000000000 | 1.0000000000 |
| 15 | L45 × 6 | 4.856 | 0.29136 | 15.430 | 2.51509 | 31.5 | 0.0000148149 | 0.9999851851 |
| 16 | L60 × 6 | 4.618 | 0.27708 | 162.385 | 16.23850 | 2.8 | 0.0000000000 | 1.0000000000 |
| 17 | L40 × 4 | 0.010 | 0.00060 | 72.380 | 7.23800 | 0.0 | 0.0000000000 | 1.0000000000 |
| 18 | L60 × 6 | 8.382 | 0.50292 | 64.304 | 8.68104 | 13.0 | 0.0000000001 | 0.9999999999 |
| 19 | L45 × 6 | 2.661 | 0.15966 | 119.615 | 11.96150 | 2.2 | 0.0000000000 | 1.0000000000 |
| 20 | L45 × 6 | 4.410 | 0.26460 | 15.430 | 2.51509 | 28.6 | 0.0000065777 | 0.9999934223 |
| 21 | L60 × 6 | 1.392 | 0.08352 | 162.385 | 16.23850 | 0.9 | 0.0000000000 | 1.0000000000 |
| 22 | L40 × 4 | 0.362 | 0.02172 | 14.400 | 2.26080 | 2.5 | 0.0000000003 | 0.9999999997 |
| 23 | L60 × 6 | 3.608 | 0.21648 | 64.304 | 8.68104 | 5.6 | 0.0000000000 | 1.0000000000 |
| 24 | L45 × 6 | 1.567 | 0.09402 | 119.615 | 11.96150 | 1.3 | 0.0000000000 | 1.0000000000 |
| 25 | L45 × 6 | 2.675 | 0.16050 | 15.430 | 2.51509 | 17.3 | 0.0000002084 | 0.9999997916 |
| 26 | L60 × 6 | 0.246 | 0.01476 | 162.385 | 16.23850 | 0.2 | 0.0000000000 | 1.0000000000 |
| 27 | L40 × 4 | 0.254 | 0.01524 | 14.400 | 2.26080 | 1.8 | 0.0000000002 | 0.9999999998 |
| 28 | L60 × 6 | 0.754 | 0.04524 | 64.304 | 8.68104 | 1.2 | 0.0000000000 | 1.0000000000 |
| 29 | L45 × 6 | 0.359 | 0.02154 | 119.615 | 11.96150 | 0.3 | 0.0000000000 | 1.0000000000 |
| 30 | L45 × 6 | 1.055 | 0.06330 | 15.430 | 2.51509 | 6.8 | 0.0000000055 | 0.9999999945 |
Table 4.
Reliability analysis after the removal of elements No. 1 and No. 2.
| Element | Profile | Expected Value of the Effect of Actions of the ith Element μEi [kN] | Standard Deviation of the Effect of Action σEi (6%) [kN] | Expected Value of the Capacity of the ith Element μNi [kN] | Standard Deviation of the Capacity σNi [kN] | Effort of the ith Element μEi/μNi [%] | Probability of the Failure of the ith Element Pfi [-] | Reliability of the ith Element Ri [-] |
|---|---|---|---|---|---|---|---|---|
| - | - | - | - | - | - | - | - | - |
| - | - | - | - | - | - | - | - | - |
| 3 | L60 × 6 | 61.000 | 3.66000 | 64.304 | 8.68104 | 94.9 | 0.3629051144 | 0.6370948856 |
| 4 | L45 × 6 | 43.134 | 2.58804 | 119.615 | 11.96150 | 36.1 | 0.0000000002 | 0.9999999998 |
| 5 | L45 × 6 | 27.577 | 1.65462 | 119.615 | 11.96150 | 23.1 | 0.0000000000 | 1.0000000000 |
| 6 | L60 × 6 | 42.000 | 2.52000 | 162.385 | 16.23850 | 25.9 | 0.0000000000 | 1.0000000000 |
| 7 | L40 × 4 | 21.507 | 1.29042 | 72.380 | 7.23800 | 29.7 | 0.0000000000 | 1.0000000000 |
| 8 | L60 × 6 | 1.000 | 0.06000 | 162.385 | 16.23850 | 0.6 | 0.0000000000 | 1.0000000000 |
| 9 | L45 × 6 | 30.406 | 1.82436 | 15.430 | 2.51509 | 197.1 | failure of the element | |
| 10 | L45 × 6 | 43.134 | 2.58804 | 15.430 | 2.51509 | 279.5 | failure of the element | |
| 11 | L60 × 6 | 5.507 | 0.33042 | 162.385 | 16.23850 | 3.4 | 0.0000000000 | 1.0000000000 |
| 12 | L40 × 4 | 3.318 | 0.19908 | 14.400 | 2.26080 | 23.0 | 0.0000005227 | 0.9999994773 |
| 13 | L60 × 6 | 19.493 | 1.16958 | 64.304 | 8.68104 | 30.3 | 0.0000001563 | 0.9999998437 |
| 14 | L45 × 6 | 9.889 | 0.59334 | 119.615 | 11.96150 | 8.3 | 0.0000000000 | 1.0000000000 |
| 15 | L45 × 6 | 0.010 | 0.00060 | 15.430 | 2.51509 | 0.1 | 0.0000000004 | 0.9999999996 |
| 16 | L60 × 6 | 5.175 | 0.31050 | 162.385 | 16.23850 | 3.2 | 0.0000000000 | 1.0000000000 |
| 17 | L40 × 4 | 0.476 | 0.02856 | 72.380 | 7.23800 | 0.7 | 0.0000000000 | 1.0000000000 |
| 18 | L60 × 6 | 7.825 | 0.46950 | 64.304 | 8.68104 | 12.2 | 0.0000000000 | 1.0000000000 |
| 19 | L45 × 6 | 1.874 | 0.11244 | 119.615 | 11.96150 | 1.6 | 0.0000000000 | 1.0000000000 |
| 20 | L45 × 6 | 5.197 | 0.31182 | 15.430 | 2.51509 | 33.7 | 0.0000269857 | 0.9999730143 |
| 21 | L60 × 6 | 1.301 | 0.07806 | 162.385 | 16.23850 | 0.8 | 0.0000000000 | 1.0000000000 |
| 22 | L40 × 4 | 0.438 | 0.02628 | 14.400 | 2.26080 | 3.0 | 0.0000000003 | 0.9999999997 |
| 23 | L60 × 6 | 3.699 | 0.22194 | 64.304 | 8.68104 | 5.8 | 0.0000000000 | 1.0000000000 |
| 24 | L45 × 6 | 1.695 | 0.10170 | 119.615 | 11.96150 | 1.4 | 0.0000000000 | 1.0000000000 |
| 25 | L45 × 6 | 2.547 | 0.15282 | 15.430 | 2.51509 | 16.5 | 0.0000001587 | 0.9999998413 |
| 26 | L60 × 6 | 0.260 | 0.01560 | 162.385 | 16.23850 | 0.2 | 0.0000000000 | 1.0000000000 |
| 27 | L40 × 4 | 0.240 | 0.01440 | 14.400 | 2.26080 | 1.7 | 0.0000000002 | 0.9999999998 |
| 28 | L60 × 6 | 0.740 | 0.04440 | 64.304 | 8.68104 | 1.2 | 0.0000000000 | 1.0000000000 |
| 29 | L45 × 6 | 0.339 | 0.02034 | 119.615 | 11.96150 | 0.3 | 0.0000000000 | 1.0000000000 |
| 30 | L45 × 6 | 1.075 | 0.06450 | 15.430 | 2.51509 | 7.0 | 0.0000000058 | 0.9999999942 |
Table 5.
The effect of the removal of individual elements of a truss tower when the buckling coefficient is a deterministic value.
Table 5.
The effect of the removal of individual elements of a truss tower when the buckling coefficient is a deterministic value.
| No. of Removed Element | No. of Tower Segment | β | Effectof the Element Removal |
|---|---|---|---|
| 1 | 1 | - | Removal of element No. 1 results in exceeding the capacity in the element No. 2 → removal of the next element (No. 2) results in exceeding the capacity in elements No. 9 and No. 10 → the result is a mechanism |
| 2 | 6.299 | remov. el. No. 2 does not result in the mech.; β is at a high enough level | |
| 3 | - | remov. el. No. 3 results in exceeding the cap. in el. No. 4 and No. 5 → the result is a mech. | |
| 4 | - | remov. el. No. 4 results in exceeding the cap. in el. No. 5 → the result is a mech. | |
| 5 | 3.307 | remov. el. No. 5 does not result in the mech.; β is not at high enough level | |
| 6 | 2 | 1.936 | remov. el. No. 6 does not result in the mech.; β is not at high enough level |
| 7 | 6.098 | remov. el. No. 7 does not result in the mech.; β is at high enough level | |
| 8 | - | remov. el. No. 8 results in exceeding the cap. in el. No.9 and No.10 → the result is a mech. | |
| 9 | 1.569 | remov. el. No. 9 does not result in the mech.; β is not at high enough level | |
| 10 | 5.206 | remov. el. No. 10 does not result in the mech.; β is at high enough level | |
| 11 | 3 | 5.848 | remov. el. No. 11 does not result in the mech.; β is at high enough level |
| 12 | 6.114 | remov. el. No. 12 does not result in the mech.; β is at high enough level | |
| 13 | - | remov. el. No. 13 results in exceeding the cap. in el. No.14 and No.15 → the result is a mech. | |
| 14 | 3.345 | remov. el. No. 14 does not result in the mech.; β is not at high enough level | |
| 15 | 6.174 | remov. el. No. 15 does not result in the mech.; β is at high enough level | |
| 16 | 4 | 6.102 | remov. el. No. 16 does not result in the mech.; β is at high enough level |
| 17 | 6.113 | remov. el. No. 17 does not result in the mech.; β is at high enough level | |
| 18 | - | remov. el. No. 18 results in exceeding the cap. in el. No.20 → the result is a mech. | |
| 19 | 5.223 | remov. el. No. 19 does not result in the mech.; β is at high enough level | |
| 20 | 6.106 | remov. el. No. 20 does not result in the mech.; β is at high enough level | |
| 21 | 5 | 6.114 | remov. el. No. 21 does not result in the mech.; β is at high enough level |
| 22 | 6.113 | remov. el. No. 22 does not result in the mech.; β is at high enough level | |
| 23 | 4.747 | remov. el. No. 23 does not result in the mech.; β is at high enough level | |
| 24 | 6.113 | remov. el. No. 24 does not result in the mech.; β is at high enough level | |
| 25 | 6.114 | remov. el. No. 25 does not result in the mech.; β is at high enough level | |
| 26 | 6 | 6.113 | remov. el. No. 26 does not result in the mech.; β is at high enough level |
| 27 | 6.113 | remov. el. No. 27 does not result in the mech.; β is at high enough level | |
| 28 | 6.113 | remov. el. No. 28 does not result in the mech.; β is at a high enough level | |
| 29 | 6.113 | remov. el. No. 29 does not result in the mech.; β is at a high enough level | |
| 30 | 6.113 | remov. el. No. 30 does not result in the mech.; β is at a high enough level |
Table 6.
The effect of the removal of individual elements of a truss tower when the buckling coefficient is a random variable.
Table 6.
The effect of the removal of individual elements of a truss tower when the buckling coefficient is a random variable.
| No. of Removed Element | No. of Tower Segment | β | Effectof the Element Removal |
|---|---|---|---|
| 1 | 1 | - | Removal of element No. 1 results in exceeding the capacity in element No.2 → removal of the next element (No. 2) results in exceeding the capacity in elements No.9 and No.10 → the result is a mechanism |
| 2 | 4.441 | remov. el. No. 2 does not result in the mech.; β is at high enough level | |
| 3 | - | remov. el. No. 3 results in exceeding the cap. in el. No.4 and No.5 → the result is a mech. | |
| 4 | - | remov. el. No. 4 results in exceeding the cap. in el. No.5 → the result is a mech. | |
| 5 | 2.525 | remov. el. No. 5 does not result in the mech.; β is not at high enough level | |
| 6 | 2 | 1.484 | remov. el. No. 6 does not result in the mech.; β is not at high enough level |
| 7 | 4.462 | remov. el. No. 7 does not result in the mech.; β is at a high enough level | |
| 8 | - | remov. el. No. 8 results in exceeding the cap. in el. No.9 and No.10 → the result is a mech. | |
| 9 | 1.028 | remov. el. No. 9 does not result in the mech.; β is not at high enough level | |
| 10 | 3.876 | remov. el. No. 10 does not result in the mech.; β is at high enough level | |
| 11 | 3 | 4.015 | remov. el. No. 11 does not result in the mech.; β is at high enough level |
| 12 | 4.471 | remov. el. No. 12 does not result in the mech.; β is at high enough level | |
| 13 | - | remov. el. No. 13 results in exceeding the cap. in el. No.14 and No.15 → the result is a mech. | |
| 14 | 2.140 | remov. el. No. 14 does not result in the mech.; β is not at high enough level | |
| 15 | 4.493 | remov. el. No. 15 does not result in the mech.; β is at high enough level | |
| 16 | 4 | 4.465 | remov. el. No. 16 does not result in the mech.; β is at high enough level |
| 17 | 4.471 | remov. el. No. 17 does not result in the mech.; β is at high enough level | |
| 18 | - | remov. el. No. 18 results in exceeding the cap. in el. No. 20 → the result is a mech. | |
| 19 | 3.275 | remov. el. No.19 does not result in the mech.; β is not at high enough level | |
| 20 | 4.467 | remov. el. No. 20 does not result in the mech.; β is at high enough level | |
| 21 | 5 | 4.471 | remov. el. No. 21 does not result in the mech.; β is at high enough level |
| 22 | 4.471 | remov. el. No. 22 does not result in the mech.; β is at high enough level | |
| 23 | 2.990 | remov. el. No. 23 does not result in the mech.; β is not at high enough level | |
| 24 | 4.296 | remov. el. No. 24 does not result in the mech.; β is at high enough level | |
| 25 | 4.471 | remov. el. No. 25 does not result in the mech.; β is at high enough level | |
| 26 | 6 | 4.471 | remov. el. No. 26 does not result in the mech.; β is at high enough level |
| 27 | 4.471 | remov. el. No. 27 does not result in the mech.; β is at high enough level | |
| 28 | 4.467 | remov. el. No. 28 does not result in the mech.; β is at high enough level | |
| 29 | 4.470 | remov. el. No. 29 does not result in the mech.; β is at high enough level | |
| 30 | 4.471 | remov. el. No. 30 does not result in the mech.; β is at high enough level |
© 2019 by the authors. Licensee MDPI, Basel, Switzerland. This article is an open access article distributed under the terms and conditions of the Creative Commons Attribution (CC BY) license (http://creativecommons.org/licenses/by/4.0/).
Share and Cite
MDPI and ACS Style
Mochocki, W.; Radoń, U. Analysis of Basic Failure Scenarios of a Truss Tower in a Probabilistic Approach. Appl. Sci. 2019, 9, 2662. https://doi.org/10.3390/app9132662
AMA Style
Mochocki W, Radoń U. Analysis of Basic Failure Scenarios of a Truss Tower in a Probabilistic Approach. Applied Sciences. 2019; 9(13):2662. https://doi.org/10.3390/app9132662
Chicago/Turabian StyleMochocki, Wojciech, and Urszula Radoń. 2019. "Analysis of Basic Failure Scenarios of a Truss Tower in a Probabilistic Approach" Applied Sciences 9, no. 13: 2662. https://doi.org/10.3390/app9132662
Note that from the first issue of 2016, this journal uses article numbers instead of page numbers. See further details here.