Compensating Uncertainties in Force Sensing for Robotic-Assisted Palpation


1
School of Automation, Guangdong University of Technology, Guangzhou 510006, China
2
Department of Biomedical Engineering, National University of Singapore, 21 Lower Kent Ridge Rd, Singapore 119077, Singapore
3
National University of Singapore Suzhou Research Institute, Linquan Street, Wuzhong District, Suzhou 215125, Jiangsu, China
*
Author to whom correspondence should be addressed.
Appl. Sci. 2019, 9(12), 2573; https://doi.org/10.3390/app9122573
Submission received: 25 February 2019
/
Revised: 13 May 2019
/
Accepted: 17 May 2019
/
Published: 25 June 2019
(This article belongs to the Special Issue Human Friendly Robotics)
Abstract
:Force sensing in robotic-assisted minimally invasive surgery (RMIS) is crucial for performing dedicated surgical procedures, such as bilateral teleoperation and palpation. Due to the bio-compatibility and sterilization requirements, a specially designed surgical tool/shaft is normally attached to the sensor while contacting the organ targets. Through this design, the measured force from the sensor usually contains uncertainties, such as noise, inertial force etc., and thus cannot reflect the actual interaction force with the tissue environment. Motivated to provide the authentic contact force between a robotic tool and soft tissue, we proposed a data-driven force compensation scheme without intricate modeling to reduce the effects of force measurement uncertainties. In this paper, a neural-network-based approach is utilized to automatically model the inertial force subject to noise during the robotic palpation procedure, then the exact contact force can be obtained through the force compensation method which cancels the noise and inertial force. Following this approach, the genuine interaction force during the palpation task can be achieved furthermore to improve the appraisal of the tumor surrounded by the soft tissue. Experiments are conducted with robotic-assisted palpation tasks on a silicone-based soft tissue phantom and the results verify the effectiveness of the suggested method.
1. Introduction
More recently, the robotic-assisted minimally invasive surgery (RMIS) has been introduced into the operating room with significant advantages such as improved accuracy, intuitive manipulation, small/invisible incisions and enhanced visualizations etc., as can be witnessed in quite a number of literatures [1,2,3,4]. However, the current RMIS cannot provide proper force/tactile feedback, thus challenges operations such as the cancer tumor removal procedure, in which tumor palpation is usually necessary to locate the tumor area [5].
By directly sensing the stiffness characteristics using hand-held rigid instruments, surgeons can localize the tumor during open surgery. But in RMIS, it is still an unsolved issue for robots to detect the tumor through sensing technique, data acquisition, and processing etc. In [6,7], detailed surveys of tactile and force sensing devices for robotic and biomedical applications have been presented respectively. To benefit the RMIS utilization, the sensors should be designed subject to special requirements as those mentioned in [8,9,10], including (a) repeatability, (b) reliability, (c) speed of sensing, (d) response with static and dynamic, (e) size (limited to about 10mm in diameter for small port insertion), (f) sterilizable (using at least one commonly used sterilization method), (g) biocompatible or with a protective sheath and (h) low cost, etc. Based on these requirements, some tactile and force sensors have been developed as presented in [11,12,13,14,15,16].
Motivated to achieve tumor localization in RMIS with a tactile or force sensor, considerable efforts have been made as shown in the literatures: In [17] a haptic palpation probe is designed to locate the subcutaneous blood vessel in RMIS. This probe design reduces the cost, and makes the palpation probe disposable. Sliding indentation experiments on a silicone tissue phantom has demonstrated its efficiency. Sliding indentation is one of the palpation methods which makes the probe press a tissue with pre-defined depth and then slides the probe to palpate the tissue. The contact force measured by the sensor can be used to calculate the mechanical property of the tissue. In [18], a novel robotic sweeping palpation method is proposed which is inspired by the actual finger motion during manual palpation in a digital rectal examination (DRE). In [19] a lateral exploration strategy for the classification of inclusions and surrounding tissue is proposed. The above-mentioned methods measure the mechanical property of soft tissue, and detect the hard inclusions from the normal surrounding soft tissue, in which the force information performs the main factor to be sensed during the palpation task. It should be pointed out that the applied force during palpation should be thresholded to a certain limit, as if too large a force is applied to the soft tissue, safety problems may arise. The average maximum force applied by surgeons when manually palpating soft tissue was proved to be around N from the in vivo experiments in [20]. Furthermore, in [21] it is also mentioned that autonomous robot palpation can reduce the maximum applied force on the soft tissue by more than 35% compared to manual palpation with similar tools. In view of the advantage of autonomous robotic palpation, [22] analyzed the force modulation strategies for robotic palpation to identify the hard region in soft tissue through a learning from demonstration (LfD) based method. Moreover, in [23] presented a remote palpation using a machine learning approach and research in [24] illustrated an autonomous surface recognition using vibration signals.
To quantitatively evaluate the mechanical property of soft tissue, the perceived stiffness value is usually used. Finite element method (FEM) simulation is recognized as a proper approach to extract objective and quantitative information of inhomogeneous abnormal tissue, but this method is highly time consuming and normally has been used to simulate the mechanical property of soft tissue deformation from a scientific research point of view [25,26]. The Young’s or elastic modulus is recently widely used to evaluate the perceived stiffness of the soft tissue, which takes into accoun the tool-tissue interaction and the indentation tip size as used in [22,27]. To calculate the perceived stiffness of soft tissue, the interaction force must be measured. Although it is possible to obtain the interaction force with a non-sensory based approach as shown in [28], the sensitivity of this development is notably lower, which makes it less favorable. In order to better estimate the interaction force of soft tissue, a sensor-based approach is usually adopted. Considering the surgical application, sometimes the sensors cannot be used to directly contact the patient body for proper operation, thus the sensor is normally arranged at the end of the surgical tools. During the operation, the surgical tool is manipulated in a dynamic manner, and possibly causes measurement uncertainties (such as noise, inertial force, friction etc.), thus potentially providing wrong or inaccurate diagnoses, for instance, the force-based palpation.
The inertial force of the sensor based robotic-environment interaction has been investigated recently within industrial robotic applications, which presents a major issue for force-guided or force-guaranteed robotic manipulations. In [29], a variant of the recursive instrumental variables method is used to online estimate the inertial parameter of the payload on the robotic system, and then an improved force control performance can be achieved. After that, in [30], the authors extended the recursive instrumental variables method to bilateral teleoperation tasks to eliminate and/or scale the non-contact force (including inertial force caused by payload). In view of the non-negligible effect of inertial force from sensor measurements, which potentially degrades the performance of interaction control, in [31] an observer was developed with two different approaches: The extended Kalman filter (EKF) and unscented Kalman filter (UKF), for both type of observers, different measurement vectors were considered with the first one only using pose and force/torque measurement, and the second one also considering acceleration measurement. Another work presented in [32] investigates the inertial force compensation with the industrial robot by using a quaternion-based Kalman filter for safer human-robot interaction. All these works analyze the main factors such as velocity, position, and accelerations of the inertial force caused by the sensor measurement, which highly relies on the accuracy of the inertial force model, and mainly only considers the industrial application with a heavy payload.
Having reviewed the previous related works, to the best knowledge of the authors, there is no reported work on the inertial force analysis and compensation in robotic-assisted palpation. Force sensing is the most important factor to be used to analyze the mechanical property of soft tissue, and it is normally measured by the force sensor. Consequently, the inertial force will appear during the data collection process and possibly degrade the detection of tissue and may even be a risk to safety during palpation. In this paper, we investigate the effect of inertial force for robotic palpation with a probe on the force sensor, a neural-network-based method is utilized to model the inertial force during the palpation, and after that the inertial force will be compensated in an online way during the data collection process. To demonstrate the effectiveness of the proposed approach, the perceived stiffness of the soft tissue is calculated before and after the inertial force compensation and compared with each other. Additionally, static experiments are performed to obtain the stiffness of the soft tissue, in which the measured force is not affected by the inertial force since the force sensor stays still during the experiments. From the experiment results, it can be found that after the inertial force compensation, the calculated stiffness of the soft tissue is improved to better describe the real mechanical property of the soft tissue during dynamic robotic palpation tasks.
The remaining of this paper is organized as follows. Section 2 comprehensively presents the procedure of robotic-assisted palpation, while also performing a quantitatively stiffness assessment and noting the force measurement uncertainty. A force compensation framework is also presented. In Section 3, the neural-network-based approach is utilized to model the inertial force of the robotic palpation, and the modeled inertial force can be canceled during the palpation tasks to get an improved force measurement. Experiment results in Section 4 firstly presents the force measurement uncertainties caused by the probe during dynamic robotic operation, then the force compensation framework is used with the neural-network-based modelling, and the obtained results verify that the proposed approach can efficiently remove the effect of inertial force and thus get an improved measurement result in which Young’s modulus is close to the static experiment results (actual stiffness of soft tissue defined in this paper). The discussion and conclusion are provided in Section 5 and Section 6 respectively.
2. Robotic Palpation with Force Based Approach
In this section, a force based robotic palpation approach is introduced. To quantitatively analyze the stiffness of soft tissue with a hard inclusion embedded, Young’s modulus is used, which considers the probe size and the materials of the environment. The measured force is the main factor in robotic palpation which is usually obtained from the force sensor. However, sensor uncertainties are inevitable. In the robotic palpation process, the probe is often controlled by an operator or moved autonomously to contact the soft tissue, thus the inertial force will be introduced during the dynamic motion of robotic palpation. To obtain an accurate stiffness of the soft tissue for better analysis, it is necessary to compensate for the inertial force measured from the sensor during the dynamic motion.
2.1. Force Based Robotic Palpation
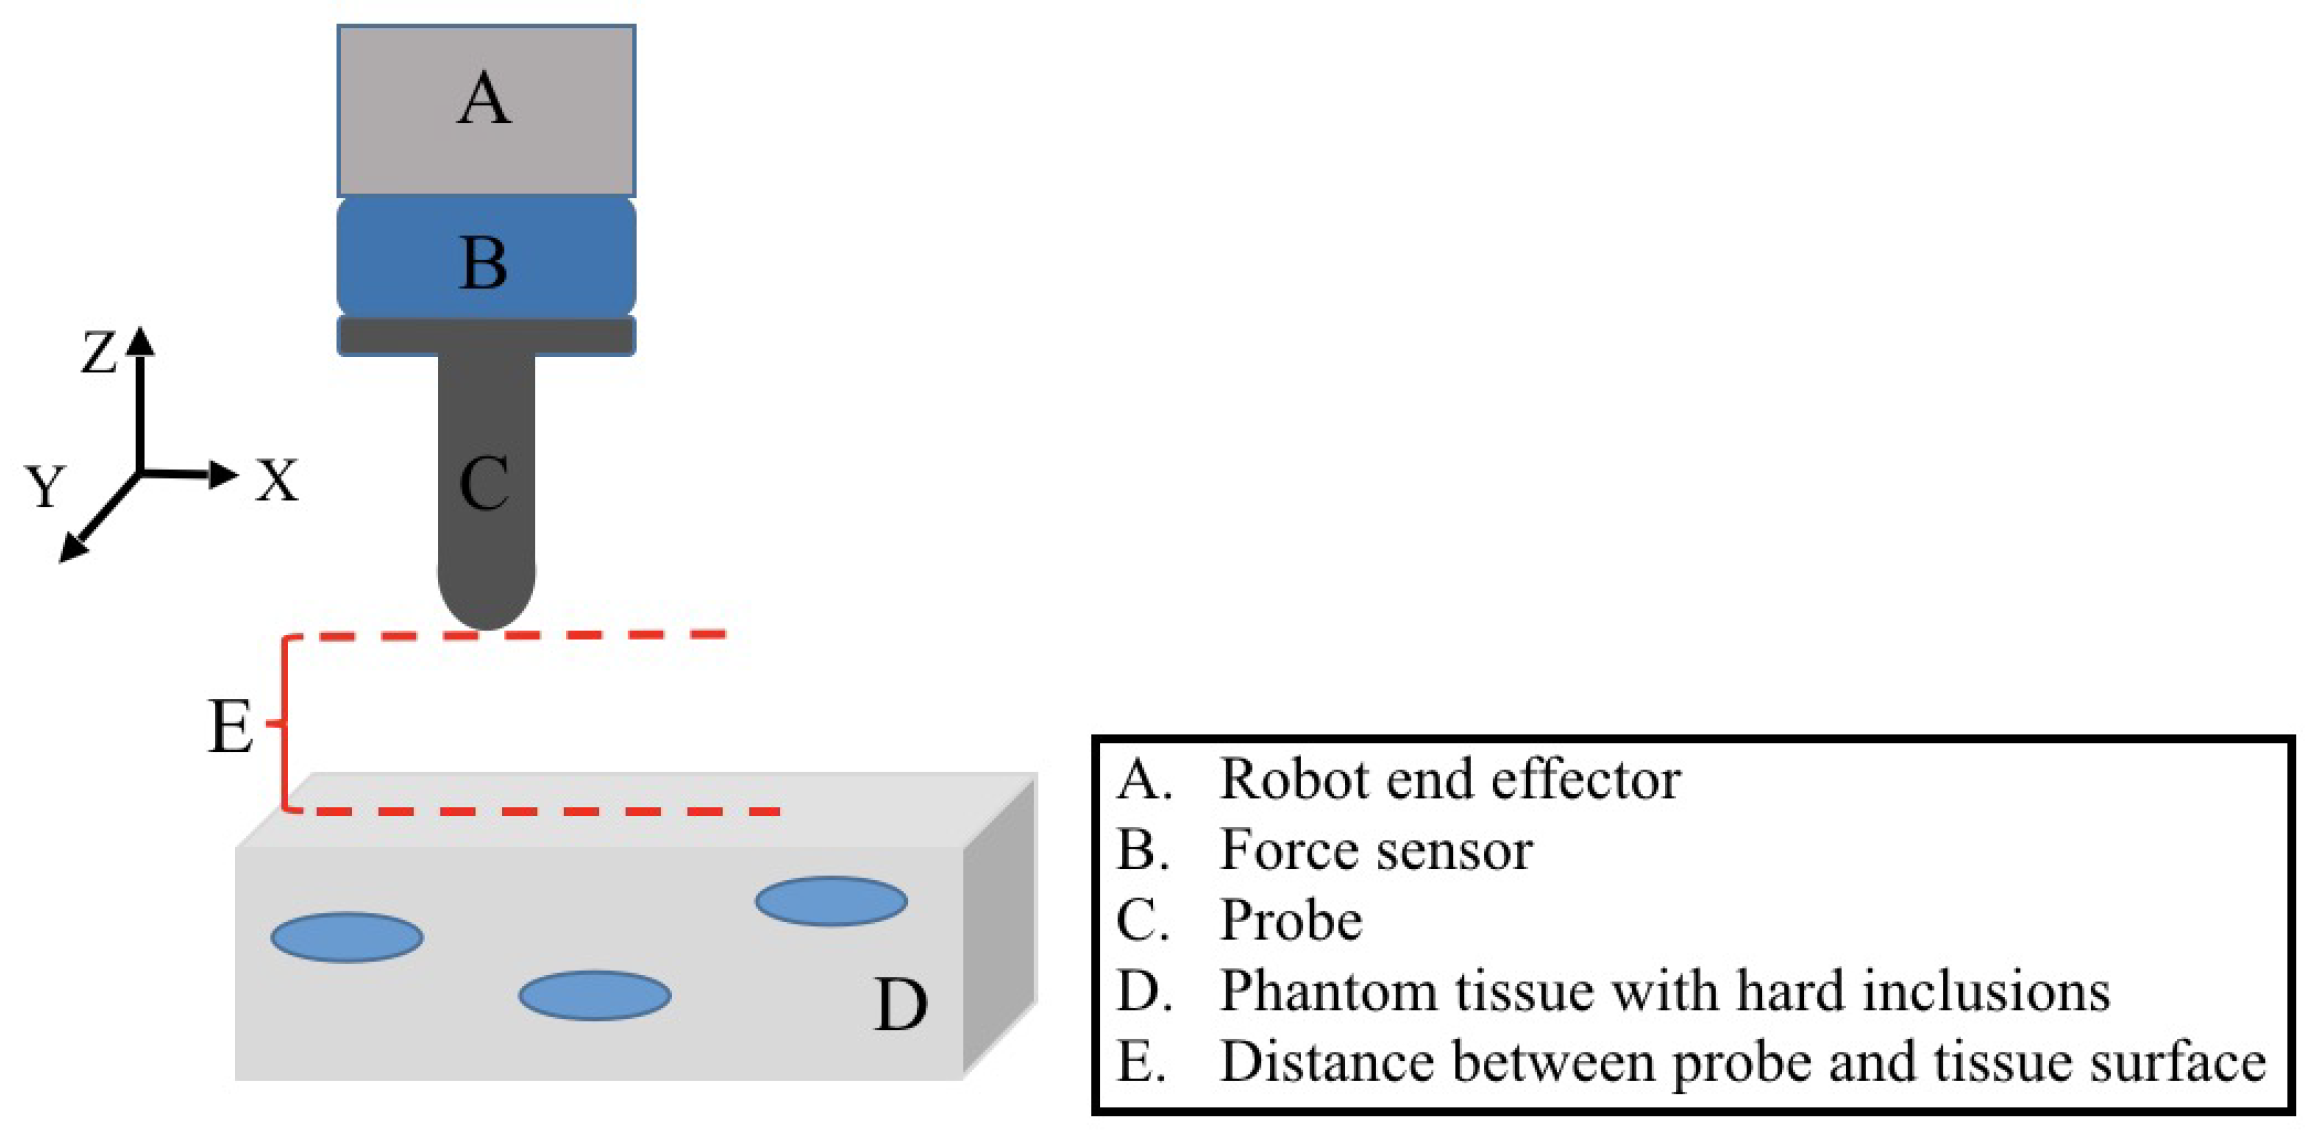
The cancerous nodule in the soft tissue can be palpated by a surgeon during the open surgery, mainly because the tumor is stiffer than the normal surrounding tissue. Researchers in [33] have conducted indentation tests of human and porcine abdominal organs in vivo and ex vivo, and proved that healthy tissues demonstrate similar compliance, but a noticeable difference can be observed for the abnormal tissue surrounded by healthy tissue. When the robot is controlled to palpate the tissue with a force sensor attached to the end, the difference of the force response can be observed when the robot palpates different parts of the tissue at the same indentation depth. It can further be concluded that the one with a large force response is more likely to be tumor. A brief schematic of robotic palpation with a force sensor and probe is illustrated in Figure 1. The force sensor is used to measure the interaction force between the probe and the soft tissue. During the palpation, the probe will be moved to contact the soft tissue, and the real-time force response will be measured by the sensor to describe the applied force during the palpation. When the indentation depths are different, the simple force response is not sufficient enough to explain the location of a tumor, and it is therefore necessary to quantitatively evaluate the mechanical property of the soft tissue for detailed analysis.
2.2. Stiffness Analysis Through Young’s Modulus
The mechanical property of soft tissue has drawn considerable research interests, and several soft tissue models have been developed. The Finite Element Method (FEM) is a popular tool to describe soft tissue deformation, in which the tissue is divided into a serial of discrete elements, and these elements form a mesh to describe the tissue deformation [34]. The FEM provides a reasonably accurate depiction of the soft tissue deformation, but it is difficult to implement such a model in real-time due to the high computation cost. Moreover, the boundary conditions of the FEM model is very difficult to be defined in vivo, thus limiting its clinical application [35].
In order to quantitatively describe the mechanical property of soft tissue, the Young’s or elastic modulus is used to evaluate the perceived stiffness of soft tissue in robotic-assisted palpation [22]. Since the spherical indentation tip is used to interact with the tissue to obtain the contact force, Young’s modulus (YM) of the soft tissue can be derived as [36]:
in which E is YM, v is the Poisson’s ratio of the soft tissue phantom, f is the measured interaction force from the sensor, r is the radius of the indenter, and is the indentation depth. The YM is used to determine the mechanical property of the tissue with or without hard inclusions. In YM, the main factors used are the interaction force f and the indentation depth . The interaction force can be measured directly through the force sensor, but the indentation depth should be verified by the robotic Cartesian vectors or with external devices.
2.3. Uncertainty Analysis of Force Measurement
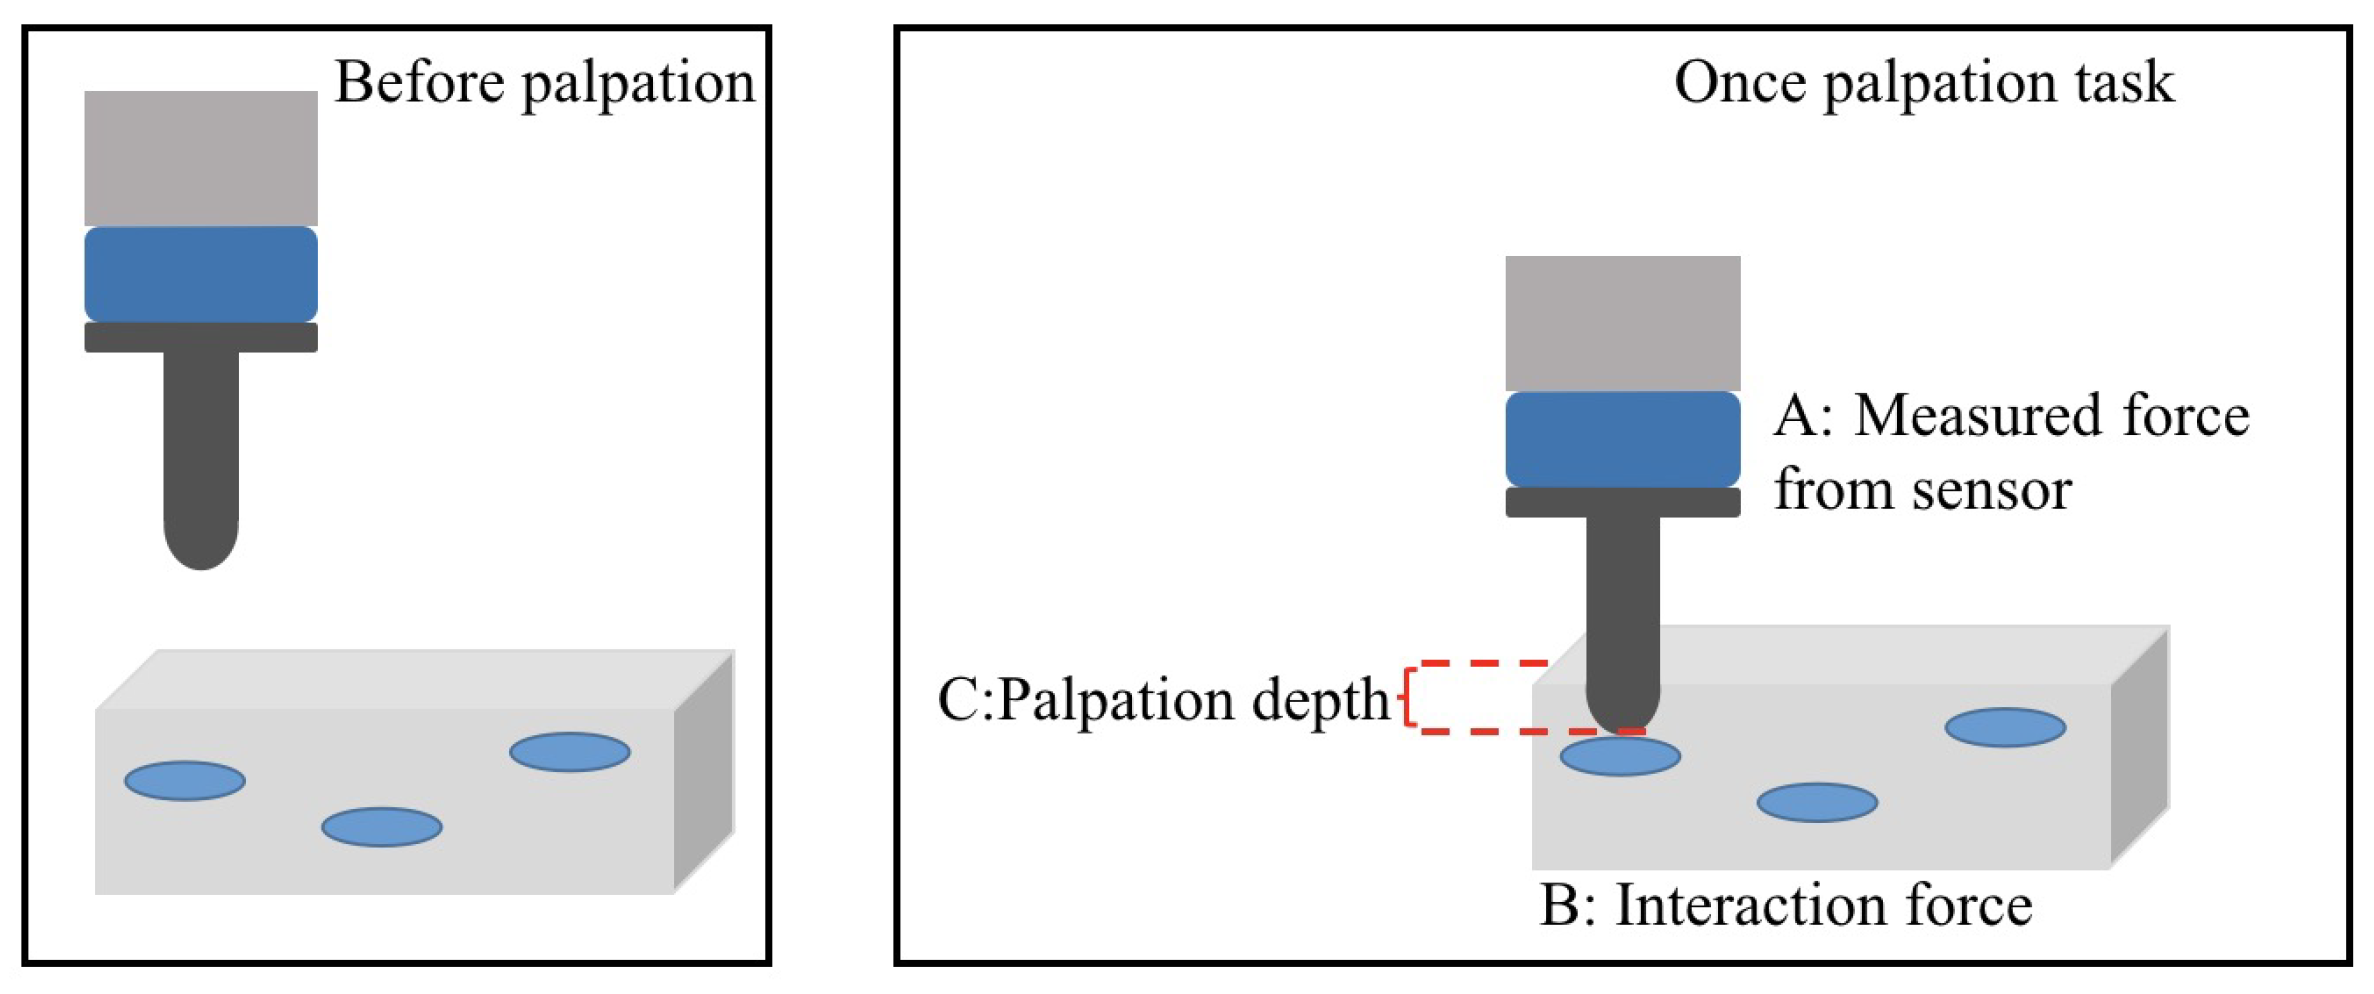
Measurement uncertainties are inherent characteristic for sensors, in which noise and random drift are usually inevitable. Friction is not considered in this paper as the probe is fixed with the force sensor on the end effector of the robot. Meanwhile, the robot is controlled to move along the Z axis for the force analysis. When a probe or tool is attached to the force sensor, the measured force during the dynamic manipulation task will be influenced by the inertial force and gravity of the probe or tool. Figure 2 illustrates the procedure of robotic palpation, where the probe is controlled by the robot to move along the Z axis to contact the soft tissue in which several hard inclusions are embedded. The probe is designed with a spherical tip, and during the palpation, the probe is pressed to proper indentation depths on the soft tissue. The palpation is a dynamic process within the Z axis of the Cartesian space of the robot. We focus on the application of robotic-assisted palpation in open space. The RMIS procedure is not considered in this work, in which the surgical tools are inserted into the patient body through a small hole around 10 cm. Other friction and disturbances are easily caused in RMIS. The measured force from the sensor can be expanded as:
in which the is the measured force from the sensor, is the actual interaction force between probe and the soft tissue (which can be considered to accurately reflect the tissue interaction force), denotes the inertial force during the palpation and is the gravity effect due to the probe attached to the force sensor. Through the analysis of the force measurement uncertainties, it is noticed that simply adopting the measured force from a sensor cannot accurately reflect the interaction force, which may affect the further analysis of the stiffness using YM, thus YM calculated by the measured force from a sensor can be obtained as:
However, the actual YM of the soft tissue should be calculated as:
The force uncertainties indicated as and , easily make the obtained YM inaccurate, thus challenging further analysis of robotic palpation.
2.4. Robotic Palpation with Force Compensation
The uncertainties of force measurement exist widely in a robotic system, and thus may cause unexpected performance. In the robotic palpation, we use YM to quantitatively analyze the mechanical property of the soft tissue and to detect the tumor area based on YM values. But the uncertainties of the sensor measurement may mislead the determination of the tumor inside the soft tissue. Most force sensors are capable of providing a good initialization step before recording force data, which can remove the influence of the probe gravity ( as shown in the previous section). However, the inertial force ( as presented in the previous section) cannot be solved simply by initialization as it may change during the dynamic robotic manipulation. To achieve an accurate interaction, the inertial force cannot be ignored, and the proper method is desired to cancel the influence of the inertial force.
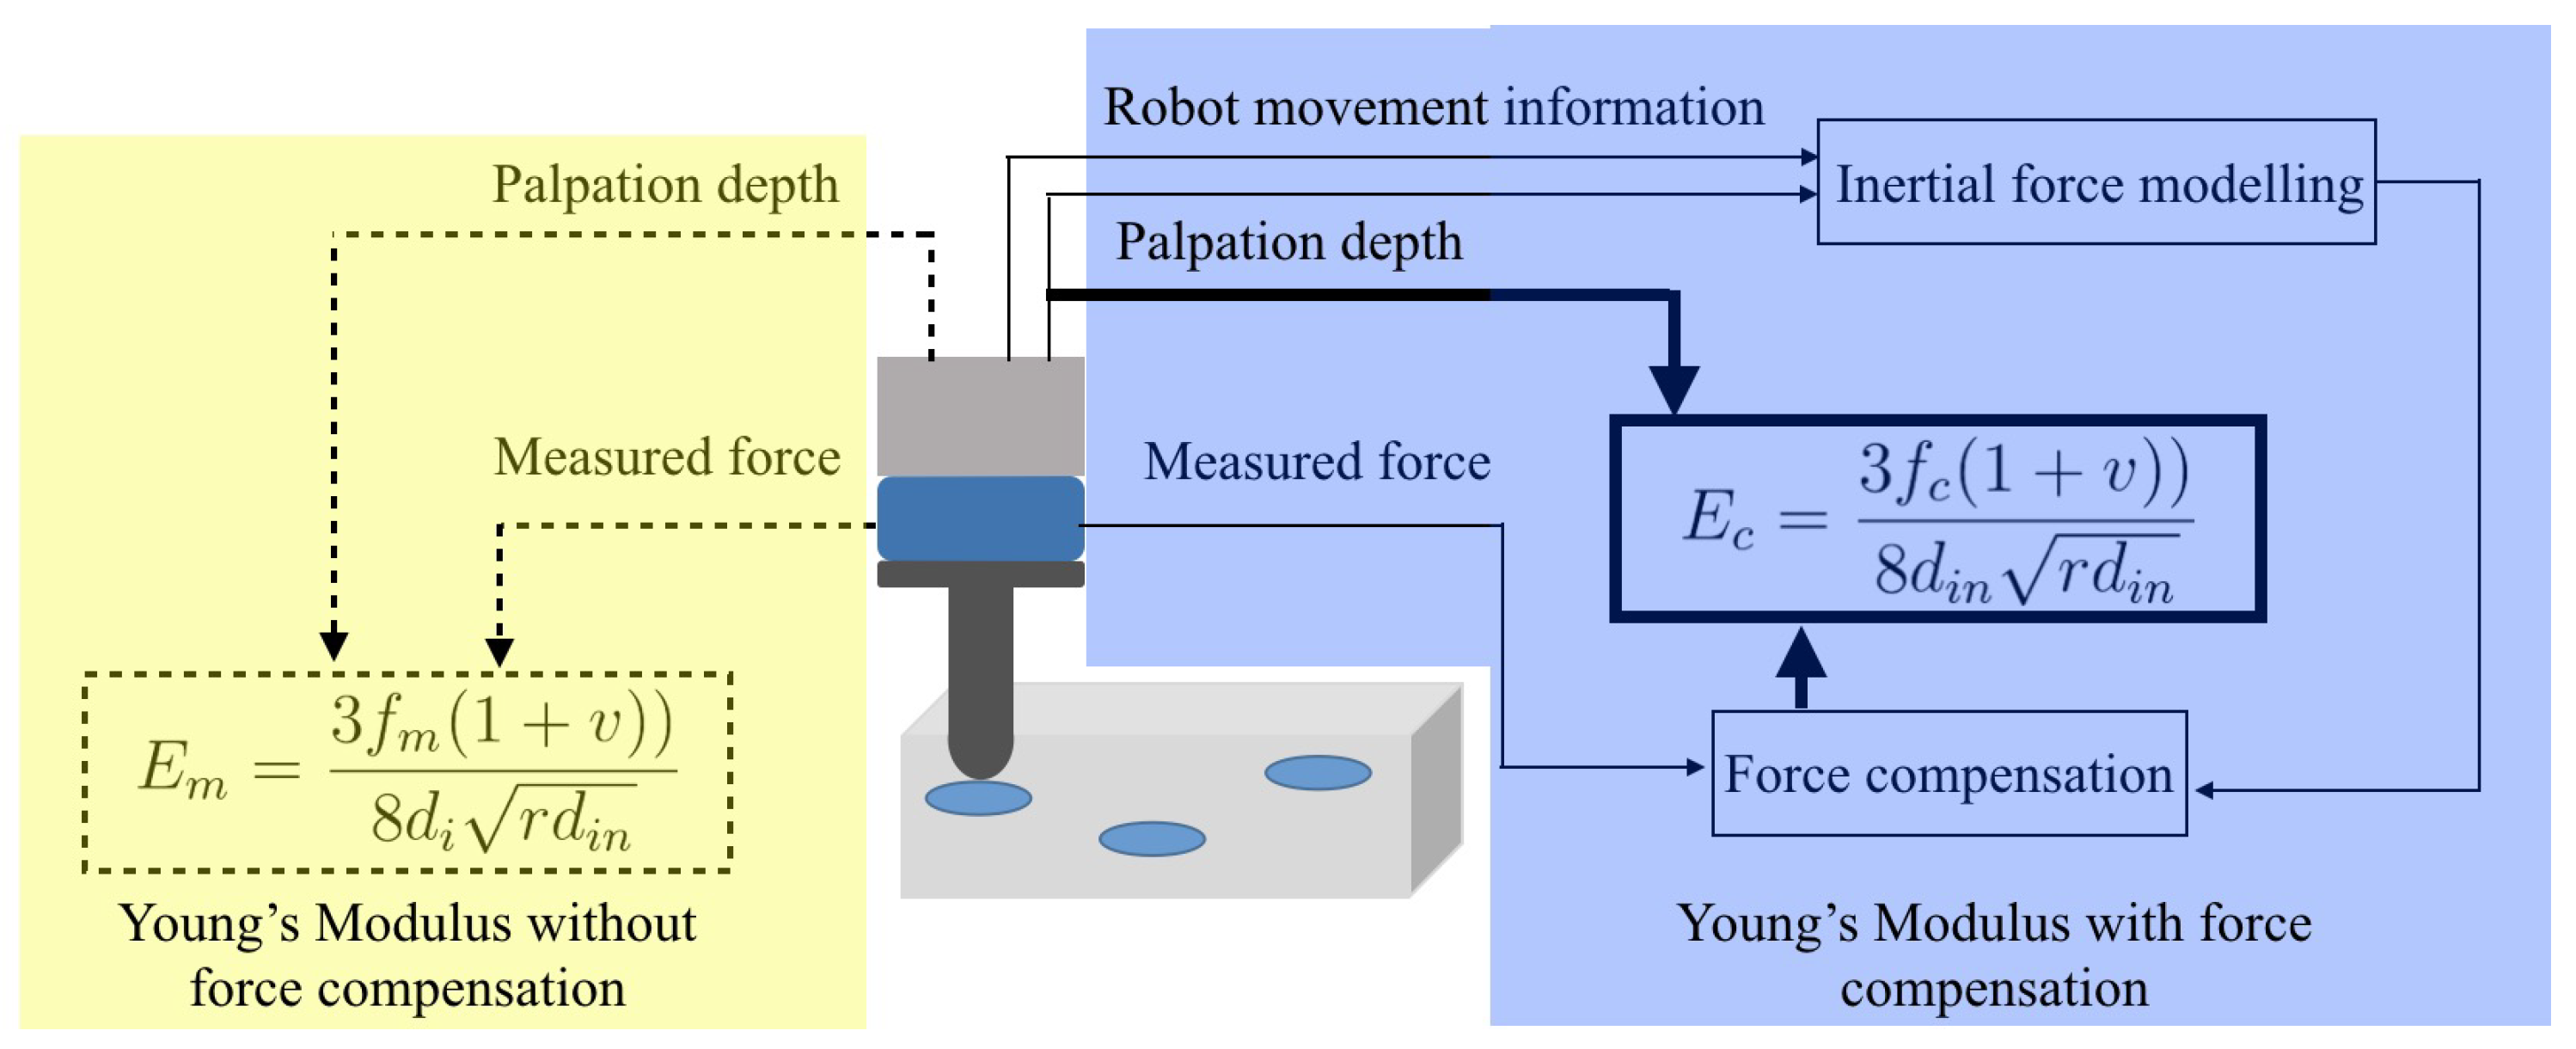
A force compensation framework of the robotic palpation is developed as shown in Figure 3. The block shows the normal robotic palpation approach as used in previous studies, in which the measured force from the sensor is directly used for the analysis of the mechanical property of soft tissue (as shown in Equation (3)). It is possible to obtain the close stiffness of the soft tissue once the whole procedure is arranged as static measurement (in which the robot is controlled to palpate the soft tissue with a defined indentation depth and the force data is collected when the robot keeps still at the indentation depth until the force data is stable. The static force data in this paper is defined as an average value from the sensor measurement for 10 s.). However, this static measurement usually slows down the procedure and also requires the operator to focus on the data collection.
It is desired and necessary to get an accurate determination during the dynamic surgical procedure. Thus a force compensation solution is developed to remove the effect of inertial force during palpation, as shown in the blue block. The inertial force can be modeled online as , and then canceled from the force measurement . By this method, the compensated contact force during the robotic palpation can be derived as:
Before the procedure, the gravity influence can be removed by the sensor initialization, thus can be considered as 0. The modeled inertial force can also be canceled by using Equation (5). With this compensated approach, an accurate interaction force during the palpation task can be obtained, and thus can be used to calculate the perceived stiffness of the soft tissue. To model the inertial force, a neural-network-based method will be introduced in the next section.
3. Neural-Network-Based Modelling of Inertial Force and Compensation
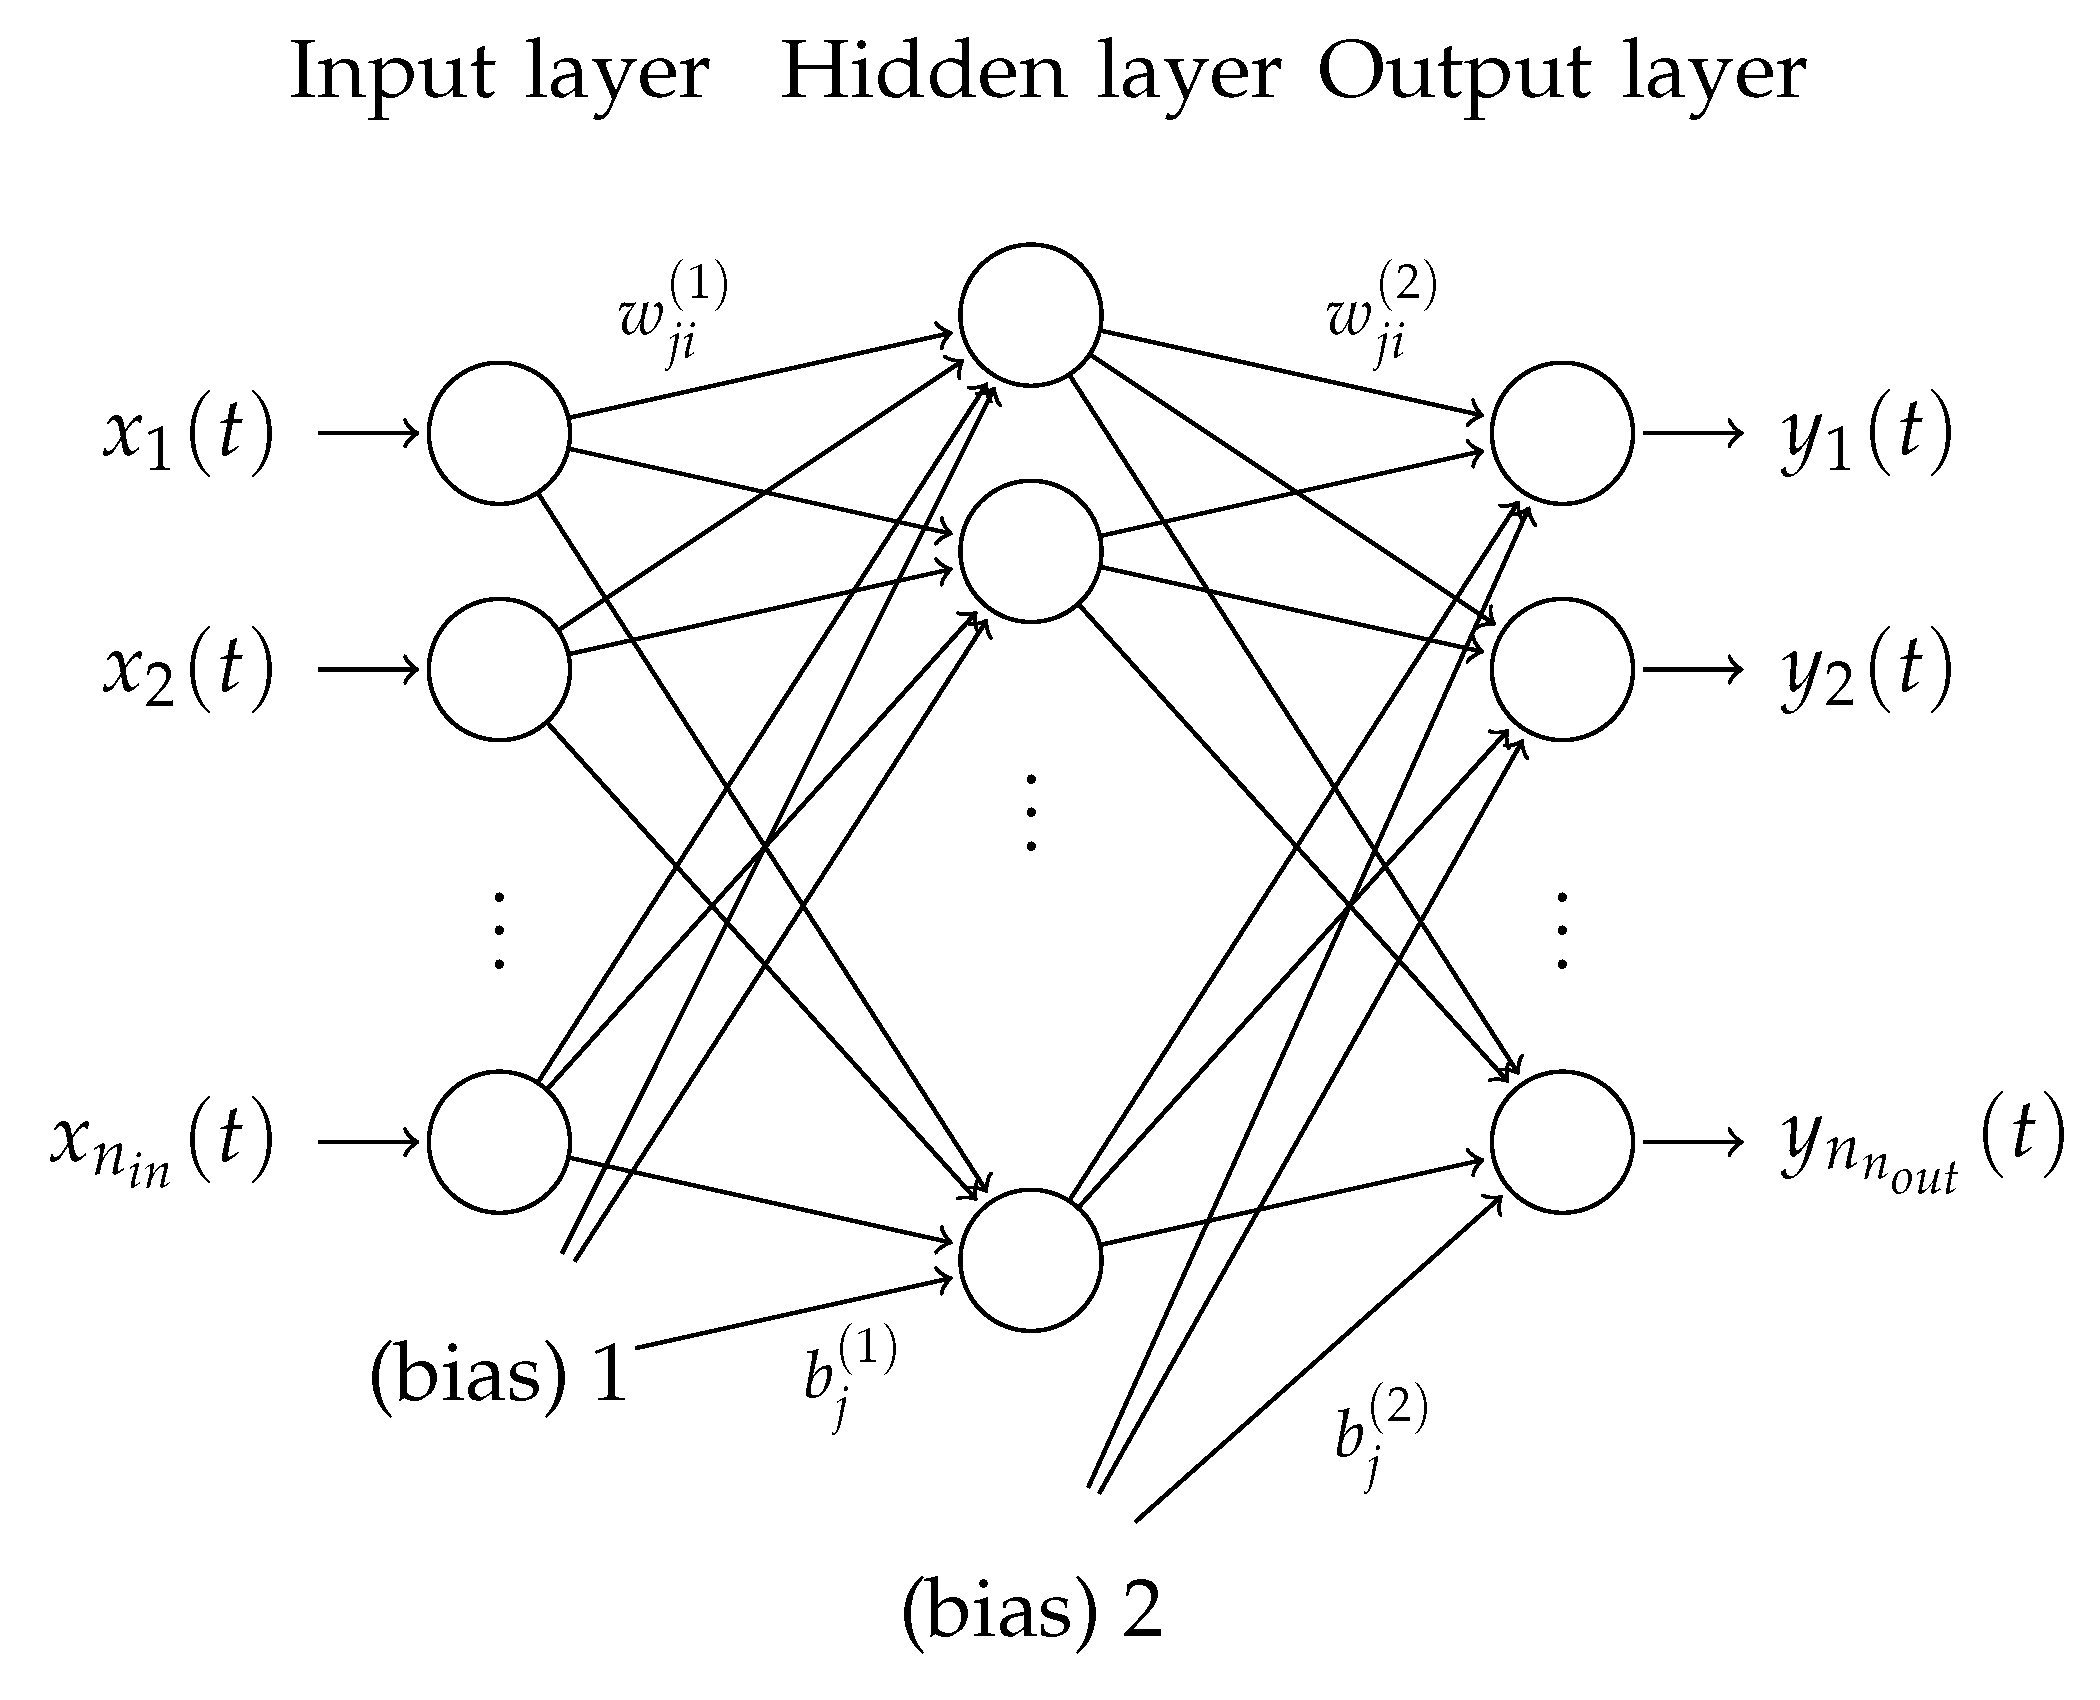
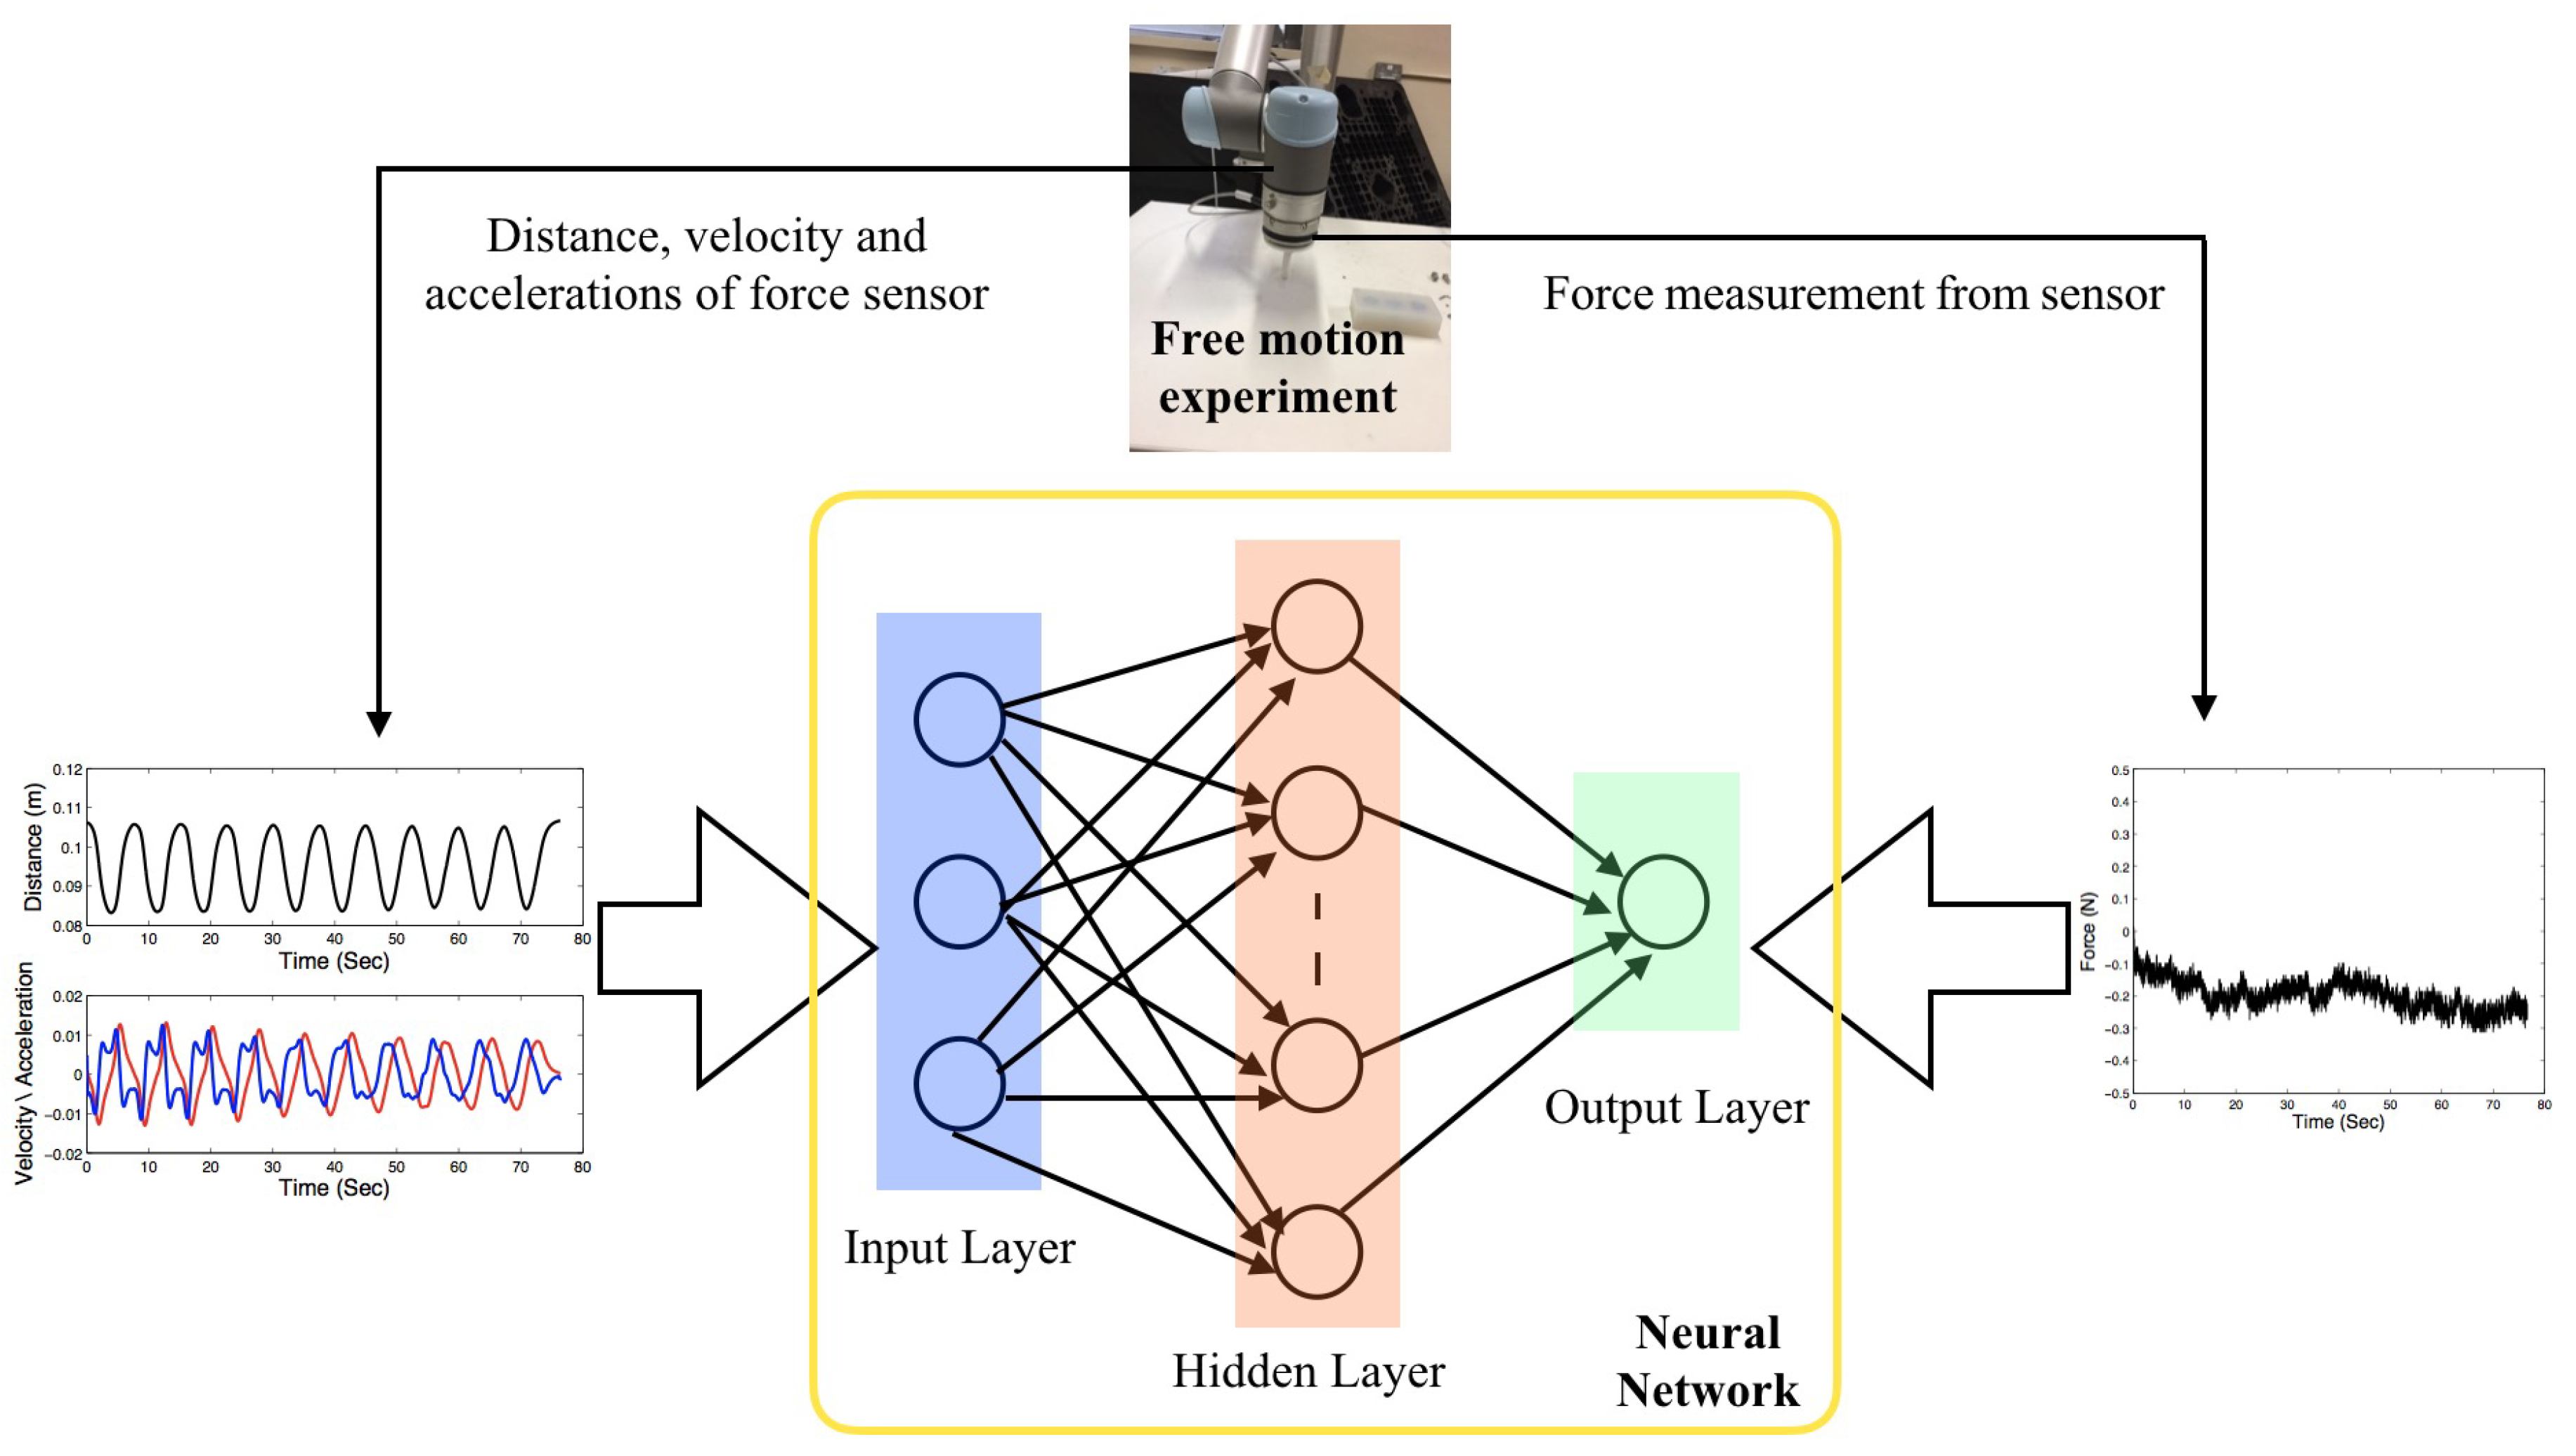
In order to get the accurate model of inertial force during the dynamic robotic motion, a neural-network-based approach is used. The general structure of the feed-forward fully-connected artificial neural network (ANN) can be viewed in Figure 4, in which a three-layer neural network is presented, namely the input, hidden and output layers. The input layer passes the -dimensional input vector (feature vector) to the hidden layer and then to the output layer. In a more detailed way, the output of the i-th node in the input layer is given as follows:
and the output of the j-th node in the hidden layer is given as follows:
where denotes the transfer function for the hidden layer, denotes the number of hidden nodes, denotes the bias in the hidden layer, and denotes the weight between the j-th node in the hidden layer and the i-th node in the input layer.
The j-th output of the neural network is given as follows:
where denotes the transfer/activation function for the output layer, denotes the number of hidden nodes, denotes the bias in the output layer, and denotes the weight between the j-th node in the output layer and the i-th node in the hidden layer.
It has been proved that the three-layer neural network is capable of approximating any smooth nonlinear function in a compact domain to an arbitrary accuracy [37]. Given that the structural complexity indicates the over-fitting issue, the above three-layer structure is adopted in the proposed approach without increasing the layers to improve the generalization of the model.
To eliminate the effects of inertial force, unknown disturbance and uncertainty from the output of the force sensor, it is helpful to build the model of the force sensor. In the model, the state information of movement will be utilized as the input of the model while the force output of the force sensor will be used as the output of the model. During the model design process, we seek to observe the relationship between the movements and the outputs of the force sensor, thus the model can be employed to compensate the output of the force sensor. By considering the mapping from the input to the output, it is natural to adopt the supervised learning method [38]. It is worth mentioning that the artificial neural-network-based approaches are reported in [37,39], in which the ANN-based methods are used to successfully classify the materials by the force sensor. In this paper, we propose the neural-network-based approach to model the force sensor in a supervised learning manner.
4. Experiment Studies and Result Analysis
In this section, experimental verification of the force compensation framework is performed. We conduct the uncertainties analysis of the force sensor during the dynamic palpation procedure and use the neural-network-based method to model the inertial force. Then the inertial force can be online estimated and canceled during the robotic palpation. The corrected force for the palpation is used to analyze the mechanical properties of the soft tissue, and thus can be used to detect the hard inclusions inside the soft tissue quantitatively. Static robotic palpation experiments are performed as well to verify the efficacy of the proposed approach.
4.1. Experiment Setup
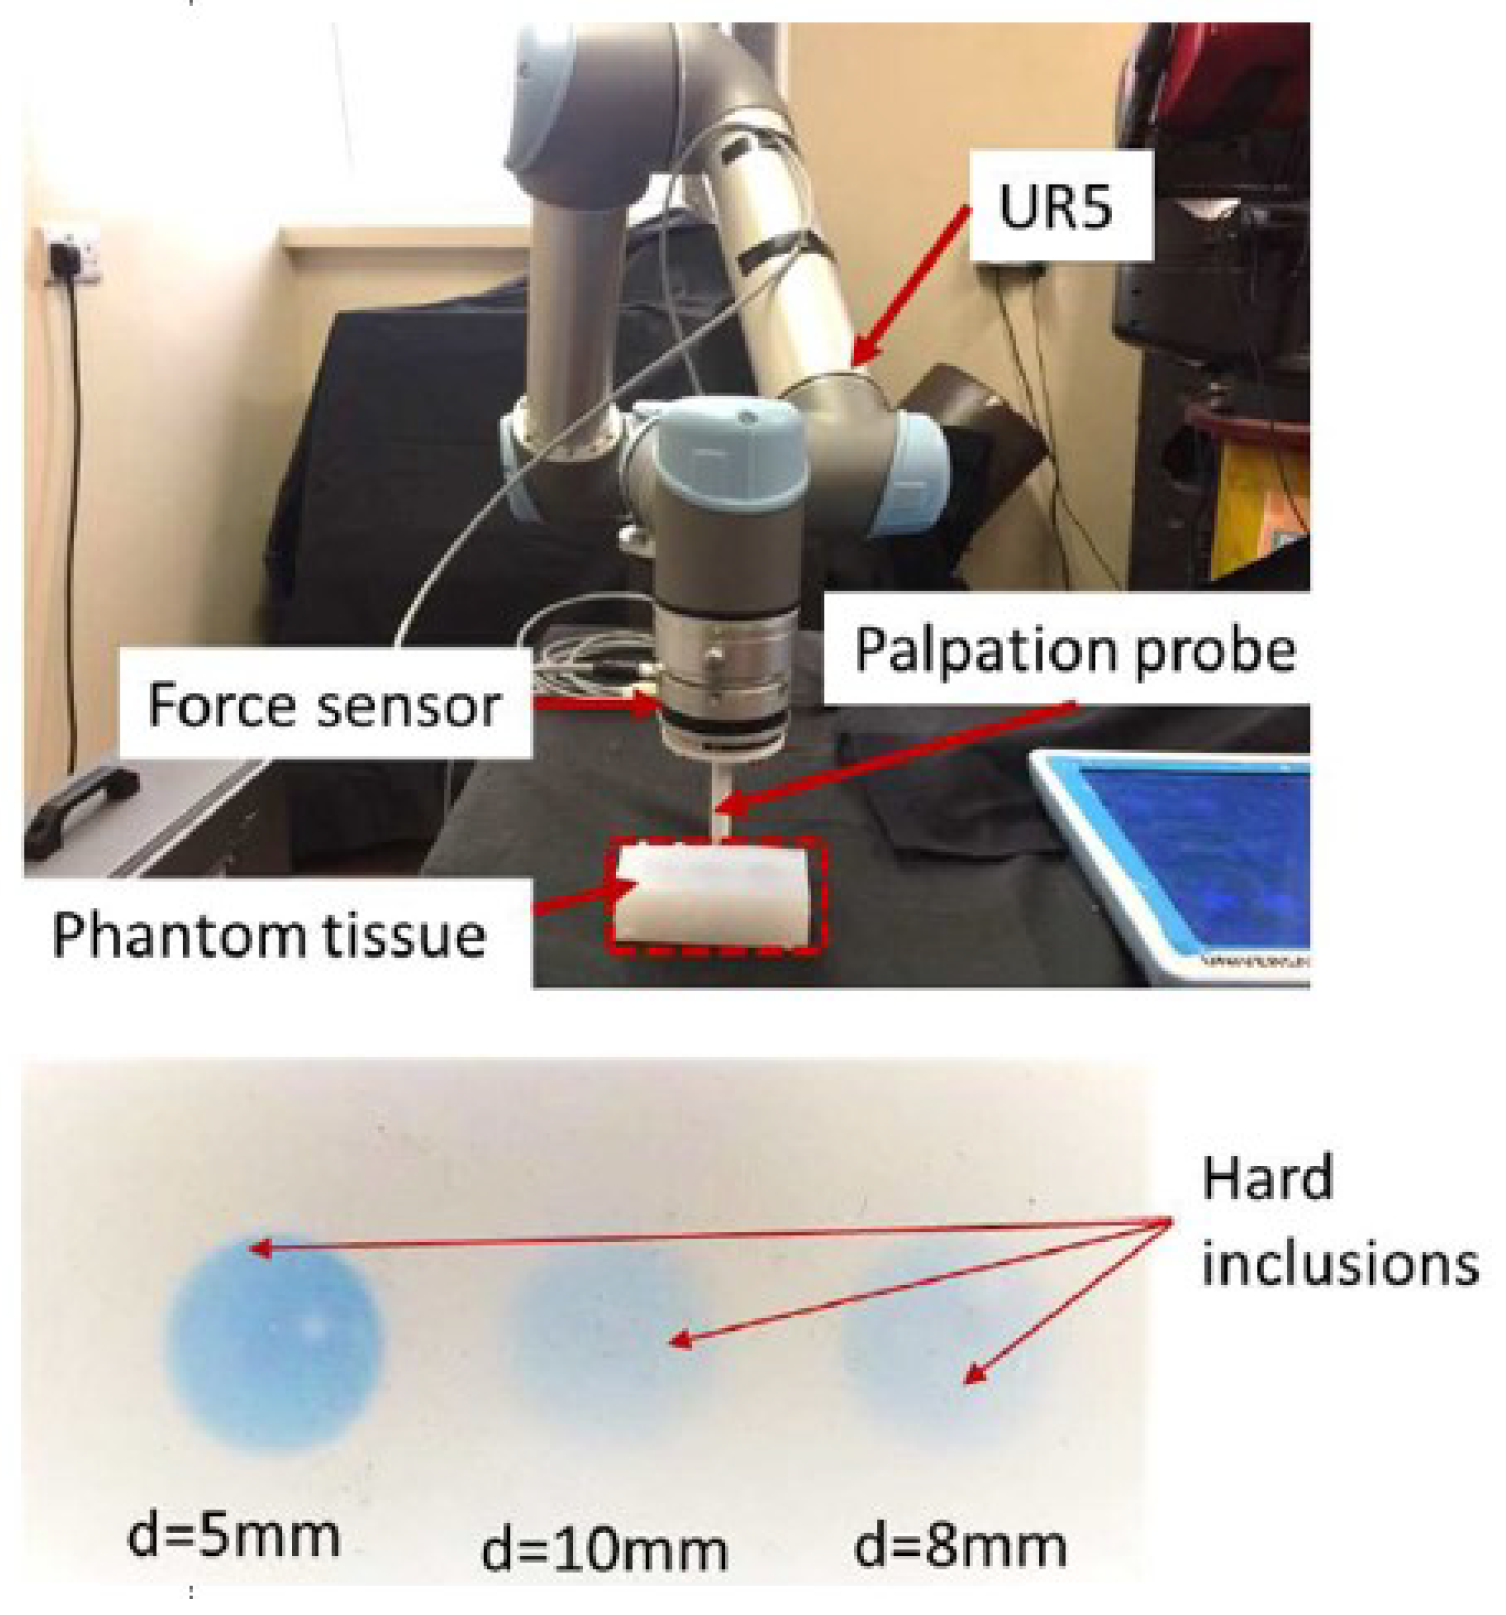
The experiments are performed with the UR5 robot (Universal Robots, Denmark), which is a collaborative robot used for various circumstances. Optoforce (Hungary-based) 6 Axis F/T force sensor () is attached to the end effector of the robot to measure the interaction force. A printer probe with a spherical indentation tip (radius 5 mm, weight 200 g—close to the weight of handled surgical tools) is designed and fixed with the force sensor to perform the palpation task. The soft tissue is made by silicone (Poisson’s ratio ), in which three hard inclusions (stiffer than the phantom tissue and can be considered as a tumor in the experiments) are embedded at different depths under the surface of the tissue (5 mm, 8 mm and 10 mm respectively). The robot and force sensor are running under the Robot Operating System (ROS) with the [40] for low-level control of the robot, and the Cartesian position of the robot is planned using the package. The experiments are conducted to palpate the soft tissue with four different setups: A: No hard inclusion (tumor); B: Hard inclusion (tumor) with 5 mm depth; C: Hard inclusion (tumor) with 8 mm depth; and D: Hard inclusion (tumor) with 10 mm depth (the depths denote the distance between the hard inclusion place and the surface of the soft tissue). The palpation task is performed along the Z axis of the robot, and the surface of the tissue is determined by various contact experiments, thus the indentation depth can be calculated from the Cartesian position of the robot. The whole experiment setup is shown in Figure 5.
4.2. Uncertainties of Force Measurement
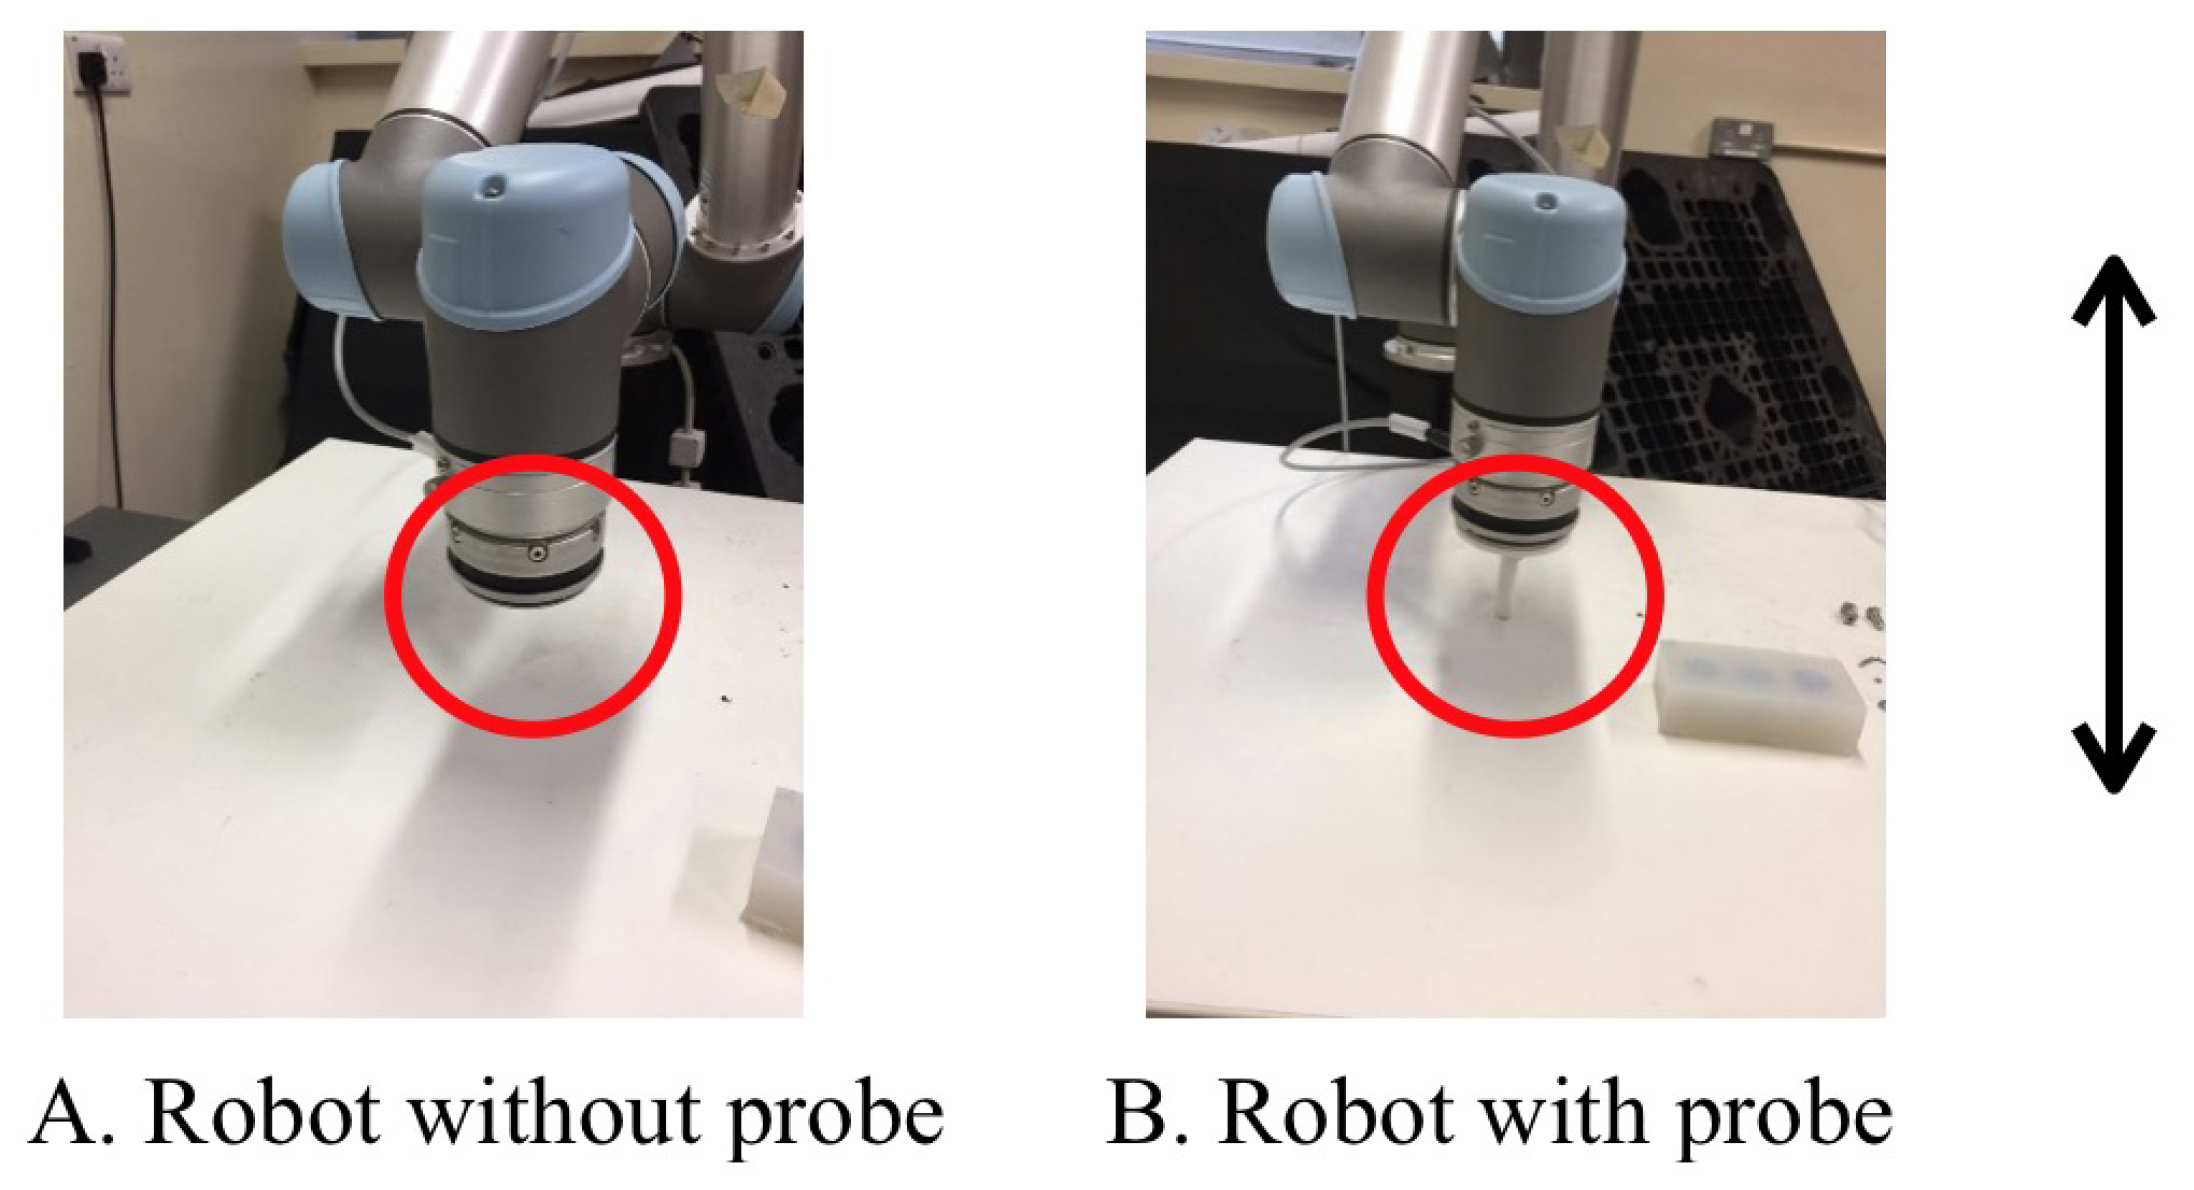
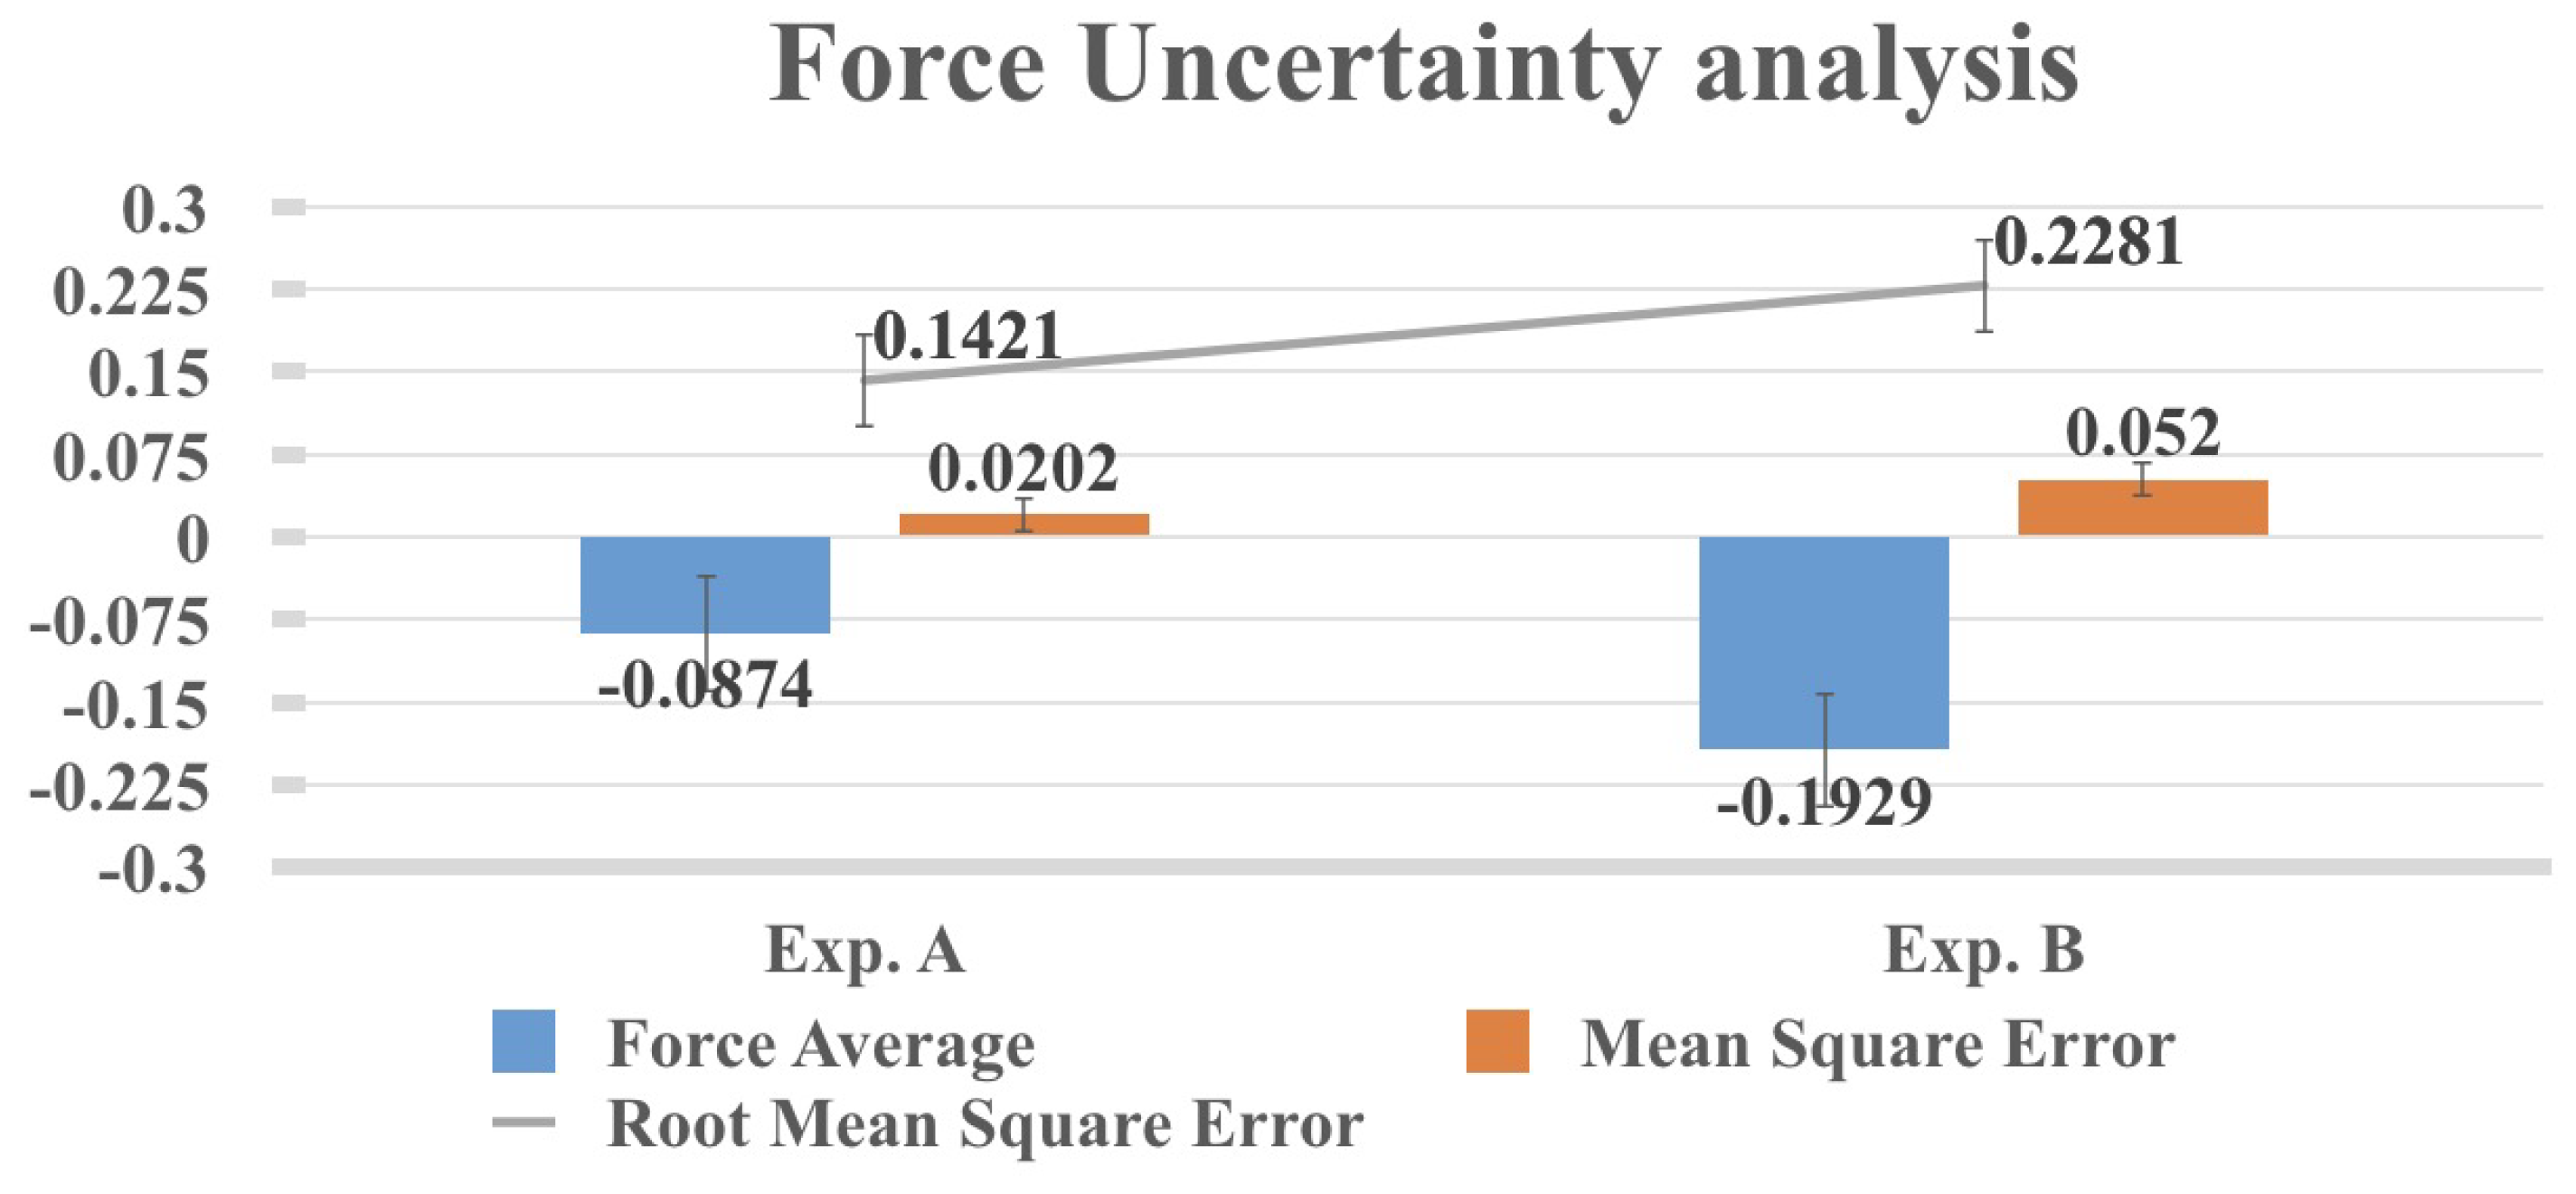
To deal with the uncertainties exist in the force sensor measurement, free motion experiments are performed, the free motion experiments mean that the robot is moving along the Z axis but without contacting any objects, in which the probe does not contact any object, and the robot is moving while performing the palpation task along the Z axis. The experiment setup is shown in Figure 6. Since the probe is not influenced by any contact force, the force sensor is supposed to only contain the inertial force and unavoidable noise, the expected mean of the noise is supposed to be N in the experiments. The effect of gravity of the probe is compensated by the initialization of the force sensor before the robot starts to move. Two different experiments are conducted to move the robot 15 times, and the force read from the sensor are recorded and analyzed as shown in Figure 7. It is noticed that even without contacting any object and with no probe attached on the sensor, a noticeable force (average force is N) is obtained from the sensor due to the noise and other force measurement uncertainties. When the probe is attached to the sensor, an even larger force is provided from the sensor (average force is N). These experimental results show that force measurement uncertainties exist during the robotic palpation task; when a probe is attached to the sensor, significant force measurement uncertainty is caused, which may further deviate the force measurement. Figure 8 shows the force response of 10 times that of free motion experiments with the probe attached on the force sensor, which needs to be compensated to get accurate force measurements. From Optoforce sensor datasheet, it is mentioned that the sensor measurement range is 200 N, and the resolution (typical) is mN, but all with static measurement considering sensor movement and the object attached on the sensor.
4.3. Static Palpation Experiments
In order to accurately estimate the YM of the soft tissue phantom (with and without hard inclusions), static experiments are conducted, in which the robot is moved to a predefined indentation depth. After the robot arrives at the indentation depth, the robot keeps the position until the force data becomes stable, then the palpation force data with different indentation depths are recorded and the respective YM is calculated. Table 1 shows the detailed experimental data and YM calculated. The interaction force (static), indentation depth and YM are presented under different setups with indentation depths ranging from 3–10 mm. The results of the static experiments can be used to accurately reflect the Young’s modulus of the soft tissue under different setups, which will also be used to verify the result of the proposed framework with force compensation. In this work, we mainly focus on the force measurement uncertainties caused by the dynamic robotic palpation procedure, and the static experimental results are used to verify the proposed compensation framework. From the results presented from Table 1, we noticed that the YM of soft tissue without hard inclusion is quite small. The one with a hard inclusion at a depth of 5 mm is the biggest, since the distance between the inclusion to the surface of the soft tissue is small, which provides a bigger interaction force during the palpation. Similarly, the YM of the one with a hard inclusion embedded at 8 mm depth is smaller than the one at the depth of 5 mm. It is interesting that the YM of the setup in which the hard inclusion is embedded at 10 mm depth is bigger than the one at 8 mm depth, but always smaller than the one at 5 mm depth. It might be caused by the position of the hard inclusion at 10 mm depth, as it is arranged in the middle of the soft tissue phantom and the YM might be affected by the tensions from both sides. Besides, the distribution of the material for soft tissue phantom might not be the same at each point of the tissue.
4.4. Neural-Network-Based Force Compensation of Robotic Palpation
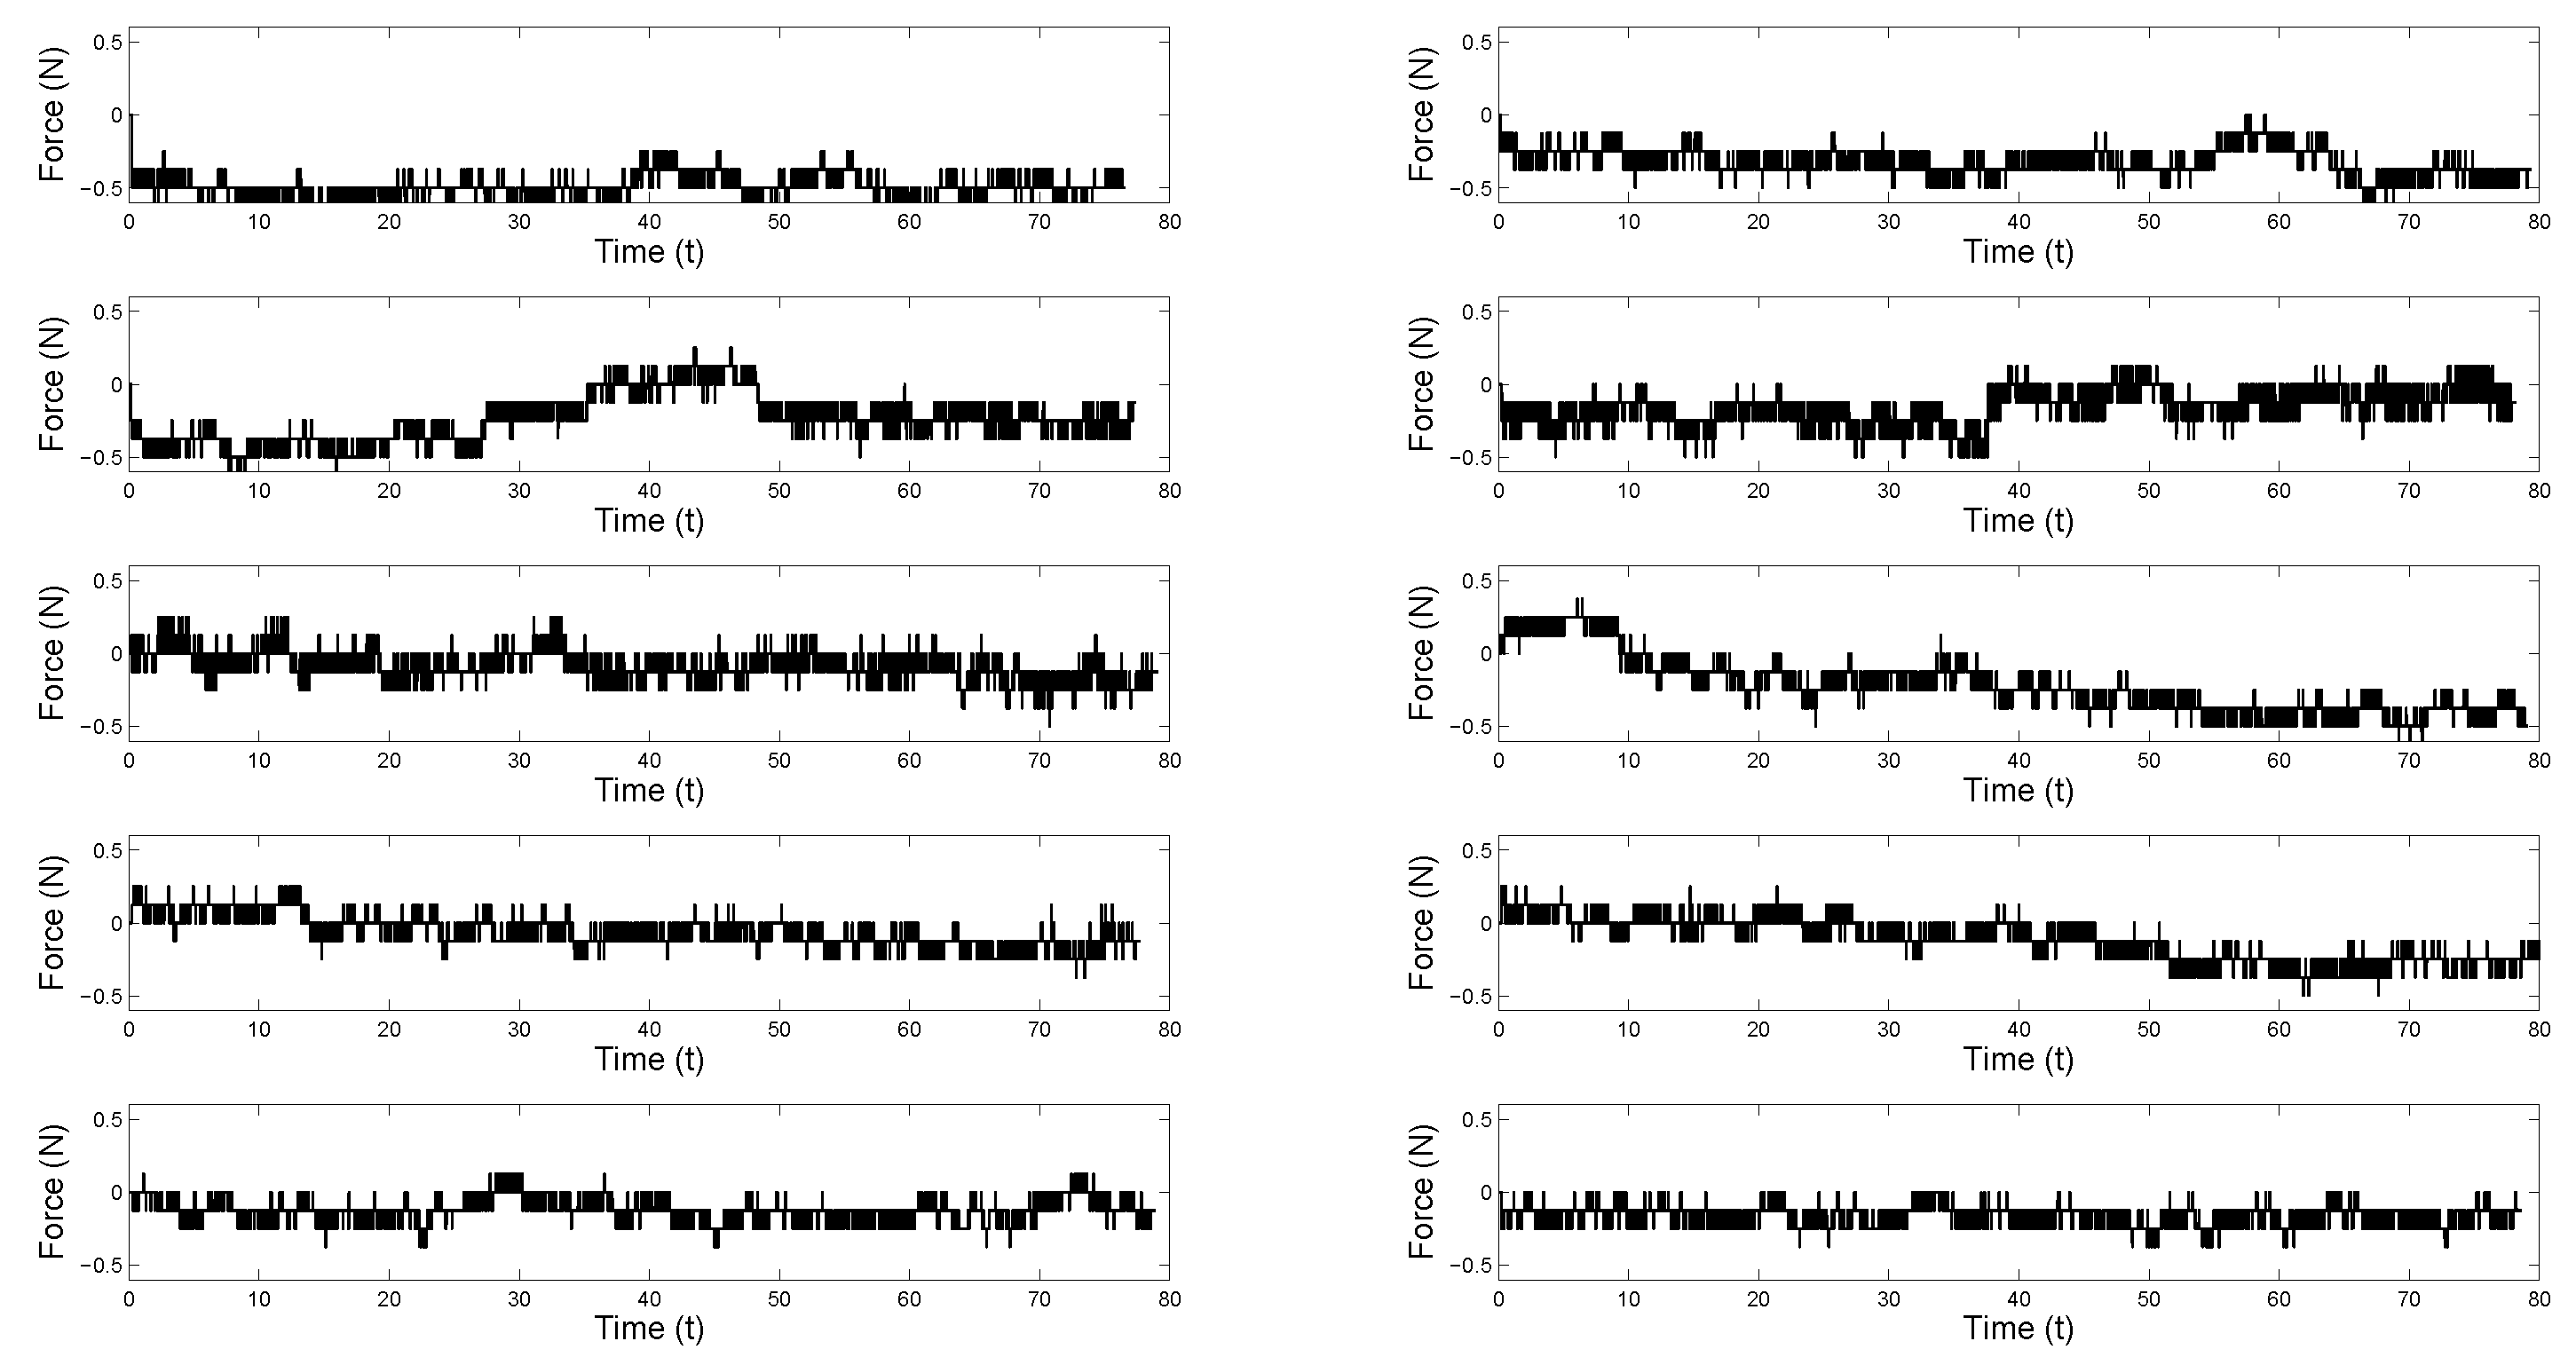
Besides determining the structure of the neural network model, the training process is also important to build a proper model and the training data should be selected carefully. In addition, the training process should be designed in a simplified way to provide for the concerns of the real application. In the proposed approach, the training data is generated by the free movement of the force sensor without any touch on the tip. However, non-negligible noise is found during the movement, which makes the data hard to analyze. To address the random noise, the same free movement experiments are conducted 10 times and then we use the average of those data to train the neural network model. The data of the 10 experiments can be viewed in Figure 8 and the average of the data can be viewed in Figure 9. It can be found that after averaging all of the 10 experiments, the force response in Figure 9 is much smoother than those in Figure 8.
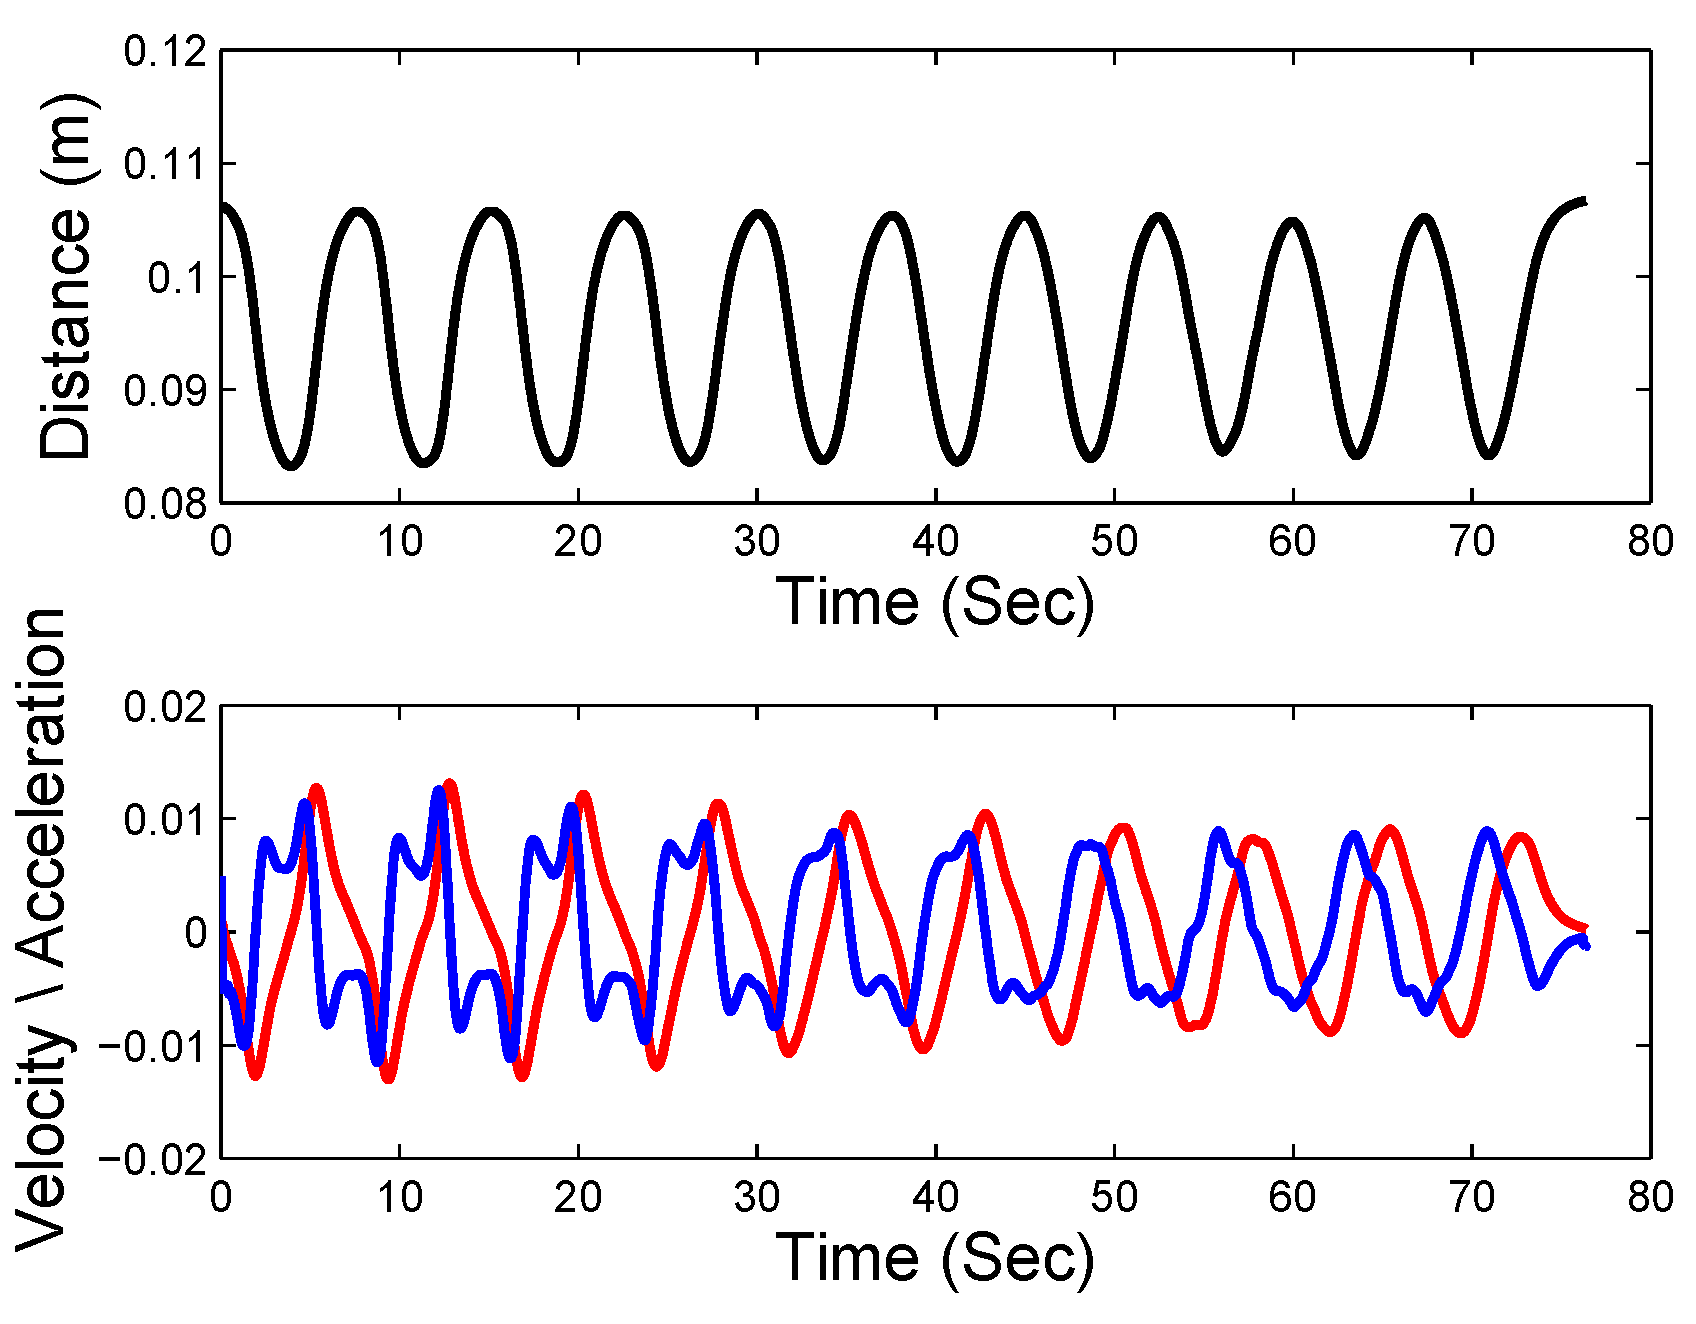
From the movements of the force sensor, the velocity and acceleration of the movements can be calculated by the differential of the distance according to time, which are very important information of the movements. The values of the distance, velocity, and acceleration can be viewed in Figure 10. It should be pointed out that a moving average process is conducted on those values (the distance, velocity, and acceleration) to make them more smooth, which will further make the obtained model more robust.
To train the neural network model, the state variables such as the distance, velocity, and acceleration of the force sensor can be used as the training input while the force output of the force sensor will be used as the training target output. The purpose of the modeling is to establish the mapping from the states of the force sensor by the input and output data, as illustrated in Figure 11.
In the training process, 500 uniformly sampled data from the state variables and the force output are used as the training input and output. To make the modeling method easier to implement, we adopt only the velocity and acceleration of the force sensor as the training input instead of including the distance. The main reason is because the distance depends on the coordinates we choose while velocity and acceleration do not (the constant terms due to coordinate shift will disappear in the differentials of the distance according to time), which means the trained model can be used in different coordinates. In the neural network modeling, the number of input layer nodes is chosen as 2 since only the velocity and acceleration are used, the number of output layer nodes is chosen as 1, and the number of hidden layer nodes is chosen as 10. The number of hidden layer nodes is chosen experimentally to have enough approximation ability without increasing the complexity.
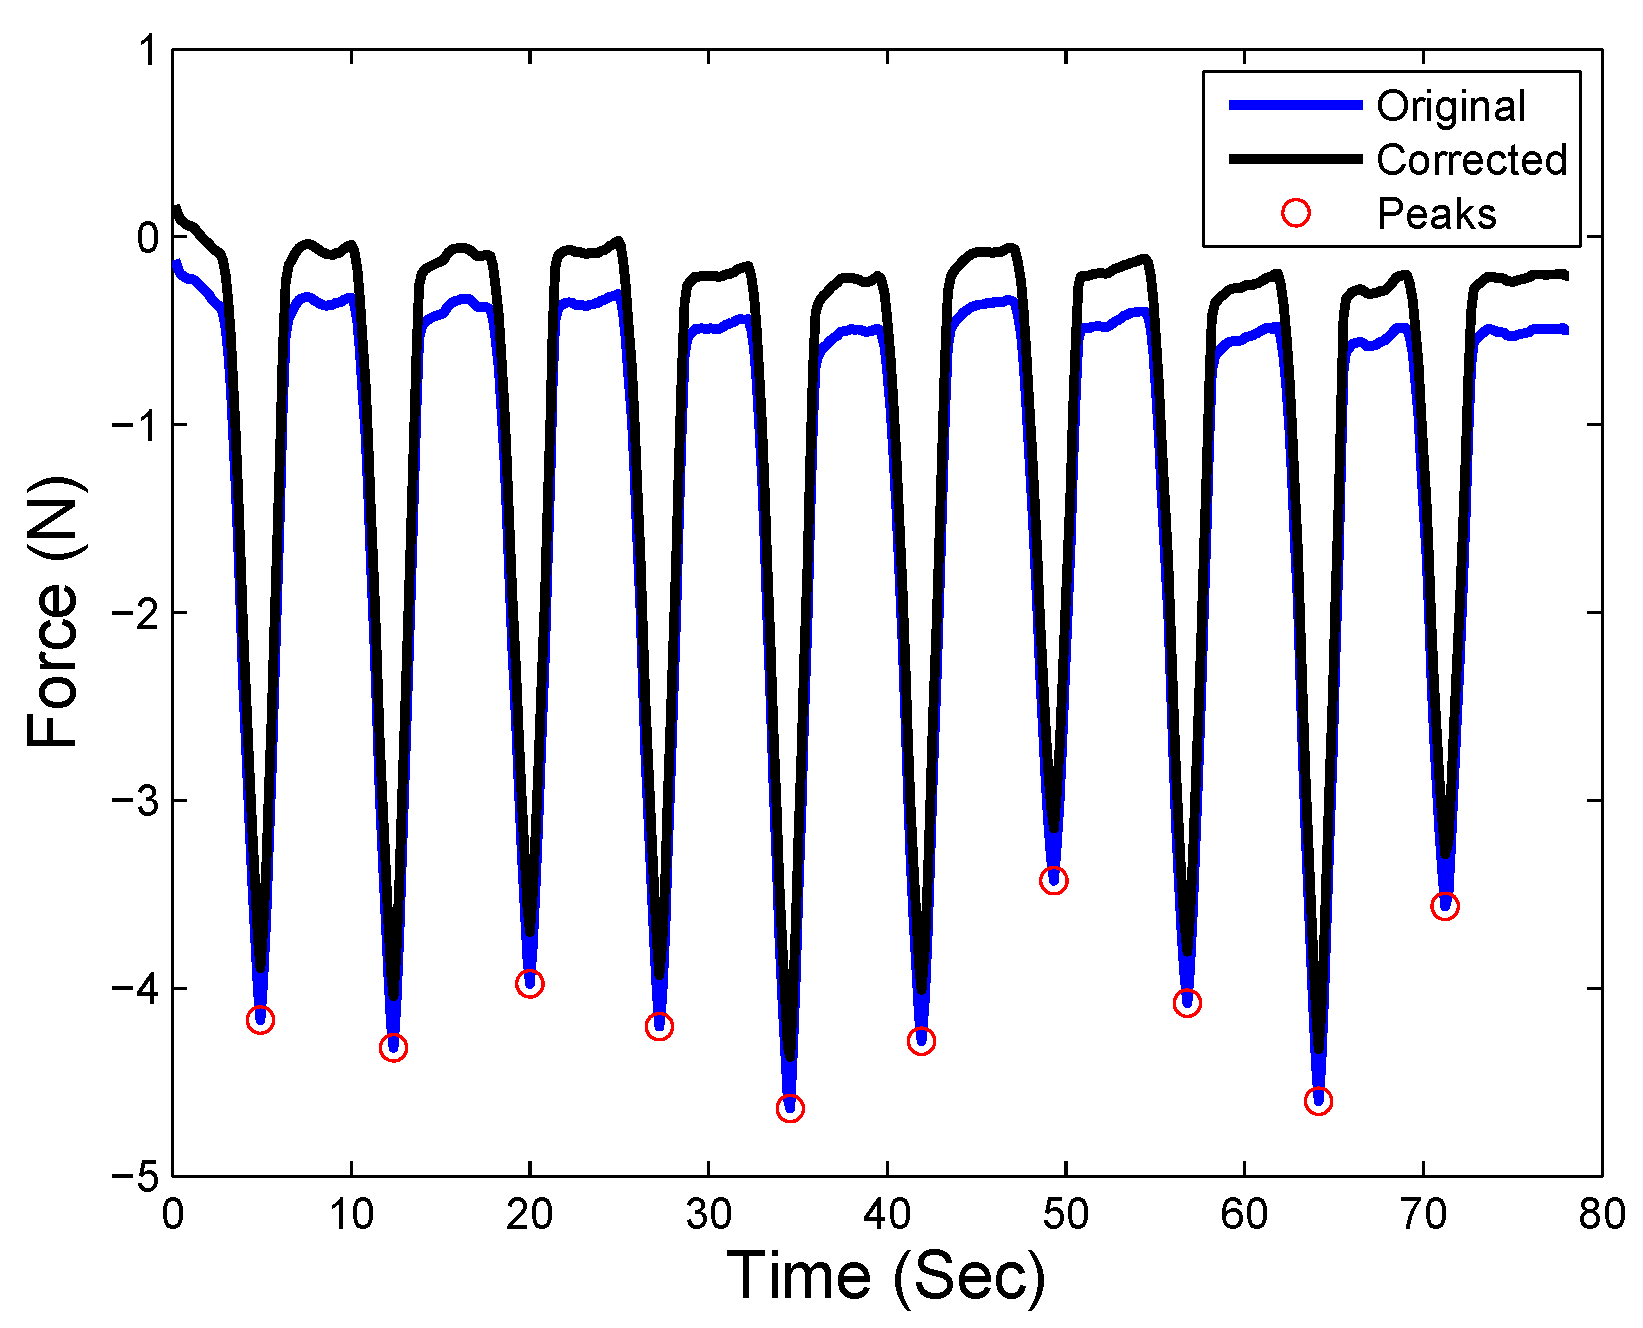
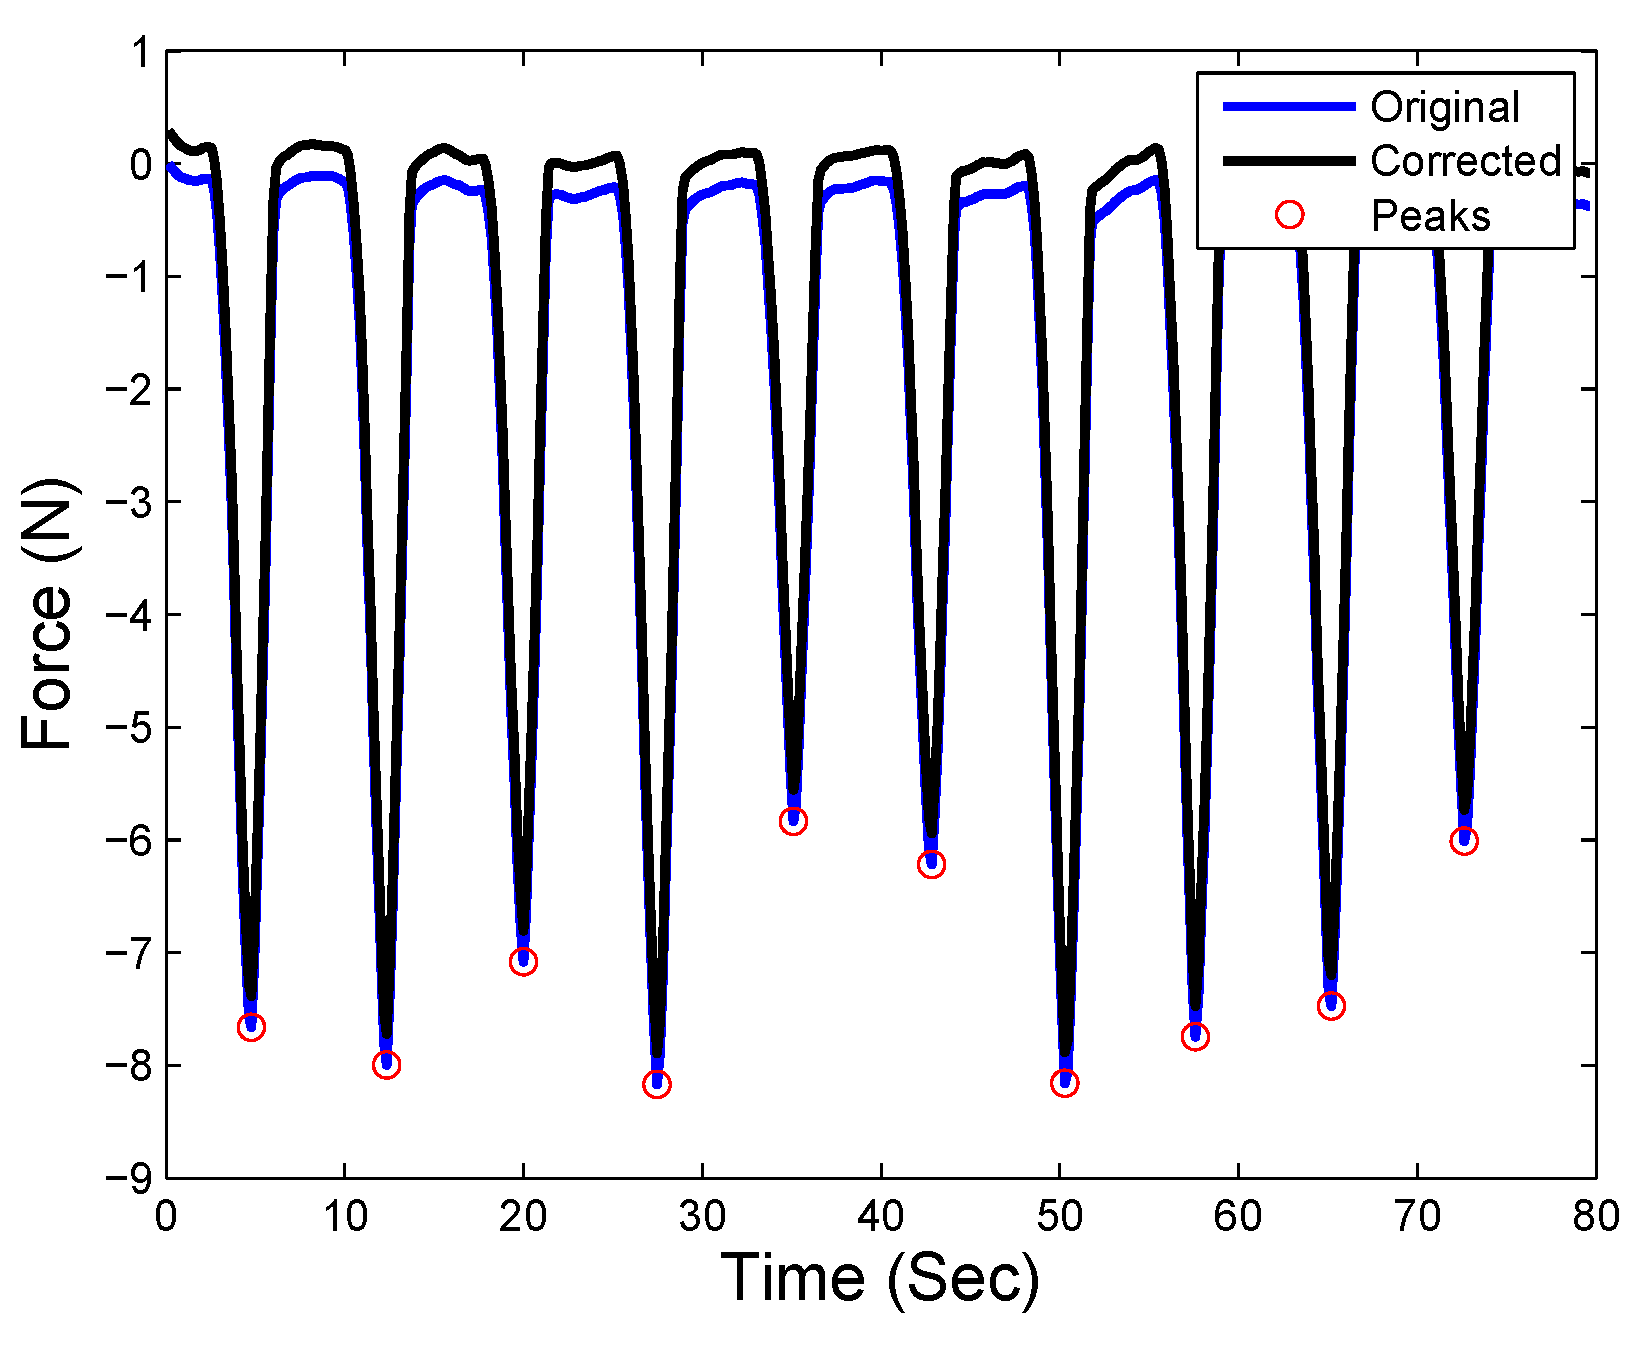
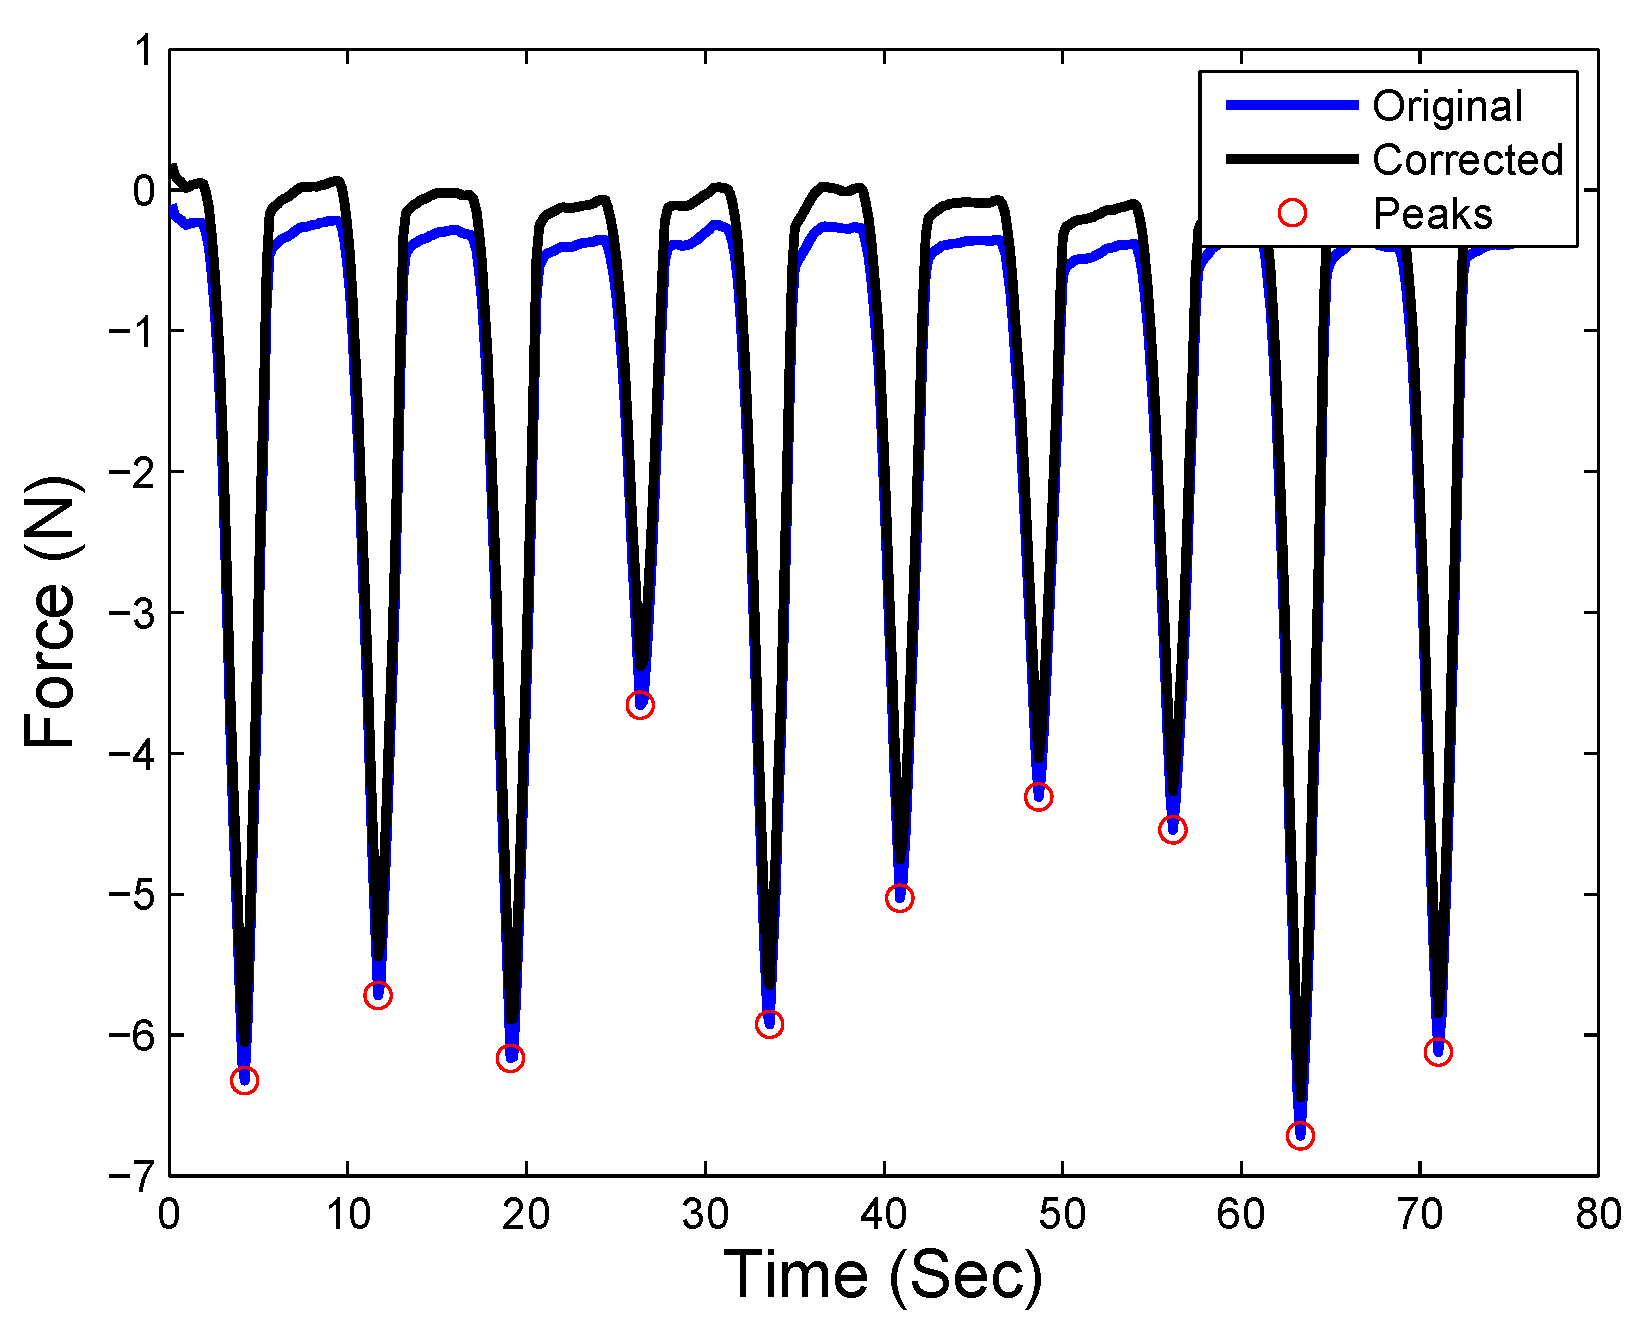
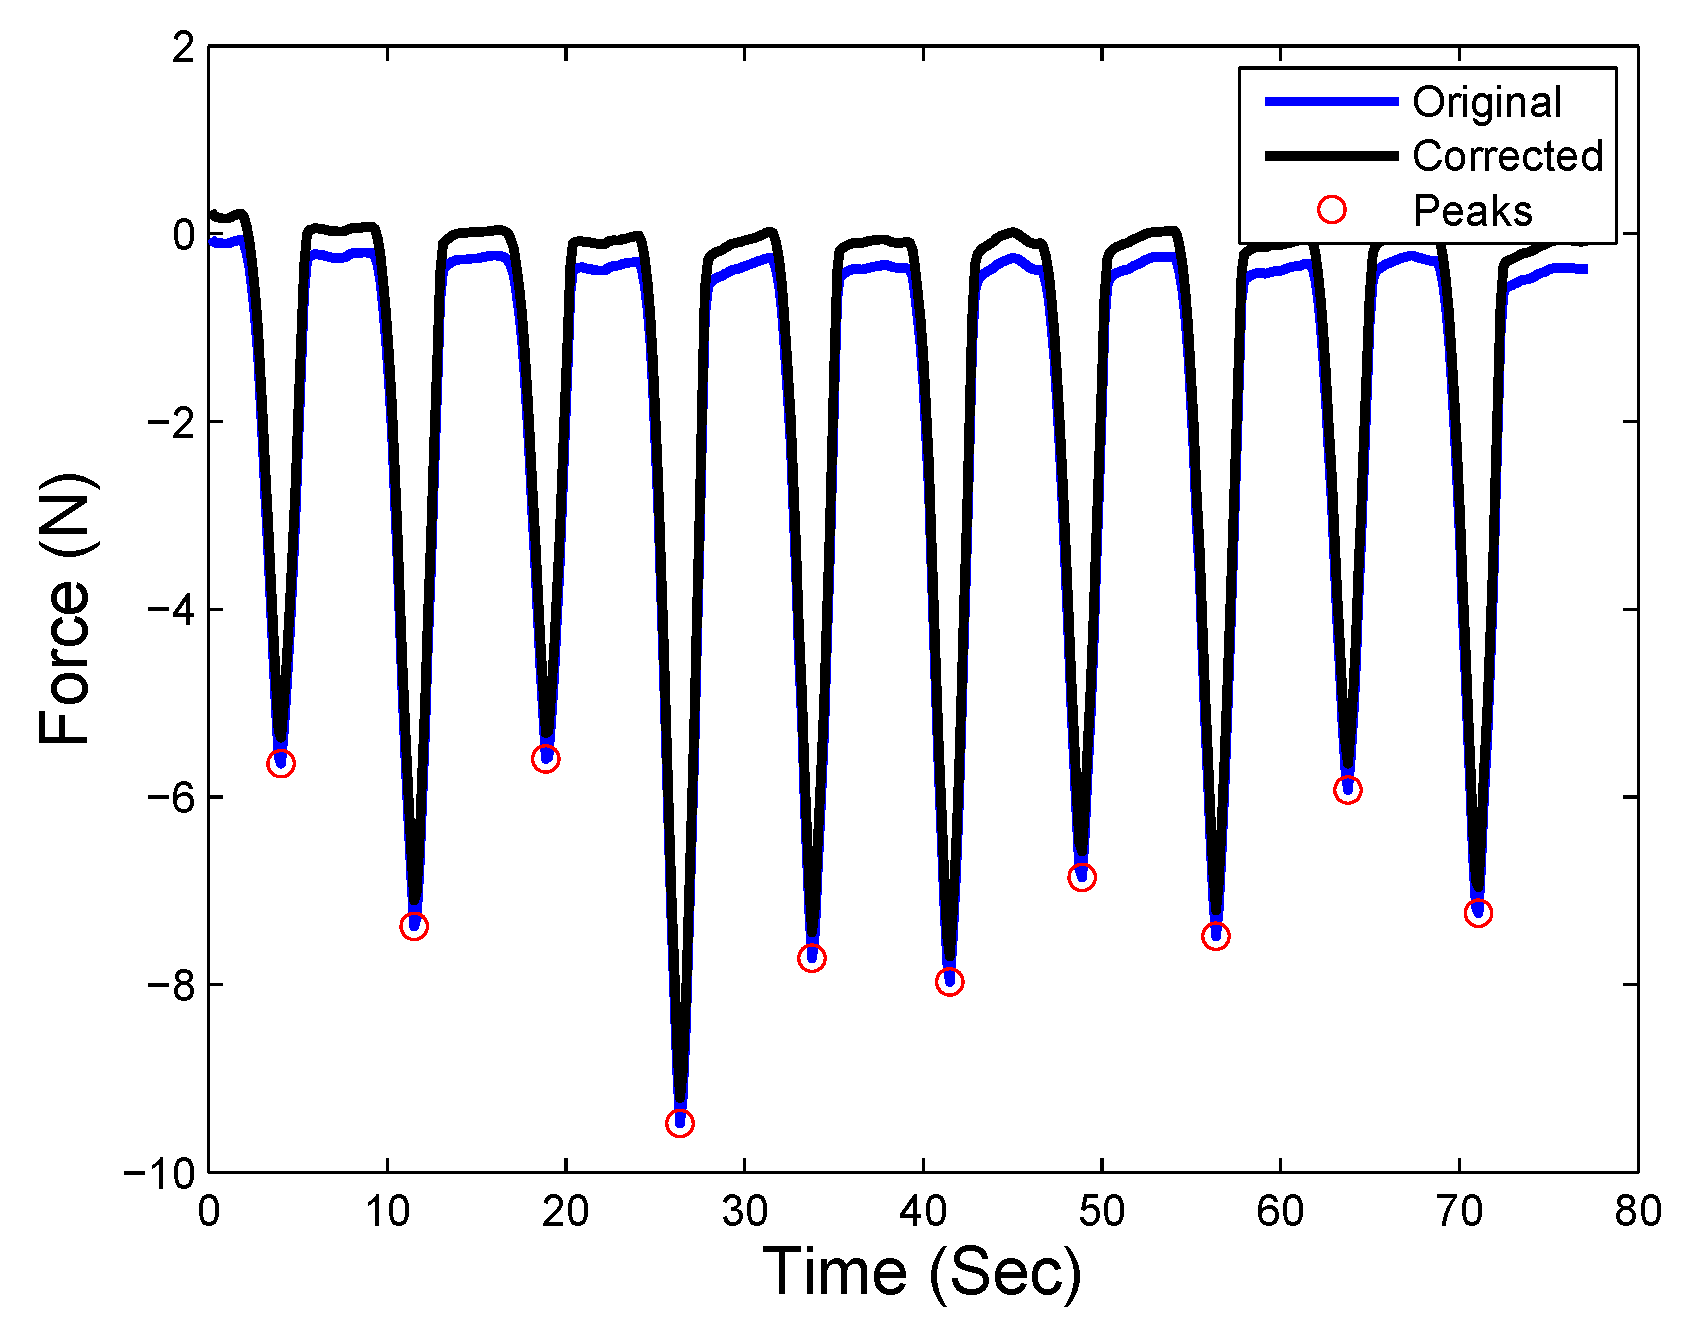
Once the neural network based model is built, the online force compensation framework can be performed during the robotic palpation task. The state information (velocity and acceleration) can be transmitted to the model and the estimated inertial force is given accordingly. Thus the actual interaction force during palpation can be obtained by compensating the inertial force . Figure 12, Figure 13, Figure 14 and Figure 15 present the original force and the compensated force during the palpation tasks. It can be observed that the original force read from the force sensor (in the blue curve) is below 0 during 10 palpation tasks. Even when the probe is moved up after each palpation task, the force read from the sensor does not reach 0 and significant inertial force can be noticed during the entire task. After the inertial force is compensated, the corrected force (the black curve, obtained by ) is able to reach 0 when each palpation task is finished and the probe is moving up without contacting any object. Accordingly, it is also noticed that the force peak points which mean the probe is contacting the soft tissue with indentation depth are also compensated to provide improved force measurements during robotic palpation tasks.
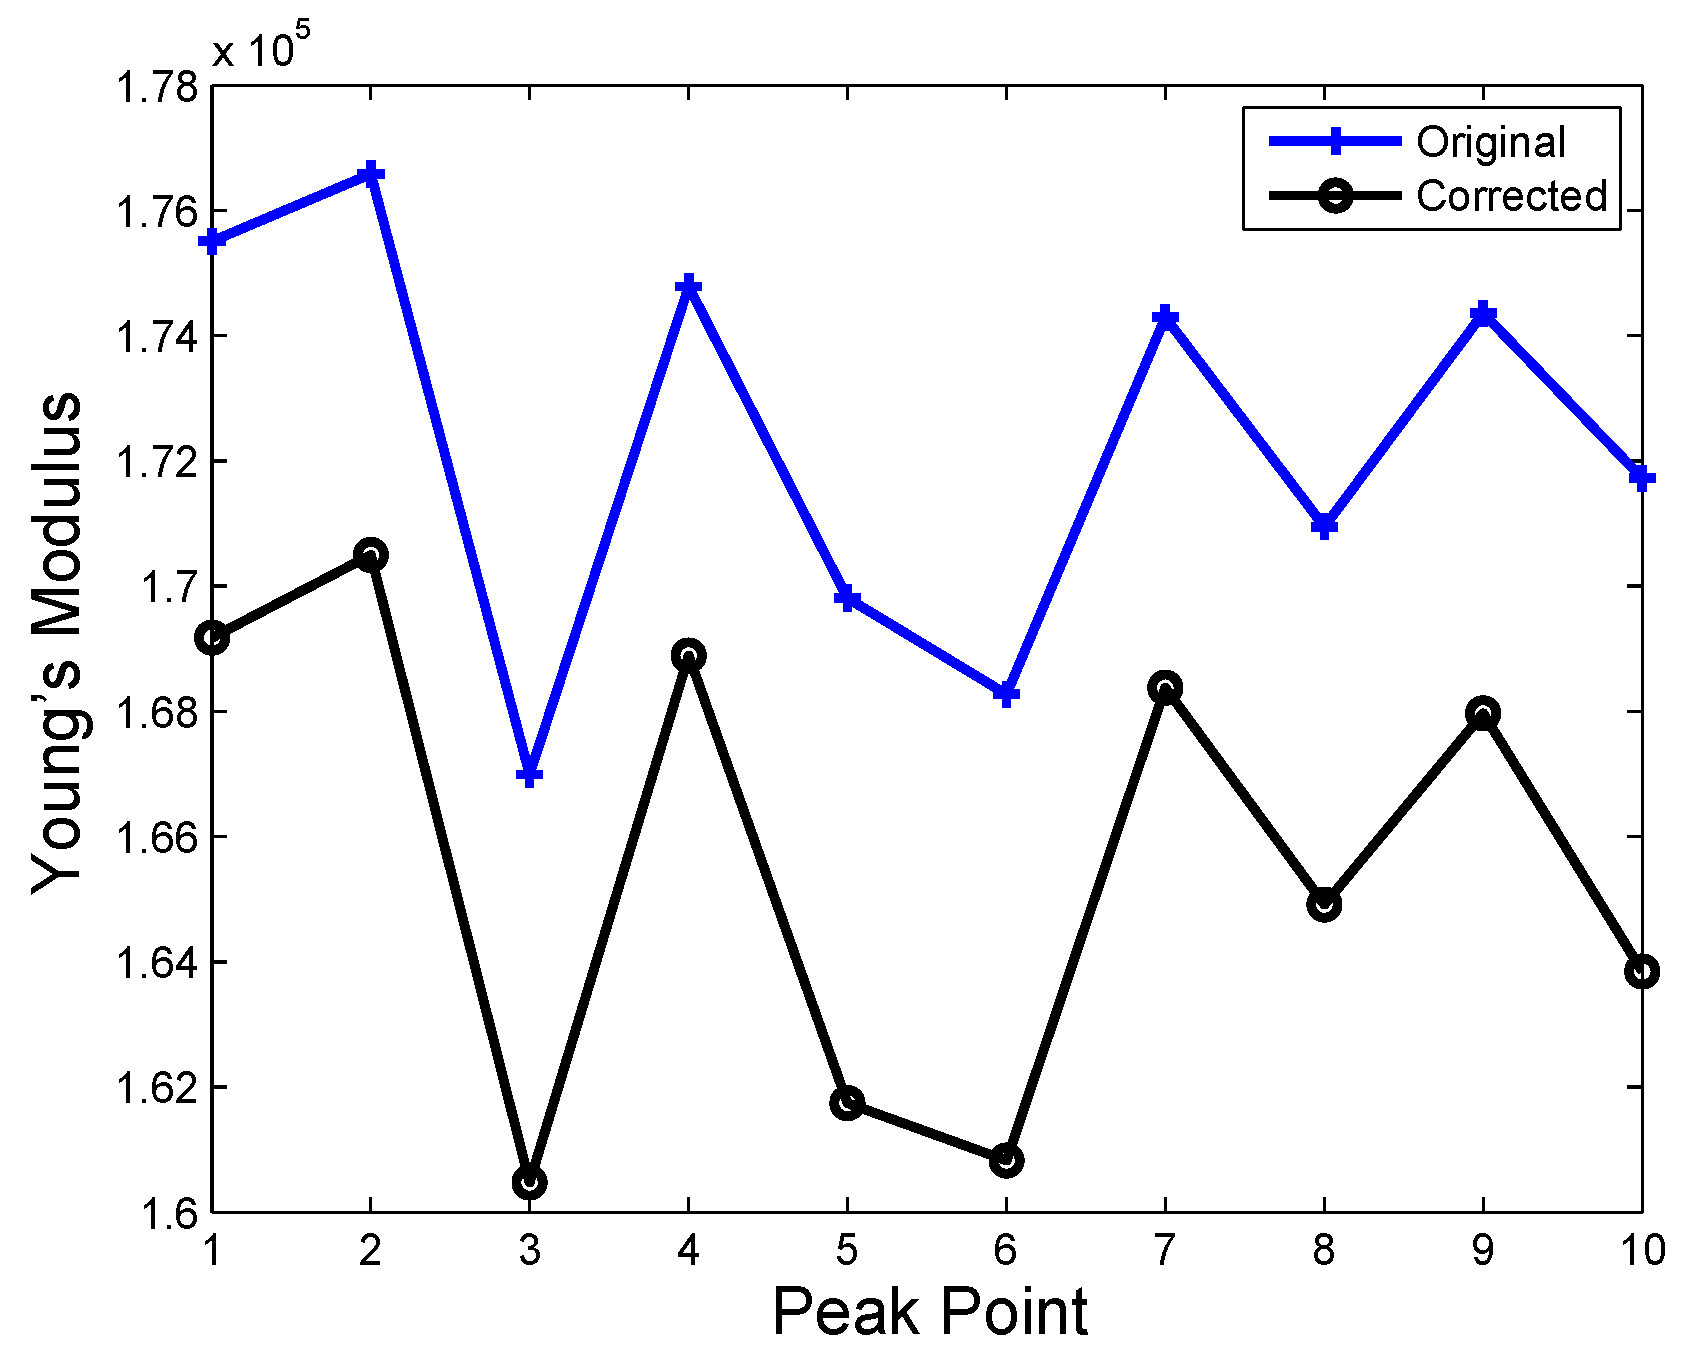
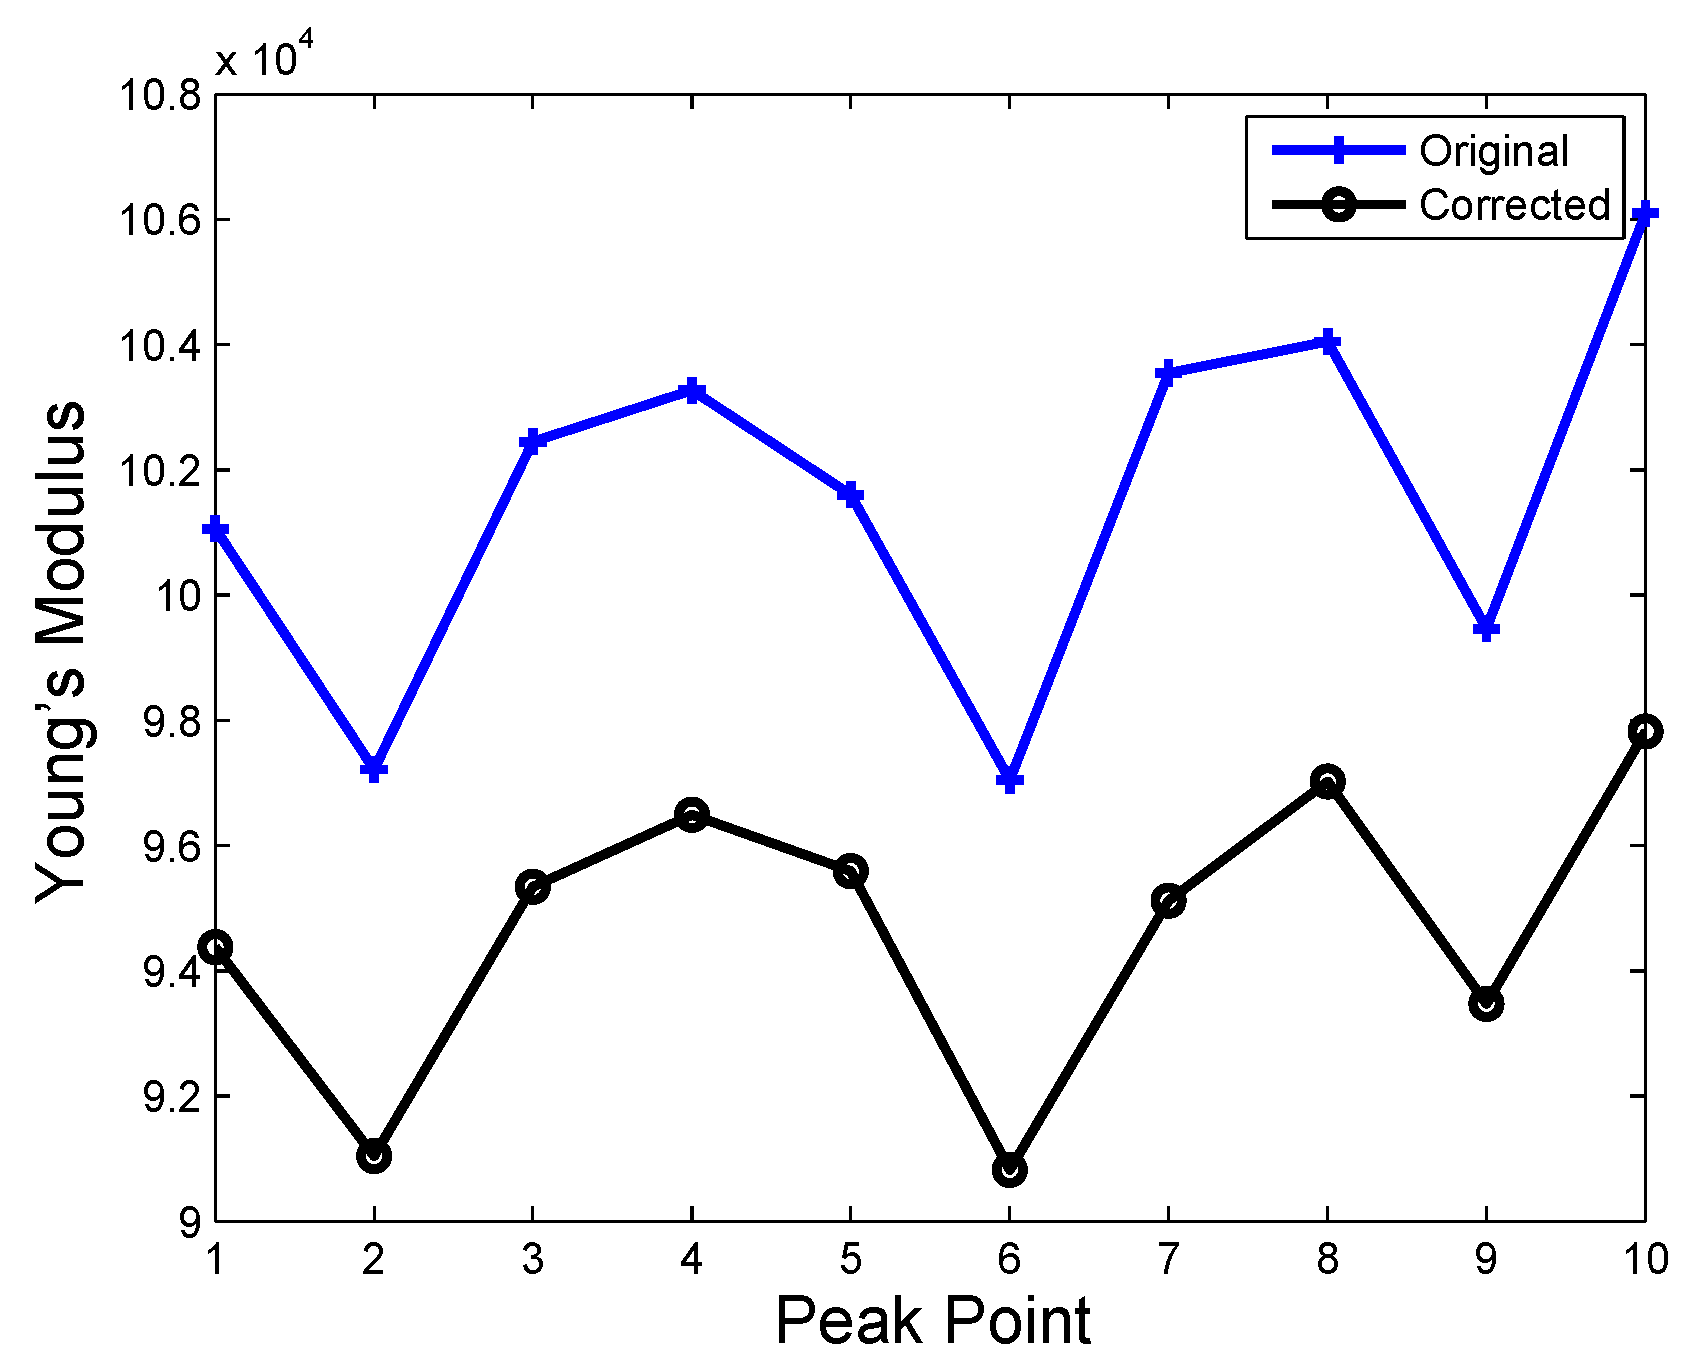
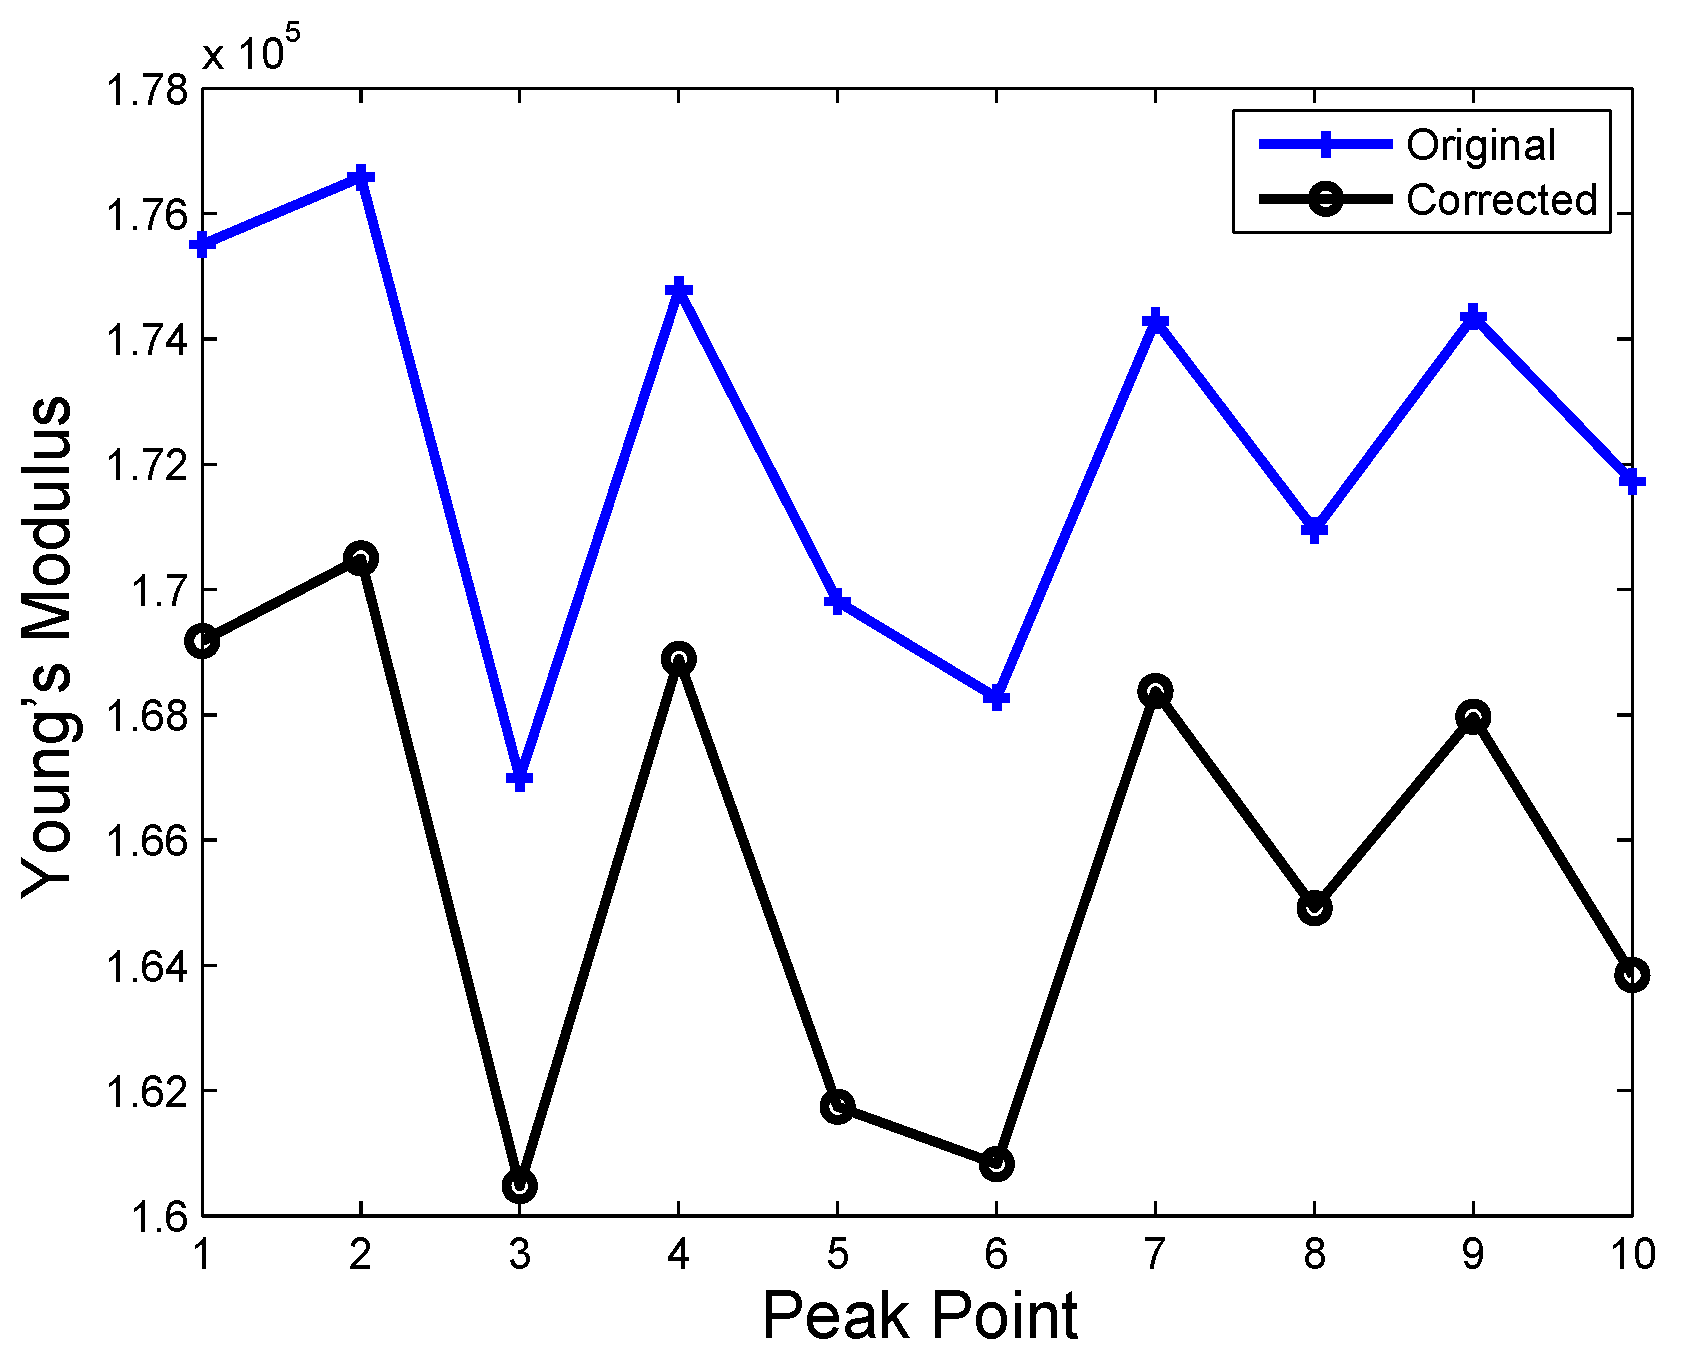
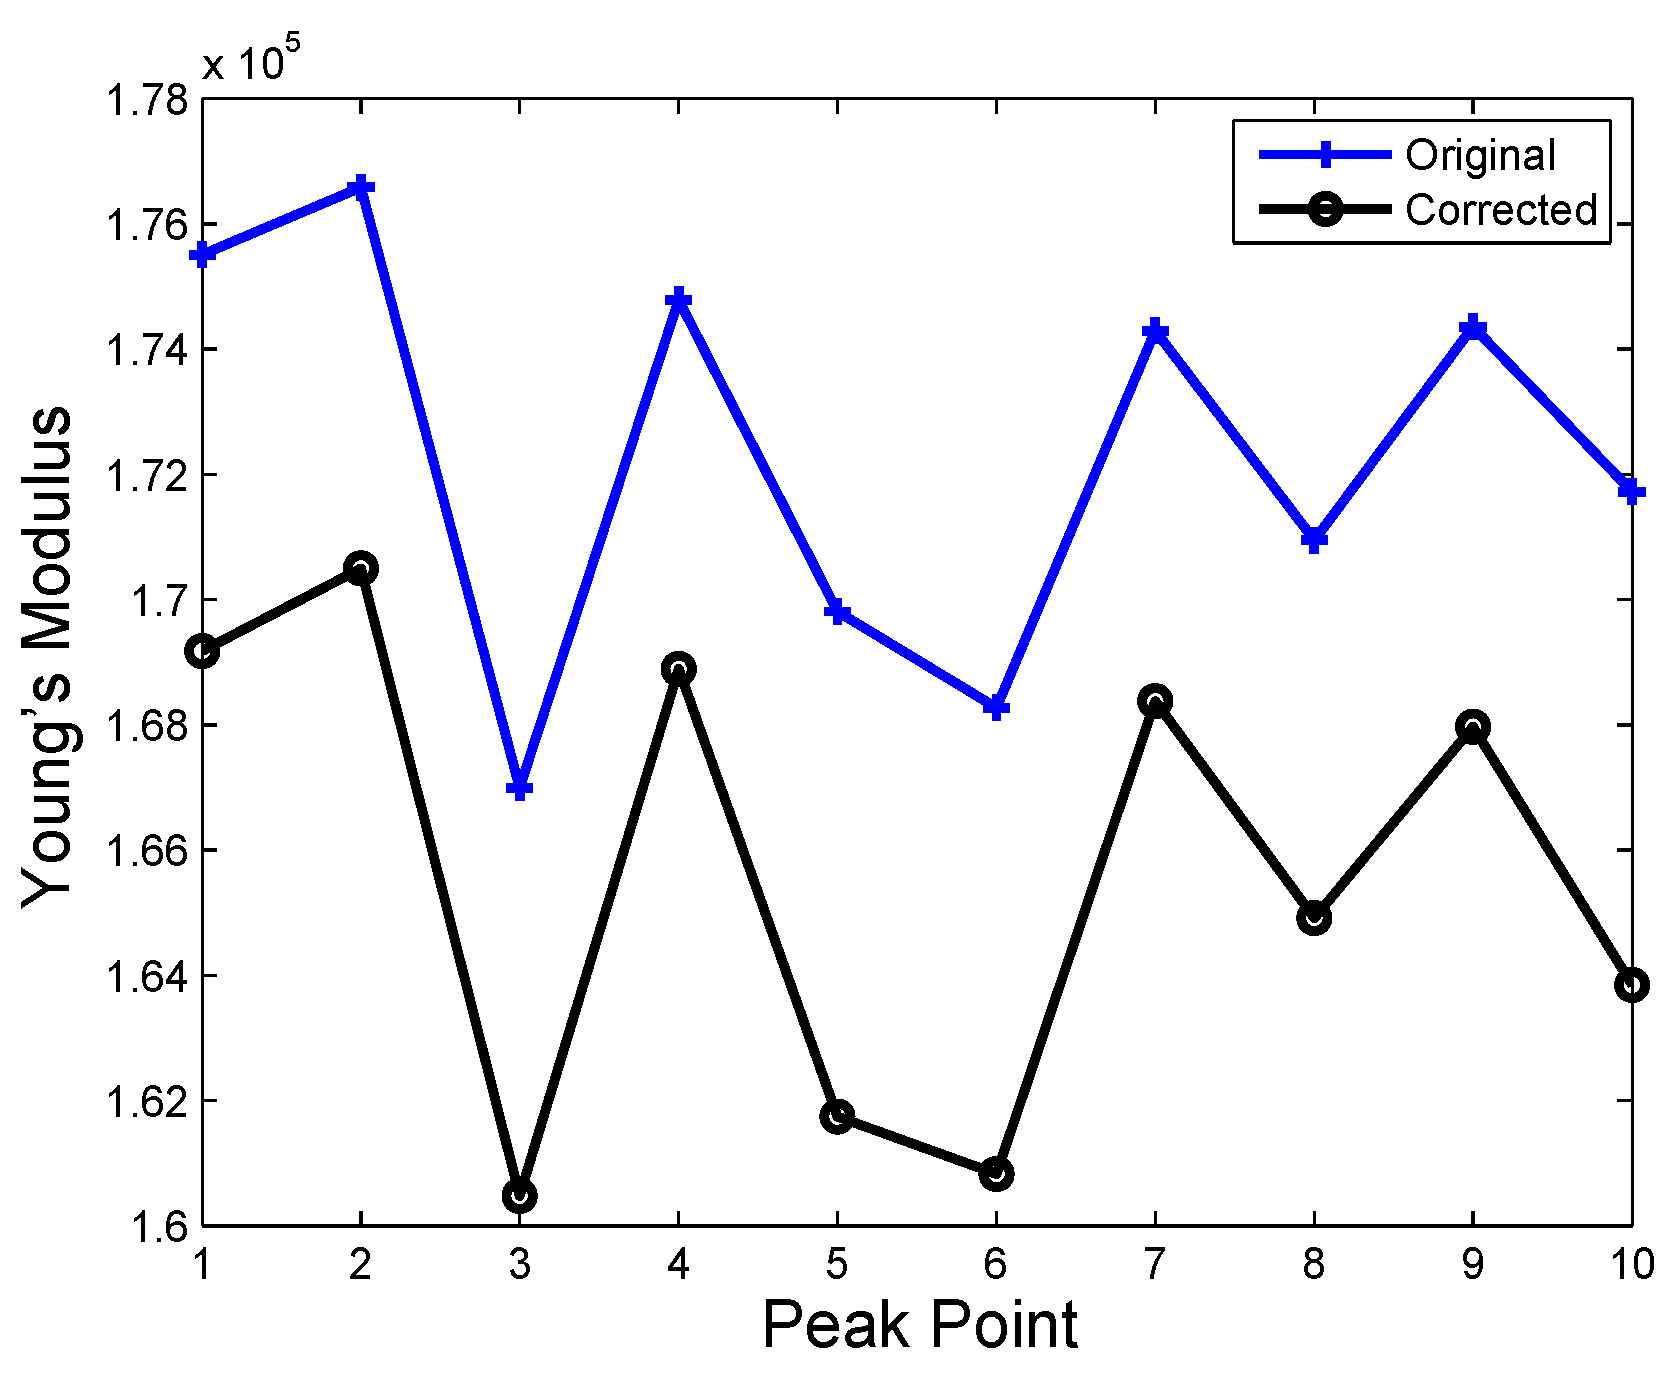
In addition, to further verify the effect of force correction in palpation, the YM analysis at those peak points are conducted since YM is an important aspect to be considered during robotic palpation [22]. For the purpose of comparison, the static experiments have been conducted under the same depth of hard inclusion. The YM from the static experiments is used as the reference value to reflect the stiffness of soft tissue in the palpation. The original and corrected YM at the peak points can be viewed in Figure 16, Figure 17, Figure 18 and Figure 19. The average original, corrected and static YM is also presented in Table 2. From Table 2, it can be found that the YM calculated by the corrected force data is more close to the static experiments, which verifies again the effectiveness of the proposed method.
In order to further demonstrate the improvement of force compensation approach in terms of YM in the previous experiments, a YM bias term (YMBT) is designed to present the difference of the original/corrected and static YMs as shown:
in which shows the difference between the original YM and static YM, meanwhile, indicates the difference between corrected YM and static YM. Since the static YM is used to indicate the real YM of the soft tissue in this paper, a smaller YMBT value means that the obtained YM is much closer to the real YM.
Table 3 provides the calculated YMBT of the experiments, it is noticed that after the utilization of the force compensation approach designed in the paper, the calculated YMs are improved for all the palpation cases as the is smaller than the , which further proves the efficiency of the proposed approach in robotic palpation.
5. Discussion
This paper firstly investigates the sensor measurement uncertainties in the surgical application of force based robotic palpation, and mainly focuses on the inertial force caused by the surgical tools and/or probe on the robotic system. The inertial force issue has been noticed and researched in the industrial robotic application, in which a tool with a certain payload is normally utilized. From the surgical application point of view, safety and accuracy are important, thus making inertial force analysis and avoidance critical. Although the sensory technique is developing quite fast, with high sensitivity and resolution, the uncertainties and the inertial force caused by the tools attached to the sensor cannot be ignored. Force is a principal factor for some surgical procedures such as robotic palpation, in which the force is used for the stiffness analysis of the soft tissue. However, such analysis would be affected by force uncertainties. We have performed several free motion robotic palpation experiments, and the significant force feedback indicates that inertial force is inevitable, which will affect the stiffness analysis of soft tissue, further possibly leading to the inaccurate detection of a tumor in robotic palpation. This free motion force information is used to model the inertial force, and a force compensation framework is proposed to cancel the inertial force during the robotic palpation task. In this paper, a neural-network-based approach is used to model the inertial force by considering the velocity and acceleration of the robot end effector.
From the experimental studies, it is seen that the inertial force affects the accurate analysis of the soft tissue stiffness. Since it is the first study of the inertial force in surgical robots, the approach developed in this paper can also be extended to other surgical applications, such as bilateral teleoperation for RAS. In bilateral teleoperation, the whole operation is a dynamic procedure, and the inertial force is caused once the robot is teleoperated either with a small or long distance. Using the force compensation framework developed in this paper, the operator can obtain enhanced force feedback from the operative site, thus guaranteeing safe and accurate surgical operations.
It is also worth mentioning that the proposed approach is simple to implement in real applications when compared with other approaches like a Kalman filter. To train the inertial force compensation model, one only needs to obtain data from the free motion experiments. The collected data will be used to train the neural network. Then, the trained neural network is utilized to compensate for the inertial force during the robotic palpation in an online manner.
Future Work
The future work plan will focus on the following topics:
- In vivo experiments with robotic palpation setup will be performed to present a real clinical environment.
- Various modeling approaches with different features (force, mass, position, velocity acceleration etc.) will be conducted to evaluate the performance of inertial force modeling.
- To extract more information from the dynamic palpation process, advanced modeling approaches that favor the time-series data like recurrent neural network (RNN) will be investigated to further improve the compensation performance.
- Heterogeneity of the tissue will be considered and various sample of tissues will be used to verify the proposed approach.
6. Conclusions
In the surgical application, the dedicated tool-tissue interaction is crucial from both the operation and the safety point of view regarding the sensing techniques. Due to many constraints (size, sterilization, bio-compatibility etc.), the surgical tools or probes are used to contact the operative site and to challenge the force measurement. In this paper, we firstly analyze the inertial force during dynamic robotic-assisted palpation and propose a force compensation framework to reduce the influence of the inertial force with a neural-network-based modeling approach. Through the robotic palpation experiments and YM analysis of the soft tissue, it is observed that there is inertial force existing during the palpation procedure. After the force compensation with neural-network-based modeling, an improved force measurement is obtained. The YM analysis of the soft tissue presents a proposed framework that benefits the palpation tasks, and can be further extended to other robotic-assisted surgical procedure with high tool-tissue force requirements.
Author Contributions
J.G. and H.R. designed the study and conceptualize the methodology. J.G. drafted this manuscript and B.X. & H.R. improved the manuscript; B.X. and J.G. performed the experiment; H.R. supervised the project and provided funding & lab support. All authors have read and approved the manuscript.
Funding
This work is supported by Singapore NMRC Bedside & Bench under grant R-397-000-245-511 and National Key Research and Development Program, The Ministry of Science and Technology (MOST) of China (No. 2018YFB1307703) awarded to Hongliang Ren, the National Natural Science Foundation of China (No. 61803103) awarded to Jing Guo.
Conflicts of Interest
The authors declare no conflict of interest.
References
- Fisher, T.; Hamed, A.; Vartholomeos, P.; Masamune, K.; Tang, G.; Ren, H.; Tse, Z.T.H. Intraoperative magnetic resonance imaging conditional robotic devices for therapy and diagnosis. Proc. Inst. Mech. Eng. Part H J. Eng. Med. 2014, 228, 303–318. [Google Scholar] [CrossRef] [PubMed]
- Ren, H.; Lim, C.M.; Wang, J.; Liu, W.; Song, S.; Li, Z.; Herbert, G.; Tse, Z.T.H.; Tan, Z. Computer assisted transoral surgery with flexible robotics and navigation technologies: A review of recent progress and research challenges. Crit. Rev. Biomed. Eng. 2013, 41, 365–391. [Google Scholar] [CrossRef] [PubMed]
- Zhou, Y.; Ren, H.; Meng, M.Q.-H.; Tse, Z.T.H.; Yu, H. Robotics in natural orifice transluminal endoscopic surgery. J. Mech. Med. Biol. 2013, 13, 1350044. [Google Scholar] [CrossRef]
- Osa, T.; Sugita, N.; Mitsuishi, M. Online Trajectory Planning and Force Control for Automation of Surgical Tasks. IEEE Trans. Autom. Sci. Eng. 2018, 15, 675–691. [Google Scholar] [CrossRef]
- Lederman, S.J.; Klatzky, R.L. Sensing and displaying spatially distributed fingertip forces in haptic interfaces for teleoperator and virtual environment systems. Presence Teleoperators Virtual Environ. 1999, 8, 86–103. [Google Scholar] [CrossRef]
- Girão, P.S.; Ramos, P.M.; Postolache, O.; Pereira, J.M. Tactile sensors for robotic applications. Measurement 2013, 46, 1257–1271. [Google Scholar] [CrossRef]
- Tiwana, M.I.; Redmond, S.J.; Lovell, N.H. A review of tactile sensing technologies with applications in biomedical engineering. Sens. Actuators A Phys. 2012, 179, 17–31. [Google Scholar] [CrossRef]
- Konstantinova, J.; Jiang, A.; Althoefer, K.; Dasgupta, P.; Nanayakkara, T. Implementation of tactile sensing for palpation in robot-assisted minimally invasive surgery: A review. IEEE Sens. J. 2014, 14, 490–501. [Google Scholar] [CrossRef]
- McKay, D.; Blake, G. Optimum incision length for port insertion in laparoscopic surgery. Ann. R. Coll. Surg. Engl. 2006, 88, 78. [Google Scholar] [CrossRef]
- ANSI/AAMI ST79. Comprehensive Guide to Steam Sterilization and Sterility Assurance in Health Care Facilities; Association for the Advancement of Medical Instrumentation: Arlington, VA, USA, 2010. [Google Scholar]
- Beccani, M.; Di Natali, C.; Sliker, L.J.; Schoen, J.A.; Rentschler, M.E.; Valdastri, P. Wireless tissue palpation for intraoperative detection of lumps in the soft tissue. IEEE Trans. Biomed. Eng. 2014, 61, 53–61. [Google Scholar] [CrossRef]
- Escoto, A.; Bhattad, S.; Shamsil, A.; Sanches, A.; Trejos, A.L.; Naish, M.D.; Malthaner, R.A.; Patel, R.V. A multi-sensory mechatronic device for localizing tumors in minimally invasive interventions. In Proceedings of the IEEE International Conference on Robotics and Automation (ICRA), Seattle, WA, USA, 26–30 May 2015; pp. 4742–4747. [Google Scholar]
- Gafford, J.B.; Kesner, S.B.; Degirmenci, A.; Wood, R.J.; Howe, R.D.; Walsh, C.J. A monolithic approach to fabricating low-cost, millimeter-scale multi-axis force sensors for minimally-invasive surgery. In Proceedings of the 2014 IEEE International Conference on Robotics and Automation (ICRA), Hong Kong, China, 31 May–7 June 2014; pp. 1419–1425. [Google Scholar]
- Liu, H.; Li, J.; Song, X.; Seneviratne, L.D.; Althoefer, K. Rolling indentation probe for tissue abnormality identification during minimally invasive surgery. IEEE Trans. Robot. 2011, 27, 50–60. [Google Scholar] [CrossRef]
- Murayama, Y.; Haruta, M.; Hatakeyama, Y.; Shiina, T.; Sakuma, H.; Takenoshita, S.; Omata, S.; Constantinou, C.E. Development of a new instrument for examination of stiffness in the breast using haptic sensor technology. Sens. Actuators A Phys. 2008, 143, 430–438. [Google Scholar] [CrossRef]
- Peng, P.; Rajamani, R. Handheld microtactile sensor for elasticity measurement. IEEE Sens. J. 2011, 11, 35–42. [Google Scholar] [CrossRef]
- McKinley, S.; Garg, A.; Sen, S.; Kapadia, R.; Murali, A.; Nichols, K.; Lim, S.; Patil, S.; Abbeel, P.; Okamura, A.M.; et al. A single-use haptic palpation probe for locating subcutaneous blood vessels in robot-assisted minimally invasive surgery. In Proceedings of the IEEE International Conference on Automation Science and Engineering (CASE), Gothenburg, Sweden, 24–28 August 2015; pp. 1151–1158. [Google Scholar]
- Ahn, B.; Kim, Y.; Oh, C.K.; Kim, J. Robotic palpation and mechanical property characterization for abnormal tissue localization. Med. Biol. Eng. Comput. 2012, 50, 61–71. [Google Scholar] [CrossRef] [PubMed]
- Yen, P.L.; Chen, D.R.; Yeh, K.T.; Chu, P.Y. Lateral exploration strategy for differentiating the stiffness ratio of an inclusion in soft tissue. Med. Eng. Phys. 2008, 30, 1013–1019. [Google Scholar] [CrossRef] [PubMed]
- Trejos, A.L.; Jayender, J.; Perri, M.T.; Naish, M.D.; Patel, R.V.; Malthaner, R.A. Experimental evaluation of robot-assisted tactile sensing for minimally invasive surgery. In Proceedings of the 2nd IEEE RAS & EMBS International Conference on Biomedical Robotics and Biomechatronics (BioRob), Scottsdale, AZ, USA, 19–22 October 2008; pp. 971–976. [Google Scholar]
- Trejos, A.L.; Jayender, J.; Perri, M.T.; Naish, M.D.; Patel, R.V.; Malthaner, R.A. Robot-assisted tactile sensing for minimally invasive tumor localization. Int. J. Robot. Res. 2009, 28, 18–33. [Google Scholar] [CrossRef]
- Konstantinova, J.; Cotugno, G.; Dasgupta, P.; Althoefer, K.; Nanayakkara, T. Palpation force modulation strategies to identify hard regions in soft tissue organs. PLoS ONE 2017, 12, e0171706. [Google Scholar] [CrossRef] [PubMed]
- Nichols, K.A.; Okamura, A.M. Autonomous robotic palpation: Machine learning techniques to identify hard inclusions in soft tissues. In Proceedings of the IEEE International Conference on Robotics and Automation (ICRA), Karlsruhe, Germany, 6–10 May 2013; pp. 4384–4389. [Google Scholar]
- Romano, J.M.; Kuchenbecker, K.J. Methods for robotic tool-mediated haptic surface recognition. In Proceedings of the IEEE Haptics Symposium (HAPTICS), Houston, TX, USA, 23–26 February 2014; pp. 49–56. [Google Scholar]
- Sangpradit, K.; Liu, H.; Seneviratne, L.D.; Althoefer, K. Tissue identification using inverse finite element analysis of rolling indentation. In Proceedings of the IEEE International Conference on Robotics and Automation (ICRA), Kobe, Japan, 12–17 May 2009; pp. 1250–1255. [Google Scholar]
- Sangpradit, K.; Liu, H.; Dasgupta, P.; Althoefer, K.; Seneviratne, L.D. Finite-element modeling of soft tissue rolling indentation. IEEE Trans. Biomed. Eng. 2011, 58, 19–27. [Google Scholar] [CrossRef] [PubMed]
- Li, M.; Konstantinova, J.; Xu, G.; He, B.; Aminzadeh, V.; Xie, J.; Wurdemann, H.; Althoefer, K. Evaluation of stiffness feedback for hard nodule identification on a phantom silicone model. PLoS ONE 2017, 12, e0172703. [Google Scholar] [CrossRef]
- Mahvash, M.; Gwilliam, J.; Agarwal, R.; Vagvolgyi, B.; Su, L.M.; Yuh, D.D.; Okamura, A.M. Force-feedback surgical teleoperator: Controller design and palpation experiments. In Proceedings of the IEEE Haptics Symposium Haptic Interfaces for Virtual Environment and Teleoperator Systems, Reno, NE, USA, 13–14 March 2008; pp. 465–471. [Google Scholar]
- Kubus, D.; Kroger, T.; Wahl, F.M. Improving force control performance by computational elimination of non-contact forces/torques. In Proceedings of the IEEE International Conference on Robotics and Automation (ICRA), Pasadena, CA, USA, 19–23 May 2008; pp. 2617–2622. [Google Scholar]
- Kubus, D.; Wahl, F.M. Scaling and eliminating non-contact forces and torques to improve bilateral teleoperation. In Proceedings of the IEEE/RSJ International Conference on Intelligent Robots and Systems (IROS), St. Louis, MO, USA, 10–15 October 2009; pp. 5133–5139. [Google Scholar]
- Bätz, G.; Weber, B.; Scheint, M.; Wollherr, D.; Buss, M. Dynamic contact force/torque observer: Sensor fusion for improved interaction control. Int. J. Robot. Res. 2013, 32, 46–57. [Google Scholar] [CrossRef]
- Farsoni, S.; Landi, C.T.; Ferraguti, F.; Secchi, C.; Bonfè, M. Compensation of Load Dynamics for Admittance Controlled Interactive Industrial Robots Using a Quaternion-Based Kalman Filter. IEEE Robot. Autom. Lett. 2017, 2, 672–679. [Google Scholar] [CrossRef]
- Carter, F.J.; Frank, T.G.; Davies, P.J.; McLean, D.; Cuschieri, A. Measurements and modeling of the compliance of human and porcine organs. Med. Image Anal. 2001, 5, 231–236. [Google Scholar] [CrossRef]
- Nesme, M.; Marchal, M.; Promayon, E.; Chabanas, M.; Payan, Y.; Faure, F. Physically realistic interactive simulation for biological soft tissues. Recent Res. Dev. Biomech. 2005, 2, 1–22. [Google Scholar]
- Jordan, P.; Socrate, S.; Zickler, T.E.; Howe, R.D. Constitutive modeling of porcine liver in indentation using 3D ultrasound imaging. J. Mech. Behav. Biomed. Mater. 2009, 2, 192–201. [Google Scholar] [CrossRef] [Green Version]
- Lee, E.H.; Radok, J.R. The contact problem for viscoelastic bodies. J. Appl. Mech. 1960, 27, 438–444. [Google Scholar] [CrossRef]
- Lam, H.-K.; Ekong, U.; Xiao, B.; Ouyang, G.; Liu, H.; Chan, K.Y.; Ling, S.H. Variable weight neural networks and their applications on material surface and epilepsy seizure phase classifications. Neurocomputing 2015, 149, 1177–1187. [Google Scholar] [CrossRef]
- Kotsiantis, S.B.; Zaharakis, I.; Pintelas, P. Supervised machine learning: A review of classification techniques. In Proceedings of the 2007 Conference on Emerging Artificial Intelligence Applications in Computer Engineering: Real Word AI Systems with Applications in eHealth, HCI, Information Retrieval and Pervasive Technologies; IOS Press: Amsterdam, The Netherlands, 2007; pp. 3–24. [Google Scholar]
- Lam, H.-K.; Ekong, U.; Liu, H.; Xiao, B.; Araujo, H.; Ling, S.H.; Chan, K.Y. A study of neural-network-based classifiers for material classification. Neurocomputing 2014, 144, 367–377. [Google Scholar] [CrossRef] [Green Version]
- Andersen, T.T. Optimizing the Universal Robots ROS Driver; Department of Electrical Engineering, Technical University of Denmark: Kongens Lyngby, Denmark, 2015. [Google Scholar]
Figure 1.
Schematic of robotic palpation with hard inclusions embedded in a silicone soft tissue phantom. A 3D printed probe is attached to the force sensor, and the force sensor is attached to the robot end effector. The probe can be controlled to contact the soft tissue phantom, in which three hard inclusions (in blue) are considered to be tumors (stiffer than the phantom). The red line denotes the distance between the probe and the surface of the tissue phantom.
Figure 2.
Force analysis of robotic palpation: The probe is moved to press the soft tissue phantom, A is the measured force from the sensor denoted as ; B is the actual interaction force between the probe and the environment defined as ; C is the palpation depth between the spherical tip of the probe and the surface of the soft tissue phantom as .
Figure 3.
Force compensation framework of robotic palpation. The yellow block contains the original information measured directly from the sensor and robot. By using this information, the YM can be calculated but with potential measurement uncertainties such as inertial force. In the blue block, a force compensation framework is designed to remove the influence of inertial force from the sensor measurement. Thus the YMs can be obtained by the compensated force.
Figure 4.
A three-layer feed-forward fully-connected neural network. In the proposed force compensation approach, the input of the neural network is the state feature of the force sensor during moving and the output the force response of the force sensor.
Figure 4.
A three-layer feed-forward fully-connected neural network. In the proposed force compensation approach, the input of the neural network is the state feature of the force sensor during moving and the output the force response of the force sensor.
Figure 5.
Experiment Setup with UR5 robot and silicone based soft tissue phantom with hard inclusions. sensor is attached to the robot end effector to measure the contact force during the palpation. Three hard inclusions which are stiffer than the soft tissue phantom are embedded at different depths (depth here denote the distance between the place of hard inclusions and the surface of the tissue phantom): 5 mm, 8 mm, 10 mm.
Figure 6.
Force uncertainty experiment setup. Experiment A: The probe is not attached on the sensor. Experiment B: A 3D printed probe is attached on the sensor. The experiments are performed by moving the robot in the Z axis with moving up 2 cm and down 2 cm 10 times, which last for around 80 s.
Figure 6.
Force uncertainty experiment setup. Experiment A: The probe is not attached on the sensor. Experiment B: A 3D printed probe is attached on the sensor. The experiments are performed by moving the robot in the Z axis with moving up 2 cm and down 2 cm 10 times, which last for around 80 s.
Figure 7.
Force uncertainty experiment result analysis. All of the force information is recorded and analyzed for experiment A and B. Significant force uncertainty can be observed in experiment B, where the probe is attached on the sensor. The unit for the force is N.
Figure 7.
Force uncertainty experiment result analysis. All of the force information is recorded and analyzed for experiment A and B. Significant force uncertainty can be observed in experiment B, where the probe is attached on the sensor. The unit for the force is N.
Figure 8.
Force data from the force sensor with 10 free motion experiments (with probe attached on the force sensor). During the experiments, the probe does not contact any environment. Each experiment is conducted for around 80 s. Noticeable force is observed and recorded as shown in the figures.
Figure 8.
Force data from the force sensor with 10 free motion experiments (with probe attached on the force sensor). During the experiments, the probe does not contact any environment. Each experiment is conducted for around 80 s. Noticeable force is observed and recorded as shown in the figures.
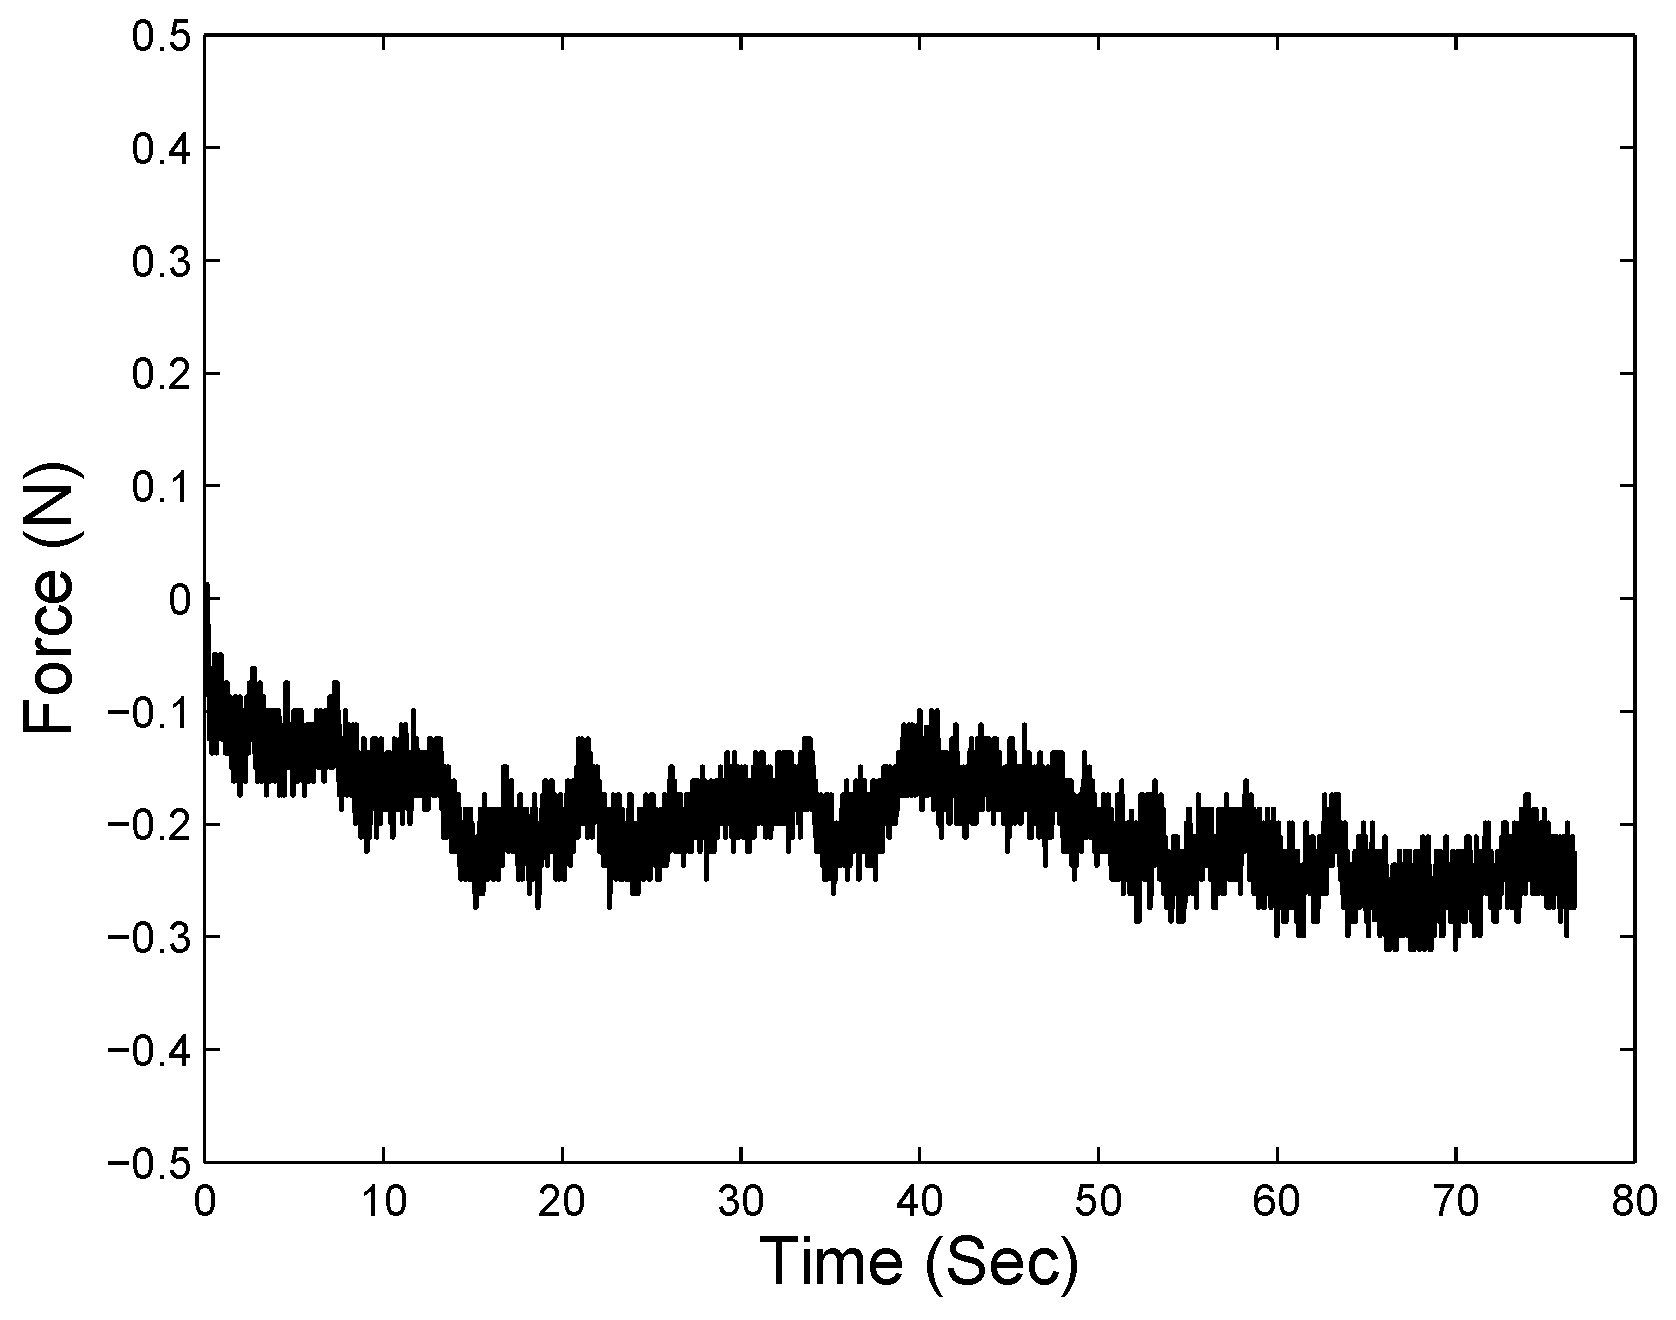
Figure 9.
Average of force data output from 10 same free motion experiments.
Figure 10.
Top sub figure: The average of the same free movements (black curves) of the force sensor. Bottom sub figure: The velocity (red curves) and acceleration (blue curves) calculated by the movements and time.
Figure 10.
Top sub figure: The average of the same free movements (black curves) of the force sensor. Bottom sub figure: The velocity (red curves) and acceleration (blue curves) calculated by the movements and time.
Figure 11.
Neural network modeling framework using the distance, velocity and acceleration of the force sensor (which can be read from the robot end effector) as input, and the measured force from the sensor can be used as the output.
Figure 11.
Neural network modeling framework using the distance, velocity and acceleration of the force sensor (which can be read from the robot end effector) as input, and the measured force from the sensor can be used as the output.
Figure 12.
Force correction of the ’no hard inclusion’ case. The blue curve is the original measured force from the sensor, and the black curve shows the corrected force by using the force compensation approach. Peak forces are highlighted with red circles.
Figure 12.
Force correction of the ’no hard inclusion’ case. The blue curve is the original measured force from the sensor, and the black curve shows the corrected force by using the force compensation approach. Peak forces are highlighted with red circles.
Figure 13.
Force correction of the ’hard inclusion 5 mm beneath the surface’ case. The blue curve is the original measured force from the sensor, and the black curve shows the corrected force by using the force compensation approach. Peak forces are highlighted with red circles.
Figure 13.
Force correction of the ’hard inclusion 5 mm beneath the surface’ case. The blue curve is the original measured force from the sensor, and the black curve shows the corrected force by using the force compensation approach. Peak forces are highlighted with red circles.
Figure 14.
Force correction of the ’hard inclusion 8 mm beneath the surface’ case. The blue curve is the original measured force from the sensor, and the black curve shows the corrected force by using the force compensation approach. Peak forces are highlighted with red circles.
Figure 14.
Force correction of the ’hard inclusion 8 mm beneath the surface’ case. The blue curve is the original measured force from the sensor, and the black curve shows the corrected force by using the force compensation approach. Peak forces are highlighted with red circles.
Figure 15.
Force correction of the ’hard inclusion 10 mm beneath the surface’ case. The blue curve is the original measured force from the sensor, and the black curve shows the corrected force by using the force compensation approach. Peak forces are highlighted with red circles.
Figure 15.
Force correction of the ’hard inclusion 10 mm beneath the surface’ case. The blue curve is the original measured force from the sensor, and the black curve shows the corrected force by using the force compensation approach. Peak forces are highlighted with red circles.
Figure 16.
Young’s modulus (YM) for the ’no hard inclusion’ case. The blue curve denotes the YM by original force measured by sensor, and the black curve indicates the YM by compensated force.
Figure 16.
Young’s modulus (YM) for the ’no hard inclusion’ case. The blue curve denotes the YM by original force measured by sensor, and the black curve indicates the YM by compensated force.
Figure 17.
YM for the ’hard inclusion 5 mm beneath the surface.’ The blue curve denotes the YM by original force measured by sensor, and the black curve indicates the YM by compensated force.
Figure 17.
YM for the ’hard inclusion 5 mm beneath the surface.’ The blue curve denotes the YM by original force measured by sensor, and the black curve indicates the YM by compensated force.
Figure 18.
YM for the ’hard inclusion 8 mm beneath the surface’ case. The blue curve denotes the YM by original force measured by sensor, and the black curve indicates the YM by compensated force.
Figure 18.
YM for the ’hard inclusion 8 mm beneath the surface’ case. The blue curve denotes the YM by original force measured by sensor, and the black curve indicates the YM by compensated force.
Figure 19.
YM for the ’hard inclusion 10 mm beneath the surface’ case. The blue curve denotes the YM by original force measured by sensor, and the black curve indicates the YM by compensated force.
Figure 19.
YM for the ’hard inclusion 10 mm beneath the surface’ case. The blue curve denotes the YM by original force measured by sensor, and the black curve indicates the YM by compensated force.

Table 1.
YM with static palpation experiments (Unit: Pa).
| Time | No Hard Inclusion | Hard Inclusion 5 mm | Hard Inclusion 8 mm | Hard Inclusion 10 mm |
|---|---|---|---|---|
| 1 | ( N and 3 mm) | ( N and 3 mm) | ( N and 3 mm) | ( N and 3 mm) |
| 2 | ( N and 4 mm) | ( N and 4 mm) | ( N and 4 mm) | ( N and 4 mm) |
| 3 | ( N and 5 mm) | ( N and 5 mm) | ( N and 5 mm) | ( N and 5 mm) |
| 4 | ( N and 6 mm) | ( N and 6 mm) | ( N and 6 mm) | ( N and 6 mm) |
| 5 | ( N and 7 mm) | ( N and 7 mm) | ( N and 7 mm) | ( N and 7 mm) |
| 6 | ( N and 8 mm) | ( N and 8 mm) | ( N and 8 mm) | ( N and 8 mm) |
| 7 | ( N and 9 mm) | ( N and 9 mm) | ( N and 9 mm) | ( N and 9 mm) |
| 8 | ( N and 10 mm) | ( N and 10 mm) | ( N and 10 mm) | ( N and 10 mm) |
Table 2.
The average YM during palpation (Unit: Pa).
| Palpation Cases | Original | Corrected | Static |
|---|---|---|---|
| No hard inclusion | |||
| Hard inclusion at 5 mm | |||
| Hard inclusion at 8 mm | |||
| Hard inclusion at 10 mm |
Table 3.
YM bias term (YMBT) during the robotic palpation experiments.
| Palpation Cases | ||
|---|---|---|
| No hard inclusion | ||
| Hard inclusion at 5 mm | ||
| Hard inclusion at 8 mm | ||
| Hard inclusion at 10 mm |
© 2019 by the authors. Licensee MDPI, Basel, Switzerland. This article is an open access article distributed under the terms and conditions of the Creative Commons Attribution (CC BY) license (http://creativecommons.org/licenses/by/4.0/).
Share and Cite
MDPI and ACS Style
Guo, J.; Xiao, B.; Ren, H. Compensating Uncertainties in Force Sensing for Robotic-Assisted Palpation. Appl. Sci. 2019, 9, 2573. https://doi.org/10.3390/app9122573
AMA Style
Guo J, Xiao B, Ren H. Compensating Uncertainties in Force Sensing for Robotic-Assisted Palpation. Applied Sciences. 2019; 9(12):2573. https://doi.org/10.3390/app9122573
Chicago/Turabian StyleGuo, Jing, Bo Xiao, and Hongliang Ren. 2019. "Compensating Uncertainties in Force Sensing for Robotic-Assisted Palpation" Applied Sciences 9, no. 12: 2573. https://doi.org/10.3390/app9122573
Note that from the first issue of 2016, this journal uses article numbers instead of page numbers. See further details here.