Article

Comparison of Raman and Mid-Infrared Spectroscopy for Real-Time Monitoring of Yeast Fermentations: A Proof-of-Concept for Multi-Channel Photometric Sensors

1
Institute for Process Control, Mannheim University of Applied Sciences, Paul-Wittsack-Str. 10, 68163 Mannheim, Germany
2
Medical Research Center, University of Heidelberg, Theodor-Kutzer-Ufer 1-3, 68167 Mannheim, Germany
3
Institute of Biotechnology, Technical University of Berlin, Chair of Brewing Science, Seestr. 13, 13353 Berlin, Germany
*
Author to whom correspondence should be addressed.
These authors contributed equally to this work.
Appl. Sci. 2019, 9(12), 2472; https://doi.org/10.3390/app9122472
Submission received: 16 May 2019 / Revised: 13 June 2019 / Accepted: 14 June 2019 / Published: 17 June 2019
(This article belongs to the Special Issue Novel Insights to Raman Spectroscopy: Advances and Prospects)

Abstract

:
Raman and mid-infrared (MIR) spectroscopy are useful tools for the specific detection of molecules, since both methods are based on the excitation of fundamental vibration modes. In this study, Raman and MIR spectroscopy were applied simultaneously during aerobic yeast fermentations of Saccharomyces cerevisiae. Based on the recorded Raman intensities and MIR absorption spectra, respectively, temporal concentration courses of glucose, ethanol, and biomass were determined. The chemometric methods used to evaluate the analyte concentrations were partial least squares (PLS) regression and multiple linear regression (MLR). In view of potential photometric sensors, MLR models based on two (2D) and four (4D) analyte-specific optical channels were developed. All chemometric models were tested to predict glucose concentrations between 0 and 30 g L−1, ethanol concentrations between 0 and 10 g L−1, and biomass concentrations up to 15 g L−1 in real time during diauxic growth. Root-mean-squared errors of prediction (RMSEP) of 0.68 g L−1, 0.48 g L−1, and 0.37 g L−1 for glucose, ethanol, and biomass were achieved using the MIR setup combined with a PLS model. In the case of Raman spectroscopy, the corresponding RMSEP values were 0.92 g L−1, 0.39 g L−1, and 0.29 g L−1. Nevertheless, the simple 4D MLR models could reach the performance of the more complex PLS evaluation. Consequently, the replacement of spectrometer setups by four-channel sensors were discussed. Moreover, the advantages and disadvantages of Raman and MIR setups are demonstrated with regard to process implementation.

1. Introduction

For optimum process control and quality assurance in chemical, as well as biotechnological processes, knowledge of the reaction mixture’s current composition is of great benefit. In that regard, educt and product concentrations are important parameters [1]. In recent years, optical spectroscopy has been established for simultaneous real-time measurements of multiple analytes [2]. Taking the rapid pace of change in the fermentation industry, as well as financial pressure into consideration, vibrational spectroscopy has shown great promise regarding process monitoring [3].
Two vibrational spectroscopic approaches are Raman and mid-infrared (MIR) spectroscopy, where predominantly fundamental vibrations are observed in the spectral range from 4000–200 cm−1 [4]. The limits of detection (LOD) of both spectroscopic techniques have similar values in the three-digit ppm range [5,6,7,8], depending on the setup conditions. Moreover, the identification of molecules is facilitated by the characteristic band positions of the different functional groups and skeletal vibrational motions. In Raman spectroscopy, the polarizability of a chemical bonding orbital is crucial for inelastic light scattering, and thus excitation of the fundamental vibration in a molecule. The good polarizability of non-polar bonds (e.g., C-C) results in intensive Raman bands, and vice versa, chemical bonds with a high dipole moment have usually a poor polarizability, which decreases the Raman activity. In contrast, strong absorption bands occur in MIR spectroscopy if the dipole moment changes significantly during a fundamental vibration. Examples for functional groups with intensive MIR bands are the stretching vibration of carbonyls (C=O) and hydroxyl groups (O-H). Consequently, Raman and MIR spectroscopy are partially complementary to each other [4,9].
There have been a number of studies carried out using Raman or MIR spectroscopy for reaction monitoring [3,6,10,11,12,13]. In order to analyze multicomponent mixtures, optical spectroscopy in conjunction with chemometric techniques is often required for converting optical spectra into analyte concentrations [14,15]. For example, Kozma et al. [16] used a 785-nm laser and a Raman spectrometer to predict the glucose concentration in mammalian cell cultivations. In that study, multiple linear regression (MLR), principle component regression (PCR), and partial least squares (PLS) regression models combined with different variable selection methods were tested. The best result was achieved for a pre-processed PLS regression model where the variable importance in projection (VIP) was applied. This model was the most advanced algorithm of the tested models. In contrast, only an internal standard in combination with linear regression was sufficient for Iversen et al. [17] during real-time monitoring of a lignocellulosic bioethanol production process by Raman spectroscopy (excitation wavelength: 785 nm). Further pre-processing of the Raman signals or chemometric evaluation like principal component analysis (PCA) or PLS regression was not required. Wang et al. [18] presented a Fourier-transform near-infrared (FT-NIR) spectrometer with auto-calibration for the compensation of the influence of ambient temperature on the Raman spectra. The measurement setup consisted of a Bruker MultiRAM system with a 1064-nm laser and a liquid nitrogen-cooled Ge detector. The Raman immersion probe was located in a special filter tube in order to eliminate light scattering effects caused by particles (cells) during a wine fermentation process. The realization of a particle-free measurement environment was combined with PLS-PCA models for data evaluation. Ávila et al. [19] monitored the fermentation process of glucose by Saccharomyces cerevisiae (S. cerevisiae) in a bypass using a Raman spectrometer equipped with a quartz cuvette for flow analysis. The spectra were evaluated using PLS. Since the retrofit of Raman equipment in already existing pipelines and vessels is quite pricy, Braun et al. [6] developed a non-contact Raman probe for in-line process monitoring through an optical inspection glass. This Raman probe combined with a Raman spectrometer was successfully applied by Schalk et al. [20] for in-line monitoring of glucose and ethanol during yeast fermentations. For quantification of the analyte concentrations during growth on glucose, MLR models were used. Regarding sensor systems based on separate optical channels, models with only two (2D) or four (4D) spectral regions were utilized. While similar ethanol prediction errors were reached for the 2D and 4D MLR models, the 4D MLR model achieved better results for the prediction of glucose concentrations than the 2D MLR model. A similar evaluation method based on separate optical channels for real-time monitoring of the identical yeast fermentations was carried out in 2017 [21]. Instead of Raman spectroscopy, an MIR sensor with four channels was used. This sensor was developed by Geoerg et al. [10] for process monitoring. Since the sensor is based on four optical bandpass filters, the sensor can be easily adapted to a wide range of processes by exchanging and adjusting the filters to the spectral regions of interest. The fermentations ran by Schalk et al. [21] were recorded using the original MIR sensor design, as well as a commercial ALPHA FT-MIR spectrometer with an attenuated total reflection (ATR) module (Bruker Optik GmbH, Ettlingen, Germany) for comparison. In order to link the measured absorbance in the transmission ranges of the four optical sensor channels to the glucose and ethanol concentrations, the sensor and spectrometer were calibrated by MLR. Mazarevica [22] also monitored fermentations with the aid of an ATR element by MIR spectroscopy to predict glucose and ethanol concentrations. Besides the samples obtained during the fermentation processes, synthetic standards were used to form calibration sets. While one type of calibration set comprised either spectra from samples drawn during fermentation or synthetic standards, a mix of spectra from fermentation samples and synthetic standards formed the other type of calibration set. For data analysis, a PLS method was used. The optimal PLS regression method was obtained using the calibration type consisting of the mixed samples. Comparing FT-MIR and FT-Raman spectroscopy for bioprocess monitoring was done by Sivakesava et al. [23]. In order to monitor the ethanol production during yeast fermentations, FT-MIR spectra were recorded using a spectrometer equipped with a deuterated triglycine sulfate (DTGS) detector and an overhead ATR accessory. This ATR crystal was cleaned with water and dried using nitrogen gas between successive analysis of drawn samples from the anaerobic yeast fermentations. The same spectrometer extended by a Raman module with an indium-gallium-arsenide (InGaAs) detector and a Nd:YAG laser (wavelength: 1064 nm; output power: 1.2 W) was used for Raman spectroscopy. The spectral data were analyzed using PLS regression and PCR. Thereby, the PLS models with the first derivative as data pre-processing generated the smallest standard errors of prediction using FT-MIR spectroscopy. In the case of Raman spectroscopy, the smallest standard errors for calibration were also reached with the PLS models pre-processed with the first derivative.
To the best of the authors’ knowledge, the simultaneous application of Raman and MIR spectroscopy for real-time monitoring of yeast fermentations has not been reported so far. Either Raman or MIR spectroscopy was used for process monitoring in real time. In the case of a simultaneous application of both spectroscopic techniques, only drawn samples were analyzed [23]. The use of on-line and in situ sensors is preferred in any case with respect to the inherent danger of contamination in biotechnological processes [24]. The simultaneous application of both spectroscopic methods enables direct comparison of the time-dependent concentration courses of the analytes. Moreover, the functionalities of Raman versus MIR-ATR spectroscopy have been discussed for bioprocess monitoring. The analytes monitored in this work were glucose, ethanol, and biomass. Since the fermentation media’s composition is complex, multivariate methods for the evaluation of the Raman and MIR spectra are often required [15]. In this study, PLS regression models [14,25,26] and MLR models [27,28] were applied to link the measured light intensities (Raman) or absorbances (MIR) to the analyte concentrations. As a reference method for the determination of glucose and ethanol, high-performance liquid chromatography (HPLC) was used. The biomass was determined gravimetrically. The simple data evaluation by MLR models can be used to simulate the analytical performance of sensor setups with two or more measurement channels [10] and to check if miniaturized sensors can replace spectrometer setups without loss of accuracy. To see whether this reduced spectral information yield similar good results as the PLS evaluations (with and without data pre-processing) of spectra, two different MLR models have been developed: a 4D MLR model based on four spectral ranges and a 2D MLR model that uses only an analyte-specific measurement channel and a spectrally-adjacent reference channel. For Raman and MIR spectroscopy in combination with the different multivariate calibration models (PLS, 4D MLR, 2D MLR), the achieved performance parameters root-mean-squared error of calibration (RMSEC) and root-mean-squared error of prediction (RMSEP) were compared.
Therefore, the aims of this contribution are:
  • to investigate if MLR models can offer as good performance parameters as the sophisticated PLS evaluation of spectra. This approach enables estimating if spectrometer setups can be replaced by miniaturized and low-priced multi-channel Raman or MIR-ATR sensors without loss of accuracy.
  • the simultaneous application of Raman and MIR spectroscopy for real-time monitoring of yeast fermentations, allowing a direct comparison of both methods with regard to process implementation.

2. Materials and Methods

2.1. Cultivation Conditions

The fermentations were carried out in a BIOSTAT® E fermenter (Sartorius AG, Göttingen, Germany) consisting of a borosilicate glass vessel. Detailed information about the instrumentation of the bioreactor can be found in a previous publication [29].
The inoculum during the fermentation process was commercial baker’s yeast (Wieninger Hefe, F.X. WIENINGER GmbH, Passau, Germany) of species S. cerevisiae. The total fermentation volume was 5 L, with an initial dry yeast biomass concentration of 5 g L−1 and an initial glucose concentration of 30 g L−1. These starting concentrations were equal to Sample A of Mazarevica et al.’s [22] fermentation samples. The culture medium was prepared in deionized water, containing the following substances per liter: 4.86 g NH4Cl, 3.35 g NH4H2PO4, 0.9 g KCl, 0.45 g MgSO4·7 H2O, 0.24 g CaCl2·2 H2O, 0.02 g FeCl3·6 H2O, 0.01 g ZnSO4·7 H2O, 16 mg MnSO4·H2O, 2.4 mg CuSO4·5 H2O, 0.06 g m-inositol, 0.03 g Ca-pantothenate·H2O, 0.03 mg biotin, and 0.04 mL antifoam agent (Dow Corning® RD, Article Number 632134D, VWR BDH Prolabo, Leuven, Belgium). The fermentation was performed at 32 °C with an aeration rate of 1.0 vvm and a stirrer speed of 700 rpm. A peristaltic pump was used in order to add 5 M NaOH automatically and therefore ensure a constant pH value of 5.2. The fermentation was stopped after 10 h.

2.2. Raman and MIR Setup

Figure 1 shows the measurement setup for the simultaneous process analysis of yeast fermentation using Raman and MIR spectroscopy.
The Raman measuring system consisted of a Raman immersion probe (RamanProbeTM II, InPhotonics Inc., Norwood, USA) with a focal length of 7.5 mm and an adjusted working distance of 2.7 mm, quartz fiber optics, and a Raman spectrometer (MultiSpec® Raman, tec5 AG, Oberursel, Germany). The Raman spectrometer had an integrated 785-nm diode laser with an output power of 500 mW (230 mW inside the bioreactor at the sample area) and a Peltier-cooled back-thinned charge-coupled device (CCD) array detector (1024 × 58 pixel, pixel size 24 × 24 μm). Data acquisition was performed using the software MultiSpec® Pro II (tec5 AG). Spectra were collected every minute in the range from 300 cm−1–3200 cm−1 with an integration time of 30 s and a resolution of 7 cm−1. After the medium without glucose and inoculum was filled into the fermenter, the dark current was measured and used as a background spectrum. Subsequently, the cyclic recording of the fermentation process was started. In contrast to the Raman measurements, which were performed in-line, the MIR measurements were carried out on-line in a bypass. For this purpose, an ALPHA FT-MIR spectrometer with an ATR flow cell (Bruker Optik GmbH, Ettlingen, Germany) was part of the MIR measurement setup. The FT-MIR spectrometer included an ATR crystal of diamond with single reflection at the interface crystal/sample. The incidence angle of radiation was 45°, and the realized optical path lengths were between 1 and 10 µm depending on the wavelength [10]. The spectrometer was a RockSolidTM interferometer equipped with a permanently-adjustable gold mirror and a DTGS detector. A globar was used as a light source. The sample to be measured was pumped with a peristaltic pump (Ismatec®, Cole-Parmer GmbH, Wertheim, Germany) through a flow cell via a bypass at a constant volume flow of 2.4 mL min−1. It took 20 s to pump the sample from the reactor to the ATR cell. Within this period, the concentration changes of glucose, ethanol, and biomass were less than one tenth of the calibration and prediction errors at any time of the fermentation process. Therefore, the resulting time gap between the Raman and the MIR measurement could be neglected. MIR data acquisition was performed by the software OPUS® (Version 7.0, Bruker Optik GmbH). The spectra were recorded every minute in a spectral range from 600 cm−1–4000 cm−1 using a resolution of 4 cm−1 with 32 scans (corresponding to a measuring time of 30 s). A spectrum against ambient air was recorded shortly before the beginning of the fermentation and used as a background spectrum.

2.3. Reference Methods

The concentration of the biomass was determined with the aid of gravimetry. Throughout the fermentation process, samples of 10 mL were taken every 30 min and weighed with a precision balance (ABT 220-5DM, Kern & Sohn GmbH, Balingen, Germany). For separating the biomass and the liquid phase, the samples were centrifuged at 4500 rpm (Universal 320, Andreas Hettich GmbH & Co.KG, Tuttlingen, Germany) for 4 min at room temperature. The supernatant was filtered through a 0.45-µm syringe filter (Minisart® RC, Sartorius Stedim Biotech GmbH, Göttingen, Germany) and stored immediately at −18 °C. The remaining moisture of the sample was vaporized by placing the residual cell pellets three days in a drying chamber (VT 5042 EK, Heraeus Holding GmbH, Hanau, Germany) at 100 °C. After drying, the samples were weighed again in order to calculate the dry yeast biomass content (biomass) in g L−1.
The ethanol and glucose concentrations in the samples were evaluated using an HPLC system equipped with a differential refractometer (Smartline RI, Knauer GmbH, Berlin, Germany). A separation column (Polyspher® OA HY, Merck KGaA, Darmstadt, Germany) was utilized at room temperature, and a 20-µL sample volume was pumped (880-PU, Jasco GmbH, Groß-Umstadt, Germany) at a flow rate of 0.5 mL min−1 and a pressure of 70 kg cm−2 using 0.005 M sulfuric acid as an eluent. The column was conditioned for at least 30 min beforehand until no baseline drifts were observed. The defrosted supernatants of the centrifuged and filtered fermentation samples were diluted to 1:3 with the mobile phase before injection into the HPLC column. USB hardware (USB-6009, National Instruments, Austin, USA) and a LabVIEW® routine (National Instruments) were used in order to record the HPLC data, which were evaluated by chromatography software (ChemStation, Agilent Technologies Inc., Santa Clara, USA).

2.4. Chemometrics

For quantification of glucose, ethanol, and biomass, PLS regression and MLR models were applied. In the case of MLR, which was done in Excel®, two-dimensional (2D) and four-dimensional (4D) models were built for glucose, ethanol, and biomass. For the MLR models, the intensities in analyte-specific spectral regions were chosen for each analyte. The PLS models were realized using the software OPUS®. Thereby, models without data pre-processing (PLS without PP) and vector normalization as a pre-processing method (PLS with PP) were built. For evaluation, a spectral range of characteristic ethanol and glucose peaks was chosen. In addition to vector normalization, other pre-processing methods such as first derivative, second derivative, and straight-line subtraction were tested. Applying vector normalization to the Raman and MIR spectra, constant low calibration and prediction errors were achieved for all three analytes, while the other data pre-processing methods led to strong varying quality parameters. In order to avoid overfitting of data, the maximum number of PLS factors was limited to seven. Depending on the analyte and the spectroscopic method, the optimal number of factors was between two and five. The spectral regions for PLS and MLR evaluation for both spectroscopic methods are listed in Table 1.
For the quantification of glucose and ethanol by 2D MLR models, the signal intensity (Raman or MIR-ATR) in the measurement region and the intensity in a neighboring reference region (for fluorescence and/or offset correction) were used. The signal intensities were linked to the concentration values of the HPLC analysis (see Equations (1) and (2)). No characteristic peaks for biomass were found for Raman and MIR spectroscopy. For the determination of biomass by MIR spectra, the glucose (S1) and ethanol (S3) measurement channels were used, while in case of Raman spectroscopy, the glucose (S2) and ethanol (S4) reference channels were taken (see Section 3.1). The reference values for biomass in Equations (3) and (4) were determined by gravimetry. In contrast to 2D MLR, all four channels in Table 1 were used for 4D MLR models of glucose, ethanol, and biomass (see Equation 5). According to Equation (5), six 4D MLR models were built: one model for each of the three analytes in combination with the Raman or MIR-ATR signal intensities.
2 D   MLR   ( glucose ) :   c = α + β S 1 · x S 1 + β S 2 · x S 2 ,
2 D   MLR   ( ethanol ) :   c = α + β S 3 · x S 3 + β S 4 · x S 4 ,
2 D   MLR   ( biomass   by   MIR ) :   c = α + β S 1 · x S 1 + β S 3 · x S 3 ,
2 D   MLR   ( biomass   by   Raman ) :   c = α + β S 2 · x S 2 + β S 4 · x S 4 ,
4 D   MLR :   c = α + β S 1 · x S 1 + β S 2 · x S 2 + β S 3 · x S 3 + β S 4 · x S 4 ,
where c is the concentration of the analyte (ethanol, glucose, or biomass), α the intercept, β i the regression coefficient (slope), and x i the mean value of the intensities in the corresponding wavenumber regions ( i = S1, S2, S3, S4). The regression coefficients and the intercept were determined during calibration by minimization of the predicted residual error sum of squares (PRESS).
In contrast to the MLR models, which used separate optical channels, the PLS models were based on broad spectral ranges between 800 and 1400 cm−1 for Raman and 850 and 1250 cm−1 for MIR spectroscopy. These PLS ranges covered all MLR channels for glucose and ethanol without loss of information.
Three fermentation reactions were carried out for the calibration of glucose, ethanol, and biomass concentrations. During each fermentation reaction, 21 samples were taken for reference analysis. The 63 concentrations obtained for each analyte were used for the PLS and MLR calibration. The constructed calibration models were applied for the prediction of the three analytes during an additional fourth fermentation reaction under identical process conditions.
The models were characterized by the root-mean-squared error of calibration (RMSEC) and the root-mean-squared error of prediction (RMSEP). Thereby, the RMSEC describes how a model fits the calibration data and is given by:
R M S E C = i = 1 n ( c i , t r u e c i , p r e d i c t e d ) 2 / ( n p 1 ) ,
where c i , t r u e is the concentration determined by reference analysis, c i , p r e d i c t e d the calculated analyte concentration determined by the PLS or MLR model based on n calibration samples ( n = 63), and p the number of factors (PLS: p = 2–5) or regression coefficients (2D MLR: p = 2; 4D MLR: p = 4). In addition to the RMSEC values, root-mean-squared errors of cross-validation (RMSECV) were determined in the case of the PLS models. Since RMSEC and RMSECV values were similar, only the RMSEC values are listed in this study.
The RMSEP evaluates a calibration model versus an independent sample set and is given by:
R M S E P = i = 1 n ( c i , t r u e c i , p r e d i c t e d ) 2 / n
where c i , p r e d i c t e d is the analyte concentration calculated by the corresponding PLS or MLR model based on n prediction samples ( n = 21).

3. Results and Discussion

In order to ensure direct comparability of Raman and MIR-ATR spectroscopy, both setups were simultaneously applied for real-time monitoring of glucose, ethanol, and biomass concentrations during four aerobic yeast fermentations. The recorded spectra were evaluated by MLR and PLS models. In contrast to the well-established PLS regression, which uses broad or even complete spectral ranges, the MLR models in this work are based on only two (2D) or four (4D) selected narrow spectral ranges of 20 cm−1. MLR models are particularly well-suited for the calibration of compact multi-channel sensors [10], where the determination of analyte concentrations is based on the linear combination of signal intensities in a few transmission ranges of optical filters (channels). Therefore, in the present study, it was additionally investigated if MLR models can offer as good performance parameters (RMSEC, RMSEP) as the sophisticated PLS evaluation of spectra. This approach enables estimating if spectrometer setups can be replaced by miniaturized and low-priced multi-channel Raman or MIR-ATR sensors without loss of accuracy.

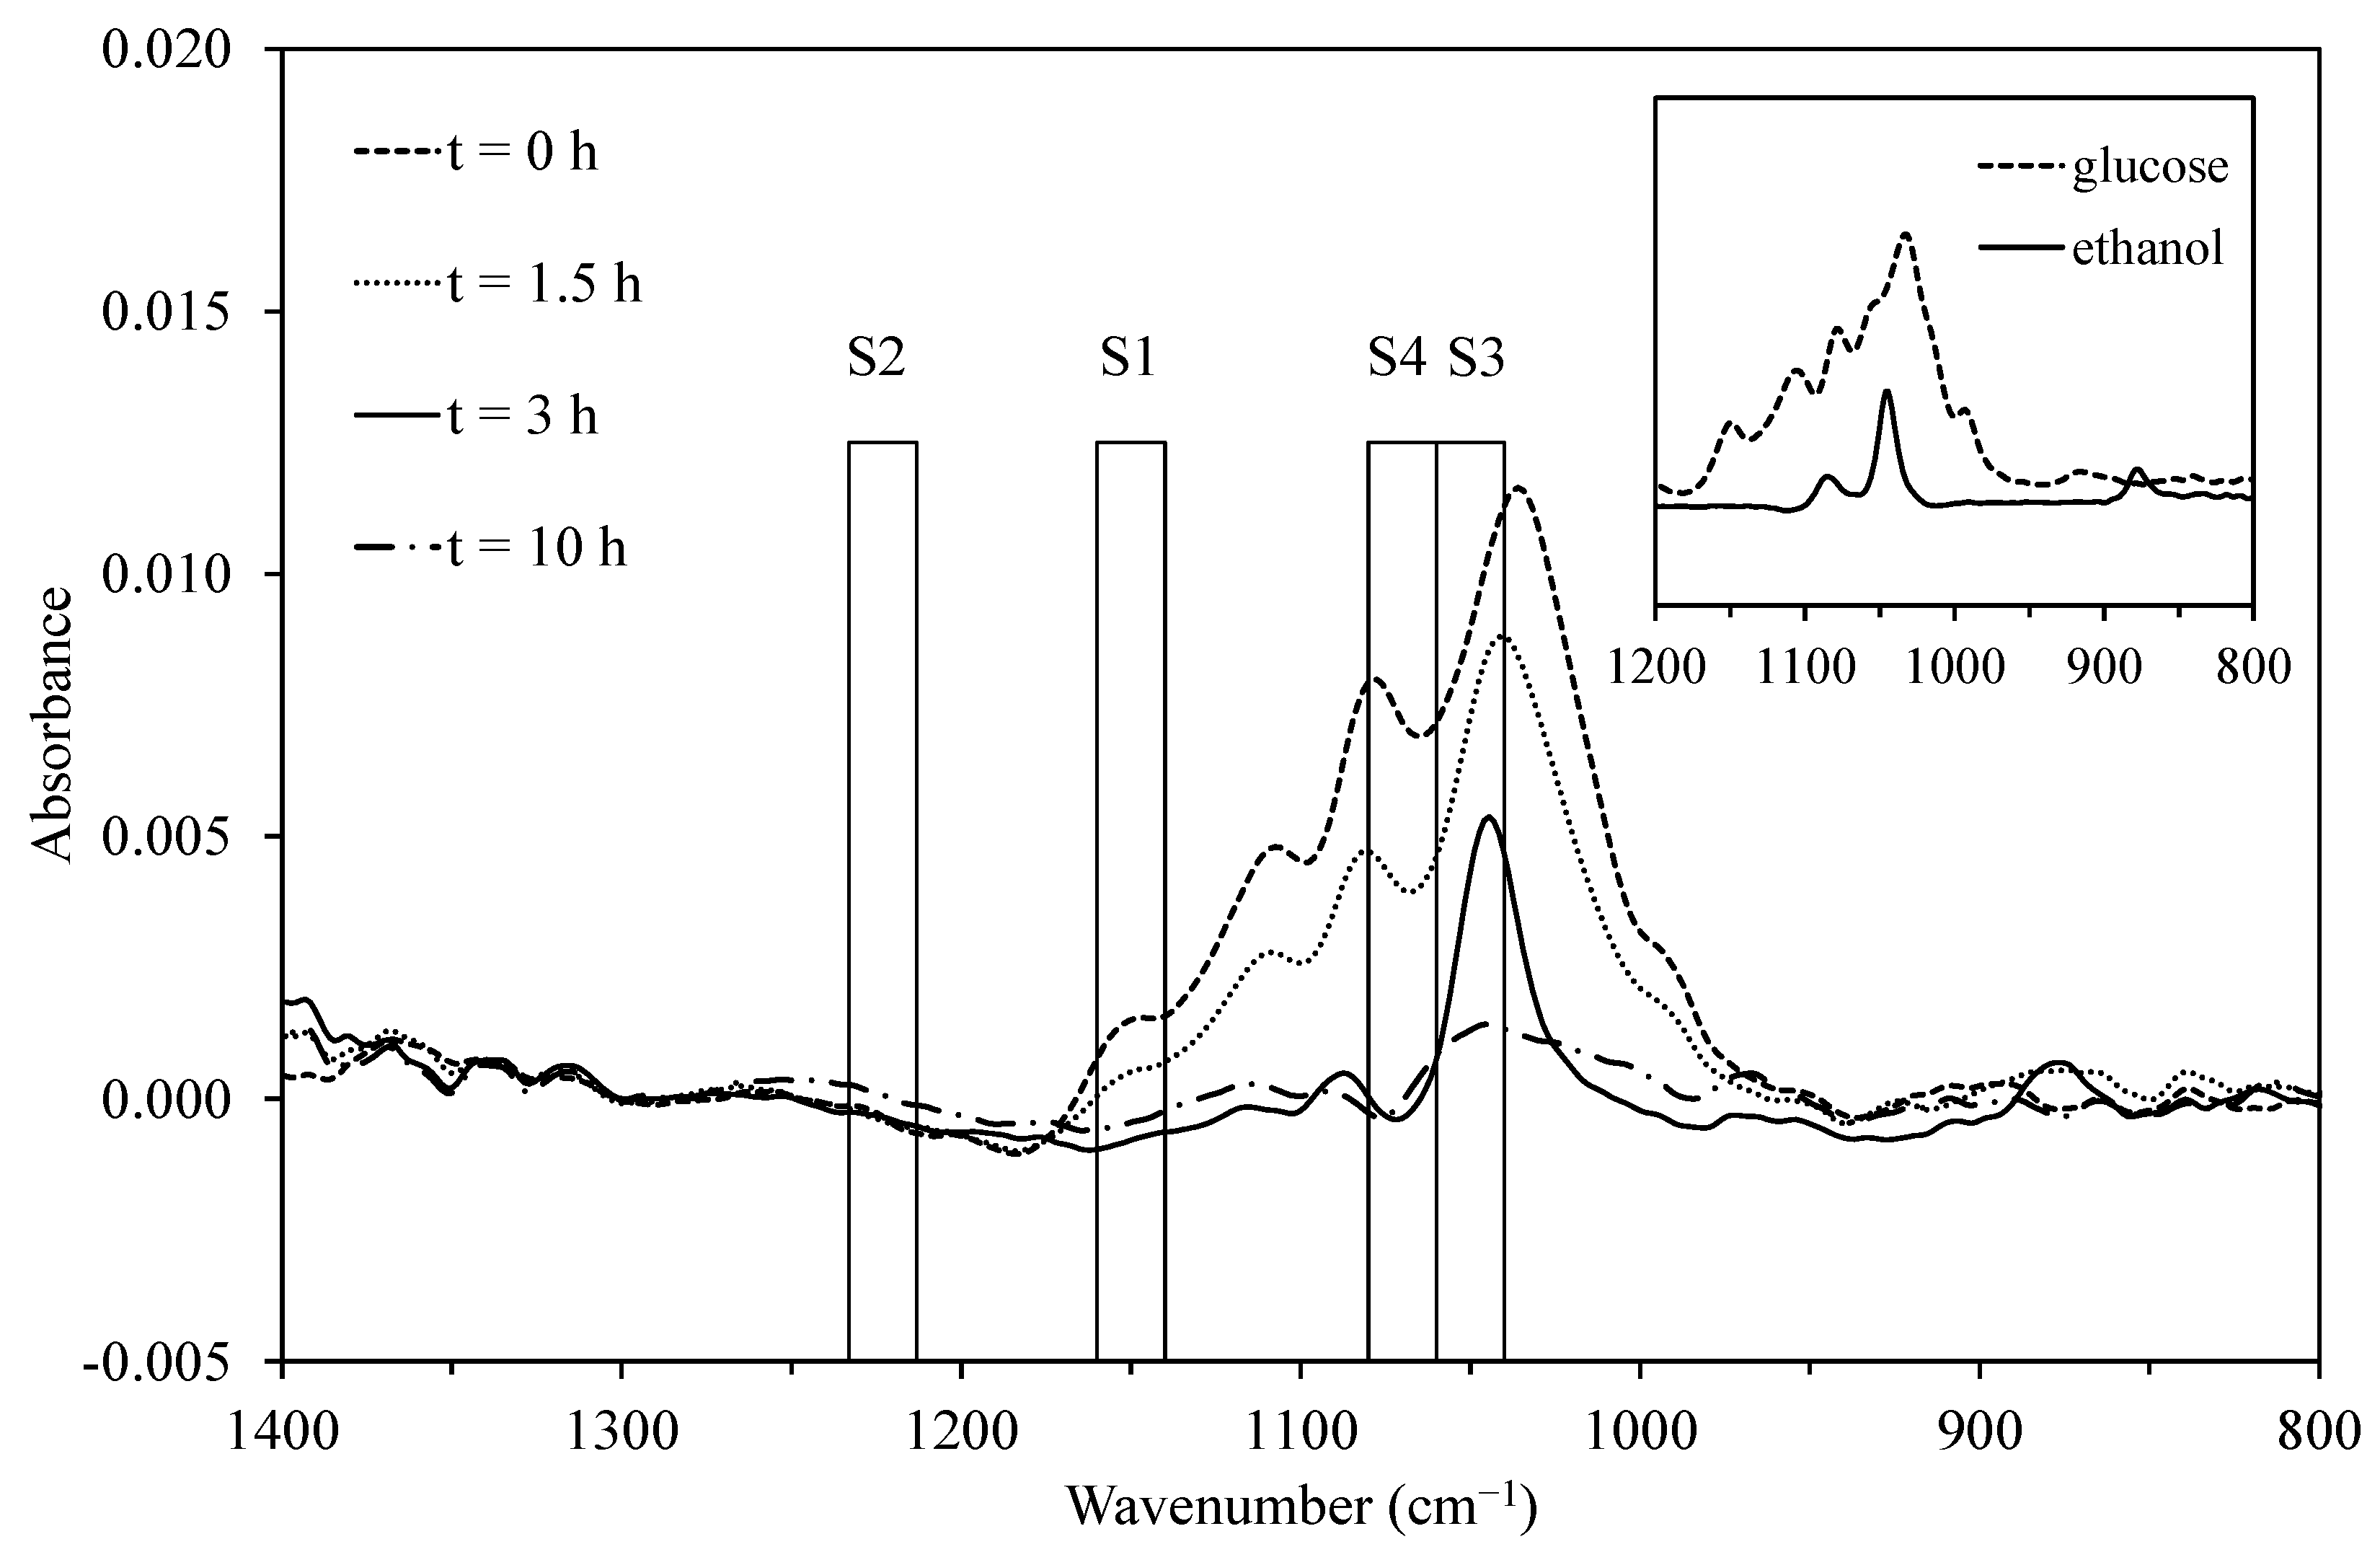
3.1. Selection of Spectral Ranges for MLR and PLS Models

During the first phase of the yeast fermentation, the carbon source glucose is mainly converted into ethanol and biomass. In the second phase, the product ethanol is consumed for biomass production [29,30]. Strong and characteristic MIR absorption bands for the detection of glucose and ethanol can be observed in a spectral range between approximately 800 cm−1 and 1400 cm−1 [20,21]. MIR-ATR spectra obtained during a yeast fermentation are shown in Figure 2 at selected times: 0 h: beginning of fermentation, 1.5 h: medium concentrations of glucose and ethanol, 3 h: complete consumption of glucose, maximum concentration of ethanol, and 10 h: end of fermentation, complete consumption of ethanol, maximum concentration of biomass. The MIR-ATR spectra of glucose and ethanol at their maximum concentrations (30 g L−1 and 10 g L−1, respectively) in deionized water are plotted in the upper right of Figure 2 for comparison. Glucose exhibits an intense peak at about 1030 cm−1, as well as four lower absorption maxima at approximately 990 cm−1, 1080 cm−1, 1100 cm−1, and 1150 cm−1, primarily originating from C-O stretching vibrations [22,31]. Ethanol shows two distinct peaks at approximately 1040 cm−1 and 1090 cm−1, originating from C-O stretching vibrations, and furthermore, a C-C stretch signal at about 880 cm−1 [22]. The partial spectral overlap of these analytes is caused by the alcoholic functional groups in glucose and ethanol [21].
Due to the spectral positions of the absorption bands of glucose and ethanol, the spectral region for the PLS evaluation of the MIR-ATR spectra has been restricted to a range from 850–1250 cm−1 without loss of information. In the case of MLR models, the signal intensities in selected optical channels (S1–S4) were chosen. The bandwidth of the used spectral ranges was set to 20 cm−1, a value that is typical for many commercially available optical filters in the MIR region [10]. For the determination of the glucose concentration, the spectral range from 1140–1160 cm−1 has been taken as a measurement channel (S1), since only glucose absorbs in this range without spectral overlap with the MIR spectrum of ethanol. As a reference channel (S2), the spectral range from 1213–1233 cm−1 has been used, where neither glucose, nor ethanol exhibits absorption bands. Since the only specific absorption band of ethanol at 880 cm−1 was too small for an accurate quantitative analysis, the strong absorption band from 1040–1060 cm−1 was taken as a measurement channel (S3) for ethanol despite the spectral overlap with glucose. Setting the reference channel (S4) in the direct spectral neighborhood (1060–1080 cm−1) to the measurement channel (S3), the cross-sensitivity to glucose could largely be compensated. In the recorded MIR-ATR spectra of the fermentation broth, no characteristic absorption bands for biomass could be identified. Therefore, the biomass concentration was correlated to the temporal concentration courses of glucose and ethanol. For this purpose, the measurement channel for glucose (S1) and ethanol (S3) were used in the 2D MLR model for the determination of biomass.
Even in the case of Raman spectroscopy, most of the ethanol and glucose bands were located in the spectral range from 800–1400 cm−1 [20,32] (see Figure 3).
In contrast to MIR spectroscopy, ethanol exhibits an intensive Raman peak at 880 cm−1, originating from the high polarizability of the C-C bond [32,33,34]. For the evaluation of Raman spectra by MLR, the measurement channel for ethanol (S3) was set to the range from 868–888 cm−1, overlapping with this peak. Additionally, intensive peaks can be observed at 1060 cm−1 and 1125 cm−1 for glucose [22,31] and at 1045 cm−1 and 1090 cm−1 for ethanol due to the excitation of C-O stretching vibrations [22,32]. The intensive peak in the range from 1112–1132 cm−1 was selected as a measurement channel for glucose (S1). As reference channels (S2, S4), spectral ranges without interfering Raman peaks in the neighboring area of the measurement channels were chosen (see Table 1 and Figure 3). For the PLS evaluation of Raman spectra, the complete spectral range from 800–1400 cm−1 was used.
In contrast to the offset-corrected spectra in Figure 3, the measured Raman spectra were superimposed by a pronounced fluorescence background, which was rising from higher to smaller Raman shifts, as shown in Figure 4.
The fluorescence background, mainly caused by biomass growth, was increasing during the fermentation. Since the fluorescence intensity in reference channel S4 (825–845 cm1) was increasing faster than the intensity in reference channel S2 (1165–1185 cm1), the difference of these two channels could be correlated to the biomass growth in the corresponding MLR model (see Equation (4)).

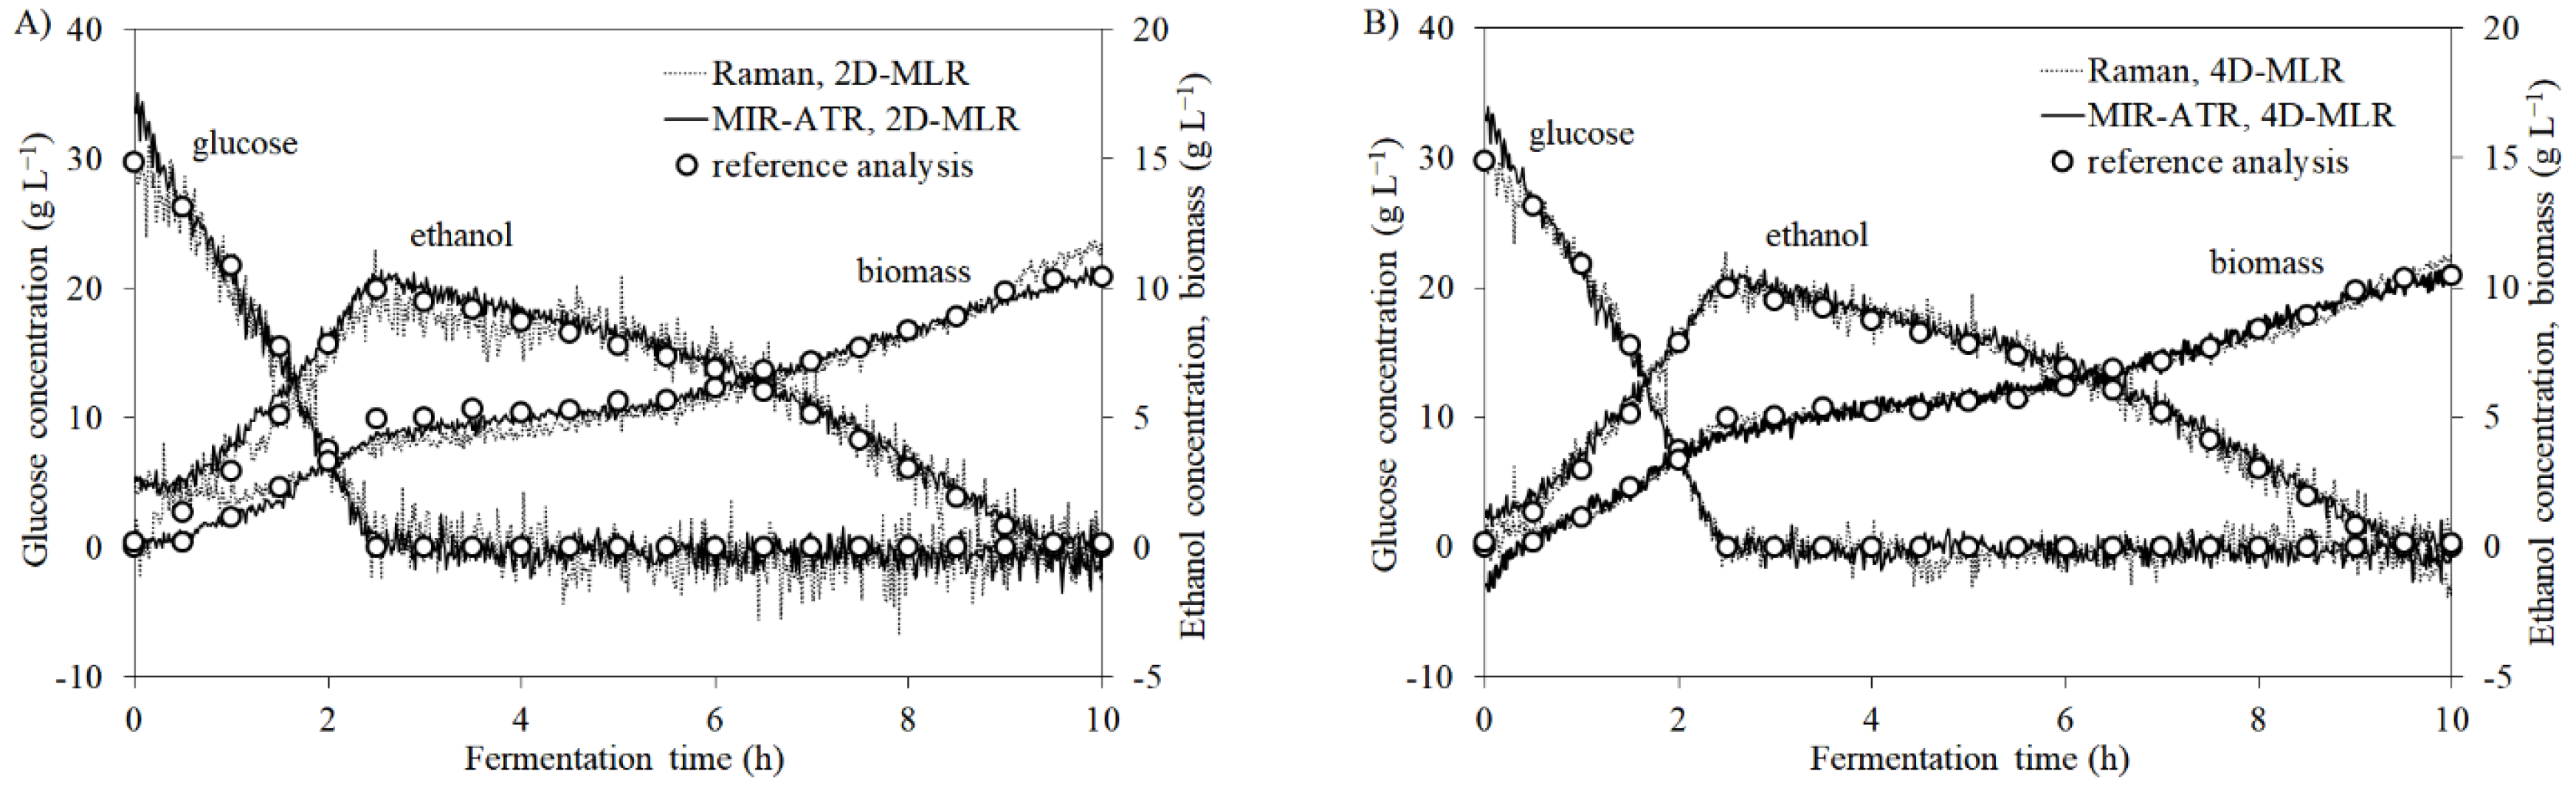
3.2. Prediction of Temporal Concentration Courses Using MLR and PLS Evaluation of Raman and MIR-ATR Spectra

The measured Raman intensity spectra and the MIR absorption spectra were converted into the corresponding analyte concentrations using the developed MLR and PLS models. For model building, the data of three fermentations were used. Applying the four models (2D MLR, 4D MLR, PLS without PP, PLS with PP) to the Raman intensity and MIR-ATR absorption spectra, the temporal concentration courses of glucose, ethanol, and biomass during a fourth fermentation were predicted (Figure 5).
During the first phase of the yeast fermentation, most of the carbon source glucose is metabolized into ethanol, biomass, and carbon dioxide [30]. Due to the high glucose concentration, the metabolism follows an oxidative-reductive metabolism (Crabtree effect) [35], enabling the formation of ethanol during an aerobic fermentation. As can be seen in Figure 5, the initial glucose concentration of 30 g L−1 was transformed within 2.5 h into an ethanol concentration of approximately 10 g L−1 and 5 g L−1 of dry yeast biomass. After the medium is depleted of glucose, an enzymatic adaption of the yeast cells with the aim to use the previously-formed ethanol as a new carbon substrate is observed [30]. In this phase of fermentation, the ethanol is converted into biomass and carbon dioxide [29,30]. Thereby the concentration of produced biomass increased to 10 g L−1 (biomass concentration including inoculum: 15 g L−1). Such a two-phase metabolism (first phase: growth on glucose, second phase: growth on ethanol) is termed diauxie and is based on the mechanism of catabolite repression [36,37]. The fermentations were stopped after 10 h, when the carbon source ethanol had been consumed.
For Raman and MIR spectroscopy, the predicted concentration courses of the analytes glucose, ethanol, and biomass were in good accordance with the reference values (HPLC, gravimetry). On closer examination, it can be seen that the MIR-ATR data showed smaller variations than the Raman curves. The temporal concentration courses using PLS models for the evaluation of Raman spectra exhibited less fluctuation than the corresponding MLR curves. One reason might be that the PLS evaluation was based on the complete spectral range and comprised more information. Consequently, interferences by particles, variations in sample composition, and temporal changes of the fluorescence background can better be compensated. Comparing the four multivariate methods, the 2D MLR data fluctuated most and showed larger deviations from the reference analytics. The temporal concentration courses generated by 4D MLR, PLS with PP, and PLS without PP were of similar quality.

3.3. Comparison of Raman and MIR Spectroscopy

Based on the data of three fermentations, the time-dependent concentration curves of a fourth fermentation can be predicted. Depending on the choice of fermentations, which are used for the model building and for the prediction, the quality parameters RMSEC and RMSEP can vary considerably. Through the permutation of the predicted yeast fermentation, while the other three fermentations were used for model building, four quality parameters were generated for a given analyte (glucose, ethanol, biomass), multivariate model (2D MLR, 4D MLR, PLS without PP, PLS with PP), and applied spectroscopic method (Raman, MIR-ATR). Averaging over these four values led to statistically more stable quality parameters and secured statements. For the comparison of Raman and MIR-ATR spectroscopy, the averaged RMSEC and RMSEP values (in g L−1) for each analyte and multivariate method are given in Table 2A. Dividing these values by the maximum concentration of the corresponding analyte, the relative calibration and prediction error for the determination of an analyte were obtained (Table 2B).
It can be seen in Table 2 that Raman and MIR spectroscopy exhibited similar quality parameters (RMSEC and RMSEP values) for a given analyte and multivariate regression model. The same applies for the comparison of 4D MLR, PLS without PP, and PLS with PP for a given analyte and spectroscopic method. In contrast, the calibration and prediction errors applying the simple 2D MLR models were approximately twice as high as for the other three multivariate methods. For example, the standard error of prediction for glucose in case of Raman spectroscopy and applying 2D MLR was 1.86 g L−1 (relative error 6.2%), whereas 4D MLR, PLS without PP, and PLS with PP yielded 1.08 g L−1 (3.6%), 0.92 g L−1 (3.1%), and 0.76 g L−1 (2.5%), respectively. The larger inaccuracies of the 2D MLR models are also indicated by the stronger fluctuations of the concentration curves in Figure 5. However, the extension of the 2D MLR models by two more channels to 4D MLR models significantly improved the results. By the selection of four analyte-specific optical channels, the simple 4D MLR could reach the performance of the more sophisticated PLS evaluation of Raman and MIR spectra.
Within the studies mentioned in the Introduction, the relative errors, with respect to the maximum glucose and ethanol concentrations, ranged between 0.2% and 6.0%. Only Iversen et al. [17] obtained bigger errors using Raman spectroscopy for the determination of glucose (11.9%) and ethanol (12.3%) concentrations during a lignocellulosic bioethanol production in conjunction with an internal standard and linear regression. The smallest relative errors for glucose (0.4%) and ethanol (0.2%) were found by Wang et al. [18] in conjunction with a PLS-PCA model. Ávila et al. [19] achieved relative errors of 5% for glucose and 2% for ethanol with the aid of a PLS evaluation. Similar relative errors of 5% for glucose and 3% for ethanol were obtained by Schalk et al. [20] applying 4D MLR models for the evaluation of Raman spectra. An MLR model was also used in [21] to calibrate the developed MIR-ATR sensor and a commercial FT-MIR spectrometer for monitoring of yeast fermentations. In that study, the glucose concentrations were predicted with a relative error of 6.2% in the case of the ATR sensor and 4.3% for the FT-MIR spectrometer setup. For the prediction of ethanol, the relative errors were 4.5% and 2.0%, respectively. For the evaluation of MIR-ATR spectra, Mazarevica et al. [22] developed a PLS method that was able to predict glucose and ethanol concentrations with relative errors of 0.9% and 2.2%, respectively. Sivakesava et al. [23] analyzed drawn samples from anaerobic yeast fermentations using an FT-MIR and an FT-Raman spectrometer. The initial glucose concentration of approximately 50 g L−1 was converted into an ethanol concentration of 20 g L−1 during the process. PLS models based on pre-processed MIR spectra generated the smallest error of prediction, which amounted to 1.8 g L−1 for glucose (corresponding to 4% relative error with respect to the maximum concentration), 1.2 g L−1 (6%) for ethanol, and 0.6 (20%) for the optical cell density. In the case of Raman spectroscopy, the weak intensity bands resulted in higher calibration errors in comparison to MIR spectroscopy. In that study, validation results (RMSEP values) for Raman were not given.
This study combined real-time monitoring of yeast fermentations using Raman and MIR-ATR spectroscopy. For both spectroscopic setups, the time-dependent concentration courses in Figure 5, and the quality parameters in Table 2 were in good agreement with a slight advantage for MIR-ATR spectroscopy. One reason for this result could be the higher spectral resolution of the recorded MIR spectra (4 cm−1) in comparison to the Raman spectra (approximately 7 cm−1). Therefore, using a Raman spectrometer with enhanced spectral resolution might improve the analytical performance of this method for fermentation monitoring. However, both spectroscopic methods have their advantages and disadvantages taking the sample constitution, as well as the measurement environment into account. Table 3 gives an overview of important criteria for process implementation of Raman and MIR-ATR spectroscopy and can help the user to select the appropriate spectroscopic method for the particular application.
Although the selectivity of both spectroscopic methods is high, other criteria differ from each other. For example, Raman spectroscopy measures intensities, whereas MIR spectroscopy measures absorbances. Likewise, the optical components (light sources, probes, and spectrometer) of typical Raman and MIR setups for reaction monitoring in a liquid phase are different.
In the MIR range, Fourier transform (FT) spectrometers, pyroelectric DTGS, or mercury cadmium telluride (MCT) semiconductor detectors and light sources, such as black-body radiators made of SiC (Globar), are predominantly utilized. To apply Lambert-–Beer’s law for the quantitative analysis of MIR spectra, optical path lengths in the order of micrometers are necessary to achieve absorbances A of less than two (A < 2). Such small path lengths can be realized by attenuated total reflection (ATR) [38]. The ATR prism (crystal) usually consists of Si, Ge, ZnSe, or diamond, where the latter exhibits the highest chemical resistance. In the case of ATR immersion probes, the prism is located at the probe tip. ATR immersion probes are connected to the light source and the spectrometer via optical fibers made of mixed silver halides or chalcogenides [3,39]. The length of optical fibers is restricted to less than 5 m due to the poor MIR transmission of these materials. The transmission losses in fibers and the light source’s weak intensity require liquid nitrogen-cooled MCT semiconductor detectors to obtain absorption spectra with sufficient signal-to-noise ratios. In addition, fibers made of these materials are fragile and become opaque over time. These circumstances complicate a transfer of this measurement setup from the laboratory into a process environment. In order to avoid the disadvantages of MIR fibers, the fiber-optical ATR probe can be replaced by an ATR module, which is directly integrated into the FT spectrometer. In such a design, the measurement is often carried out in a bypass, where the sample to be analyzed must be transported to the ATR module. In contrast to the fiber-optical immersion probe, there is no more in-line measurement. However, this measurement in the bypass is a real-time analysis of the original sample. Such a solution is much more cost-effective (about US$25,000 for the spectrometer used equipped with a DTGS detector and an ATR module) and more long-term stable than the fiber-optical setup (from US$60,000 for FT spectrometers with a liquid nitrogen-cooled MCT detector and a fiber-optical immersion probe). A weak point of MIR measurement systems with ATR flow cells could be biofilm formation or the deposition of silicone antifoam on the ATR crystal. The required cleaning of the crystal surface would cause considerable maintenance effort in a production plant. Gas bubbles can also have an influence on the evaluation of MIR-ATR and Raman spectra. Since the spectra of the calibration samples and the spectra for process monitoring were recorded at a constant aeration rate of 1.0 vvm, the effect of gas bubbles was largely compensated. Furthermore, neither the evaluation of MIR-ATR, nor Raman spectra was disturbed by the produced carbon dioxide. In the MIR spectrum, CO2 exhibits two strong absorption bands at 2349 cm−1 and 667 cm−1 [4], which lie outside the evaluated spectral range from 850–1250 cm−1. Raman peaks of CO2 can be observed in the PLS range at 1282 cm−1 and 1385 cm−1 [40], but at very low intensities (see Figure 3) and without a spectral overlap with the regions for MLR evaluation.
The measurement setup for process applications using Raman spectroscopy consists of an excitation laser, a fiber-optical Raman immersion probe, and a spectrometer. In contrast to MIR spectroscopy, quartz fibers with high light transmittance can be used in Raman spectroscopy, since the spectral range of the inelastically-scattered light lies in the visible or the near-infrared region depending on the wavelength of the excitation laser. Therefore, Raman spectroscopy combines the benefit of using quartz fiber optics with the high information content of MIR spectroscopy. The technological progress made in laser technology over the last few decades, as well as the development of efficient optical filters and highly-sensitive detectors led to an increased use of Raman spectroscopy during reaction monitoring [41]. Moreover, the penetration depth of the Raman laser beam into the sample (several millimeters) is higher by a factor of approximately 1000 in contrast to MIR-ATR setups (micrometers). Especially in the case of inhomogeneous samples, the higher optical path length could result in measuring representative sample volumes. Besides the fiber-optical Raman immersion probe, the measurement setup for process applications using Raman spectroscopy consists of a spectrometer and the excitation laser. The most common Raman lasers are the Nd:YAG laser (emission wavelength 1064 nm), GaAlAs laser diode (785 nm), Kr+ laser (647 nm), HeNe laser (633 nm), frequency-doubled Nd:YAG laser (532 nm), and Ar+ laser (488 nm or 514 nm) [42]. For recording the Raman spectra, either silicon charge-coupled device (Si CCD) array spectrometers or FT-NIR spectrometers with InGaAs or Ge detector are typically used. The type of spectrometer depends on the excitation wavelength of the laser and the wavelength range to be detected. Since the intensity of the Raman bands decreases with the fourth power of the laser wavelength, short excitation wavelengths lead to a high measuring sensitivity. Depending on the sample composition, short excitation wavelengths can cause a significant fluorescence background. As a consequence, only little fluorescence occurs when a Nd:YAG laser is used. However, the Raman signals are very weak when excited at 1064 nm. Therefore, an average laser wavelength of 785 nm represents a good compromise between measuring sensitivity and interfering fluorescence background for many applications. In Raman measurement systems, the 785-nm laser is often combined with a CCD spectrometer for the detection of light [17,43,44]. The penetration depth of the laser beam into turbid media is influenced by the light scattering of particles. Therefore, the measuring sensitivity of Raman spectroscopy can vary with particle diameter and concentration. In the case of yeast cells, cell densities (concentrations) below 108 cells per milliliter would cause nonlinearities in the calibration models. In this work, the Raman measuring sensitivity was approximately constant during the yeast fermentations, since cell densities were always above 1.3 × 10⁸ cells per milliliter (biomass concentration 5 g L−1). The influence of yeast cells and other particles on the Raman signal due to light scattering can be reduced by using an especially opaque media-optimized Raman probe with a short focal length [34,45]. Furthermore, laser instabilities and the decrease of laser output power over the operational life directly influence measuring sensitivity, since Raman spectroscopy is an absolute method (measured analyte concentration is proportional to intensity signal). Such variations in laser output power can be compensated by the use of internal or external standards [46]. In contrast to Raman spectroscopy, long-term intensity fluctuations of the black-body radiators in MIR setups have no impact on the stability of calibration models, if background measurements (e.g., intensity spectra against ambient air) are performed at regular intervals.
Based on the presented results, MIR-ATR spectroscopy has slight advantages over Raman spectroscopy for bioprocess monitoring in laboratories. Furthermore, the price of the MIR measurement setup (US$25,000) used is considerably lower than the price for the Raman system (US$70,000). An important advantage of Raman spectroscopy is the use of quartz fibers. This enables bridging distances of over 100 m between the Raman probe and spectrometer or laser and simplifies the implementation in an industrial process environment.

4. Conclusions

A fiber-optical Raman and an MIR-ATR spectrometer setup were used for real-time measurement of glucose, ethanol, and biomass during yeast fermentations and were compared with regard to their suitability for bioprocess monitoring. MLR and PLS regression models were developed in order to link the measured Raman intensity and MIR-ATR absorption spectra to the corresponding analyte concentrations. For both spectroscopic setups, the time-dependent concentration courses of glucose, ethanol, and biomass were registered with a temporal resolution of one minute. Raman and MIR spectroscopy exhibited similar RMSEC and RMSEP values for a given analyte and multivariate regression model. The extension of the relatively inaccurate 2D MLR models by two more channels to 4D MLR models improved the results significantly. By selecting four analyte-specific optical channels, the 4D MLR models could even reach the performance of the more complex PLS evaluation of Raman and MIR spectra.
The evaluation of measurement data by simple MLR models allows simulating the analytical performance (RMSEC, RMSEP) of fictive photometer setups and compact sensors with few optical channels (spectral ranges). Furthermore, it can be estimated whether miniaturized and low-priced multi-channel Raman or MIR-ATR sensors can replace spectrometers without loss of accuracy, provided that the optical performance (light intensity, detector sensitivity, etc.) of both setups is comparable. Such a mathematical procedure opens up new possibilities for cost-efficient photometric hardware concepts. Instead of the common, but expensive Raman spectrometer systems with Peltier-cooled CCD-lines, appropriate filter units in the respective wavenumber ranges in combination with single detectors such as avalanche photodiodes (APDs) or multi-pixel photon counters (MPPCs) can be established. A Raman sensor based on MPPCs was developed by Nachtmann et al. [47] for applications in explosive atmospheres. This photometric sensor is designed for only two spectral ranges. To implement such a photometric sensor for fermentation monitoring, further work on extending the sensor to four channels is required. In the case of MIR spectroscopy, a four-channel MIR-ATR sensor equipped with an IR emitter as a light source, a ZnSe ATR prism, four thermopile detectors, and four optical bandpass filters has already been realized [10]. In order to monitor the diauxic yeast fermentation at lower glucose concentrations than in [21], the sensor’s sensitivity and specificity should be improved.
However, this study has shown that for Raman and MIR spectroscopy, respectively, only four optical channels and consequently simple MLR models are sufficient to monitor glucose, ethanol, and biomass during aerobic yeast fermentations under the described cultivation conditions.

Author Contributions

Conceptualization, R.S. and T.B.; investigation, R.S., A.H., and T.B.; methodology, R.S., G.I., and T.B.; software, G.I.; visualization, R.S. and A.H.; writing, original draft, R.S., A.H., and T.B.; writing, review and editing, F.B., M.R., N.G., and F.-J.M.

Funding

The article processing charge was funded by the Baden-Württemberg Ministry of Science, Research and Culture and the Mannheim University of Applied Sciences in the funding programme Open Access Publishing.

Acknowledgments

We gratefully acknowledge support from the Albert and Anneliese Konanz-Foundation of the Mannheim University of Applied Sciences. We would also like to thank the Institute for Technical Microbiology (Mannheim University of Applied Sciences, Germany), especially Christiane Koch and Kerstin Schlosser, for providing the HPLC system.

Conflicts of Interest

The authors declare no conflict of interest.

References

  1. Lam, H.; Kostov, Y. Optical Instrumentation for Bioprocess Monitoring. In Optical Sensor Systems in Biotechnology; Rao, G., Ed.; Springer: Berlin/Heidelberg, Germany, 2009; Volume 116, pp. 125–142. [Google Scholar]
  2. Marose, S. Optical sensor systems for bioprocess monitoring. Trends Biotechnol. 1999, 17, 30–34. [Google Scholar] [CrossRef]
  3. Roychoudhury, P.; Harvey, L.M.; McNeil, B. The potential of mid infrared spectroscopy (MIRS) for real time bioprocess monitoring. Anal. Chim. Acta 2006, 571, 159–166. [Google Scholar] [CrossRef] [PubMed]
  4. Günzler, H.; Gremlich, H.-U. IR Spectroscopy: An Introduction, 1st ed.; Wiley-VCH: Weinheim, Germany, 2002. [Google Scholar]
  5. Kessler, R.W. Perspectives in process analysis: Process analysis and technology. J. Chemom. 2013, 27, 369–378. [Google Scholar] [CrossRef]
  6. Braun, F.; Schalk, R.; Brunner, J.; Eckhardt, H.S.; Theuer, M.; Veith, U.; Henning, S.; Ferstl, W.; Methner, F.-J.; Beuermann, T.; et al. Nicht-invasive Prozesssonde zur Inline-Ramananalyse durch optische Schaugläser. TM-TECH MESS 2016, 83, 593–605. [Google Scholar] [CrossRef]
  7. Mosier-Boss, P.A.; Lieberman, S.H. Detection of Anions by Normal Raman Spectroscopy and Surface-Enhanced Raman Spectroscopy of Cationic-Coated Substrates. Appl. Spectrosc. 2003, 57, 1129–1137. [Google Scholar] [CrossRef] [PubMed]
  8. Martin, J.W.; Nieuwoudt, M.K.; Vargas, M.J.T.; Bodley, O.L.C.; Yohendiran, T.S.; Oosterbeek, R.N.; Williams, D.E.; Cather Simpson, M. Raman on a disc: High-quality Raman spectroscopy in an open channel on a centrifugal microfluidic disc. Analyst 2017, 142, 1682–1688. [Google Scholar] [CrossRef] [PubMed]
  9. Otto, M. Analytische Chemie, 2nd ed.; Wiley-VCH: Weinheim, Germany, 2003. [Google Scholar]
  10. Geoerg, D.; Schalk, R.; Methner, F.-J.; Beuermann, T. MIR-ATR sensor for process monitoring. Meas. Sci. Technol. 2015, 26, 065501. [Google Scholar] [CrossRef]
  11. Schwolow, S.; Braun, F.; Rädle, M.; Kockmann, N.; Röder, T. Fast and Efficient Acquisition of Kinetic Data in Microreactors Using In-Line Raman Analysis. Org. Process Res. Dev. 2015, 19, 1286–1292. [Google Scholar] [CrossRef]
  12. Braun, F.; Schwolow, S.; Seltenreich, J.; Kockmann, N.; Röder, T.; Gretz, N.; Rädle, M. Highly Sensitive Raman Spectroscopy with Low Laser Power for Fast In-Line Reaction and Multiphase Flow Monitoring. Anal. Chem. 2016, 88, 9368–9374. [Google Scholar] [CrossRef]
  13. Mueller, J.J.; Baum, S.; Hilterhaus, L.; Eckstein, M.; Thum, O.; Liese, A. Simultaneous Determination of Mono-, Di-, and Triglycerides in Multiphase Systems by Online Fourier Transform Infrared Spectroscopy. Anal. Chem. 2011, 83, 9321–9327. [Google Scholar] [CrossRef]
  14. Otto, M. Chemometrics: Statistics and Computer Application in Analytical Chemistry, 2nd ed.; Wiley-VCH: Weinheim, Germany, 2007. [Google Scholar]
  15. Kessler, W. Multivariate Datenanalyse für die Pharma-, Bio- und Prozessanalytik: Ein Lehrbuch, 1st ed.; Wiley-VCH: Weinheim, Germany, 2008. [Google Scholar]
  16. Kozma, B.; Salgó, A.; Gergely, S. Comparison of multivariate data analysis techniques to improve glucose concentration prediction in mammalian cell cultivations by Raman spectroscopy. J. Pharm. Biomed. Anal. 2018, 158, 269–279. [Google Scholar] [CrossRef] [PubMed]
  17. Iversen, J.A.; Ahring, B.K. Monitoring lignocellulosic bioethanol production processes using Raman spectroscopy. Bioresour. Technol. 2014, 172, 112–120. [Google Scholar] [CrossRef] [PubMed]
  18. Wang, Q.; Li, Z.; Ma, Z.; Liang, L. Real time monitoring of multiple components in wine fermentation using an on-line auto-calibration Raman spectroscopy. Sens. Actuators B Chem. 2014, 202, 426–432. [Google Scholar] [CrossRef]
  19. Ávila, T.C.; Poppi, R.J.; Lunardi, I.; Tizei, P.A.G.; Pereira, G.A.G. Raman spectroscopy and chemometrics for on-line control of glucose fermentation by Saccharomyces cerevisiae. Biotechnol. Prog. 2012, 28, 1598–1604. [Google Scholar] [CrossRef] [PubMed]
  20. Schalk, R.; Braun, F.; Frank, R.; Rädle, M.; Gretz, N.; Methner, F.-J.; Beuermann, T. Non-contact Raman spectroscopy for in-line monitoring of glucose and ethanol during yeast fermentations. Bioprocess Biosyst. Eng. 2017, 40, 1519–1527. [Google Scholar] [CrossRef]
  21. Schalk, R.; Geoerg, D.; Staubach, J.; Raedle, M.; Methner, F.-J.; Beuermann, T. Evaluation of a newly developed mid-infrared sensor for real-time monitoring of yeast fermentations. J. Biosci. Bioeng. 2017, 123, 651–657. [Google Scholar] [CrossRef] [PubMed]
  22. Mazarevica, G.; Diewok, J.; Baena, J.R.; Rosenberg, E.; Lendl, B. On-Line Fermentation Monitoring by Mid-Infrared Spectroscopy. Appl. Spectrosc. 2004, 58, 804–810. [Google Scholar] [CrossRef]
  23. Sivakesava, S.; Irudayaraj, J.; Demirci, A. Monitoring a bioprocess for ethanol production using FT-MIR and FT-Raman spectroscopy. J. Ind. Microbiol. Biotechnol. 2001, 26, 185–190. [Google Scholar] [CrossRef]
  24. Beutel, S.; Henkel, S. In situ sensor techniques in modern bioprocess monitoring. Appl. Microbiol. Biotechnol. 2011, 91, 1493–1505. [Google Scholar] [CrossRef]
  25. Haaland, D.M.; Thomas, E.V. Partial least-squares methods for spectral analyses. 1. Relation to other quantitative calibration methods and the extraction of qualitative information. Anal. Chem. 1988, 60, 1193–1202. [Google Scholar] [CrossRef]
  26. Geladi, P. Notes on the history and nature of partial least squares (PLS) modelling. J Chemom. 1988, 2, 231–246. [Google Scholar] [CrossRef]
  27. Preacher, K.J.; Curran, P.J.; Bauer, D.J. Computational Tools for Probing Interactions in Multiple Linear Regression, Multilevel Modeling, and Latent Curve Analysis. J. Educ. Behav. Stat. 2006, 31, 437–448. [Google Scholar] [CrossRef]
  28. Carey, W.P.; Beebe, K.R.; Sanchez, E.; Geladi, P.; Kowalski, B.R. Chemometric analysis of multisensor arrays. Sens. Actuators 1986, 9, 223–234. [Google Scholar] [CrossRef]
  29. Beuermann, T.; Egly, D.; Geoerg, D.; Klug, K.I.; Storhas, W.; Methner, F.-J. On-line carbon balance of yeast fermentations using miniaturized optical sensors. J. Biosci. Bioeng. 2012, 113, 399–405. [Google Scholar] [CrossRef] [PubMed]
  30. Locher, G.; Hahnemann, U.; Sonnleitner, B.; Fiechter, A. Automatic bioprocess control. 4. A prototype batch of Saccharomyces cerevisiae. J. Biotechnol. 1993, 29, 57–74. [Google Scholar] [CrossRef]
  31. Ibrahim, M.; Alaam, M.; El-Haes, H.; Jalbout, A.F.; de Leon, A. Analysis of the structure and vibrational spectra of glucose and fructose. Eclet. Quim. 2006, 31, 15–21. [Google Scholar] [CrossRef]
  32. Picard, A.; Daniel, I.; Montagnac, G.; Oger, P. In situ monitoring by quantitative Raman spectroscopy of alcoholic fermentation by Saccharomyces cerevisiae under high pressure. Extremophiles 2007, 11, 445–452. [Google Scholar] [CrossRef] [PubMed]
  33. Shope, T.B.; Vickers, T.J.; Mann, C.K. The Direct Analysis of Fermentation Products by Raman Spectroscopy. Appl. Spectrosc. 1987, 41, 908–912. [Google Scholar] [CrossRef]
  34. Iversen, J.A.; Berg, R.W.; Ahring, B.K. Quantitative monitoring of yeast fermentation using Raman spectroscopy. Anal. Bioanal. Chem. 2014, 406, 4911–4919. [Google Scholar] [CrossRef]
  35. Dashko, S.; Zhou, N.; Compagno, C.; Piškur, J. Why, when, and how did yeast evolve alcoholic fermentation? FEMS Yeast Res. 2014, 14, 826–832. [Google Scholar] [CrossRef] [Green Version]
  36. Daran-Lapujade, P.; Jansen, M.L.A.; Daran, J.-M.; van Gulik, W.; de Winde, J.H.; Pronk, J.T. Role of Transcriptional Regulation in Controlling Fluxes in Central Carbon Metabolism of Saccharomyces cerevisiae: A chemostat culture study. J. Biol. Chem. 2004, 279, 9125–9138. [Google Scholar] [CrossRef] [PubMed]
  37. DeRisi, J.L. Exploring the Metabolic and Genetic Control of Gene Expression on a Genomic Scale. Science 1997, 278, 680–686. [Google Scholar] [CrossRef] [PubMed] [Green Version]
  38. Harrick, N.J.; Beckmann, K.H. Internal Reflection Spectroscopy. In Characterization of Solid Surfaces; Kane, P.F., Larrabee, G.B., Eds.; Springer: Boston, MA, USA, 1974; pp. 215–245. [Google Scholar]
  39. Minnich, C.B.; Buskens, P.; Steffens, H.C.; Bäuerlein, P.S.; Butvina, L.N.; Küpper, L.; Leitner, W.; Liauw, M.A.; Greiner, L. Highly Flexible Fibre-Optic ATR-IR Probe for Inline Reaction Monitoring. Org. Process Res. Dev. 2007, 11, 94–97. [Google Scholar] [CrossRef]
  40. Fan, H.; Liu, J.; Guo, J.; Ye, K.; Cong, B. Fluid inclusions in whiteschist in the ultrahigh-pressure metamorphic belt of Dabie Shan, China. Chin. Sci. Bull. 2002, 47, 1028–1032. [Google Scholar] [CrossRef]
  41. Schmitt, M.; Popp, J. Raman spectroscopy at the beginning of the twenty-first century. J. Raman Spectrosc. 2006, 37, 20–28. [Google Scholar] [CrossRef]
  42. Vandenabeele, P. Practical Raman Spectroscopy: An Introduction, 1st ed.; Wiley: Chichester, West Sussex, UK, 2013. [Google Scholar]
  43. André, S.; Cristau, L.S.; Gaillard, S.; Devos, O.; Calvosa, É.; Duponchel, L. In-line and real-time prediction of recombinant antibody titer by in situ Raman spectroscopy. Anal. Chim. Acta 2015, 892, 148–152. [Google Scholar] [CrossRef] [PubMed]
  44. Berry, B.; Moretto, J.; Matthews, T.; Smelko, J.; Wiltberger, K. Cross-scale predictive modeling of CHO cell culture growth and metabolites using Raman spectroscopy and multivariate analysis. Biotechnol. Prog. 2015, 31, 566–577. [Google Scholar] [CrossRef] [PubMed]
  45. Marquardt, B.; Burgess, L. Optical Immersion Probe Incorporating a Spherical Lens. U.S. Patent US20040165183A1, 2004. [Google Scholar]
  46. Vankeirsbilck, T.; Vercauteren, A.; Baeyens, W.; Van der Weken, G.; Verpoort, F.; Vergote, G.; Remon, J.P. Applications of Raman spectroscopy in pharmaceutical analysis. Trends Anal. Chem. 2002, 21, 869–877. [Google Scholar] [CrossRef]
  47. Nachtmann, M.; Keck, S.P.; Braun, F.; Eckhardt, H.S.; Mattolat, C.; Gretz, N.; Scholl, S.; Rädle, M. A customized stand-alone photometric Raman sensor applicable in explosive atmospheres: A proof-of-concept study. JSSS 2018, 7, 543–549. [Google Scholar] [CrossRef]
Figure 1. Measurement setup for simultaneous monitoring of yeast fermentations using Raman and mid-infrared spectroscopy.
Applsci 09 02472 g001
Figure 2. FT-MIR-ATR spectra obtained during yeast fermentation and selected spectral regions (S1–S4) used for the MLR models. The spectra were corrected against the culture medium and inoculum without the initial carbon source glucose and offset-corrected by subtraction of a straight line. Top right: FT-MIR-ATR spectra of 30 g L−1 glucose and 10 g L−1 ethanol in deionized water for comparison (background against deionized water).
Applsci 09 02472 g002
Figure 3. Raman spectra obtained during yeast fermentation and selected spectral regions (S1–S4) used for the MLR models. The spectra were corrected against the culture medium and inoculum without the initial carbon source glucose and offset-corrected by subtraction of a straight line. Top left: Raman spectra of 30 g L−1 glucose and 10 g L−1 ethanol in deionized water for comparison (background against deionized water).
Applsci 09 02472 g003
Figure 4. Uncorrected Raman spectra recorded during batch fermentation of S. cerevisiae. The fluorescence background is rising from higher to smaller Raman shifts and is increasing during the yeast fermentation.
Applsci 09 02472 g004
Figure 5. Predicted time-dependent concentration courses of glucose, ethanol, and biomass during batch-fermentation of S. cerevisiae. (A) 2D MLR, (B) 4D MLR, (C) PLS without pre-processing (PP), (D) PLS with PP. Comparison of real-time measurement data by Raman and MIR-ATR with off-line reference values (HPLC, gravimetry).
Applsci 09 02472 g005aApplsci 09 02472 g005b
Table 1. Spectral regions for the evaluation of glucose, ethanol, and biomass (see below) by multiple linear regression (MLR) and partial least squares (PLS) models.
ChannelRaman (cm−1)MIR (cm−1)Function
S11112–11321140–1160Glucose measurement
S21165–11851213–1233Glucose reference
S3868–8881040–1060Ethanol measurement
S4825–8451060–1080Ethanol reference
-800–1400850–1250Spectral range for PLS
Table 2. Comparison of calibration and validation results applying Raman and MIR-ATR spectroscopy for real-time monitoring of yeast fermentations. (A) Calibration (RMSEC) and prediction (RMSEP) errors in g L−1 for glucose, ethanol, and biomass. (B) RMSEC and RMSEP in percent with respect to the maximum concentration of glucose (30 g L−1), ethanol (10 g L−1), and biomass (15 g L−1).
Regression ModelQuality ParameterRaman SystemMIR-ATR System
GlucoseEthanolBiomassGlucoseEthanolBiomass
A2D MLRRMSEC (g L−1)1.830.680.861.060.610.66
RMSEP (g L−1)1.860.710.861.180.770.73
4D MLRRMSEC (g L−1)1.030.470.330.870.310.44
RMSEP (g L−1)1.080.500.360.970.380.47
PLS without PPRMSEC (g L−1)0.900.410.301.000.450.47
RMSEP (g L−1)0.920.390.300.680.480.37
PLS with PPRMSEC (g L−1)0.780.560.500.860.300.36
RMSEP (g L−1)0.760.560.480.760.280.33
B2D MLRRMSEC (%)6.16.85.73.56.14.4
RMSEP (%)6.27.15.83.97.74.9
4D MLRRMSEC (%)3.44.72.22.93.12.9
RMSEP (%)3.65.02.43.23.83.1
PLS without PPRMSEC (%)3.04.12.03.34.53.2
RMSEP (%)3.13.92.02.34.82.4
PLS with PPRMSEC (%)2.65.63.32.93.02.4
RMSEP (%)2.55.63.22.52.82.2
Table 3. Comparison of the functionalities of Raman versus MIR-ATR spectroscopy for bioprocess monitoring (+ advantage, o sufficient, − disadvantage/challenging).
CriterionRamanMIR
Selectivity++
Sensitivityo+
Life-time of light sourceo+
Use of optical fibers+
Error of calibration/prediction++
Interference by light scattering or fluorescence +
Interference by film formation +
Process implementation +o
Costso+

