Extensive Modeling of Peculiar Hydration in Fine Micro-Pore Structures Applicable to Integrated Thermodynamic Analysis for Portland Cement


1
Technology Center, Taisei Corporation, Kanagawa 245-0051, Japan
2
Department of Civil Engineering, The University of Tokyo, Tokyo 113-8656, Japan
*
Author to whom correspondence should be addressed.
Appl. Sci. 2019, 9(10), 2137; https://doi.org/10.3390/app9102137
Submission received: 11 April 2019
/
Revised: 13 May 2019
/
Accepted: 20 May 2019
/
Published: 24 May 2019
(This article belongs to the Section Civil Engineering)
Abstract
:Although applications of low water-to-cement ratio mixtures to practical structures have been increasing to enhance seismic resistance and long-term durability in recent years, it was experimentally observed that such a mixture causes peculiar hydration under long-term normal or high temperature curing. On the other hand, excessive hydration was revealed in the analysis using the original model, compared with the experiment in such an environment, because un-hydrated cement particles and existing condensed water reacted more significantly in the model. This study aims to enhance the integrated multiscale thermodynamic analysis, which is able to predict structural behavior in various conditions in a unified approach, by incorporating recent technical evolutions for its reverification and extending the original model to resolve the above peculiar concerns. Hence, the extensive modeling of continuous hydration considering spatial condensed water in fine micro-pore structures was proposed. Further, coupling of the integrated analysis with the extensive model was conducted, providing good agreement with time-dependent deformation experiments at different temperatures. Eventually, the validity and practical benefit of this study were demonstrated.
1. Introduction
Hydration occurs as soon as cement comes into contact with water to form micro-pore structures while precipitating hydration products. Moisture contained in multiscale pores is transported in both liquid and gas phases according to thermodynamic equilibrium, inducing internal stress and volumetric changes, which are closely related to the occurrence of fractures. The internal states of concrete including re-bars continuously change due to external forces and environmental actions, influencing the long-term durability and time-dependent behavior as a reinforced concrete (RC) structure.
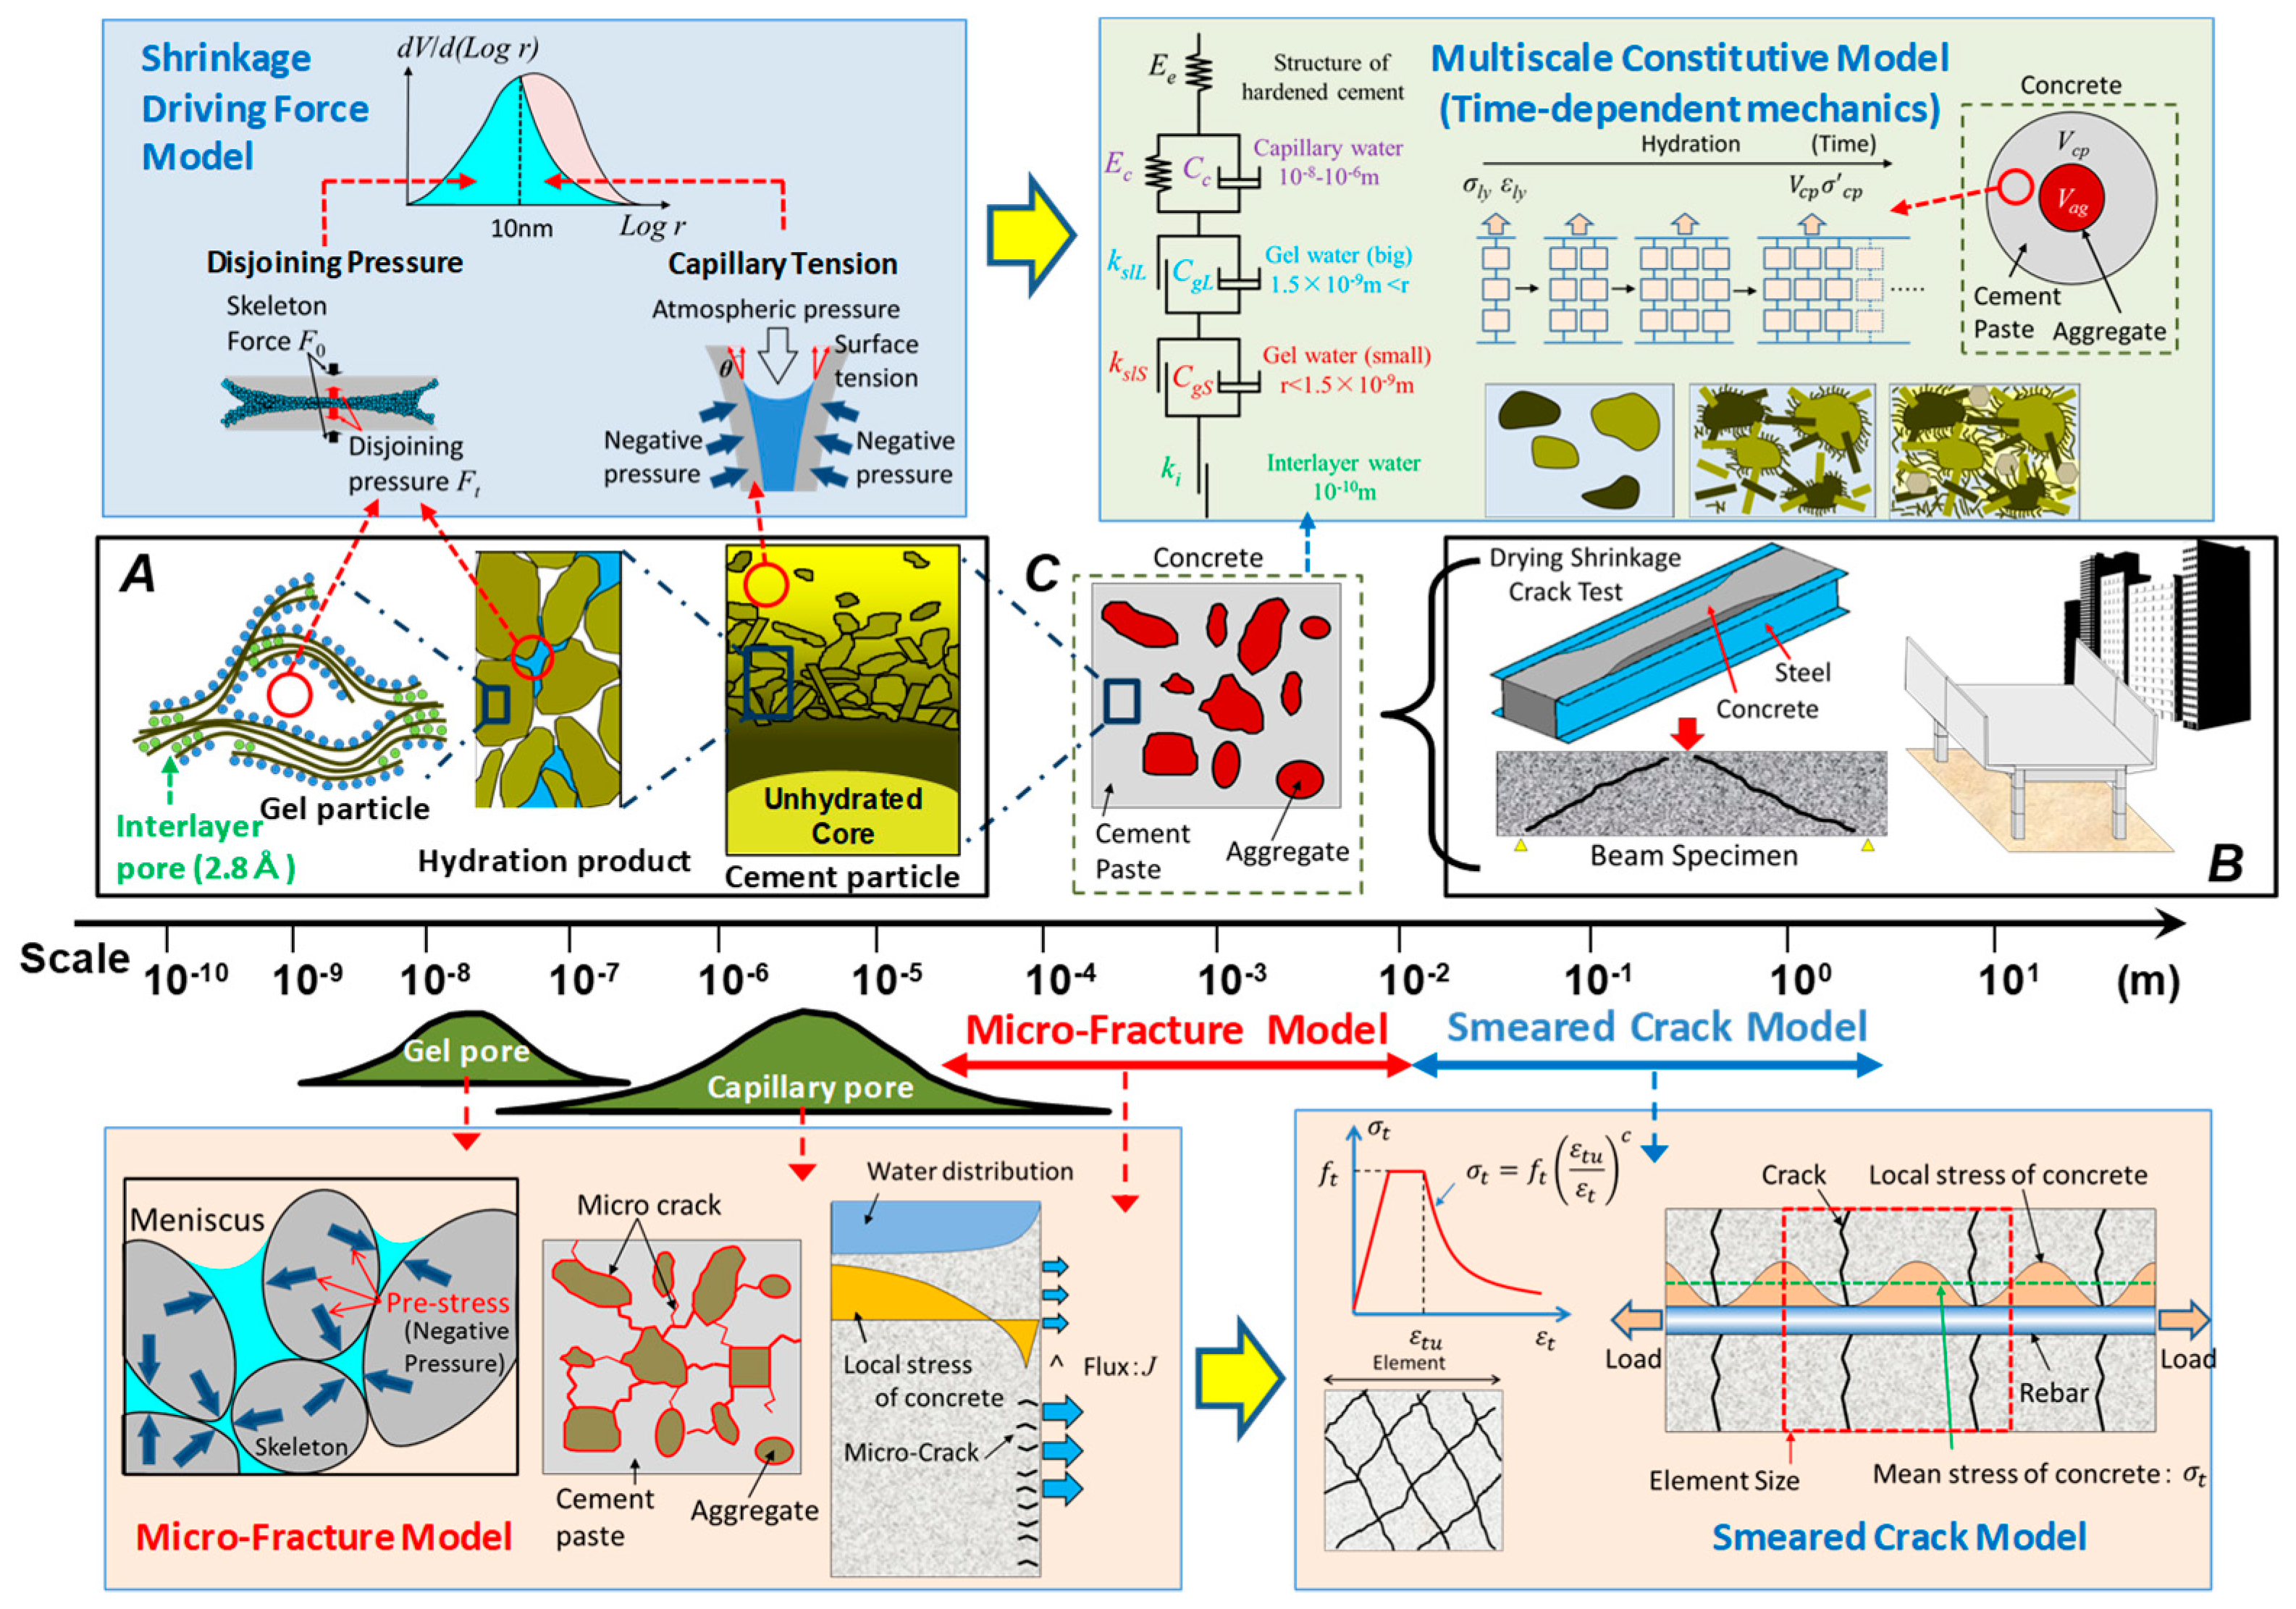
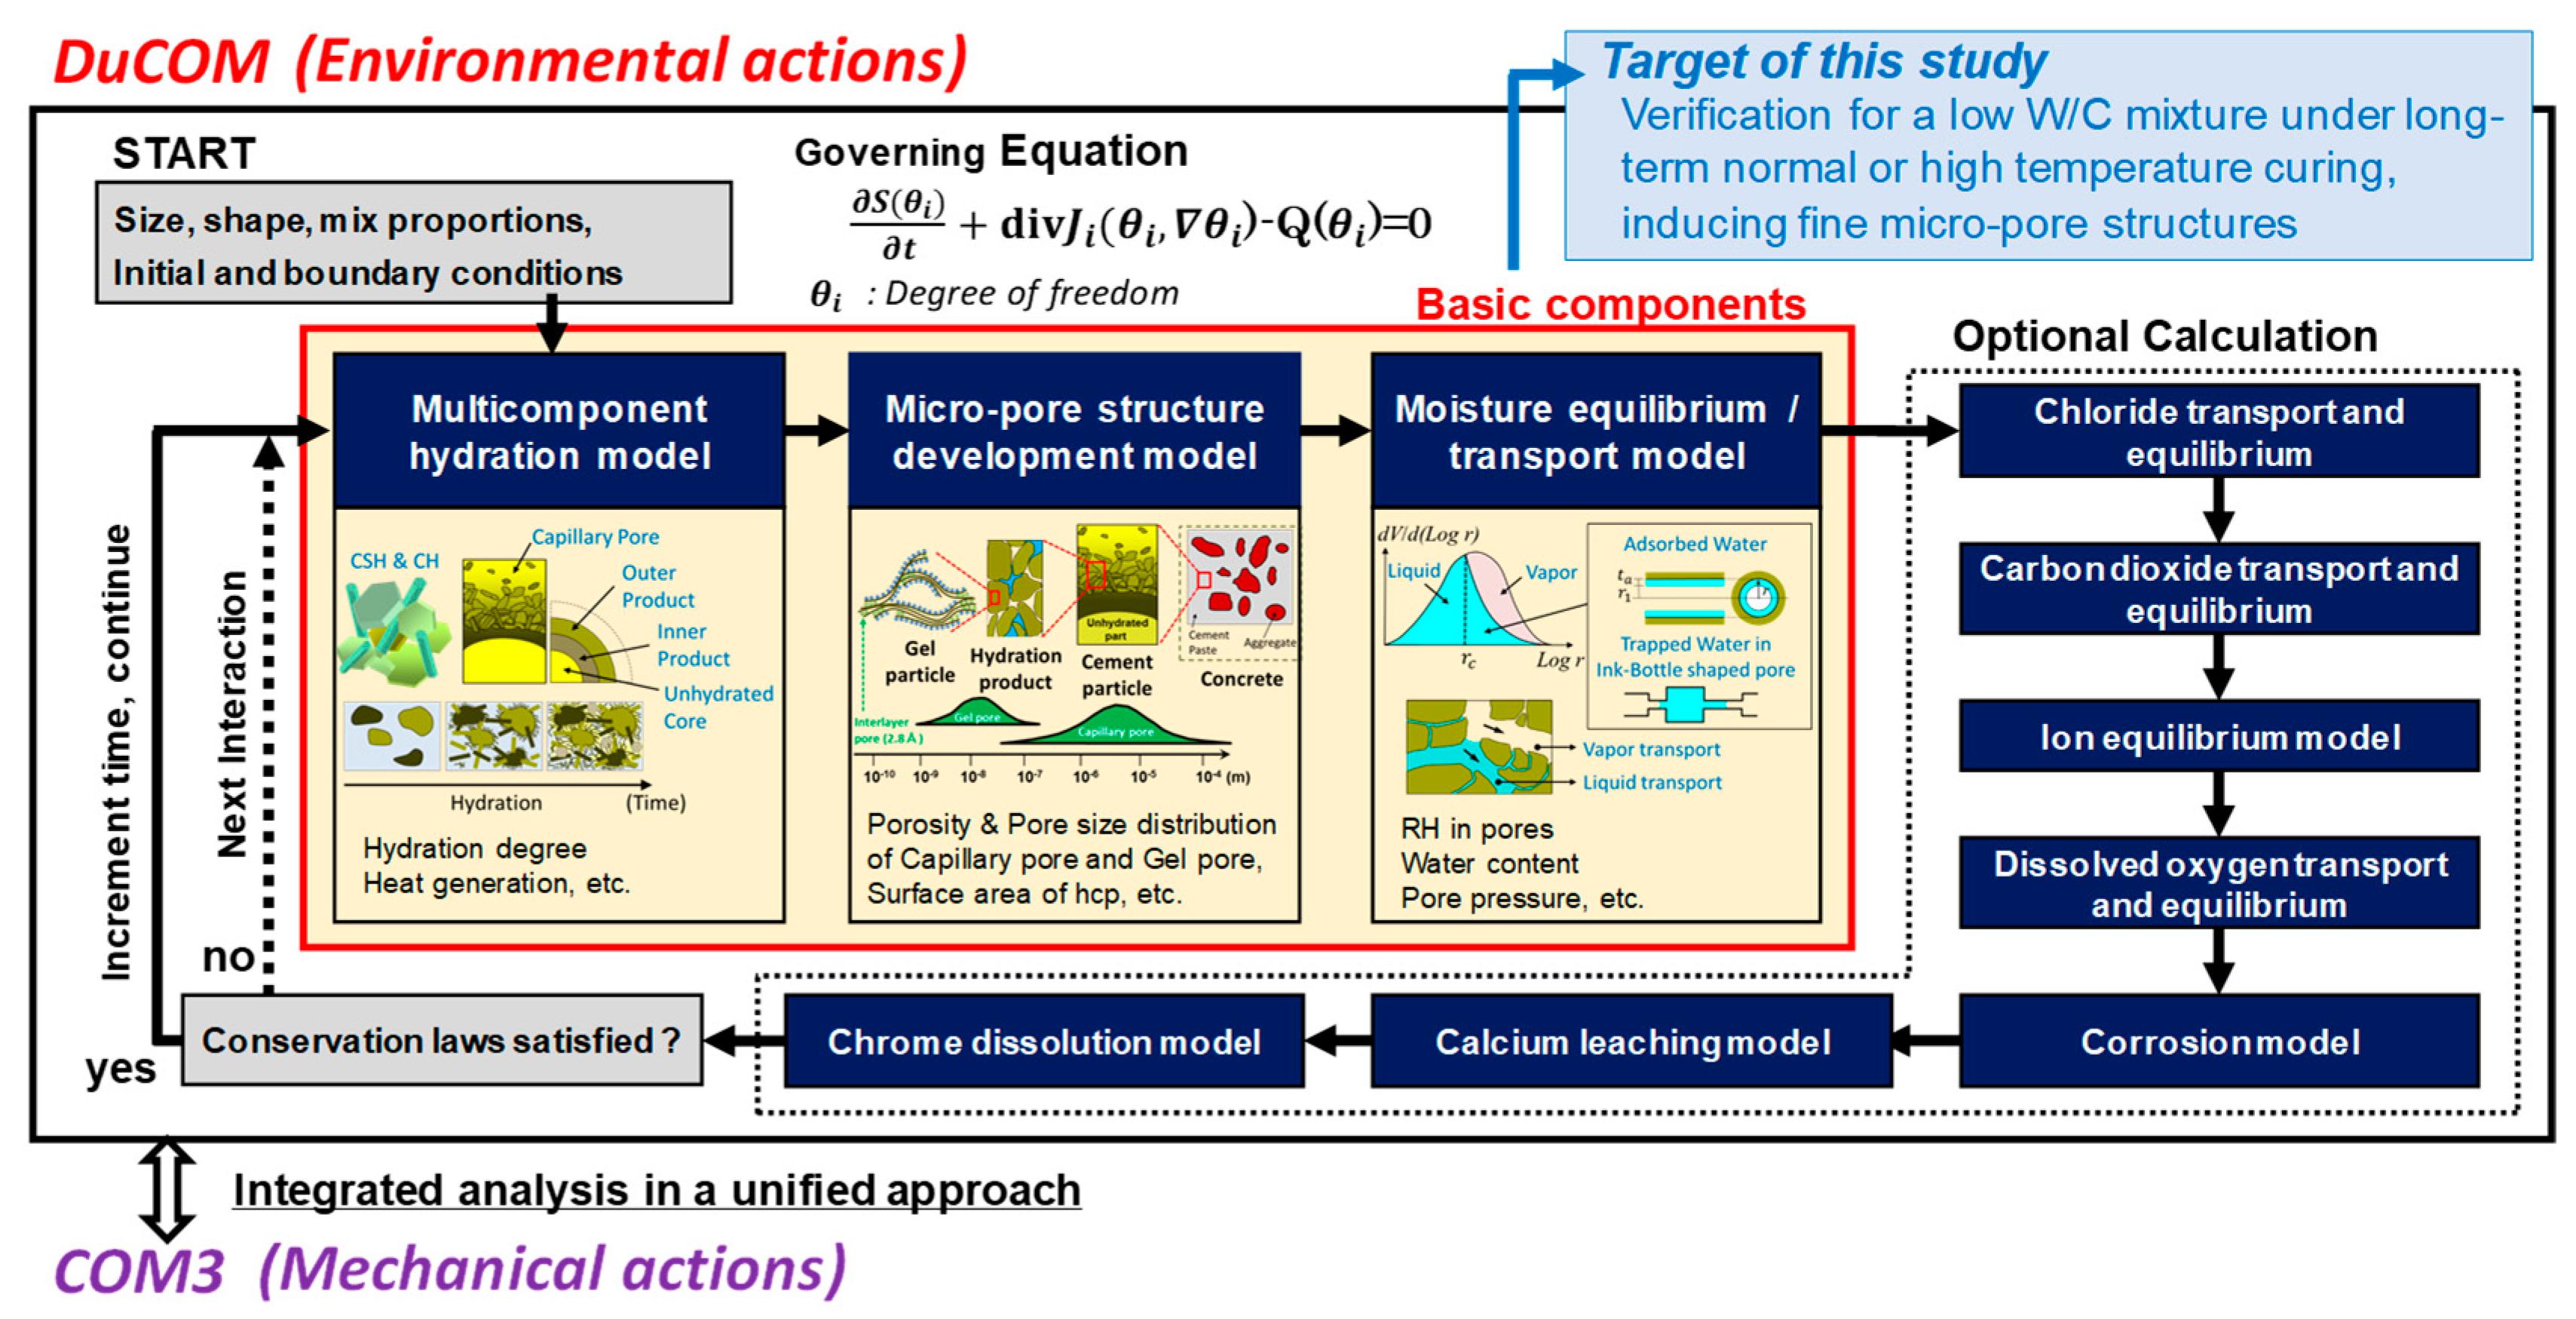
The Concrete Laboratory of the University of Tokyo has been developing an integrated microphysics and macro-structural analysis system to predict the overall behavior of a RC structure in various conditions in a unified approach for its entire service life [1]. This integrated system synthesizes the following two systems: one simulating micro-pore structures and thermodynamic states in multiscale pores based on physical chemistry, considering hydration and environmental actions [2], and the other relating to structural mechanics modeling to estimate non-linear dynamic macroscopic behavior of a RC structure, even if including damage, under mechanical actions [3]. They are generally referred to as DuCOM (Durability of COncrete Model) and COM3, respectively [1,4]. Figure 1 illustrates the scheme of the integrated multiscale analysis system in which (A) DuCOM and (B) COM3 are linked with (C) the multiscale constitutive model. The driving force behind volumetric changes is assumed to be related to either capillary pressure or disjoining pressure according to the calculated thermodynamic moisture state in micro-pores in DuCOM. As shown in (C), concrete is idealized as a two-phase composite of elastic aggregate and hardening cement paste and its hardening is expressed by the progressive formation of finite fictitious clusters as the hydration proceeds based on the solidification theory [5]. Each component is composed of an elastic spring, a dashpot and a slider whose parameters are associated with thermo-hydro states. Given input data such as mix proportions, material properties, the geometry of a structure and boundary conditions, the time-dependent deformation can be computed without conventional classification such as autogenous/drying shrinkage and basic/drying creep, dealing with macroscopic structural responses based on the smeared crack model in COM3. In addition, microcracks caused by drying are taken into account in the micro-fracture model [6]. It has been reported that the integrated system could simulate large-scale structural behavior such as long-term deflection of prestressed concrete viaducts with good consistency [7,8] and contributed to early cracking assessment of actual RC bridge decks [6]. In this way, each constitutional model in DuCOM-COM3 and the integrated system have been well verified by efforts of so far engaged researchers over decades for general conditions as input data [1,2,3,4,5,6,7,8].
On the other hand, applications of low water-to-cement ratio (W/C) mixtures to practical structures have been increasing to enhance seismic resistance and long-term durability to meet modern severe requirements [9]. In the case of a large structure with a low W/C mixture, it takes a very long time for the internal moisture state to reach equilibrium with the external environment. Additionally, hydration continuously proceeds for a long time because of the existing inner unreacted particles and most of the formed micro-pores falling into an unsaturated state due to self-desiccation. Thus, numerical prediction of time-dependent deformation on a large scale becomes increasingly difficult especially with a low W/C. Moreover, thermal loading on such a structure can cause even more complex and sensitive phenomena.
Nevertheless, the basic components of DuCOM, which consist of a multicomponent hydration, micro-pore development structure and moisture equilibrium/transport model, and its shrinkage driving force formulation have been verified for low W/C mixtures. However, these verifications have been conducted mainly for short-term experiments, and in other words, those for long-term ones are further required. Of course, such a specific condition as exposure to a thermal environment for a long time after sufficient curing at ordinary temperature has scarcely been checked. Hence, this study is intended to focus on the deficient part of verification as illustrated in Figure 2. As various thermodynamic states estimated based on the basic components of DuCOM are transferred to both the subsequent parts of DuCOM and COM3 in a certain timestep, precise modeling of the basic components significantly impacts durability and a structural behavior prediction through DuCOM-COM3. Eventually, the improvement is highly important for the integrated multiscale analysis to secure the accuracy of long-term prediction.
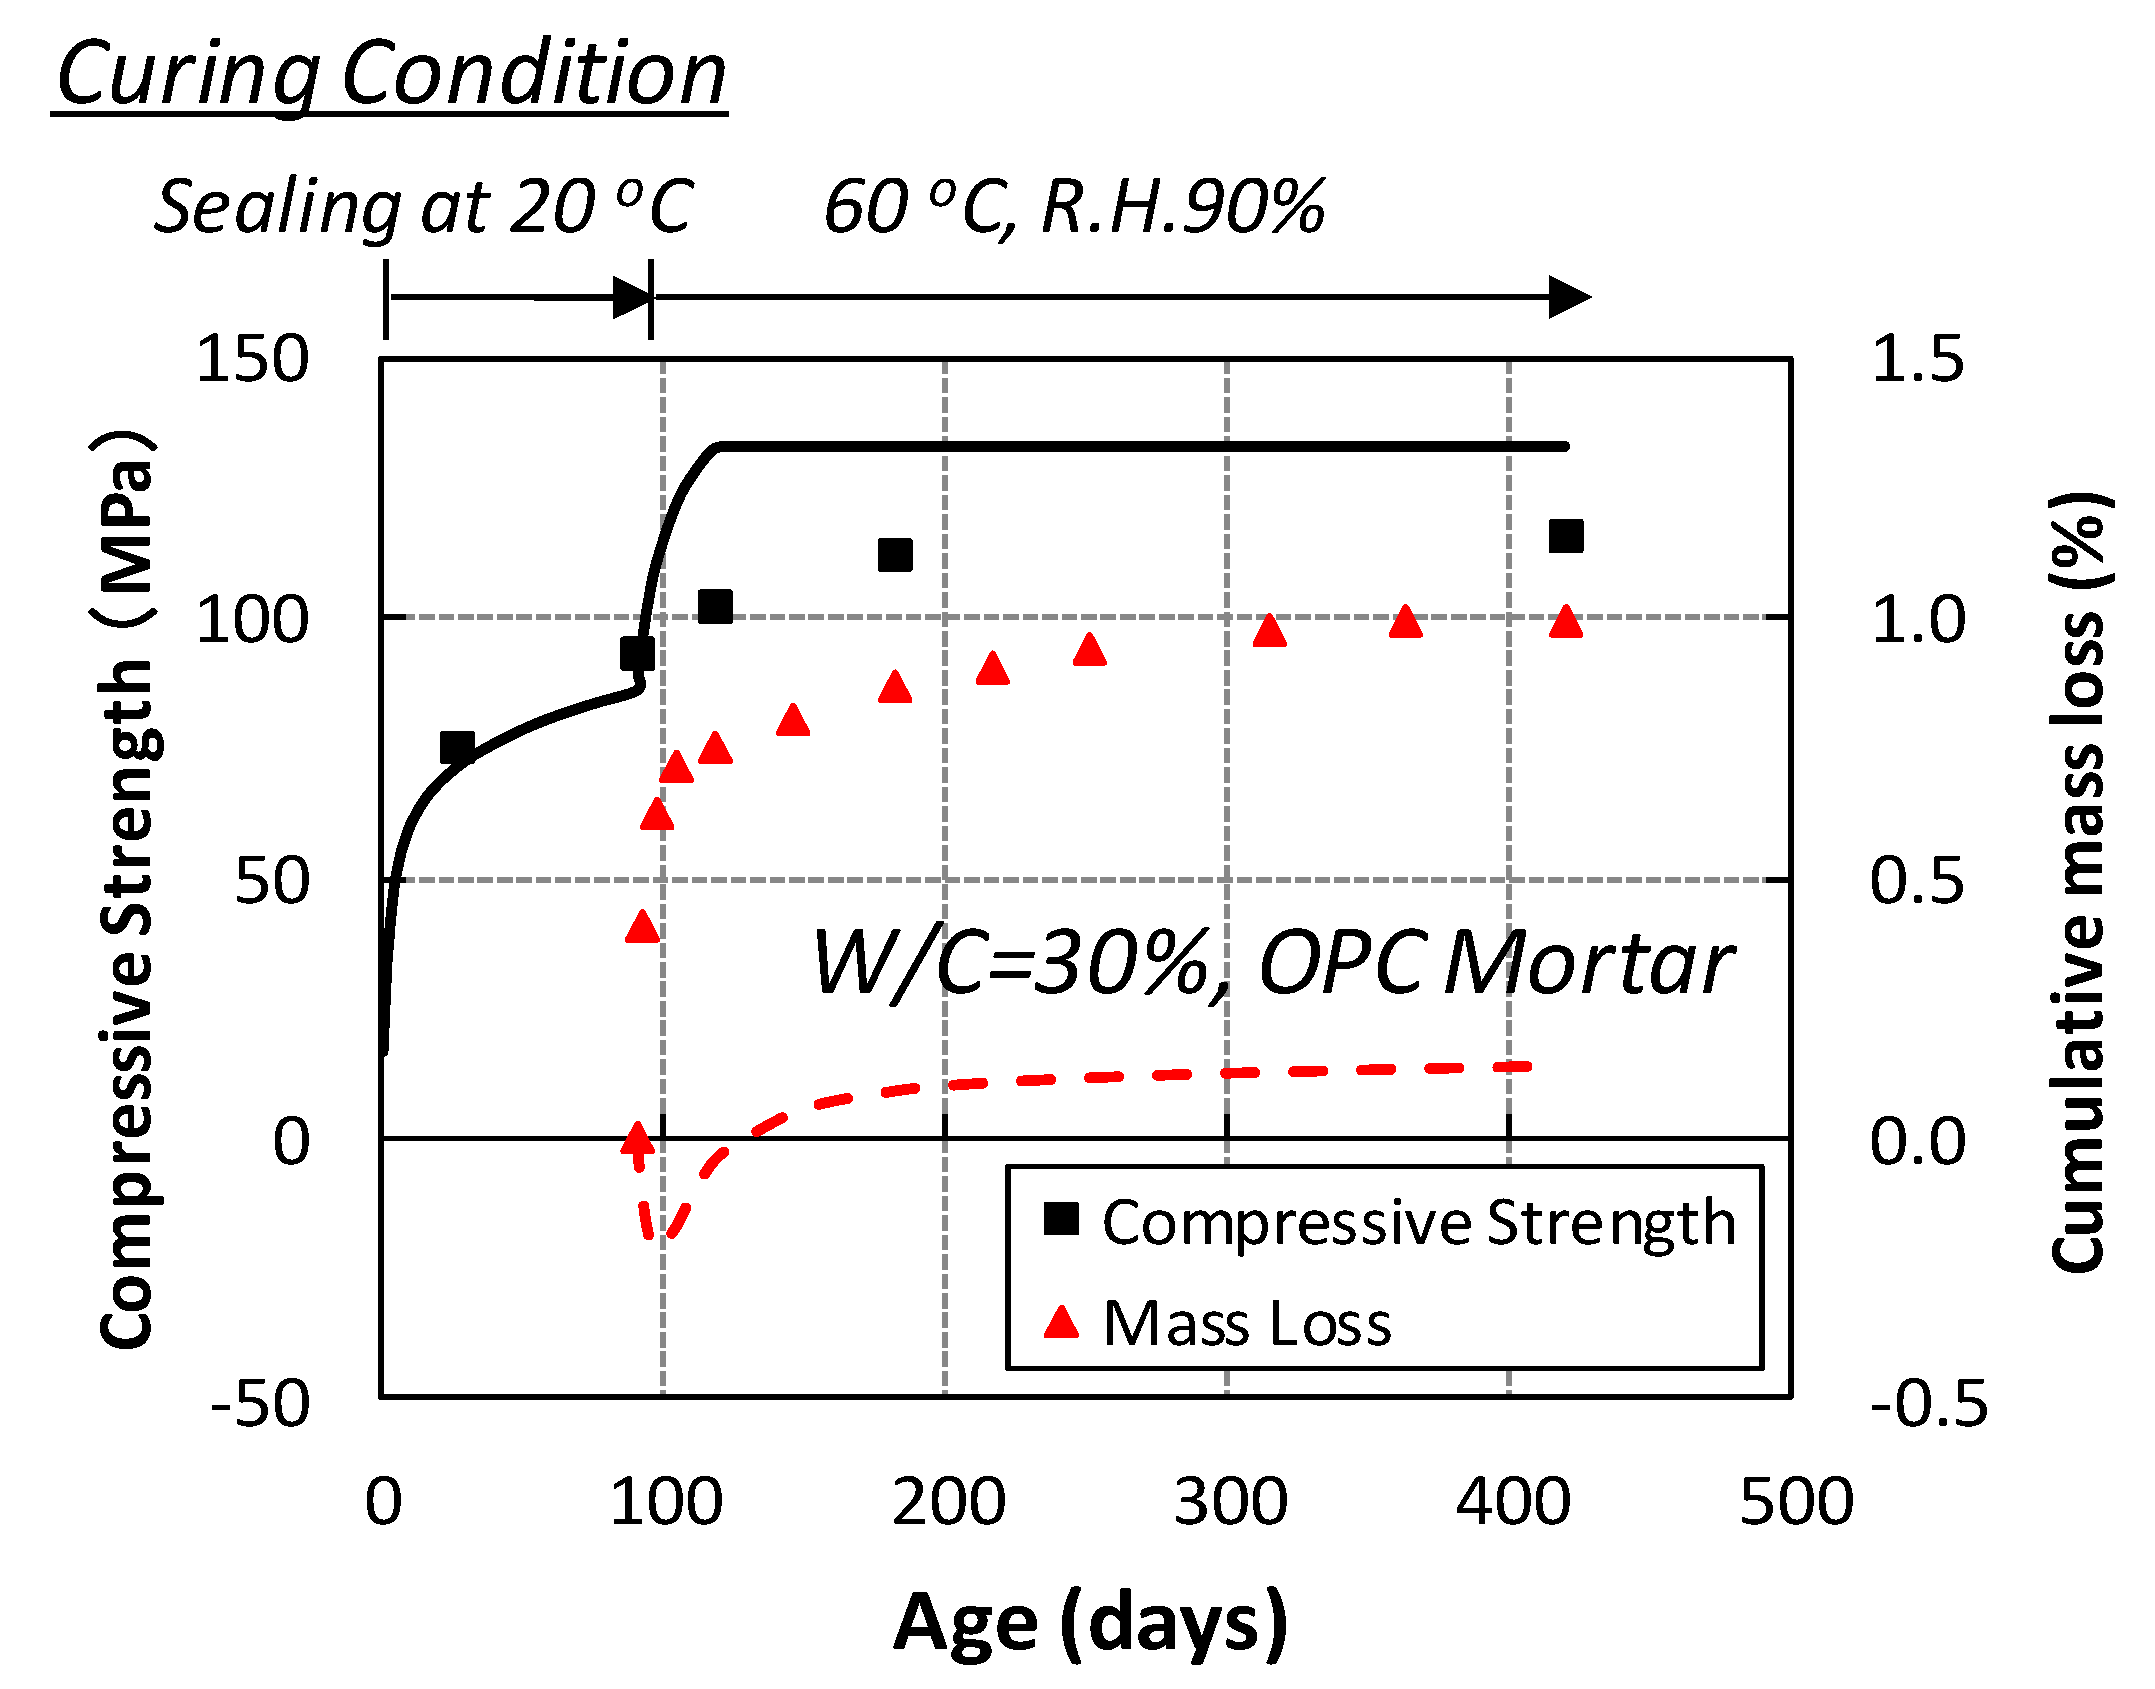
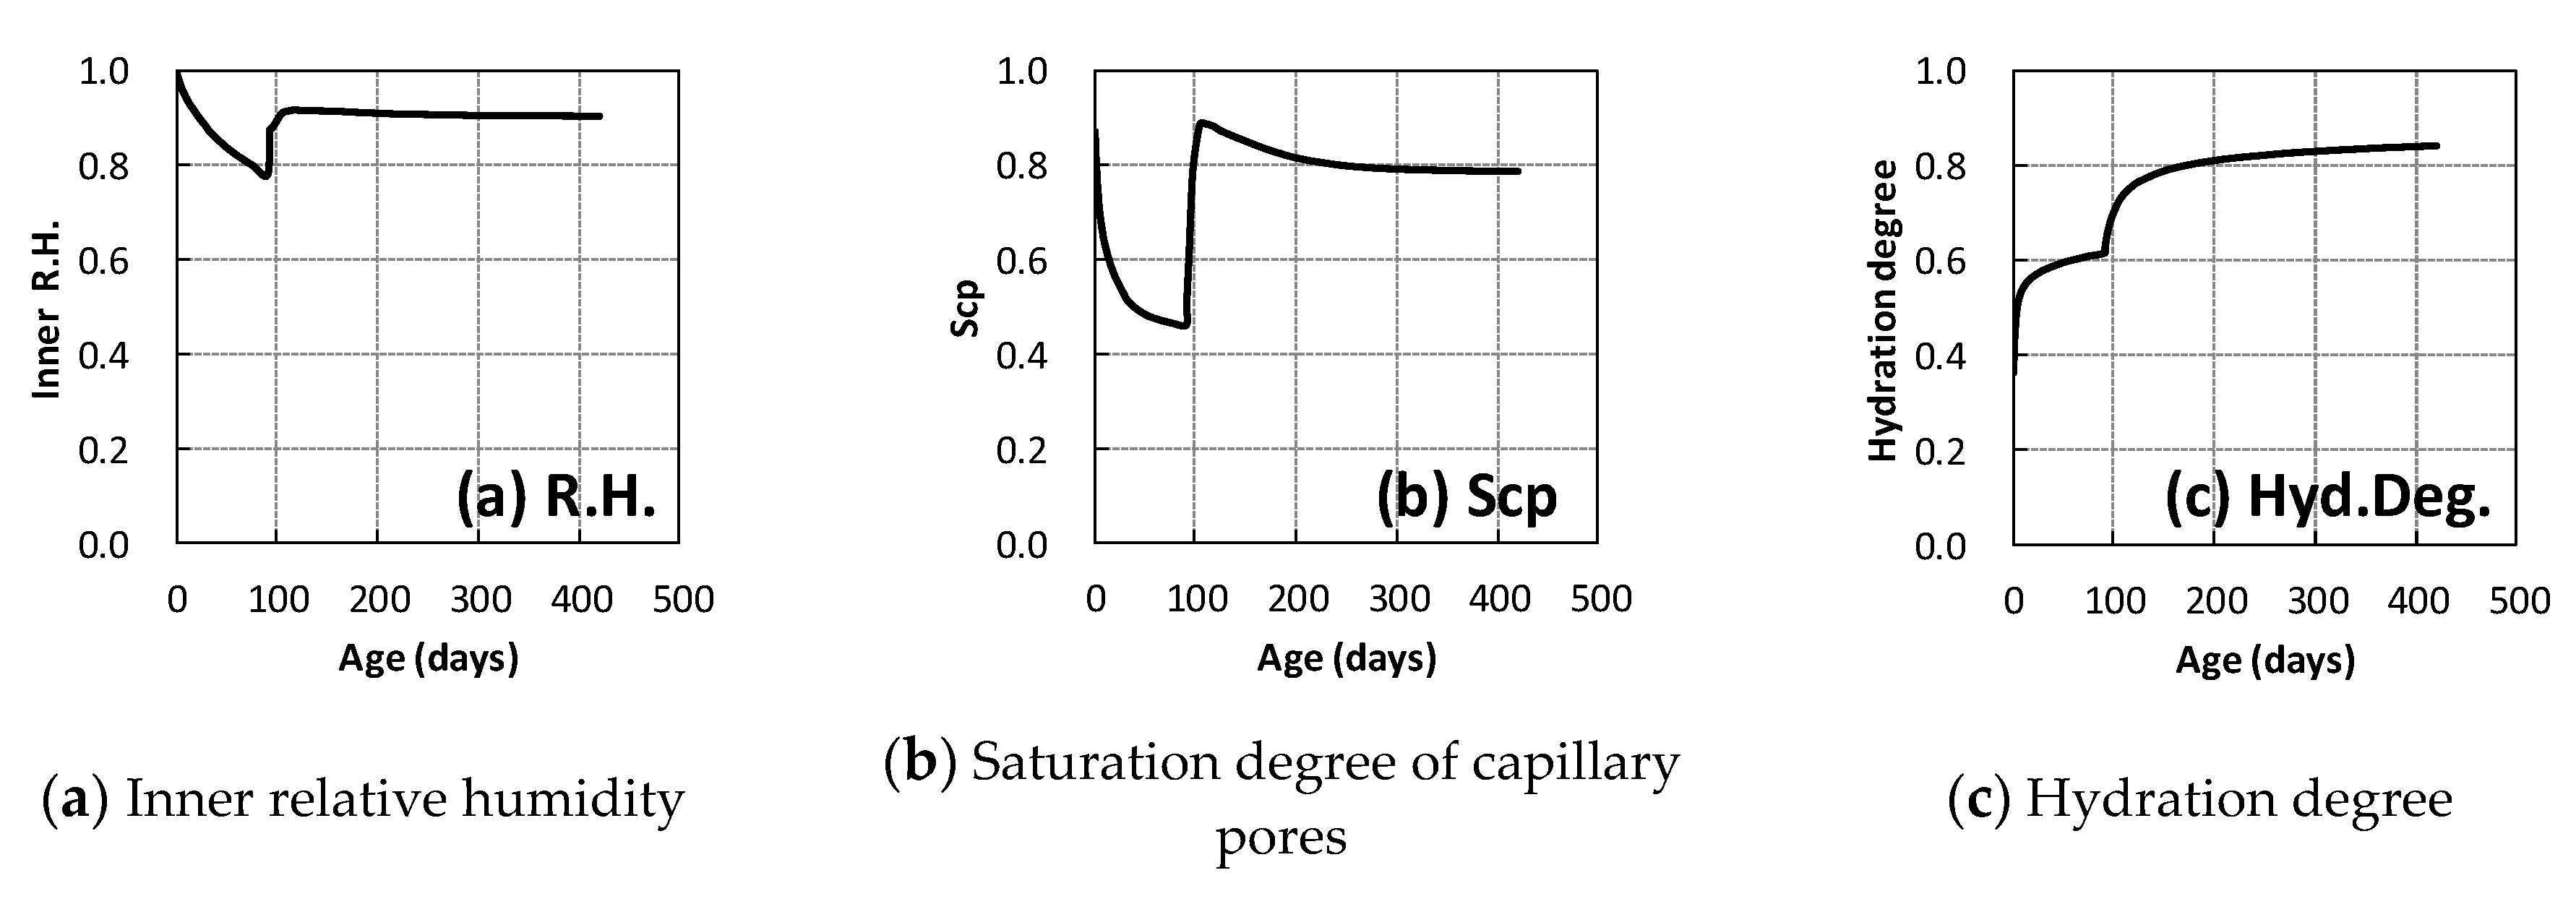
For example, Figure 3 presents a comparison between the experiment and the analysis executed in this study, to which a low W/C mixture is applied with exposure to such a thermal history, although the details are mentioned later in this paper. The results reveal decisive discrepancies. On the other hand, Figure 4 traces the numerical histories of the following parameters, (a) inner relative humidity, (b) saturation degree of capillary pores and (c) hydration degree, along the specific environmental condition as shown in Figure 3. The inner relative humidity significantly increases immediately after the exposure to high temperature, maintaining the high humidity in equilibrium with the surrounding environment, R.H. 90%. Similarly, the saturation degree of capillary pores increases quickly, but decreases gradually over time. The gradual decrease seems to be caused by further hydration as discovered by (c), using condensed water in capillary pores resulting from their high saturation degree. Although the detail mechanism of significant relative humidity increase due to a thermal loading in the original model is explained in Chapter 3, excessive hydration is revealed in the analysis, where un-hydrated cement particles in the case of a low W/C mixture and existing such condensed water react continuously, in comparison with the experiment in Figure 3. The underestimate of cumulative mass loss in the analysis suggests over-consumption of condensed water due to the excessive hydration in the original model. In other words, if the progress of hydration was properly traced in the analysis, then the amount of water evaporating into the air, namely the cumulative mass loss, would increase. In addition, the similar concerns in the case of a low W/C mixture need to be further investigated for long-term moisture absorbing at normal temperature due to inner self-desiccation.
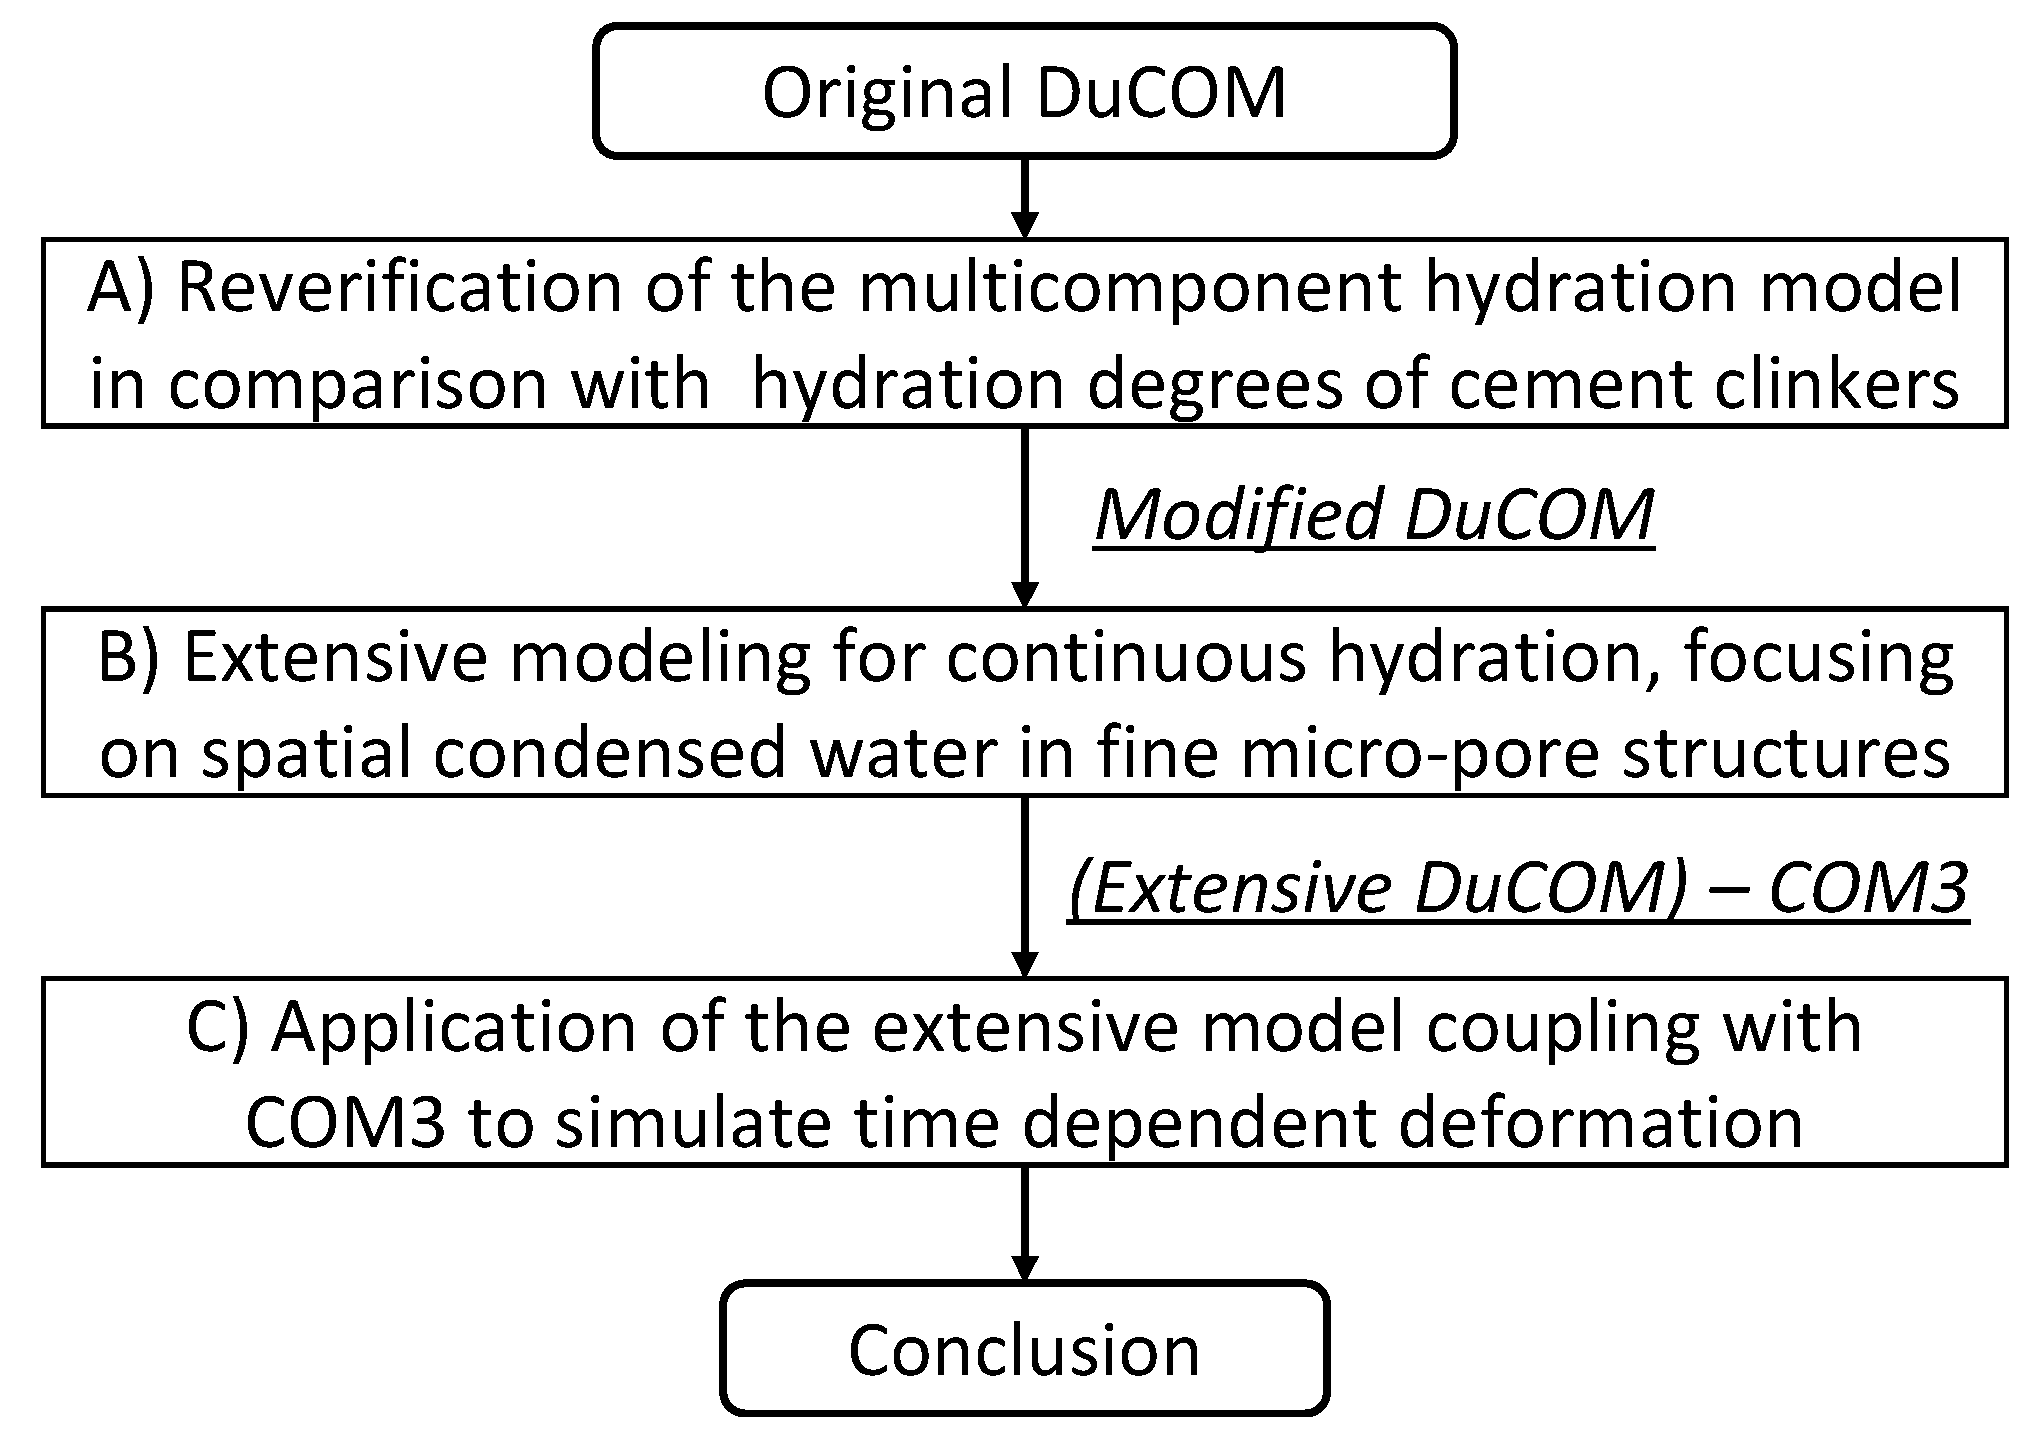
The configuration of this study is summarized in Figure 5. This paper deals with the related issues stepwise. In Part A, reverification of the multicomponent hydration model, which is assigned on the most upstream part of DuCOM, is conducted. To be more precise, the original model is additionally verified for hydration degrees of cement clinkers which were unavailable due to scarcity of data with high reliability in those days when Kishi, et al., developed and validated the original model on adiabatic mass temperature rises [10,11]. This is intended to contribute to the enhancement of numerical prediction, reflecting a benefit obtained by such a remarkable evolution as X-ray diffraction (XRD)/Rietveld analysis on cementitious materials in recent years [12,13,14]. The target of Part B is devoted to extending the modified model to agree well with the peculiar properties of low W/C mixtures under long-term normal or high temperature curing, which have been regarded as a concern, shown in Figure 3. Here, an extensive modeling of continuous hydration is proposed, focusing on spatial condensed water in fine micro-pore structures formed by a low W/C mixture. Finally, in Part C, the validity of this study is verified by simulating time-dependent deformation through integrated analysis based on the above extensive model. Parts A, B and C correspond to the following Chapters 2, 3 and 4, respectively.
2. Reverification of the Multicomponent Hydration Model
2.1. Overview of the Original Multicomponent Hydration Model
In the original model [2,10,11], hydration and heat generation components in cement including clinkers such as C3S, C2S, C3A, C4AF and supplementary cementitious materials (SCMs) such as blast furnace slag (SG) and fly ash (FA) are treated independently, with the respective reference heat rate being accumulated according to their configuration ratios. The total reference heat rate of blended cement is formulated in Equation (1).
where i is clinker mineral or SCM, is the sum of the heat rates for all reactions, is the heat generation rate of mineral i per unit weight, pi is the weight composition, and and are both heat generation rates during the formation of ettringite.
Further, is formulated under an isothermal condition based on Arrhenius’ law in Equation (2).
where Ei is the activation energy of component i, R is the gas constant, is the reference heat generation rate of component i at reference temperature T0 (= 293 K) and is also a function of the accumulated heat rate , which is corrected according to the ratio of the specific surface area to the standard one, T is the real temperature, γi is a coefficient expressing the delaying effect of the chemical admixture and FA in the initial exothermic hydration process, βi is a coefficient expressing the reduction in the heat generation rate due to the reduced availability of free water (precipitation space), λi is a coefficient expressing the change in the heat generation rate of the powder admixtures, such as SG and FA, due to a lack of calcium hydroxide in the liquid phase, and ri is a coefficient expressing changes in the heat generation rate in terms of the interactions between C3S and C2S in portland cement. Overall, the minimum coefficient is used as a reducing ratio when the value of several coefficients is less than unity. Then, (−Ei/R) is defined as thermal activity.
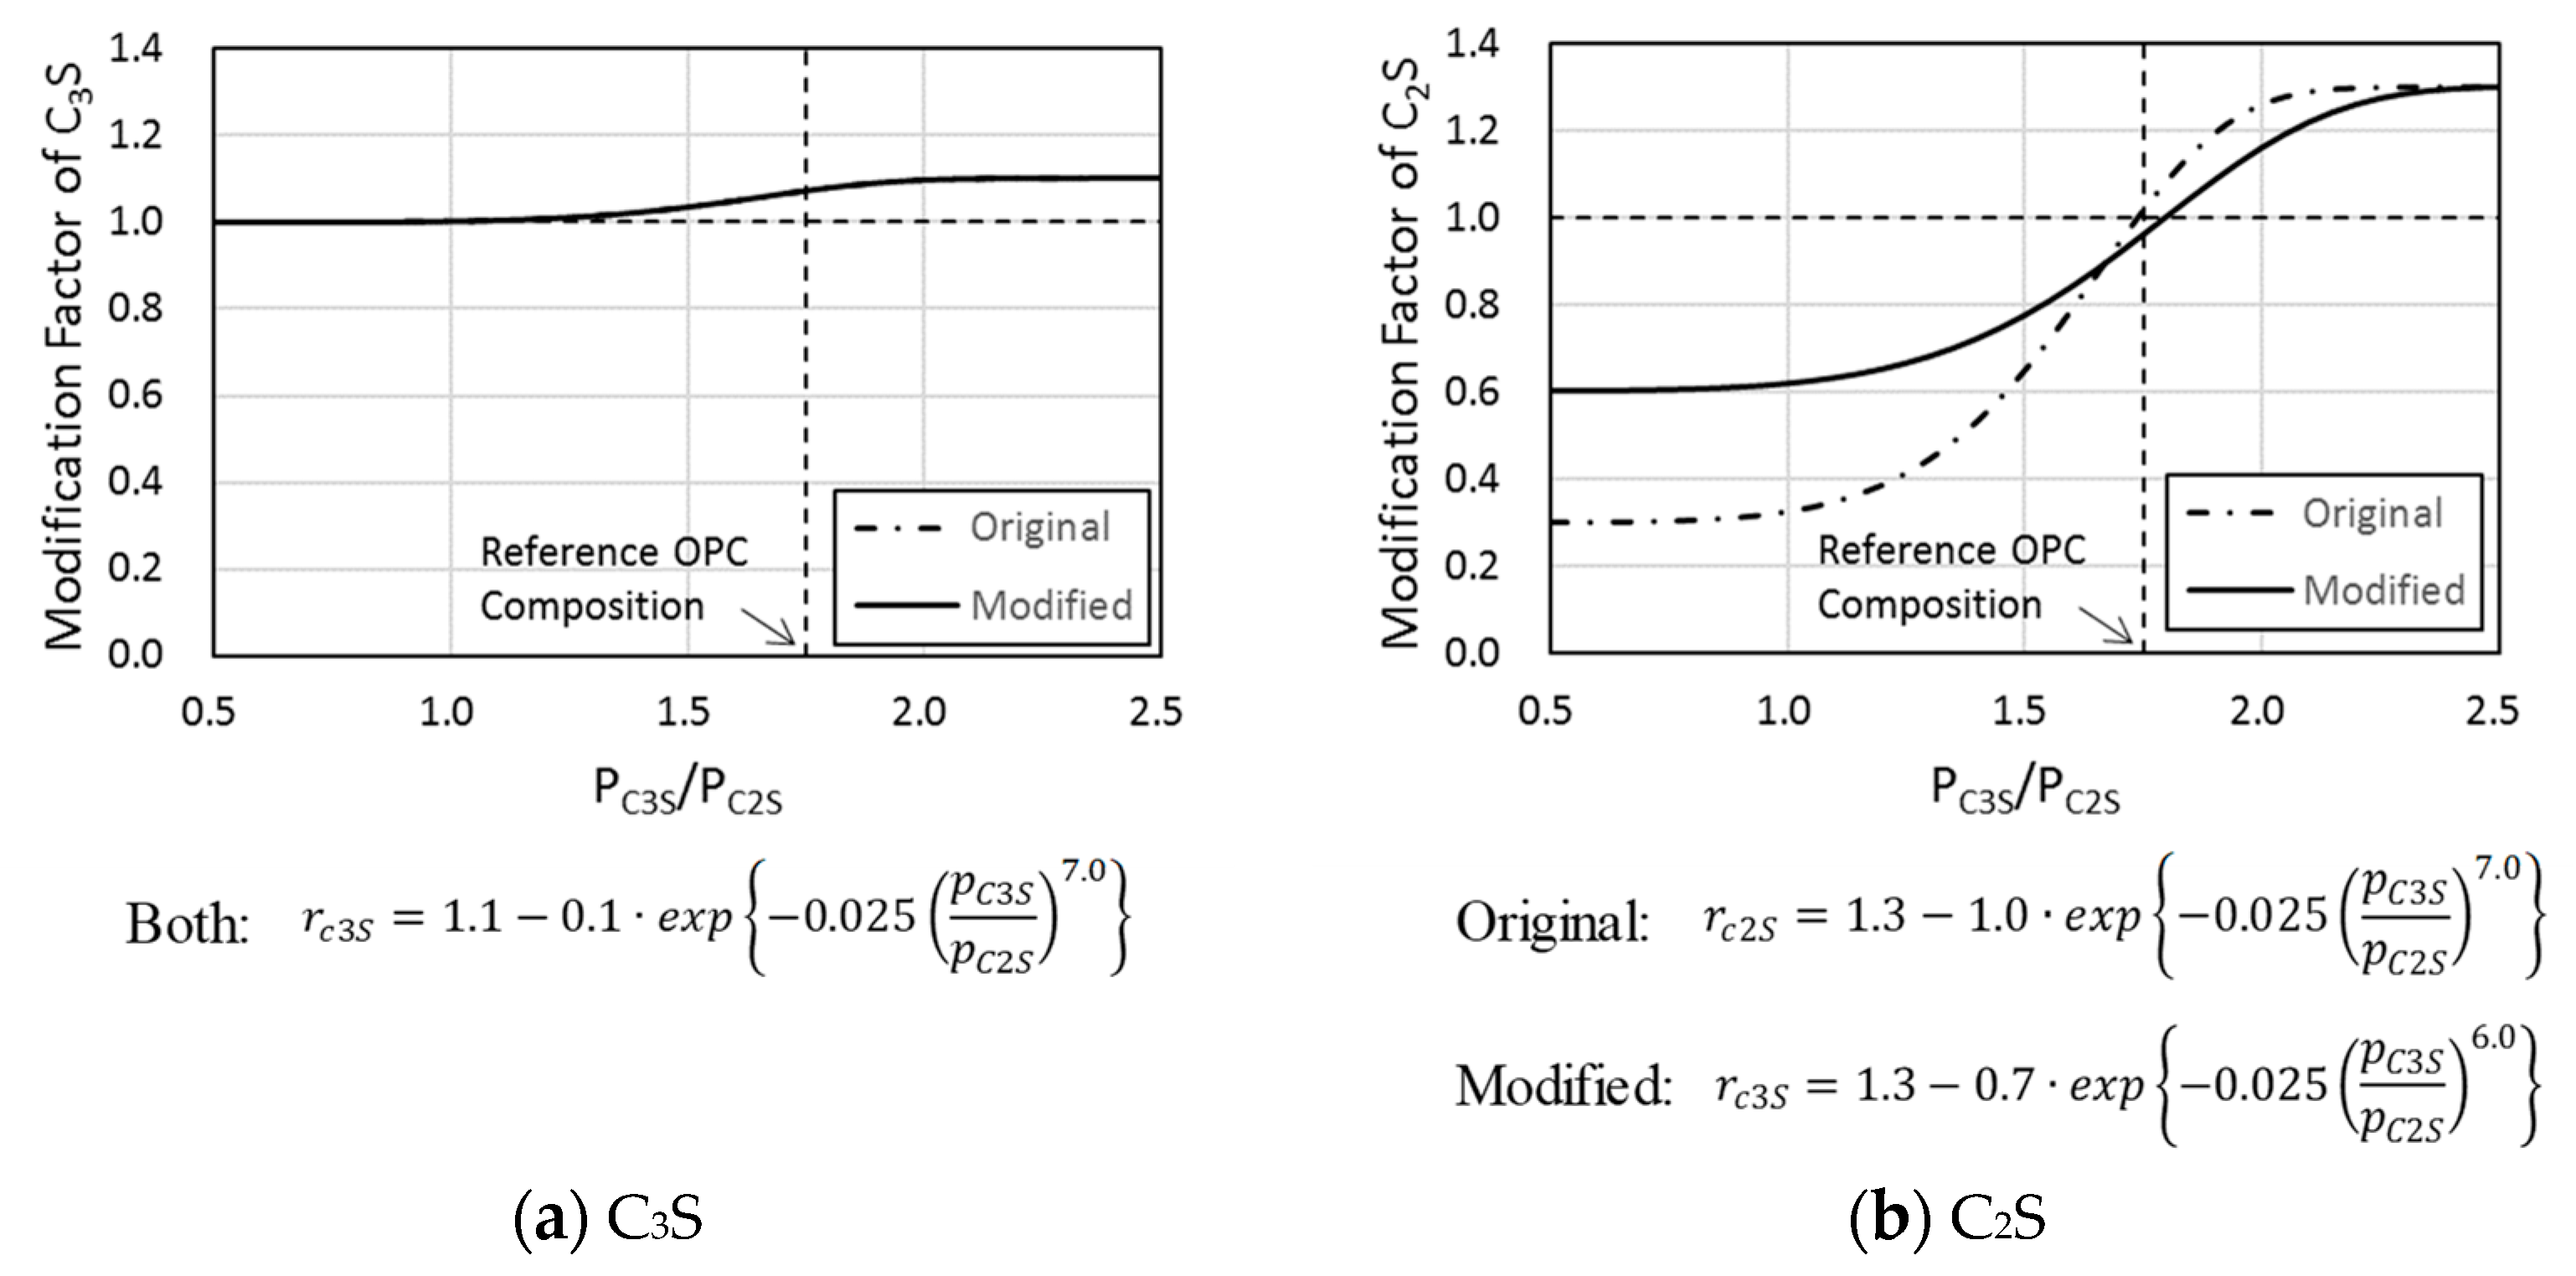
Here, the coefficient ri, which is related to clinker configuration, is further explained. The reactivity of calcium silicates, such as C3S and C2S, is dependent on the concentration of calcium ions in solution, and generally C2S is more sensitive than C3S [15,16]. In this aspect, the heat generation rates of C3S and C2S are improved from the standard settings by the respective modification factors according to the mineral composition of portland cement. The modification impact is regarded as greater on C2S than C3S in terms of the sensitivity to the calcium ion concentration.
2.2. Investigation of Hydration Degrees Based on the Original Model
The validity of the original multicomponent hydration model was investigated in comparison with the hydration degrees of the portland cement clinkers presented in the past studies [17,18,19,20]. The experimental conditions are summarized in Table 1. Each sample is made of paste, and the compositions necessary for the analysis are described in the references. The hydration degree of each clinker i in the analysis is defined by the ratio of the accumulated heat () to the terminal one ().
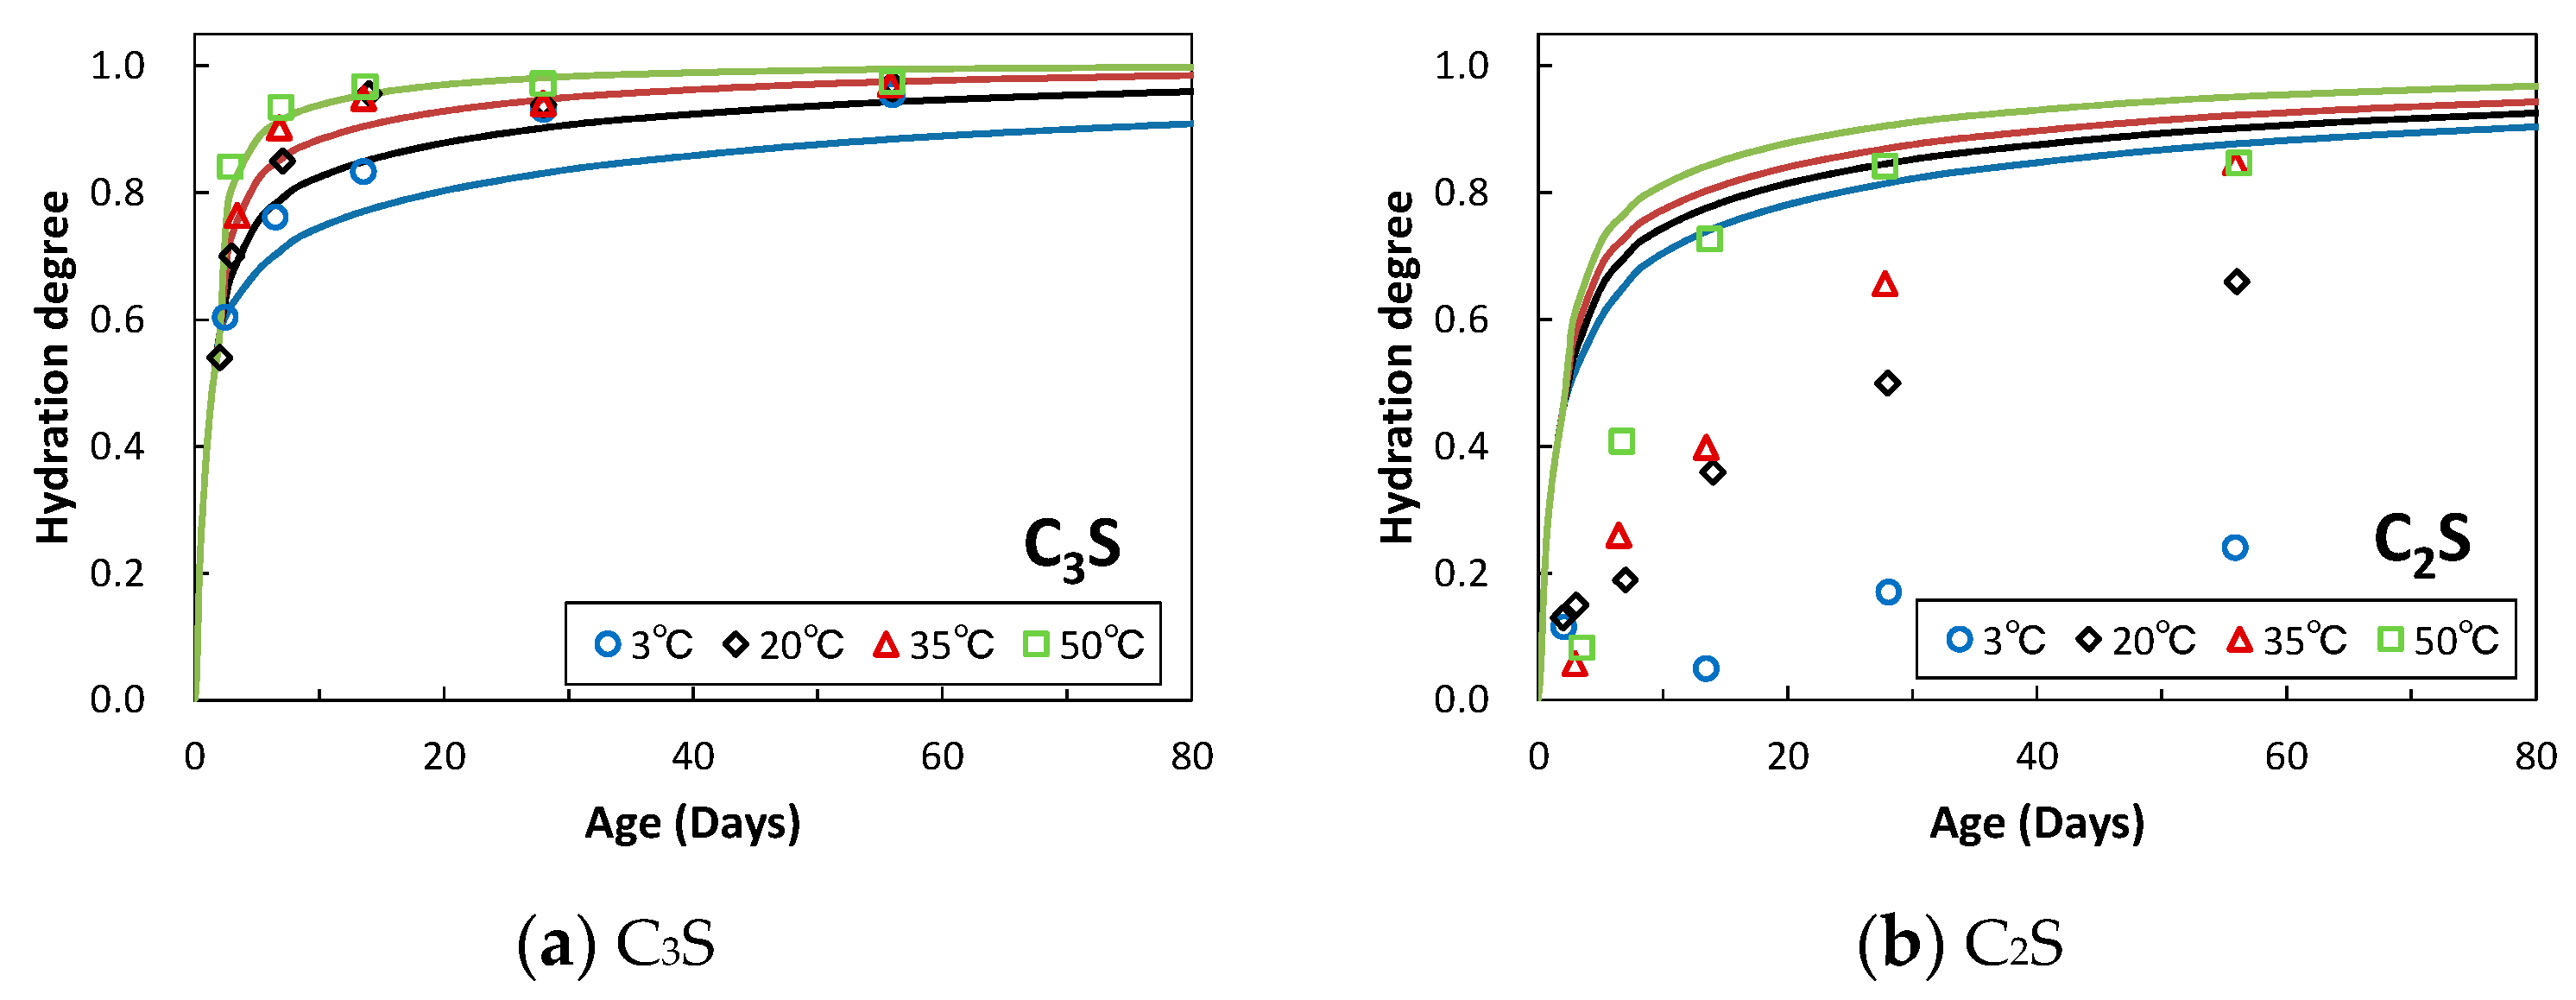
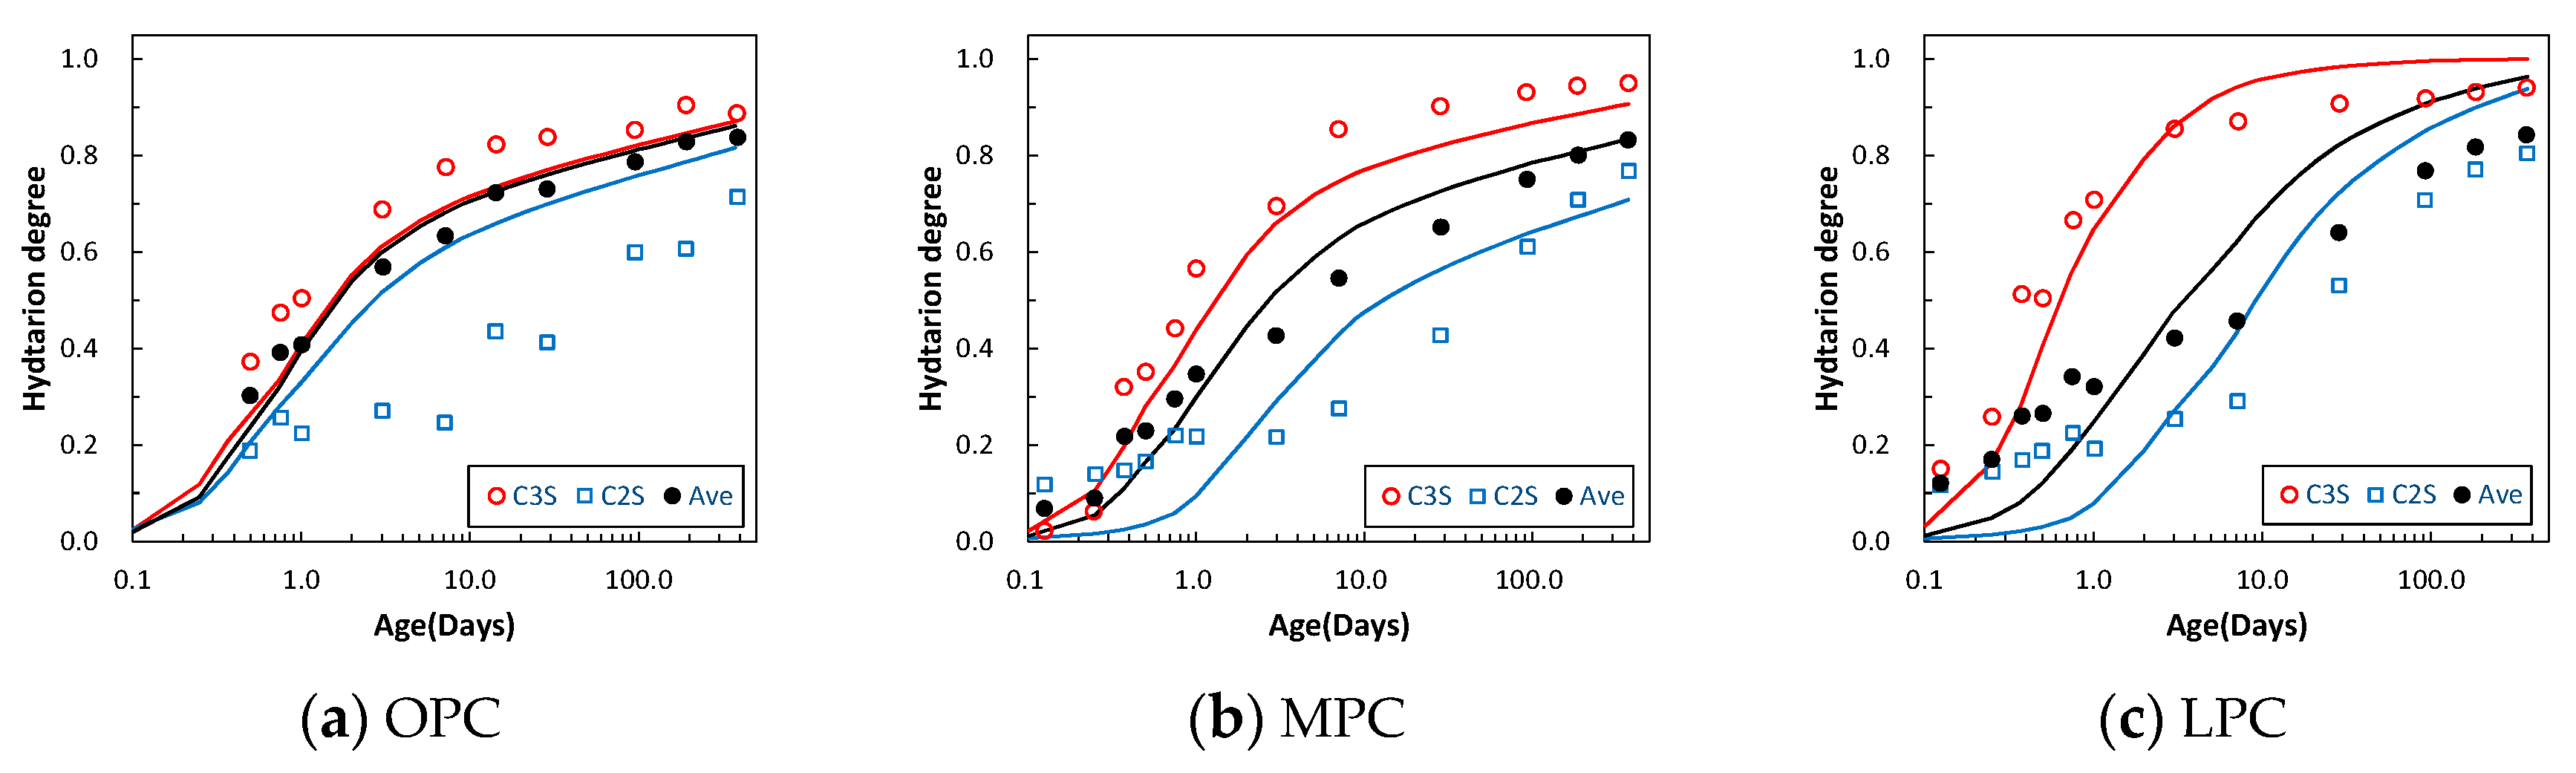
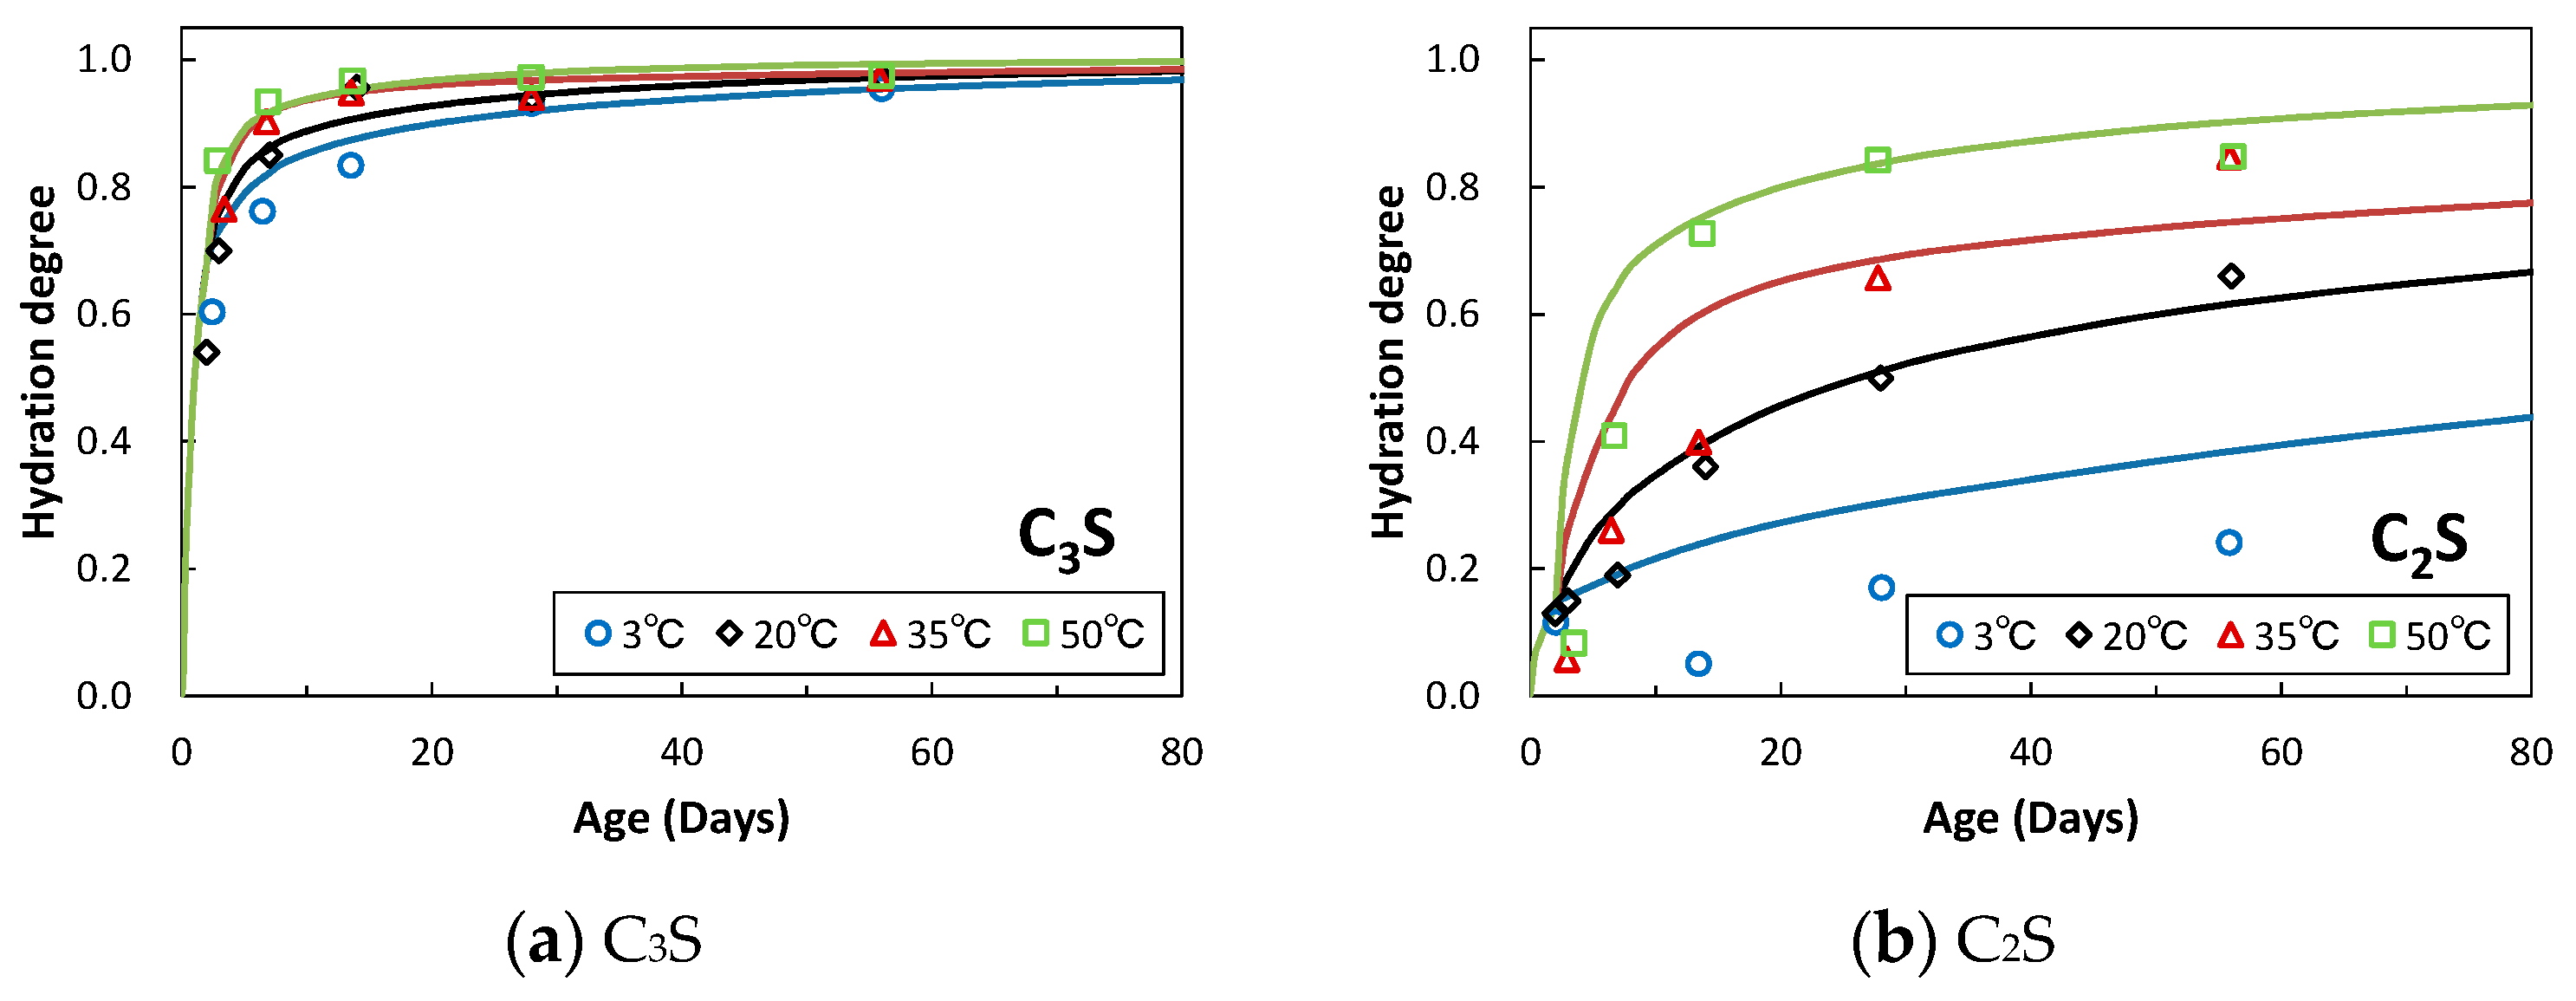
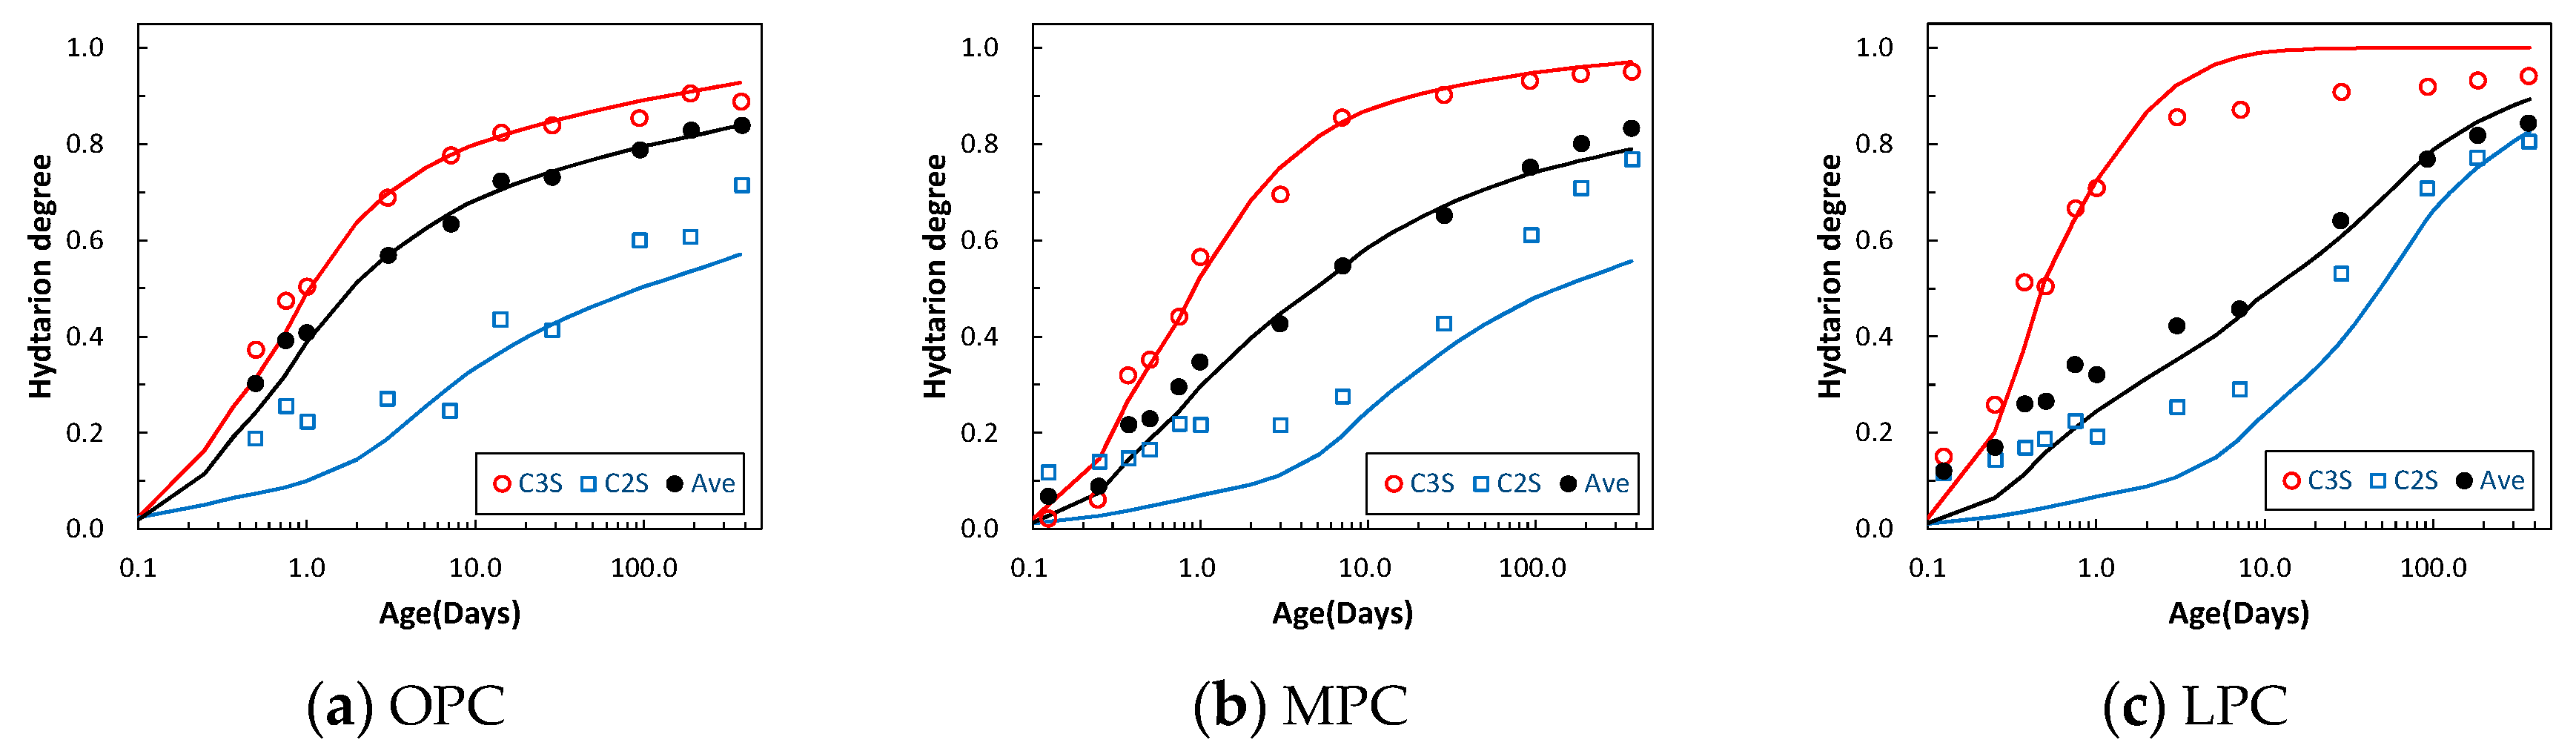
In this paper, only a few parts of all the comparisons are presented in Figure 6 and Figure 7 as representatives due to limited space In Figure 6 based on Reference [18], the numerical C2S was greatly overestimated but C3S was slightly underestimated. Focusing on C2S in particular, although the experimental results present a strong dependency on temperature such that hydration progresses more significantly at higher temperatures, the analysis could not trace the tendency, resulting in the small differences regardless of the curing temperatures. This might suggest the possibility that the setting of the thermal activity of C2S in the original model was lower than expected. A similar possibility was confirmed also in comparison with References [17,19] although it is not presented in this paper. In Figure 7 based on Reference [20], the numerical value of C2S by the analysis was overestimated regardless of the cement type. More precisely, the degree of the overestimation appeared more significantly in the case of the higher ratio of C3S to C2S cement. It was supposed that this discrepancy was influenced by the modification factors of the heat generation rates of C3S and C2S, namely the coefficient ri.
2.3. Reverification through the Modification Study
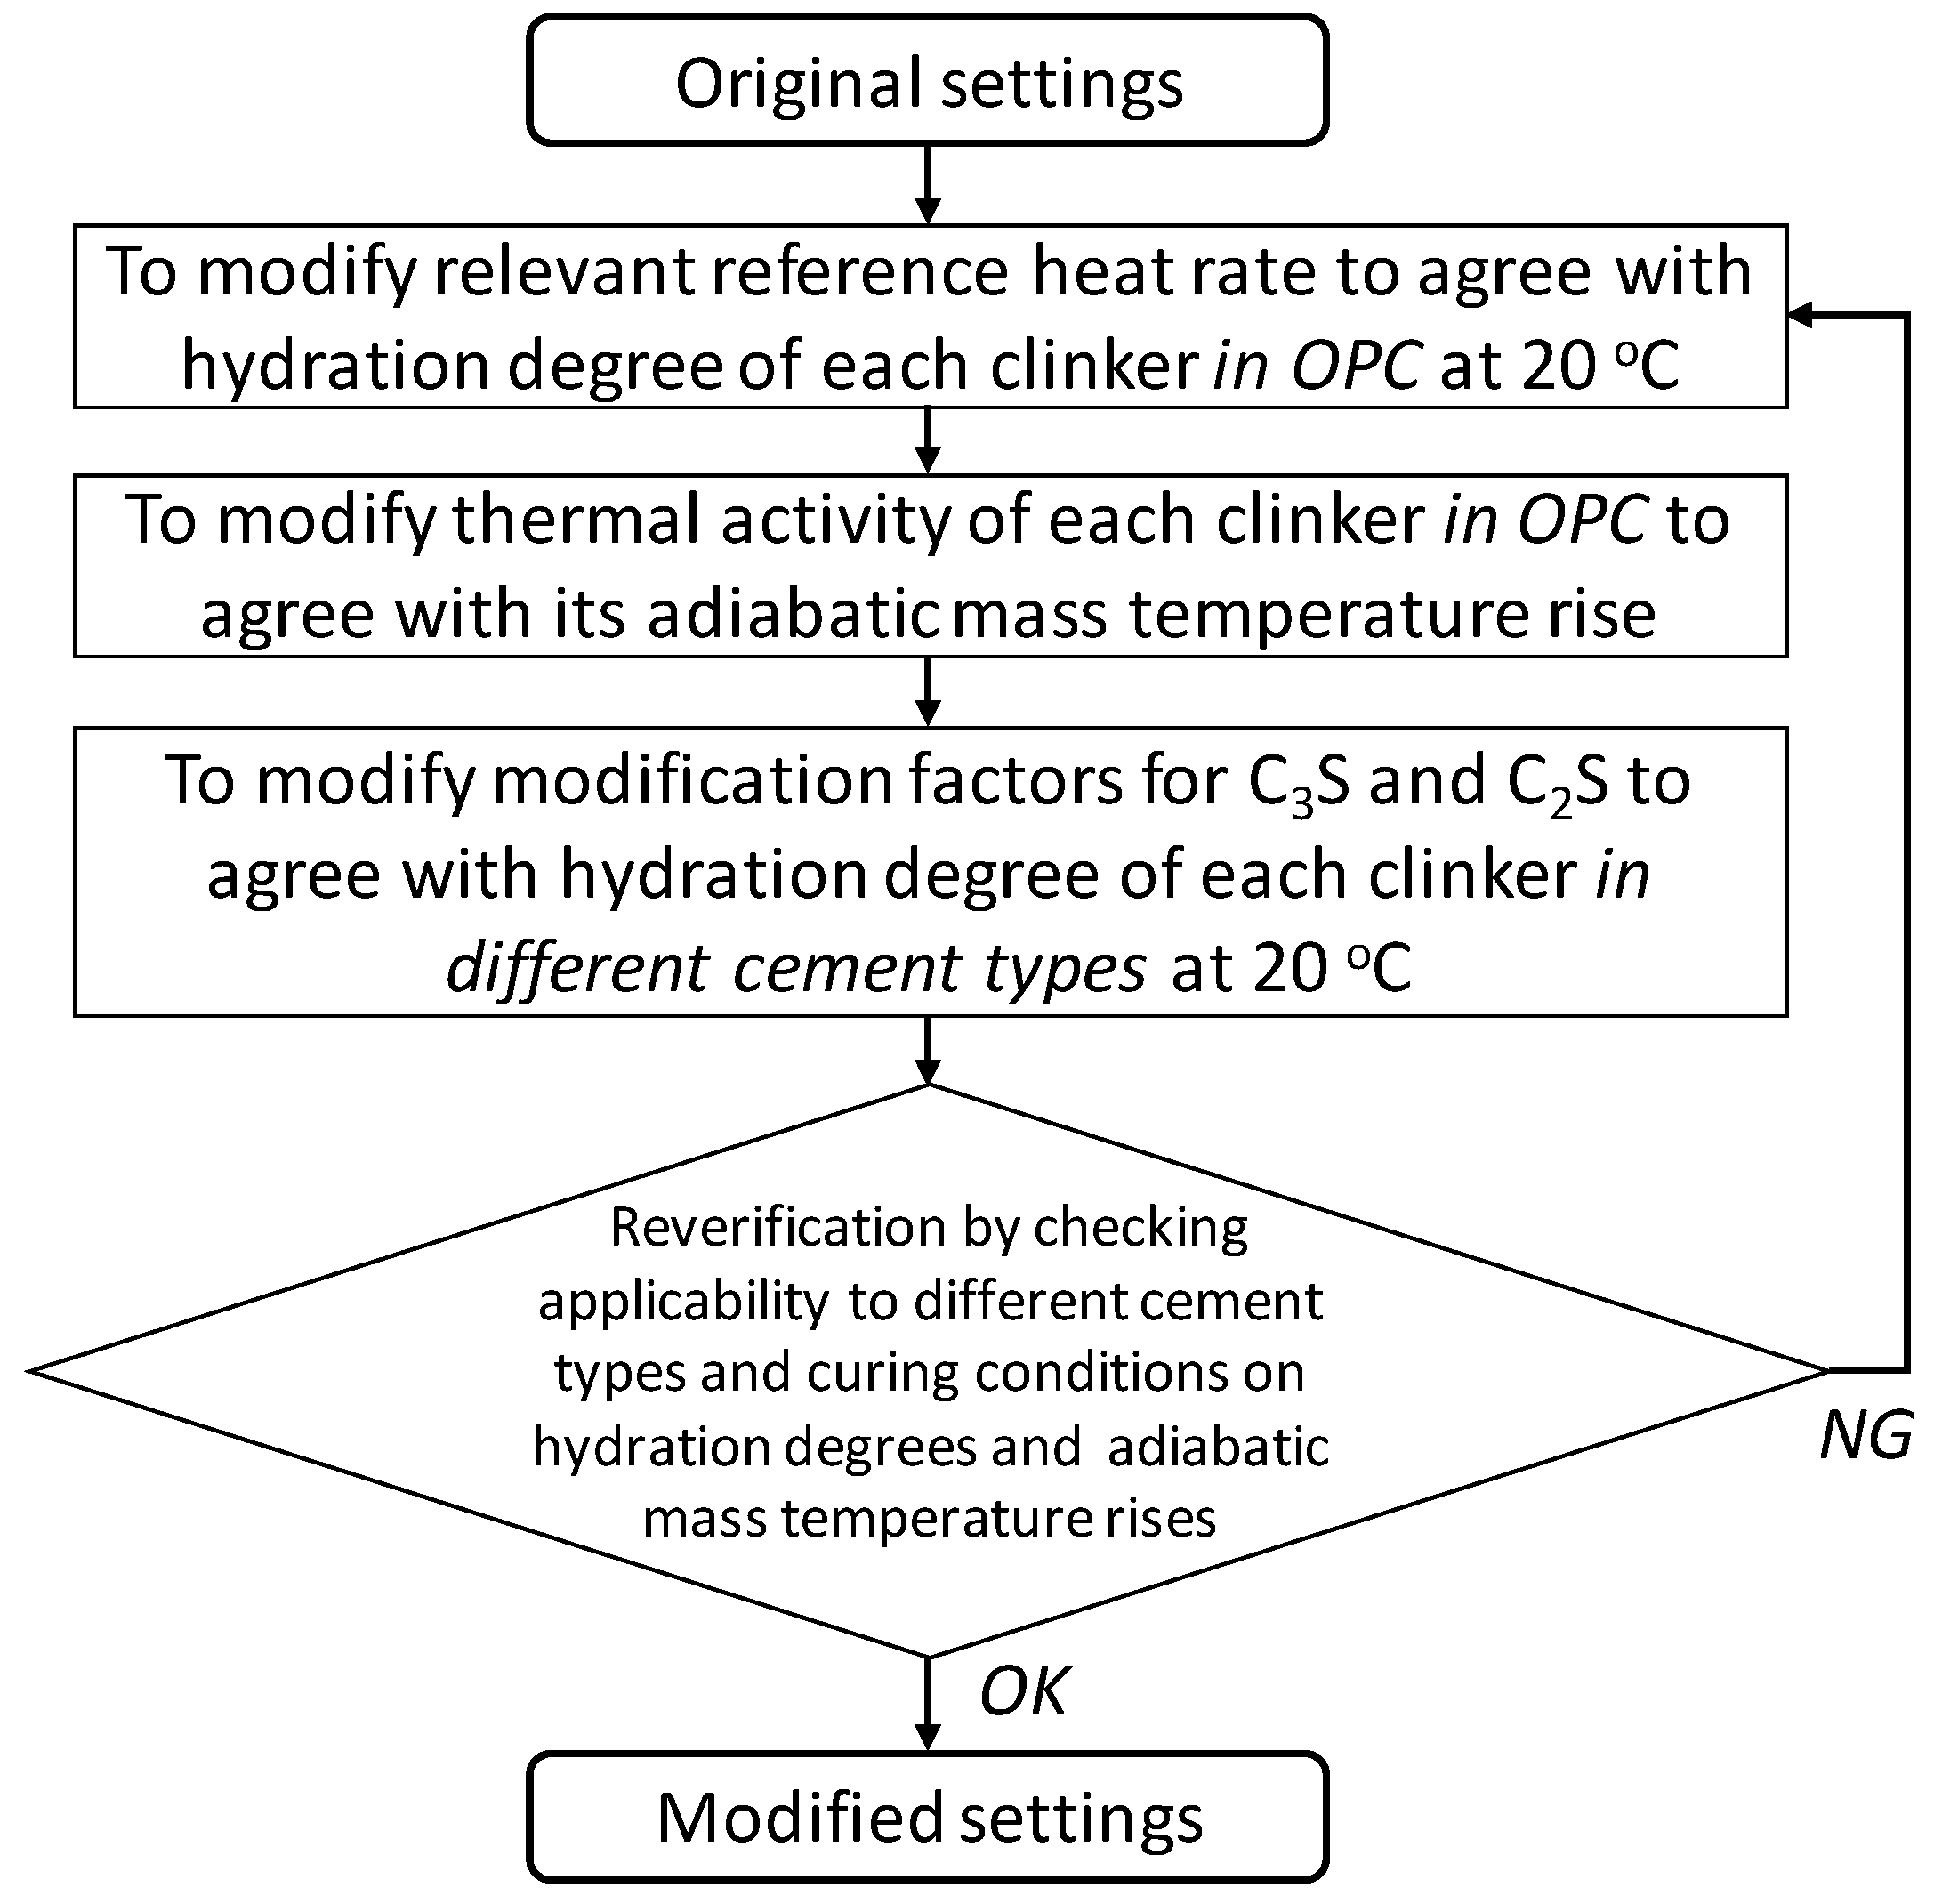
Modification studies were conducted based on the above indications and sensitive numerical analyses in comparison with the experiments listed in Table 1. The procedure of this repetitive modification study is summarized in Figure 8.
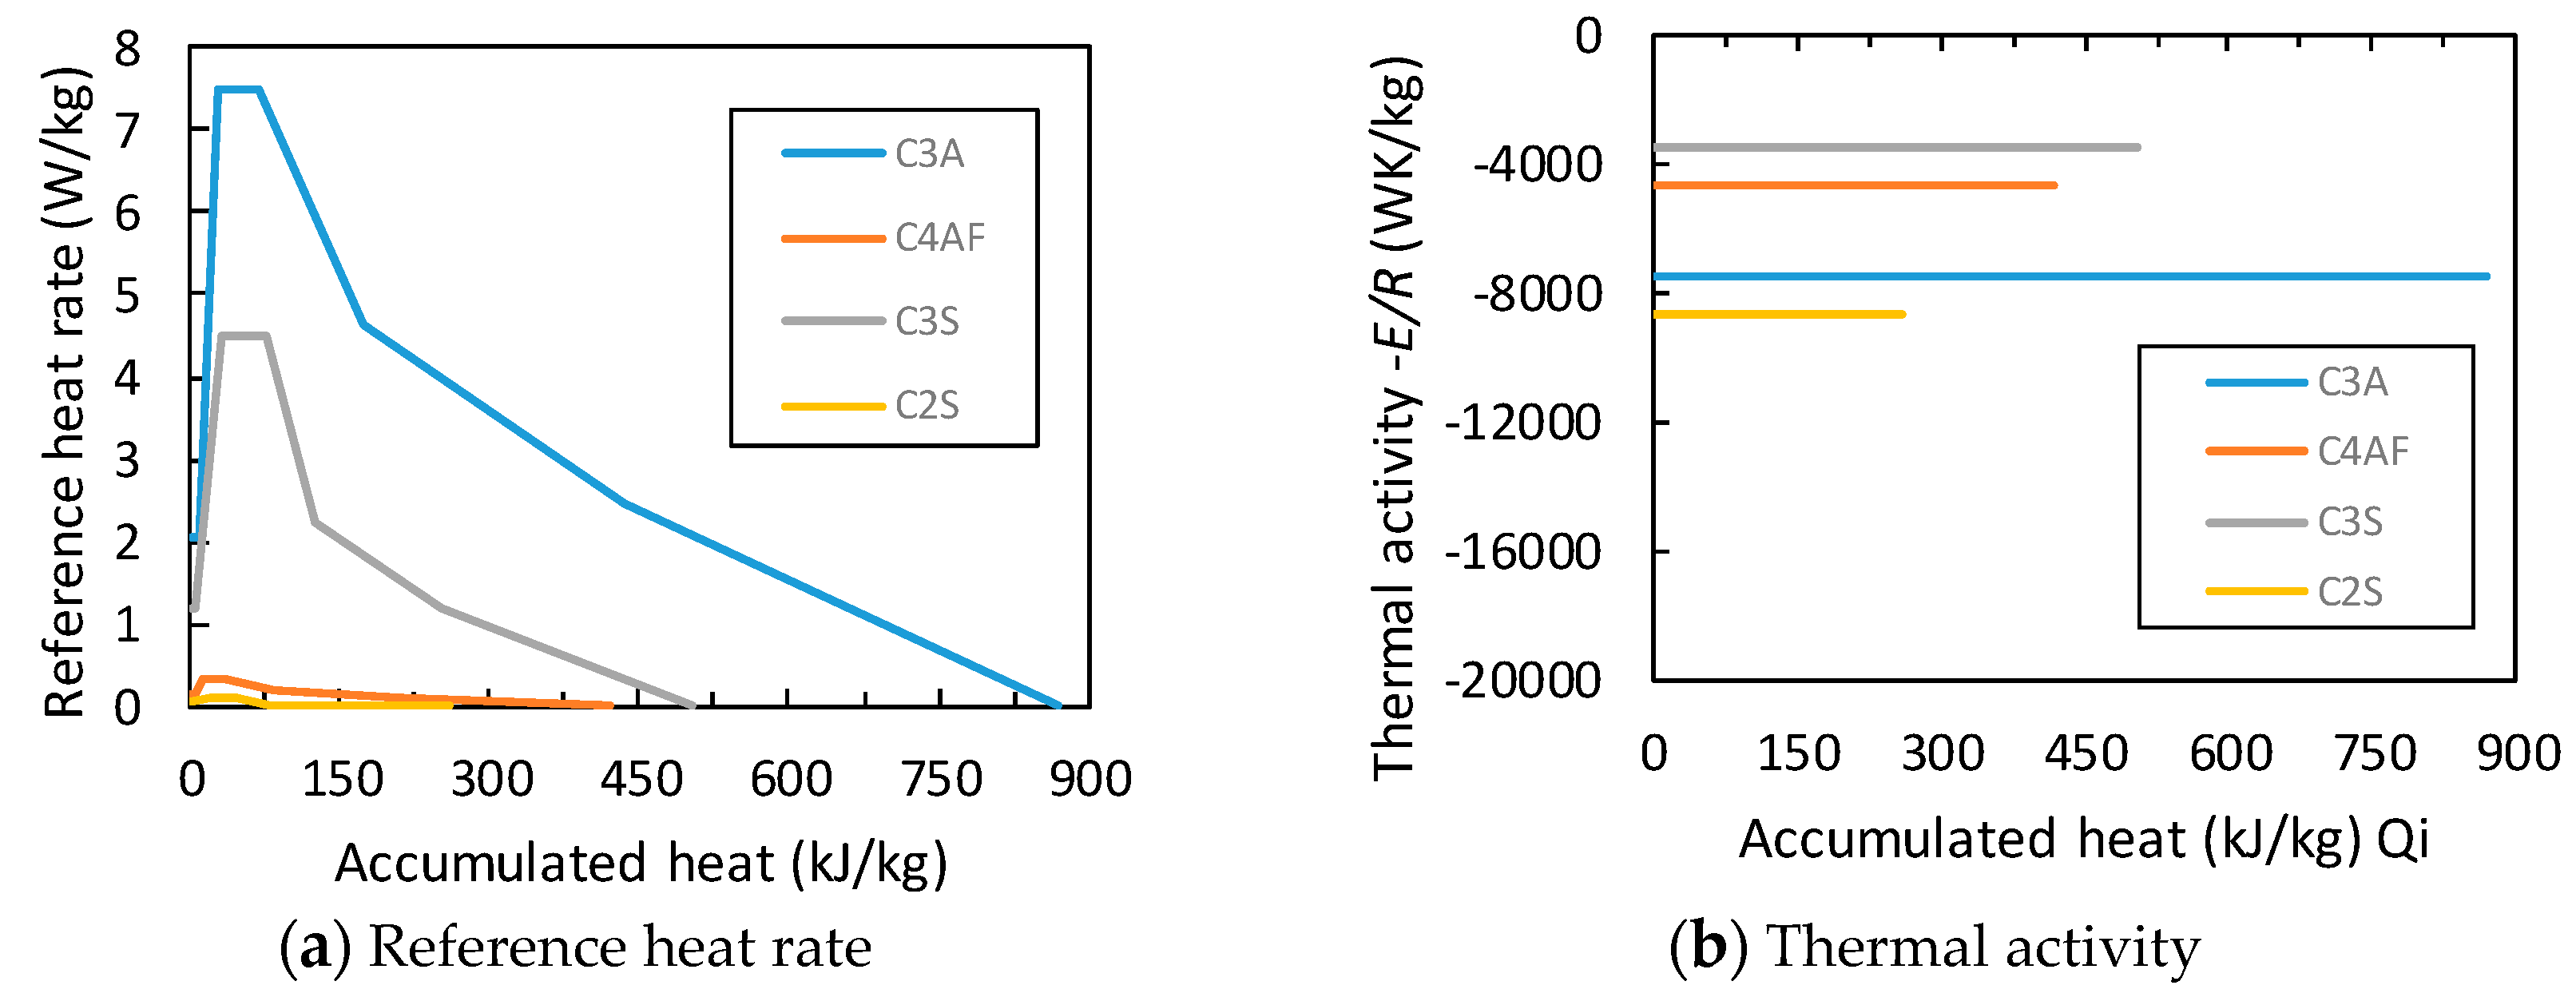
As a result, the modified settings of the reference heat rate and the thermal activities regarding C3A, C4AF, C3S and C2S were defined in Figure 9. The former was determined to be the original one multiplied by 1.5, 0.2, 1.5 and 0.1, respectively, while retaining the accumulated heat of each inflection point. The reference heat rate of C2S was greatly reduced from before, further optimizing those of other clinkers along the procedure in Figure 8. The thermal activities of C2S and C3S were also reverified according to the repetitive study and the finding that the dependency of the heat generation rate of C2S on the temperature is larger than that of C3S [18]. In contrast, those of C3S and C4AF were not modified because of scarcity of grounds. Herein, it was simply assumed that the thermal activity of each clinker might be kept constant regardless of the accumulated heat induced by hydration, because inconsistency of the relation between both parameters was pointed out in Reference [21]. Incidentally, the original settings before the modification, which are omitted in this paper, are well explained in Reference [1]. In addition, the modification factors for C3S and C2S are presented in Figure 10. C2S was judged to be modified by considering the large reduction of the reference heat rate, whereas C3S did not need to be changed through the repetitive sensitive analyses.
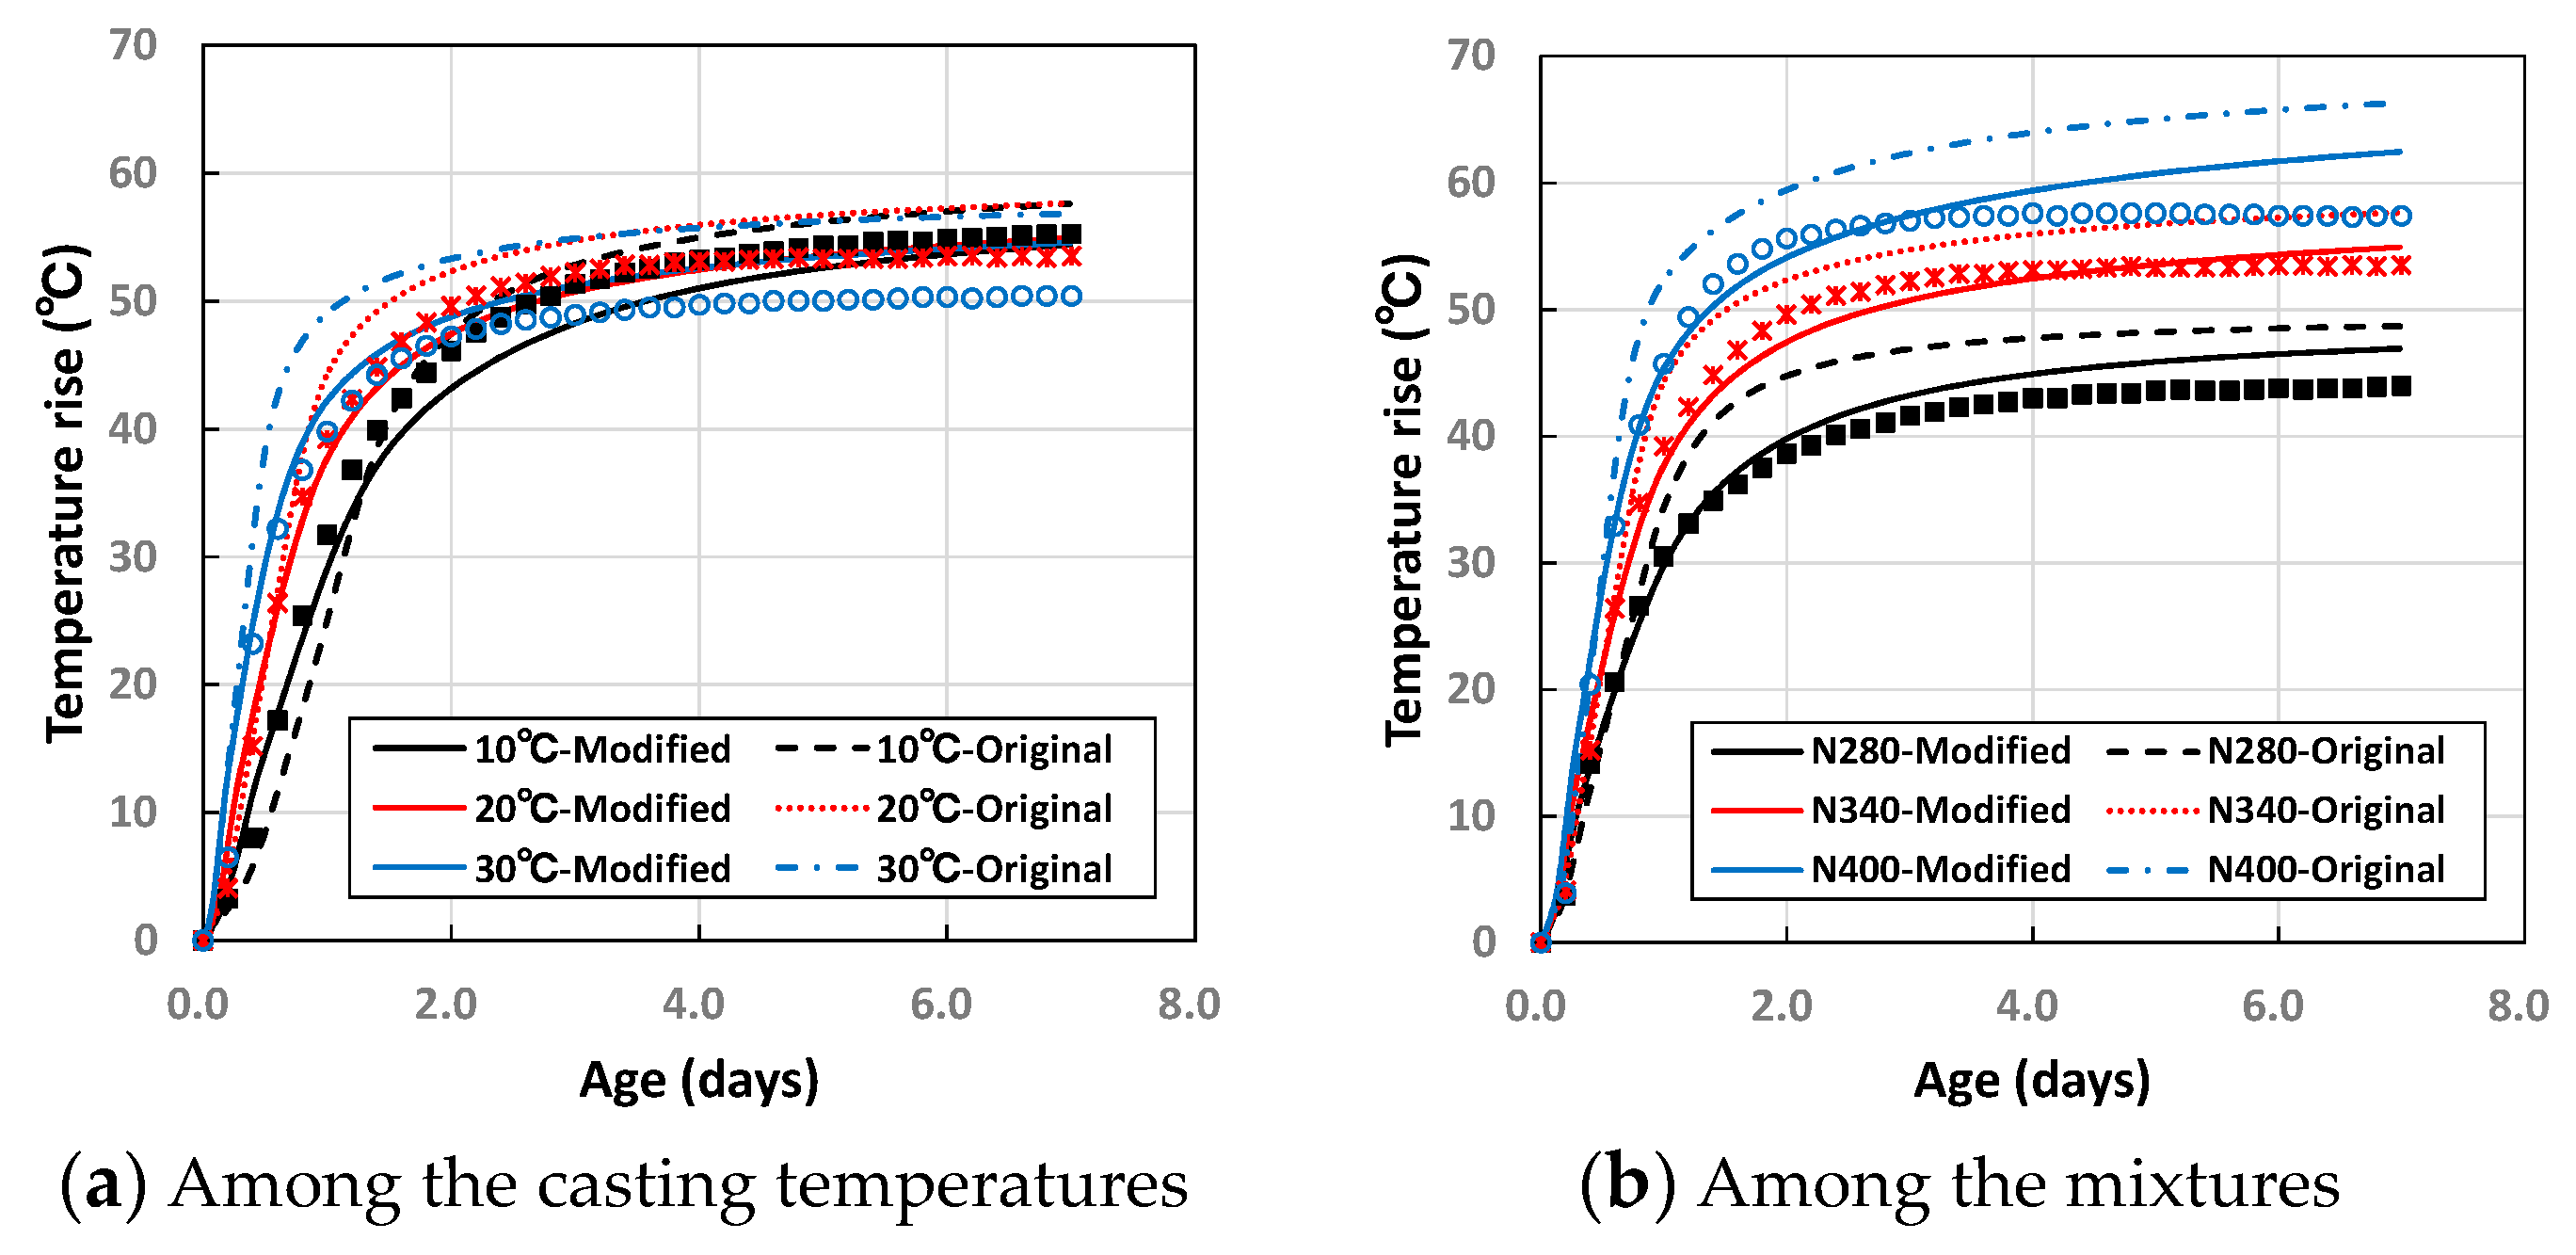
The comparative results of the hydration degrees based on the modified model were presented in Figure 11 and Figure 12. The numerical results were much improved regardless of the experimental conditions, providing good agreement regarding C2S as well as C3S. In addition to these comparisons, it is revealed that all the experiments listed in Table 1 could be well simulated by this modified model in Reference [22]. Figure 13 presents the comparisons of the adiabatic mass temperature rises of three different OPC concrete mixtures between the experiment in Reference [23] and the analyses, in which the experimental results are plotted and the simulations based on the original/modified model are illustrated as a dashed/solid line, respectively. The mineral composition and physical property of the cement used are listed in Table 2, and the details of the mixtures and the experimental conditions are presented in Table 3. Figure 13 shows that the modified model provides better agreement with the experiments than the original one. The accuracy was much improved especially in the case of high casting temperatures and rich cement contents. In this way, it was verified that the modified settings could be more suitable for accurate prediction throughout this modification study. Here, it is a noticeable point that this modification approach, which stands on the basic scheme of the original model, expands its applicability without denying the achievement implemented until now.
3. Extensive Modeling of Continuous Hydration Considering Spatial Condensed Water in Fine Micro-Pore Structures
3.1. Overview of the Original Model Related to Micro-Pore Structures and Moisture Equilibrium/Transports
The law of mass conservation governing the moisture balance in a system is expressed by Equation (3) [1,24].
where θw is the mass moisture in a unit volume of concrete, J is moisture flux, T is temperature and Q is a sink term. The first term corresponds to the potential term for the moisture in a porous material, which is expressed by Equation (4) [1,24].
where ρl is the density of liquid water, φ is porosity and S is degree of saturation of porosity. In this way, the potential term is closely related to transition of both micro-pore structures and degree of saturation. The second term of Equation (3) is a moisture flux term, which is expressed by the formulation driven by pore pressure, vapor pressure and temperature gradients [1,24]. Then, the sink term can be obtained directly from the multicomponent hydration model. The amount of free water available for hydration in the sink term, wfree, is defined in Equation (5) [1,2].
where wtotal is the unit water content, wi is the water consumed and fixed by the reaction of constituents and C is the unit cement content. wtotal and C depend on a given mixture. The amount of water bound by each reaction can be determined by multiplying the bound water ratio obtained from the reaction equation of each mineral by the degree of hydration calculated by the multicomponent hydration model. The amount of free water can be used perfectly for hydration, wherever it is, in the original model [1,24].
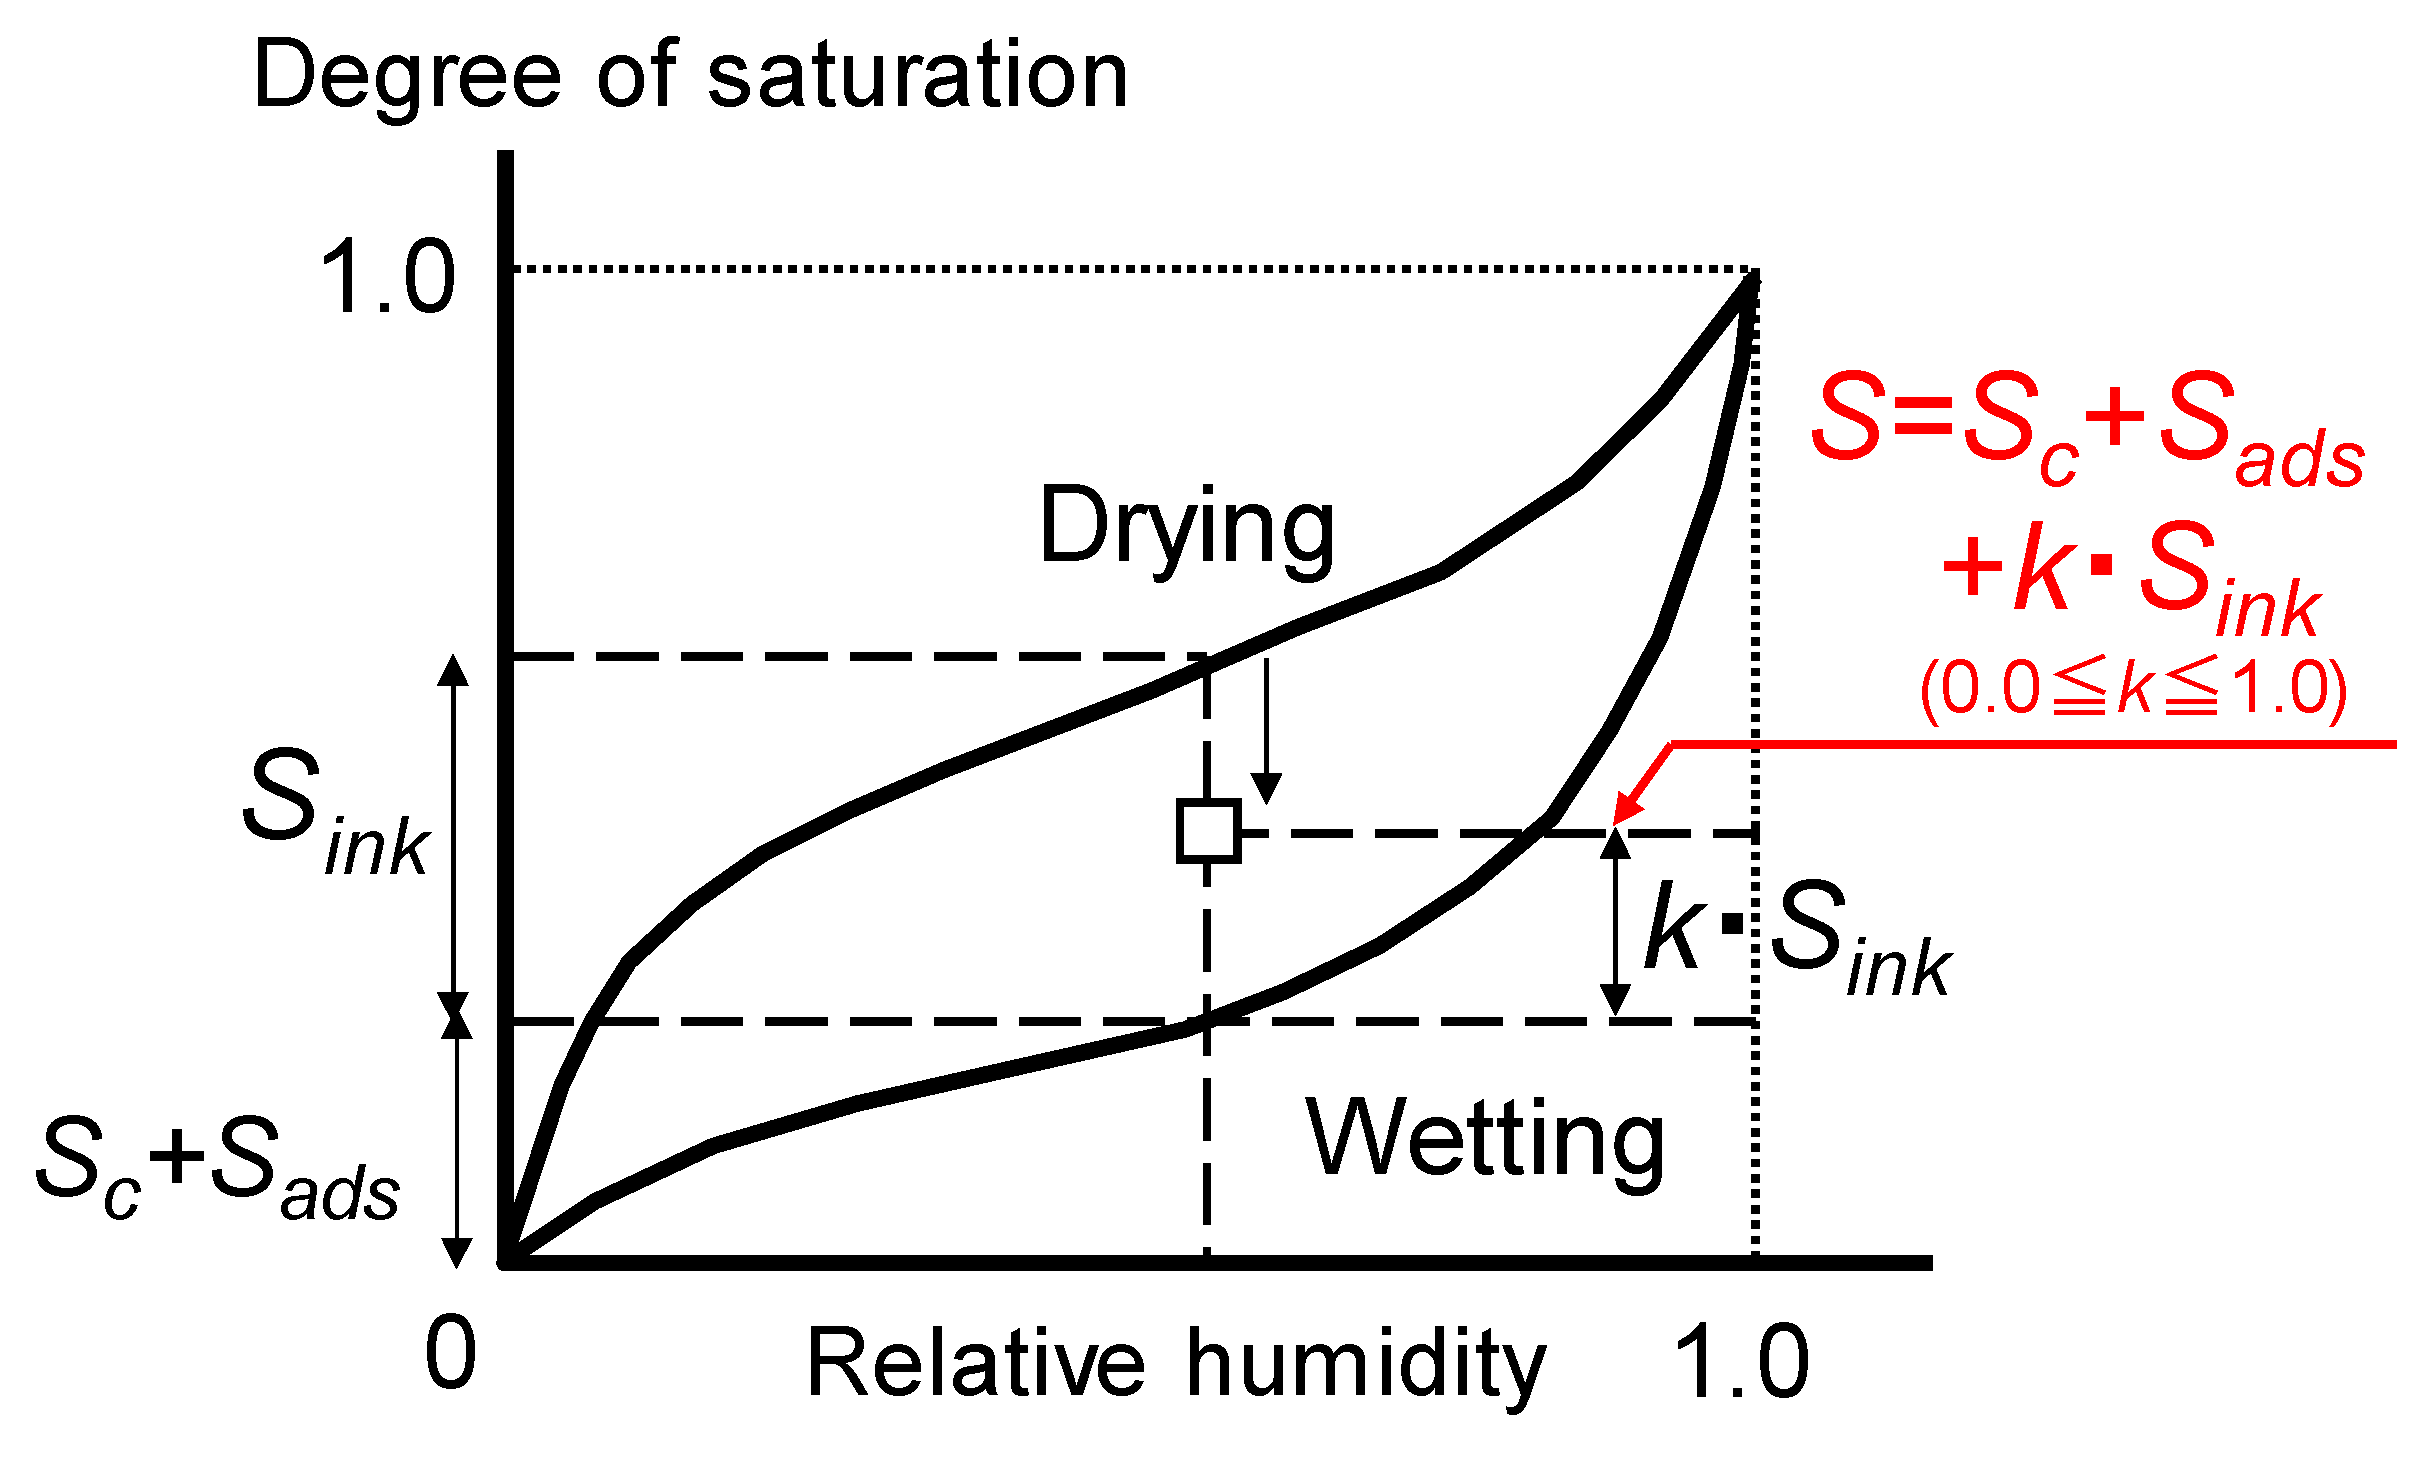
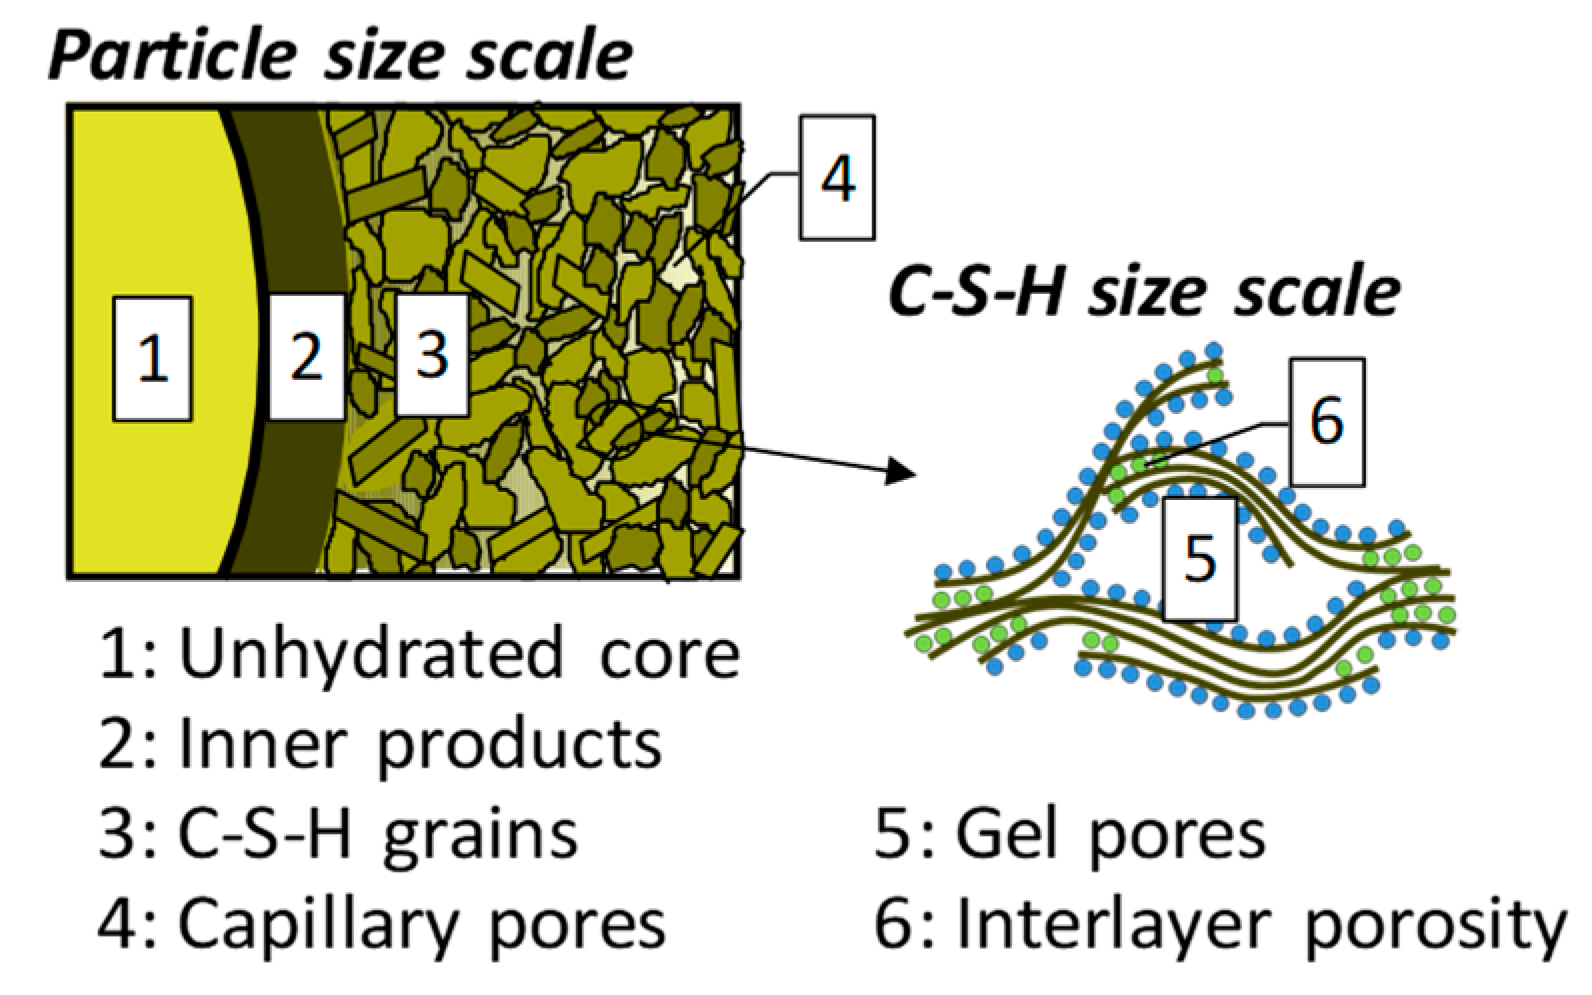
In the modeling of micro-pore structures in DuCOM, pores in cement paste are classified into interlayer, gel and capillary pores, according to sizes, formation process and whether or not the pore space is available for precipitating cement hydrates. Capillary pores are located outside cement particles and they correspond to spaces which are not yet filled with cement hydrates. Interlayer and gel pores are formed with hydration products during the hydration process. In the model, gel pores are defined as the summation of pores contained in hydrates and tiny spaces surrounded by adjacent hydrates. Gel pores are the spaces which are unavailable for precipitation of hydration products at ordinary temperature. Interlayer pores are caught in the layer structures of C-S-H gel and each pore size is similar to that of a water molecule [1,25]. Internal moisture states are expressed by modeling the thermodynamic equilibrium and hysteretic behavior of isotherms dependent on micro-pore structures. The degree of saturation in gel or capillary pores is calculated based on both condensed and absorbed water according to the Kelvin equation and the modified Brunauer-Emmett-Teller (B.E.T) theory proposed by Hillerborg [26], while considering ink-bottle effects of condensed water during the drying-wetting process. That one in the monotonic drying process is formulated in Equation (6).
where S is the degree of saturation with condensed water and absorbed water, Sc is the degree of saturation with moisture present in pores below radius rc, with which the equilibrated interface of liquid and vapor is created, Sads is the degree of saturation due to absorbed water, Sink is the degree of saturation with trapped water due to the ink-bottle effect and k is a parameter considering the time-dependent dispersion of ink-bottle water. k takes the value of 1.0 immediately after the start of the drying process and decreases with the progress of drying up to zero on the wetting curve as shown in Figure 14. Herein, the rate of moisture transfer (dk/dt) is modeled as a function including the environmental temperature and humidity [1,24].
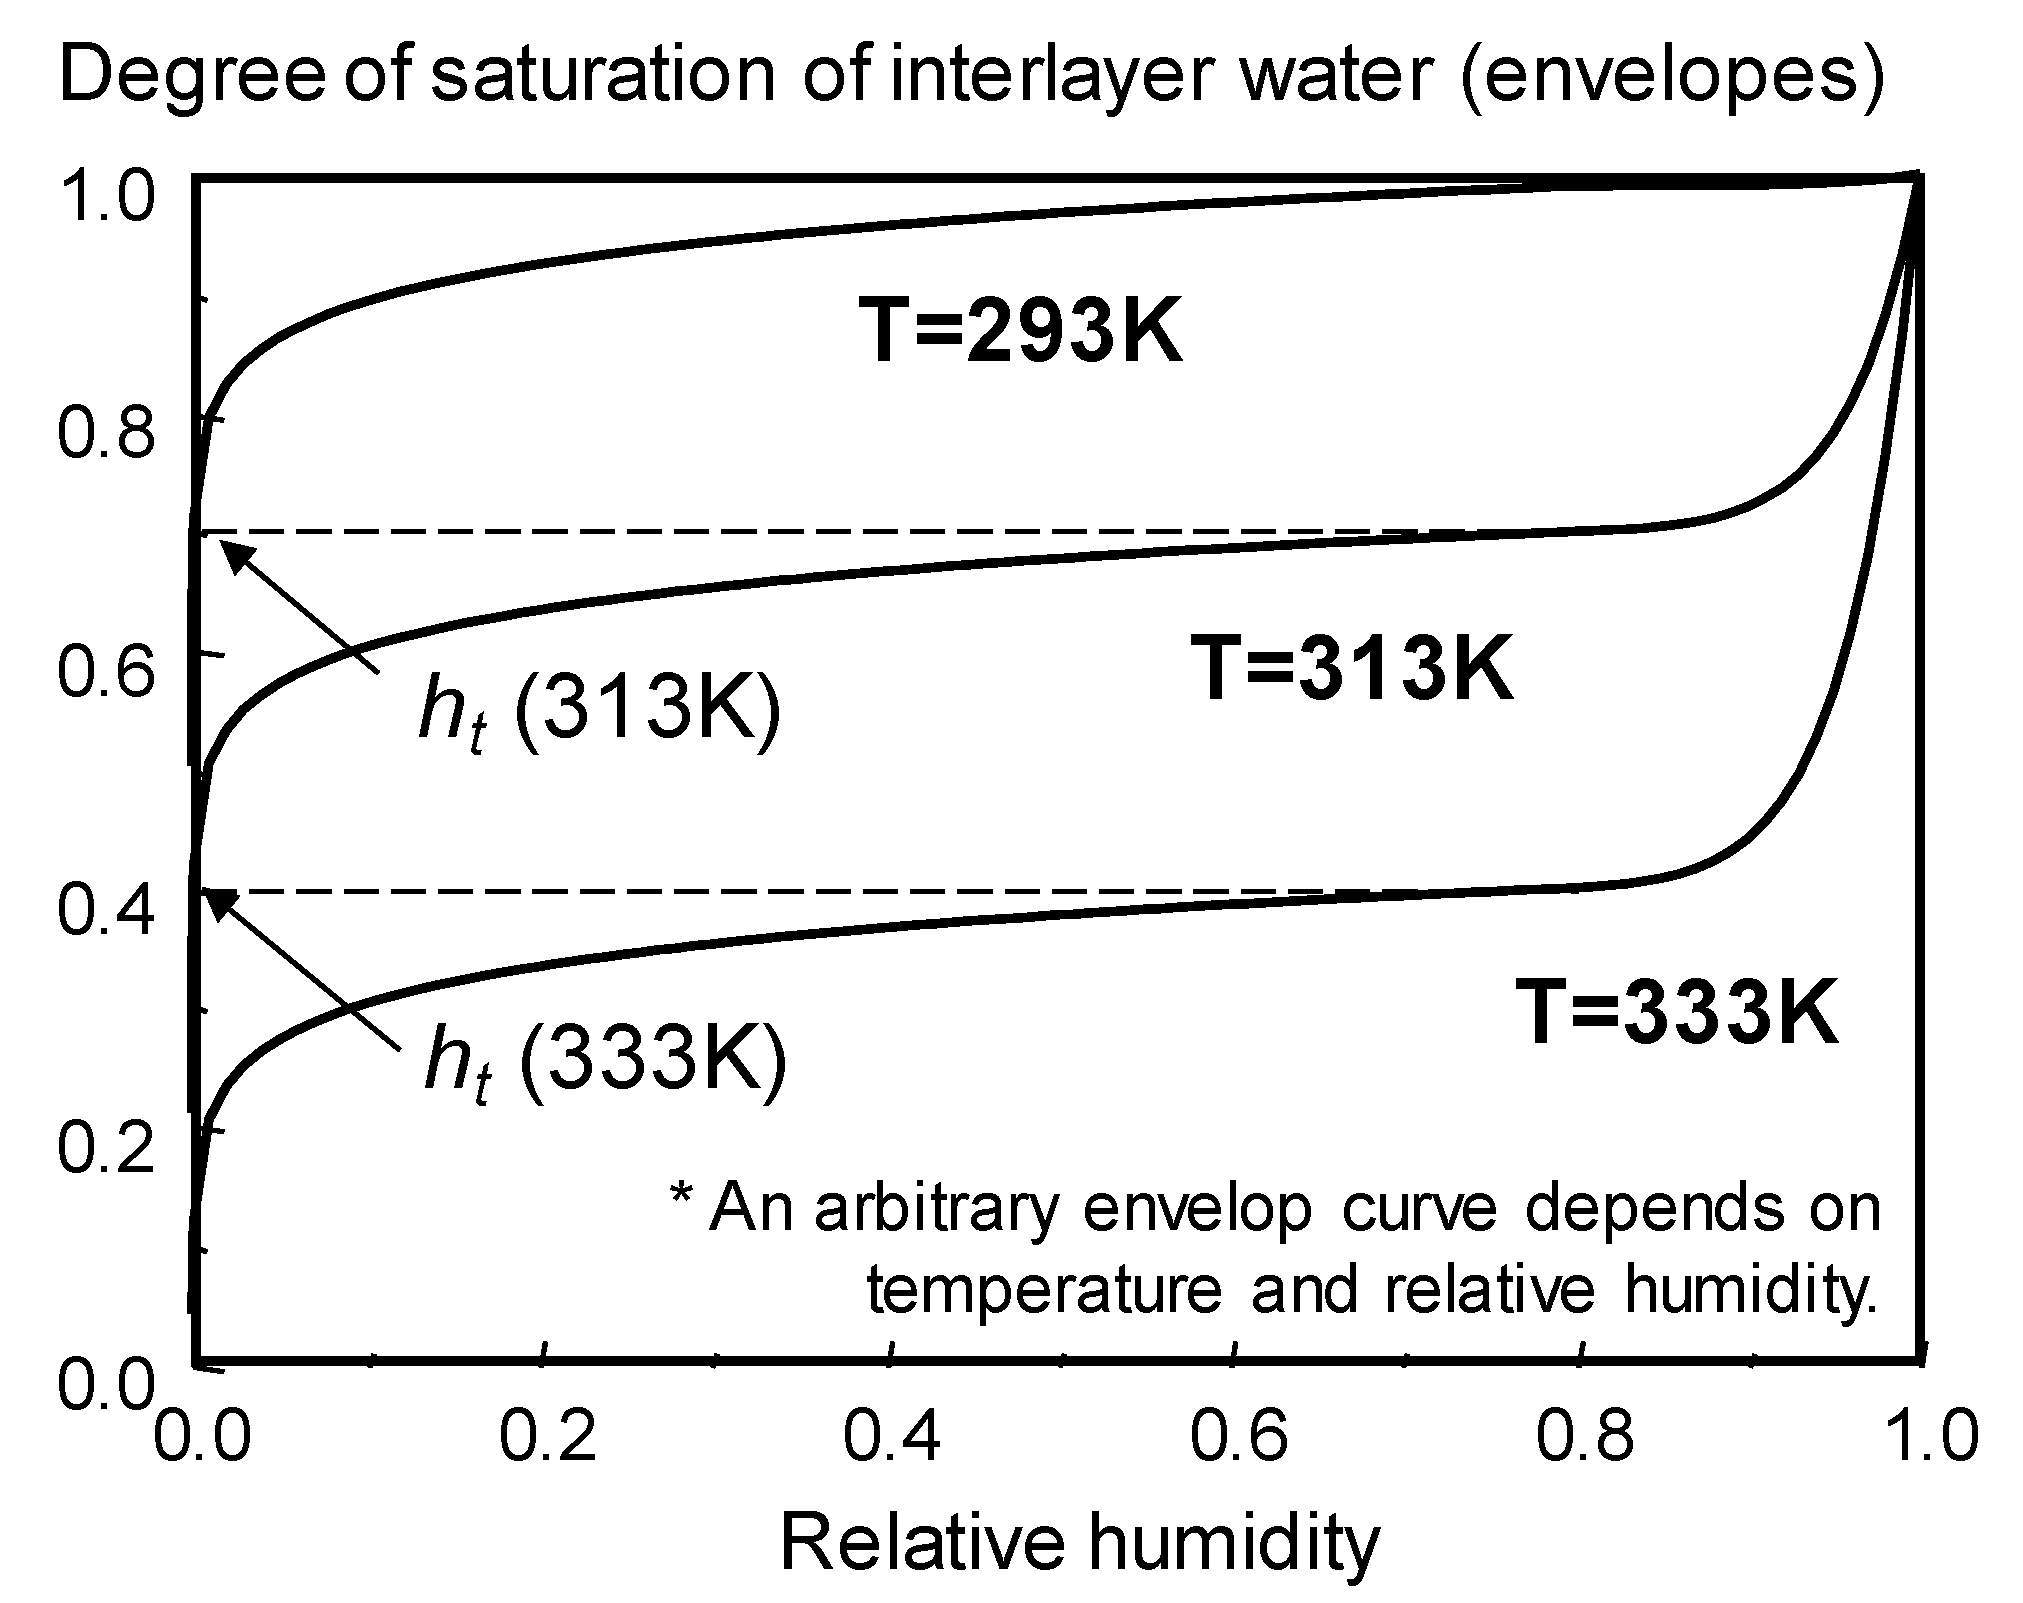
On the other hand, the moisture isotherm of interlayer water is expressed by the envelope curve as shown in Figure 15. Once an environmental condition is changed, the initial equilibrium point is moved toward the revised one defined by the environmental temperature and humidity with the rate depending on both conditions [1,24].
In this way, the thermodynamic moisture states in micro-pore structures are closely linked with the progress of hydration and moisture equilibrium/transports.
3.2. Target Concerns
The original model explained in Section 3.1 and the compressive strength development model, which is formulated as a function of the porosity of capillary pores, have been verified for various cement types and W/C mixtures to predict the weight loss and growing strength under various short-term conditions [1,21,24,25]. According to the model, the compressive strength develops with the decrease of capillary pores, and asymptotically approaches the ultimate value [21].
However, further verifications are required especially for various long-term and high temperature conditions as pointed out in the introduction. Hence, the comparative studies were conducted between the analyses and the experiments under exposure to thermal environments even after fine micro-pore structures were formed. The analyses were based on the modified model after the reverification of Part A in Figure 5, while referring to the past experiments whose conditions are listed in Table 4. All the specimens are made of ordinary portland cement (OPC).
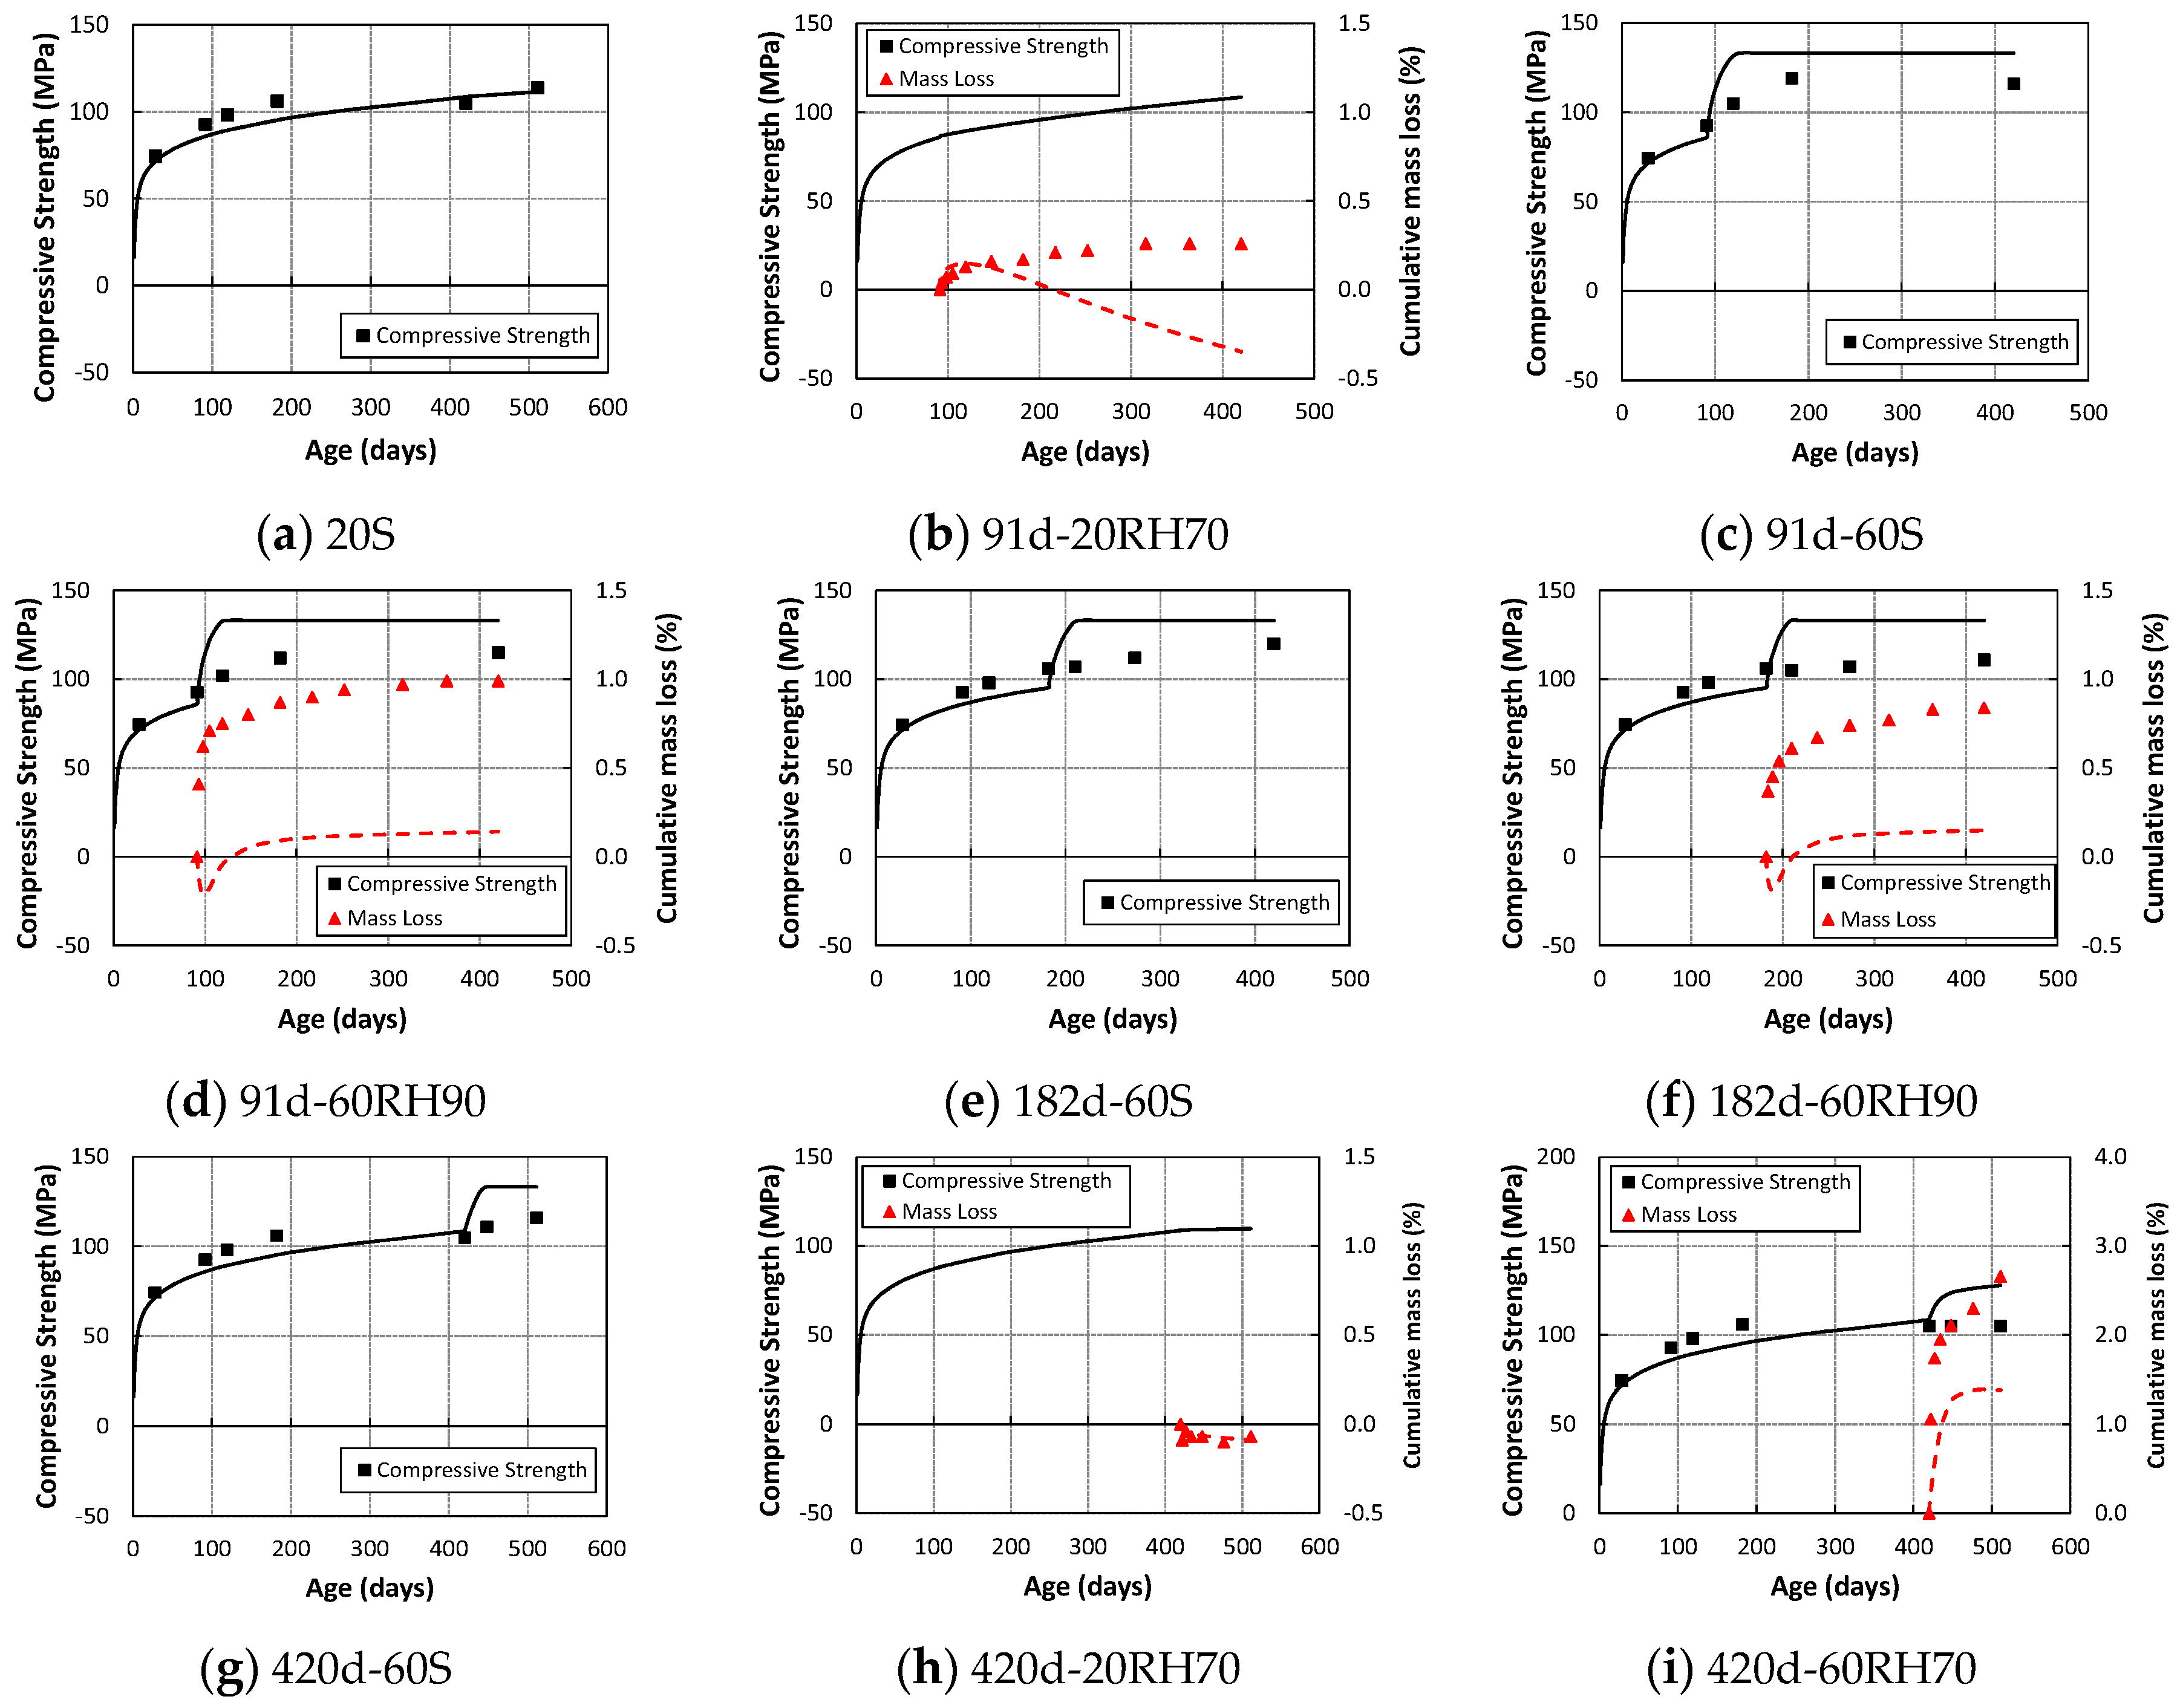
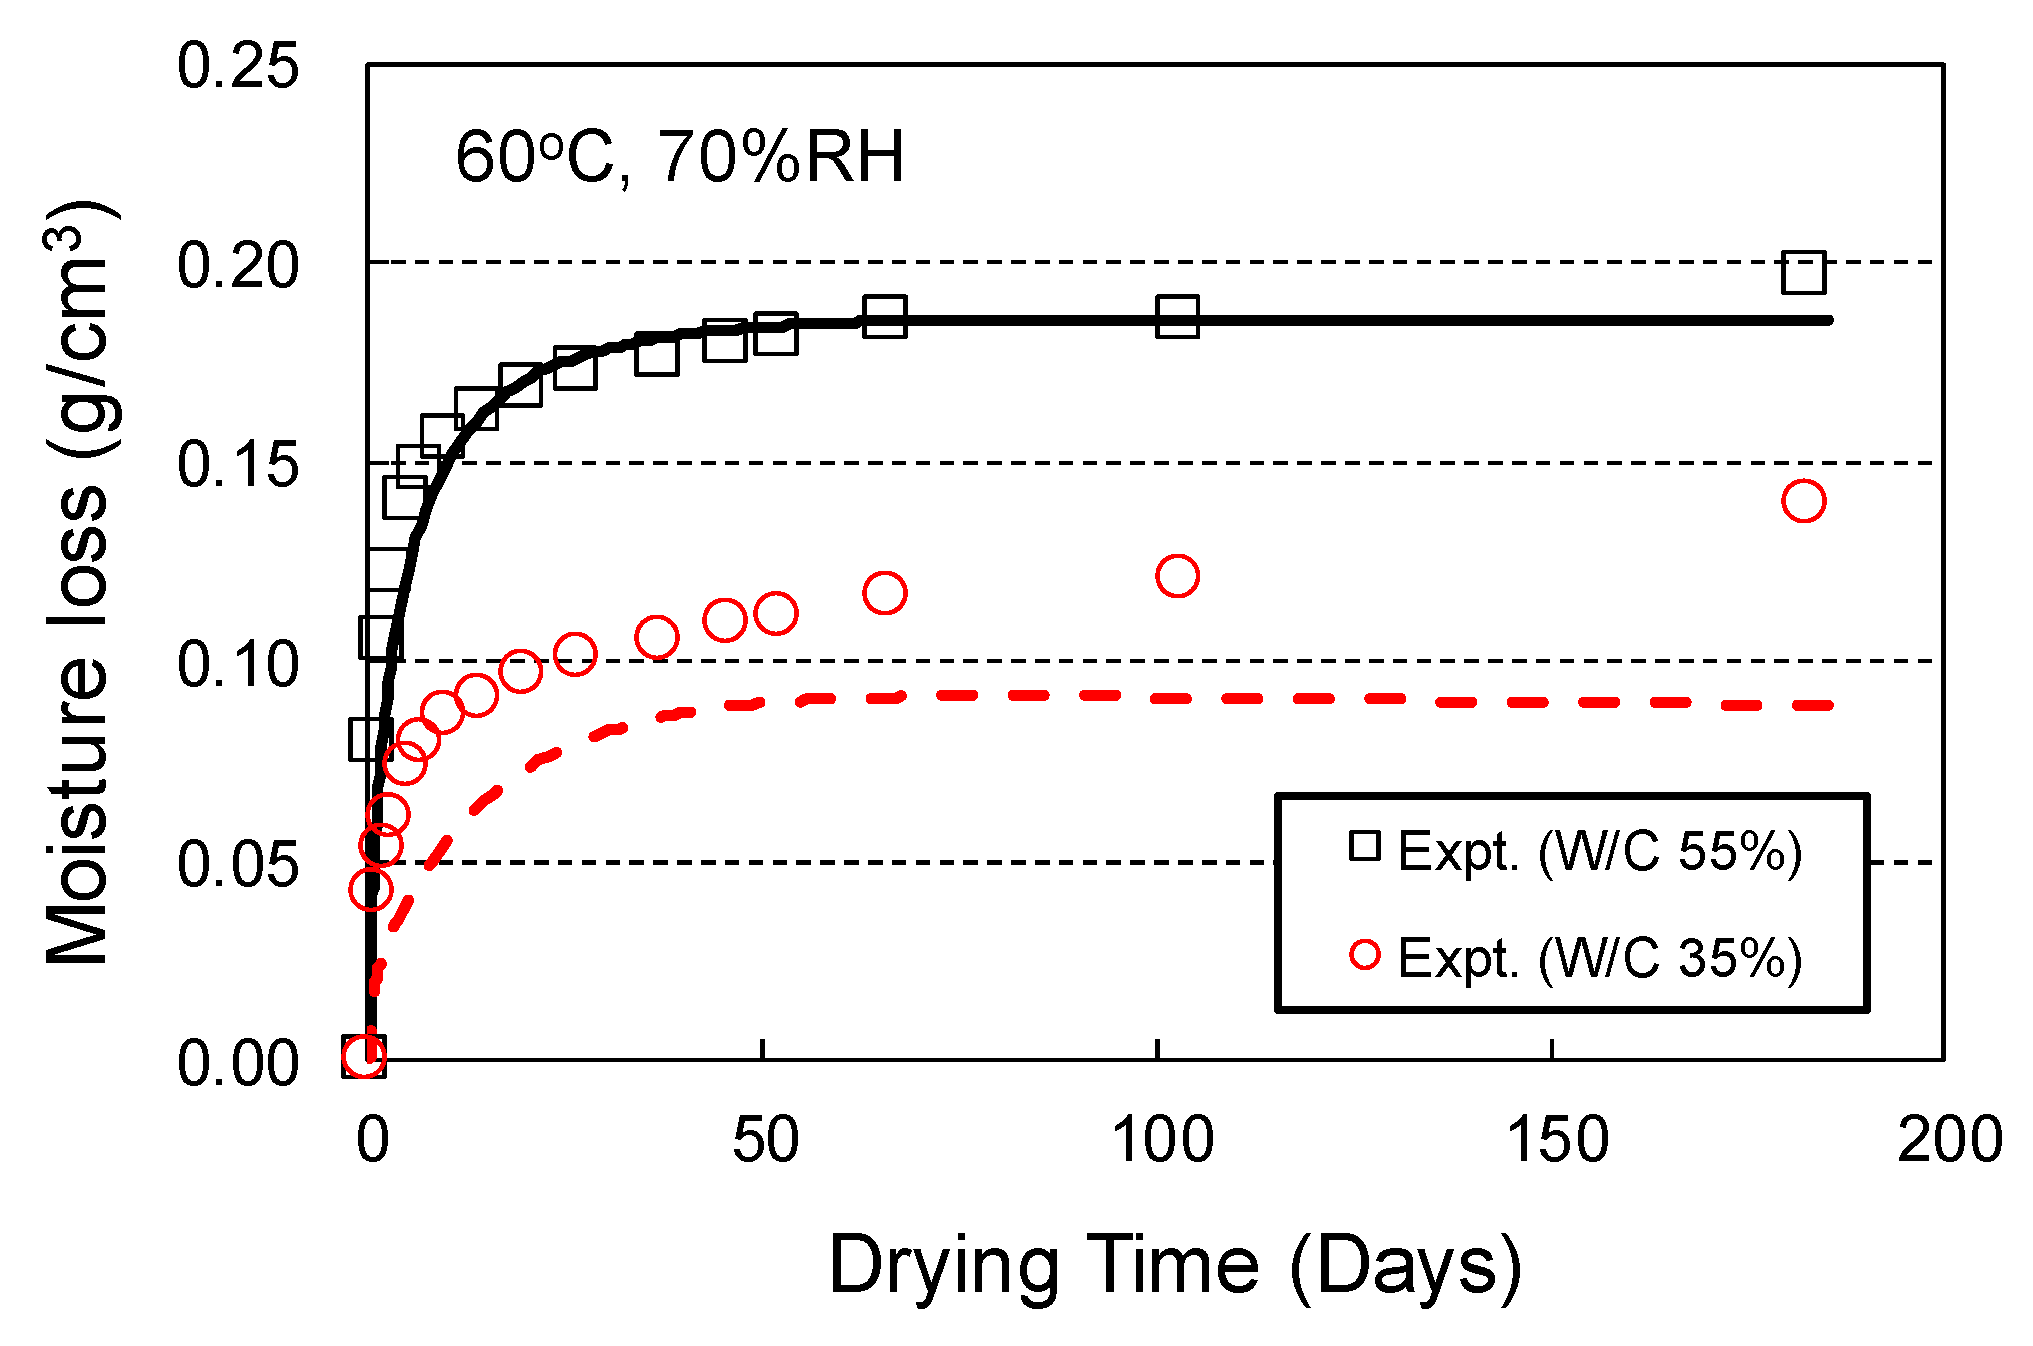
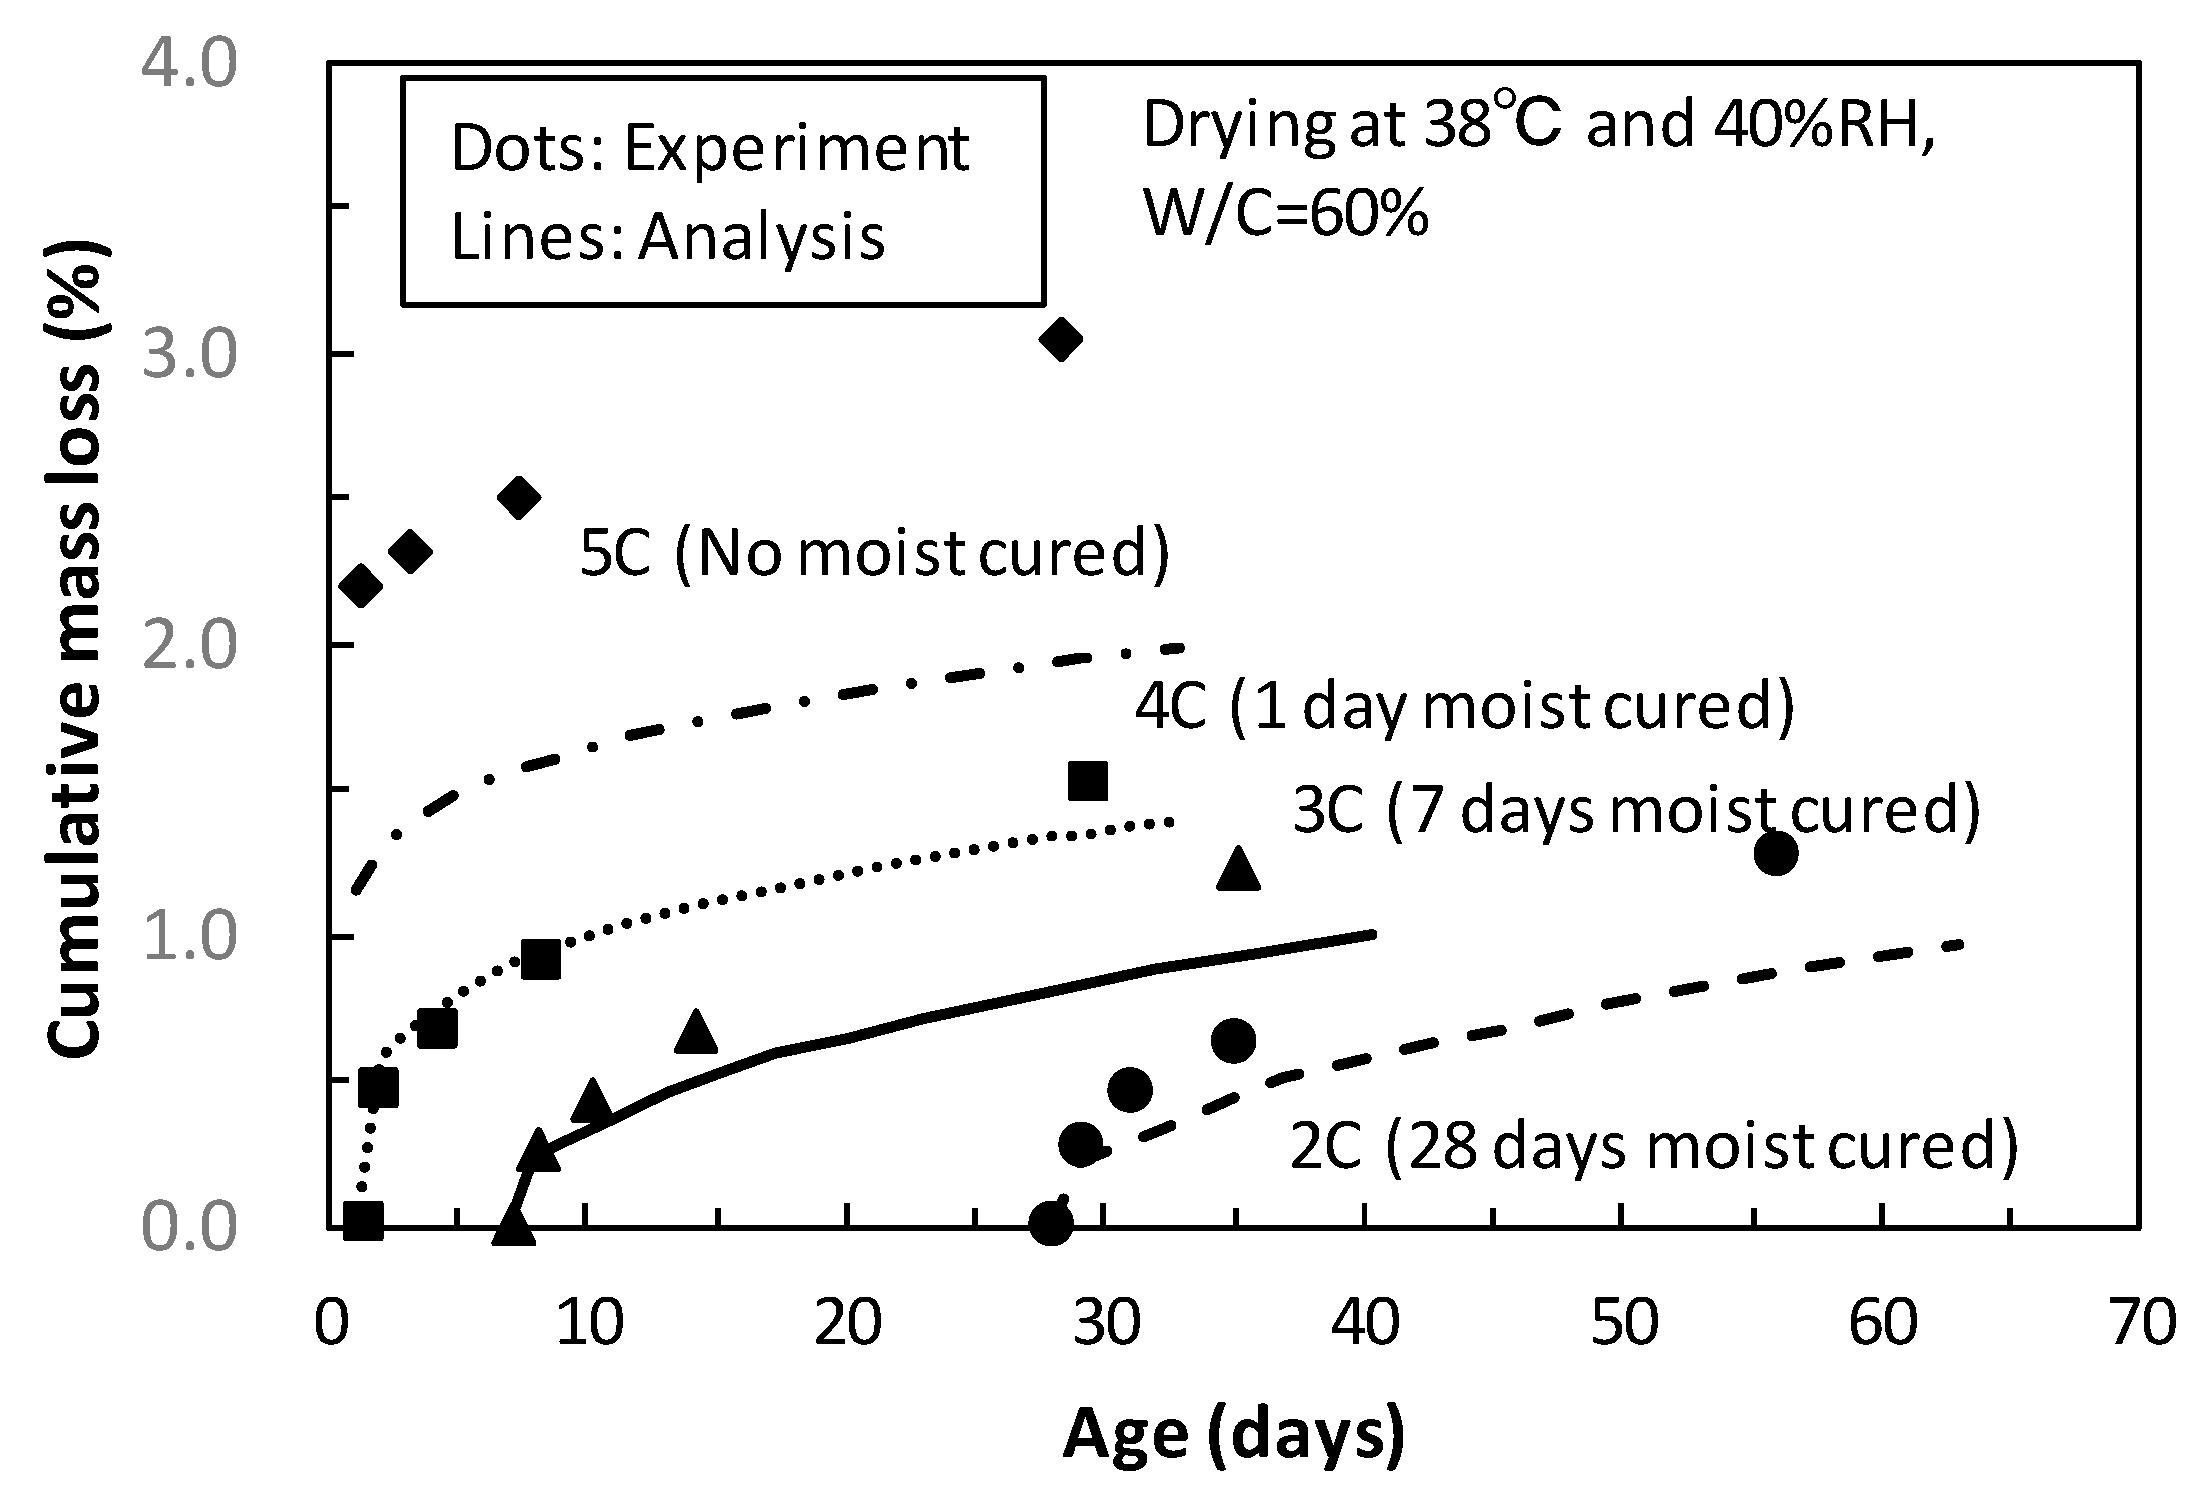
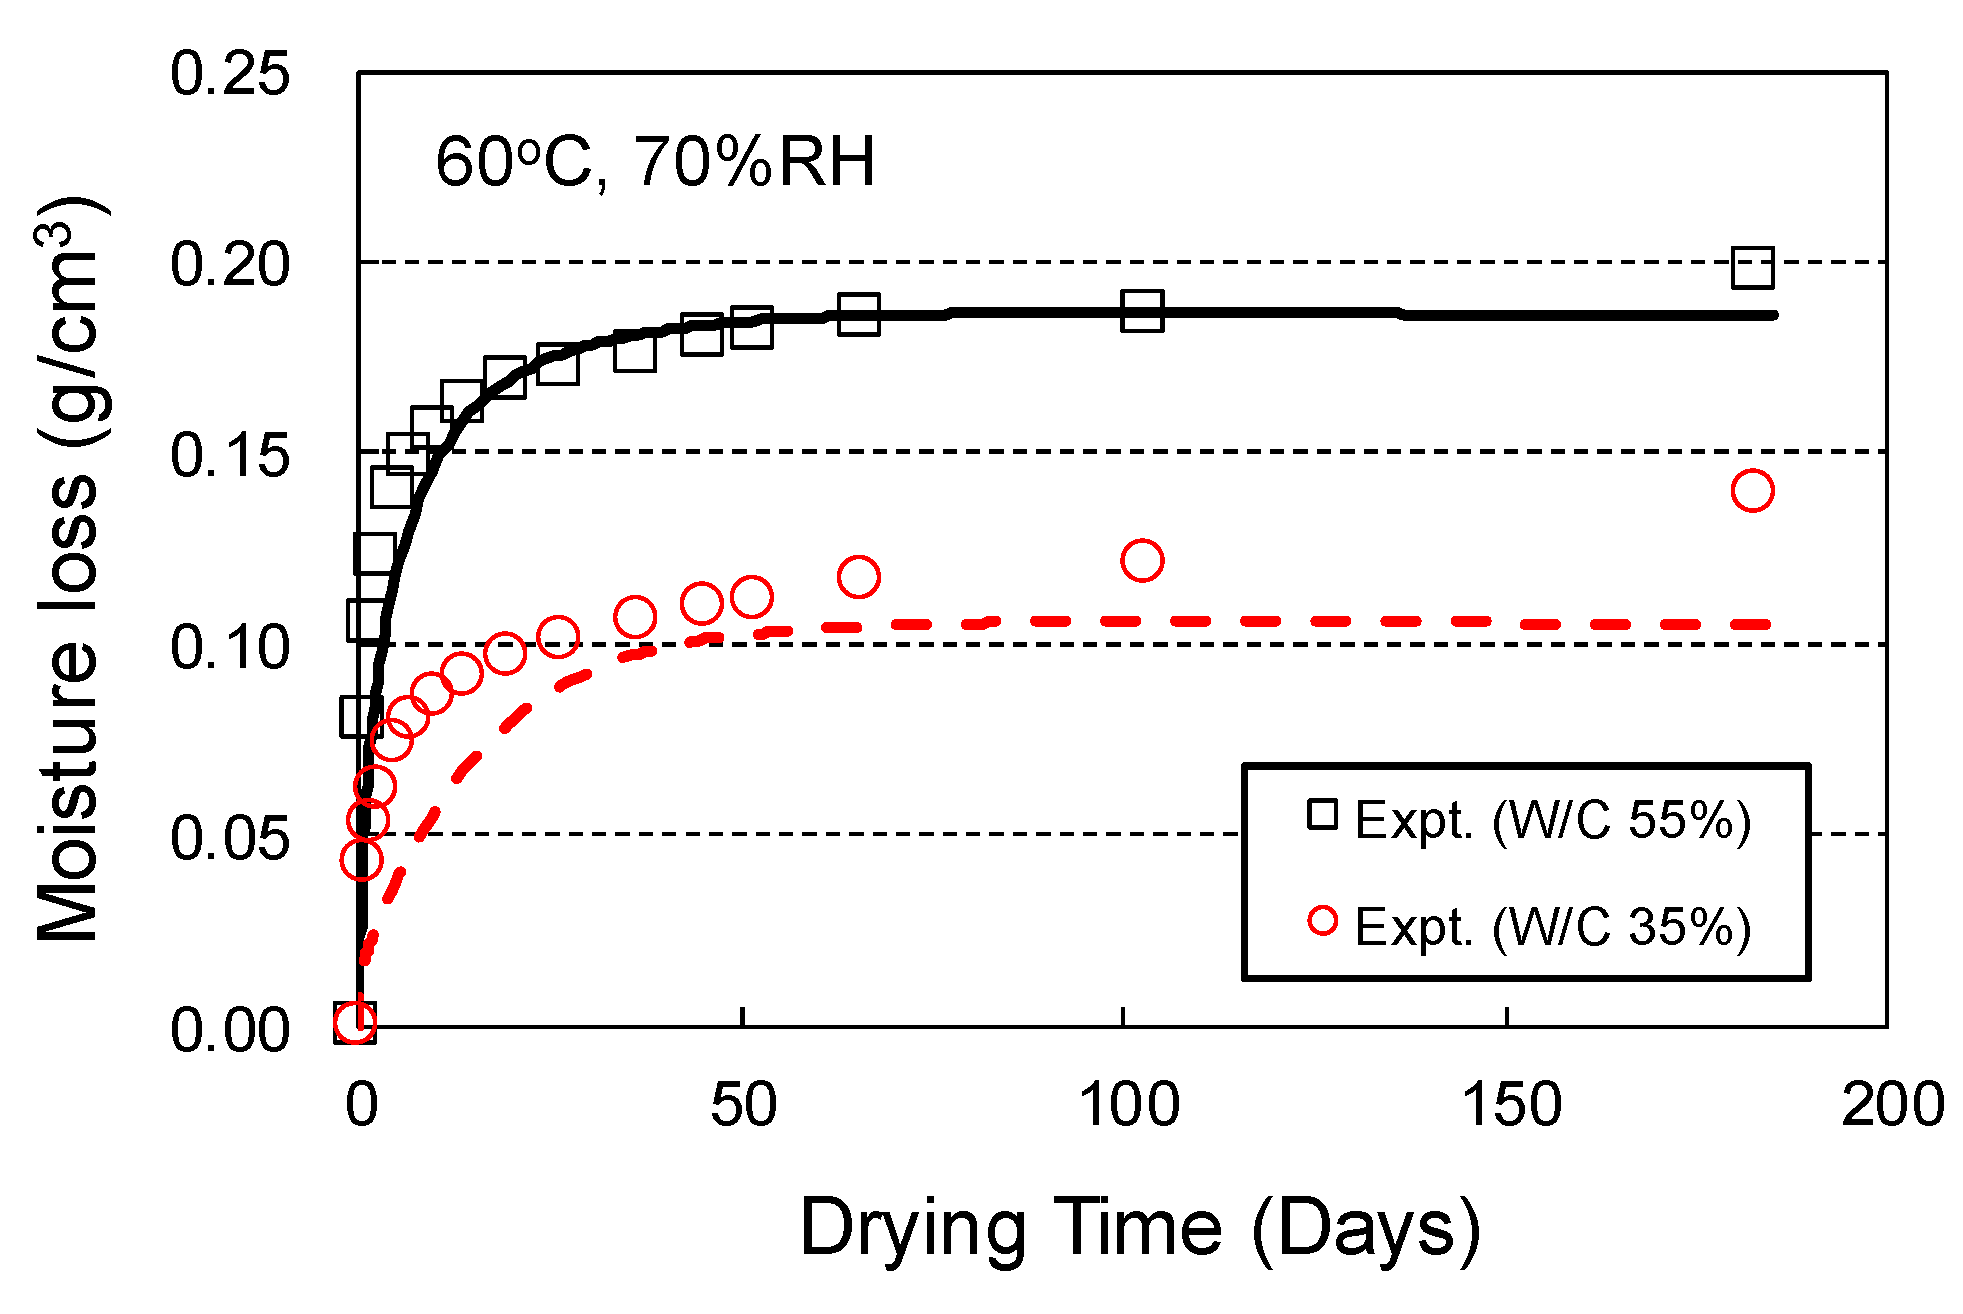
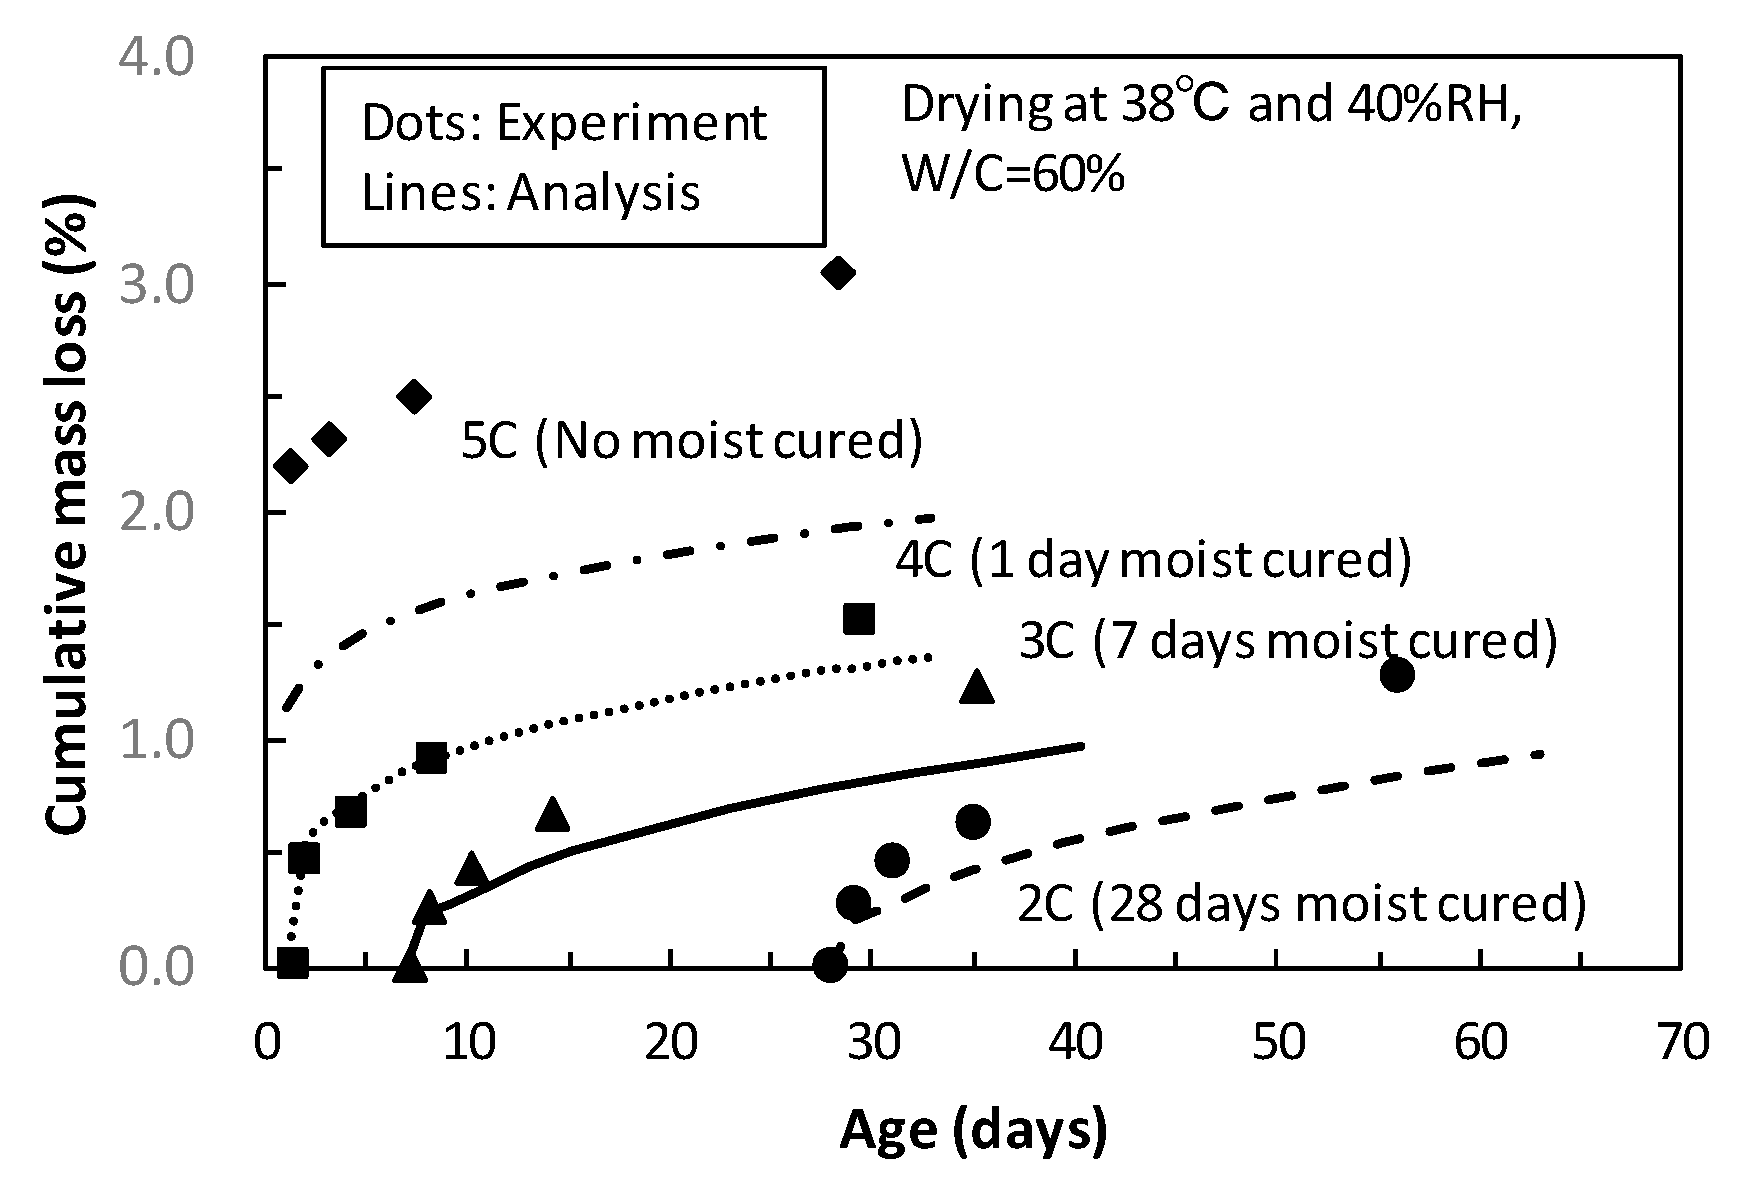
The comparative results are presented in Figure 16, Figure 17 and Figure 18. Here, the cases named from (a) to (i) in Figure 16 basically consist of “the duration under sealing at 20 °C” and “the subsequent exposure conditions”. For example, 20S means that the specimen continues to be kept under sealing at 20 °C, whilst 91d-60RH90 means that it is exposed to the environment at 60 °C in R.H. 90% after sealing at 20 °C for 91 days. In Figure 16, it was demonstrated that every numerical case agrees well with the compressive strength obtained in the experiment during the period of sealing at 20 °C, but the numerical strength is overestimated, while the weight loss is greatly underestimated, after exposure to 60 °C. Although the horizontal plateau of the compressive strength in some figures is observed, this suggests that capillary pores are completely filled with hydration products, leading to the ultimate value according to the formulation. In Figure 17, the analysis of W/C55% provided good agreement with the experiment, but that of W/C35% was not proper due to underestimation. Although Figure 18 targeted the normal W/C mixtures of 60%, the analysis, except for the case 5C without moisture curing, agreed well with the experiment.
Considering the results, it was suggested in the analysis that unreacted cement particles in the case of a low W/C mixture remain even after hydration proceeds for a long time and then, if thermal loading is added, ink-bottle water trapped in capillary and gel pores apart from interlayer water is highly dispersed and redistributed into the micro-pore structures. As a result, the redistributed condensed water is quickly and excessively consumed for further hydration. On the other hand, the discrepancy shown in Figure 16b is an unmissable point. Whereas the experiment tends to converge with weight loss over time, the analysis adversely presented that the weight increases by moisture infiltration from the surrounding environment with a higher humidity toward the inner parts with self-desiccation. This point is similarly thought to be caused by excessive hydration, which occurs in a low W/C mixture in the analysis. In contrast, it is clear that excessive hydration poses little problem for a normal W/C mixture as shown in Figure 17 (W/C55%) and Figure 18. Herein, the dispersion rate of ink-bottle and interlayer water under various environments defined in the modeling was verified in References [1,24]. If the rate is higher than the current setting, it cannot express the experimental tendency of gradual growing of the compressive strength and the weight loss as in Figure 16d,f. This is because, in such a case, condensed water immediately after exposure to a high temperature environment is supplied faster, leading to convergence of the tendency within a shorter time. By contrast, if the rate is lower than the current setting, it may be possible to explain such a growth in strength, but further weight losses are inevitably restrained due to a greater consumption of condensed water for hydration before evaporating into the air. Consequently, it is inferred that the critical concern of the modeling exists not in the dispersion rate but in the possibility for continuous hydration in fine micro-pore structures.
3.3. Discussion on Spatial Condensed Water in Fine Micro-Pore Structures
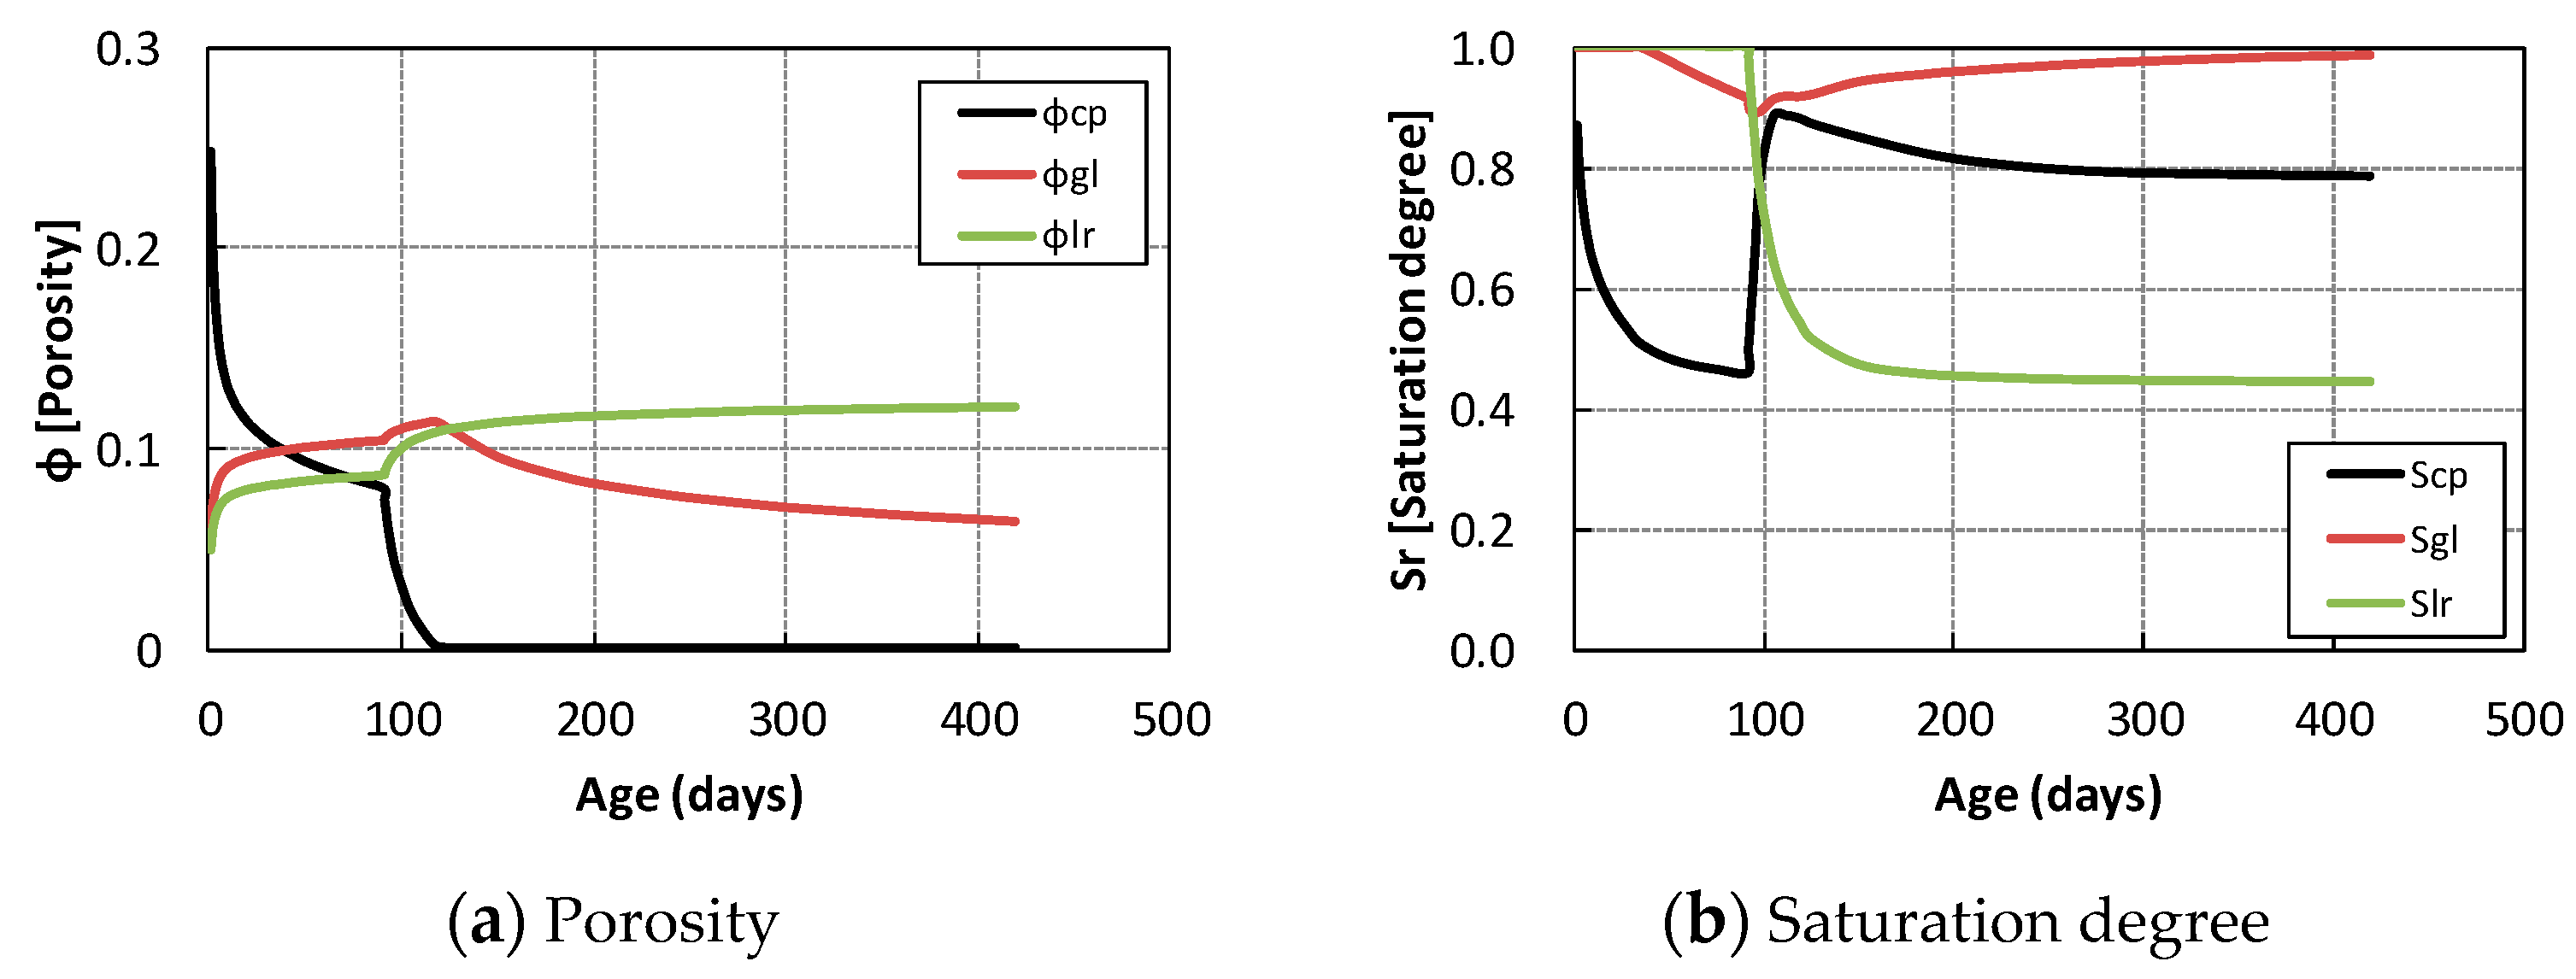
As pointed out above, excessive hydration was observed particularly in the analysis immediately after the exposure to 60 °C. To analyze the background of the modeling leading to such a critical concern, this section examines some numerical parameters simulated through the analysis. Figure 19 displays the numerical history of each porosity and its saturation degree, with the subscripts standing for capillary (cp), gel (gl) and interlayer pores (lr), in the case of Figure 16d. This Figure suggests that the saturation degree of capillary pores increases quickly due to the redistribution of water induced by the thermal loading from the age of 91 days, resulting in the disappearance of capillary pores with the precipitation of cement hydrates. After that, while gel pores begin to be filled gradually, their saturation degree increases up to 1.0 value. On the other hand, the numerical compressive strength in Figure 16d converges after the age of 120 days, where capillary pores completely disappear, due to the formulation of the compressive strength development model as described previously.
In contrast to this analysis, the compressive strength in the experiment does not grow so quickly and greatly. Herein, focusing on each porosity at the age of 91 days which is the initial point of thermal loading in Figure 19a, it is found that the porosity of capillary, φcp, is smaller than that of gel, φgl. In the model, capillary pores are defined as the residual volume excluding the precipitated hydrates and unreacted particles in cement paste. Namely, the state of φcp < φgl is thought to be the state in which capillary pores left among hydration products become much less in volume, each being as fine as a gel pore, due to dense precipitation in open spaces. A schematic view is illustrated in Figure 20. In such fine micro-pore structures, it is possible that capillary and gel pores become almost closed or dead-end pores surrounded with a large amount of hydration products. Moreover, there is a concern that air voids stagnate in moisture transporting paths, preventing condensed water from moving around as pointed out in Reference [30].
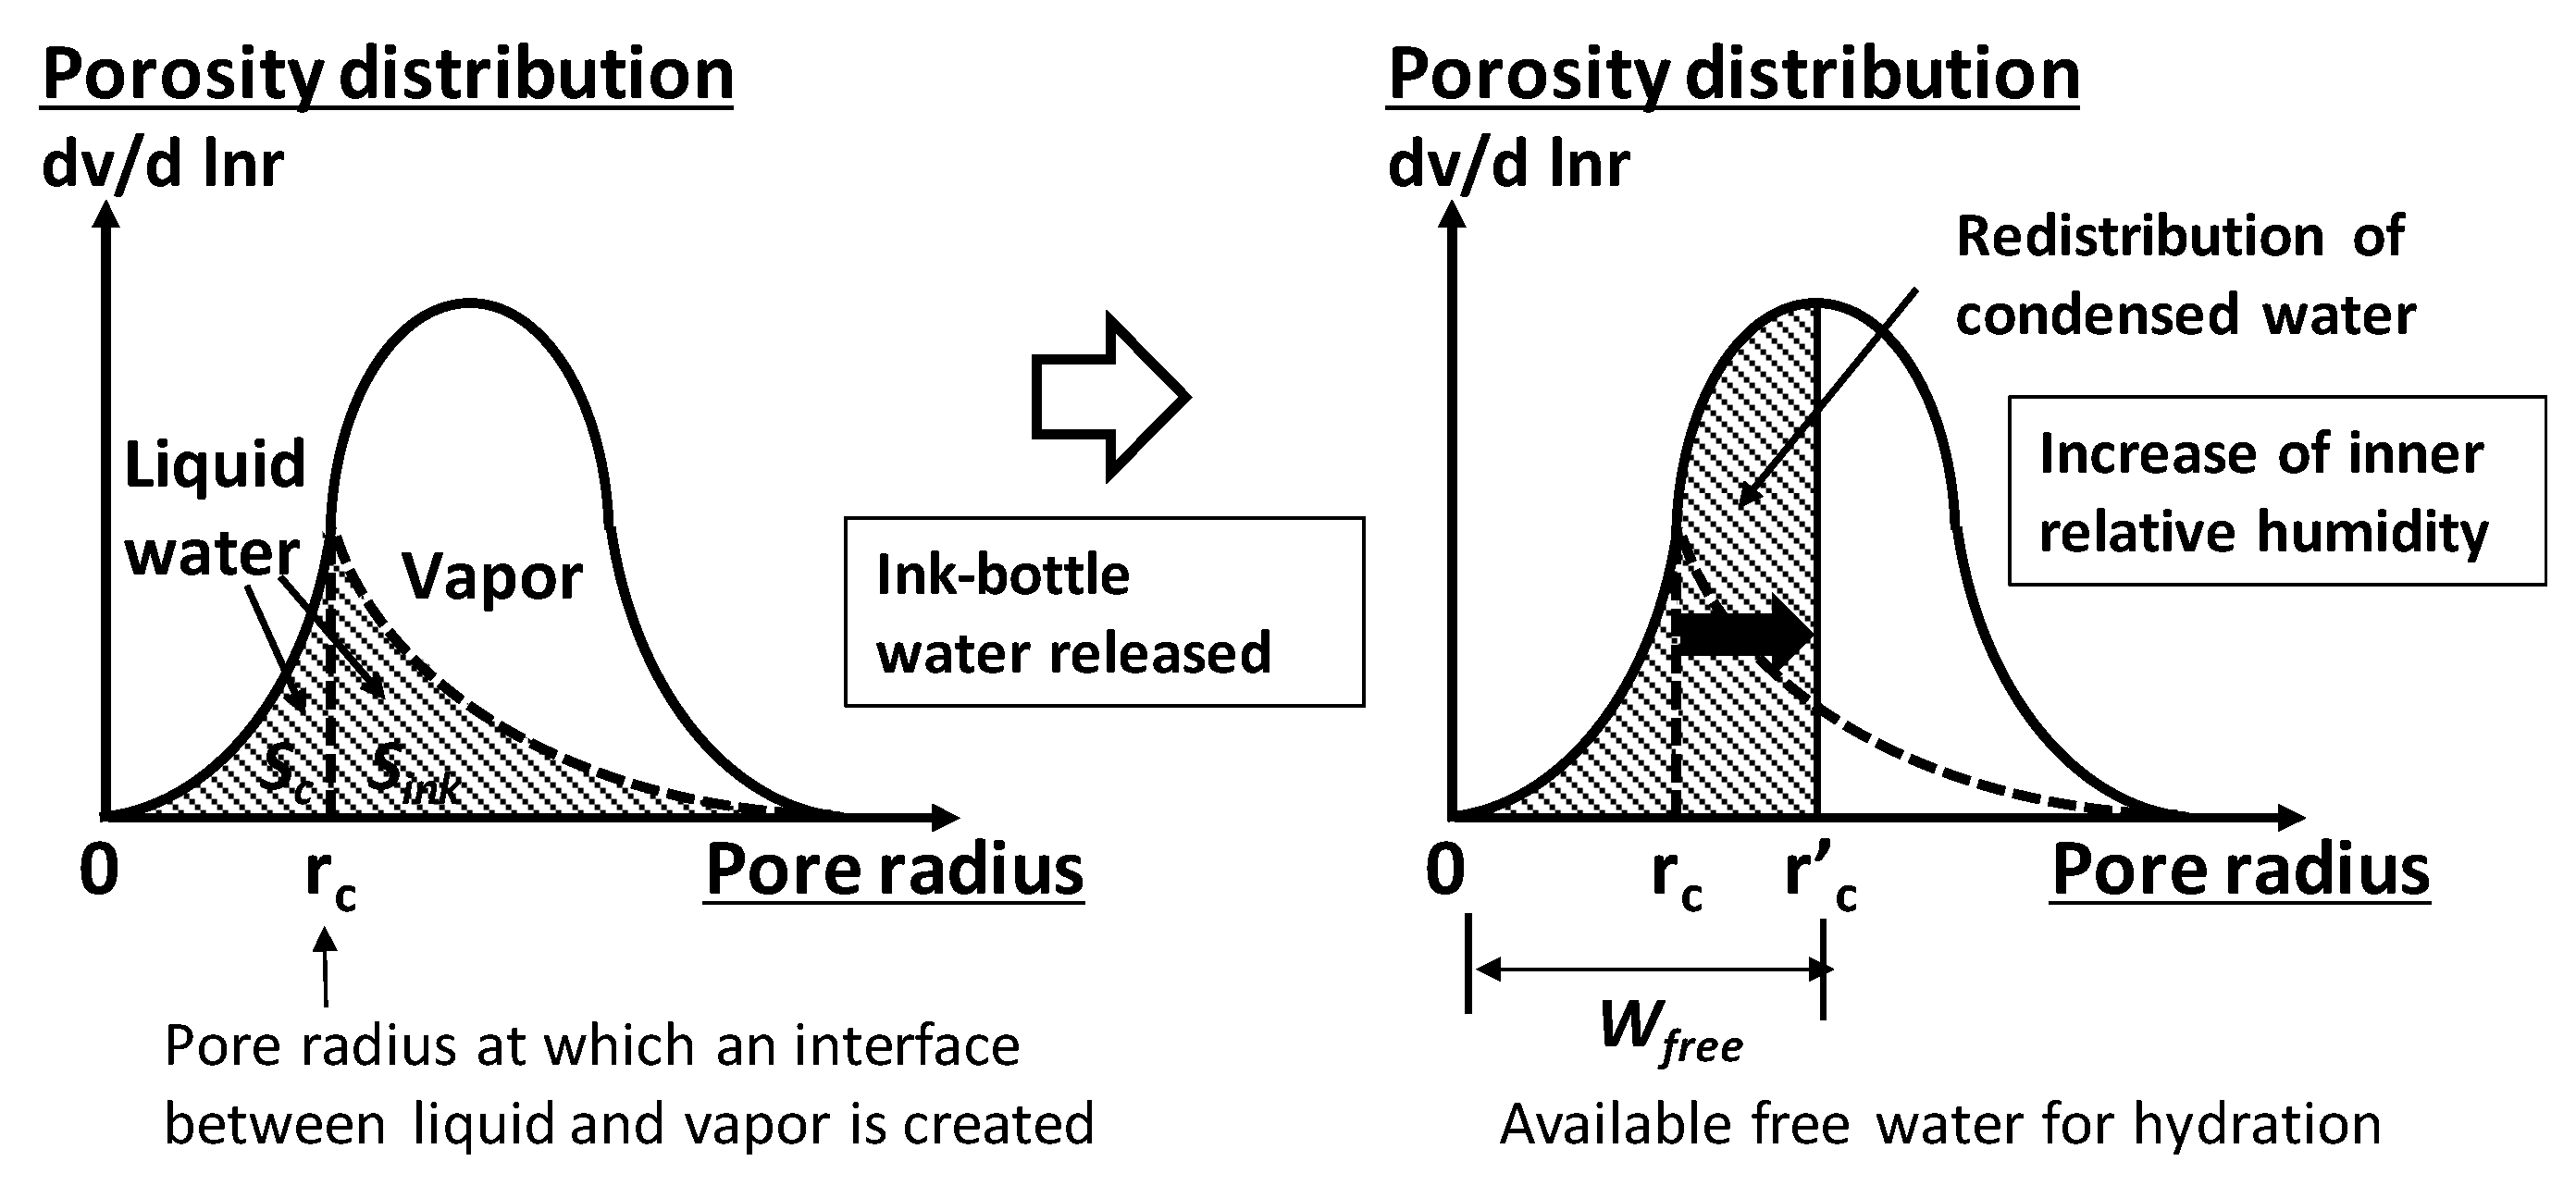
In the original moisture equilibrium/transport model, if the seal-curing condition is changed from ordinary temperature to high temperature, the inner relative humidity increases due to redistribution of condensed water deriving from ink-bottle water trapped in capillary and gel pores apart from interlayer water. The modeling scheme on redistribution of condensed water is illustrated in Figure 21. However, this scheme is principally based on the hypothesis that capillary and gel pores are connected to one another, and moisture equilibrium/transport can occur easily and quickly. In short, wherever the redistributed water is condensed in capillary and gel pores, it can be available as free water for hydration in capillary pores in other spaces. Nevertheless, it is highly doubted whether the same hypothesis is applicable to such a case as fine micro-pore structures of a low W/C mixture after significant hydration. This is because it is supposed that most of the redistributed water is condensed in gel pores, occupying almost all the pores, and the water is difficult to be transported for hydration due to the quasi-closed structures as described above. Consequently, it was considered that the original model needs to be extended in consideration of spatial condensed water in fine micro-pore structures, while being subjected to the basic scheme of Figure 21 [24]. The following extensive modeling is newly added to the original model and a crucial point proposed in this study.
3.4. Formulation of Extensive Modeling and its Verification
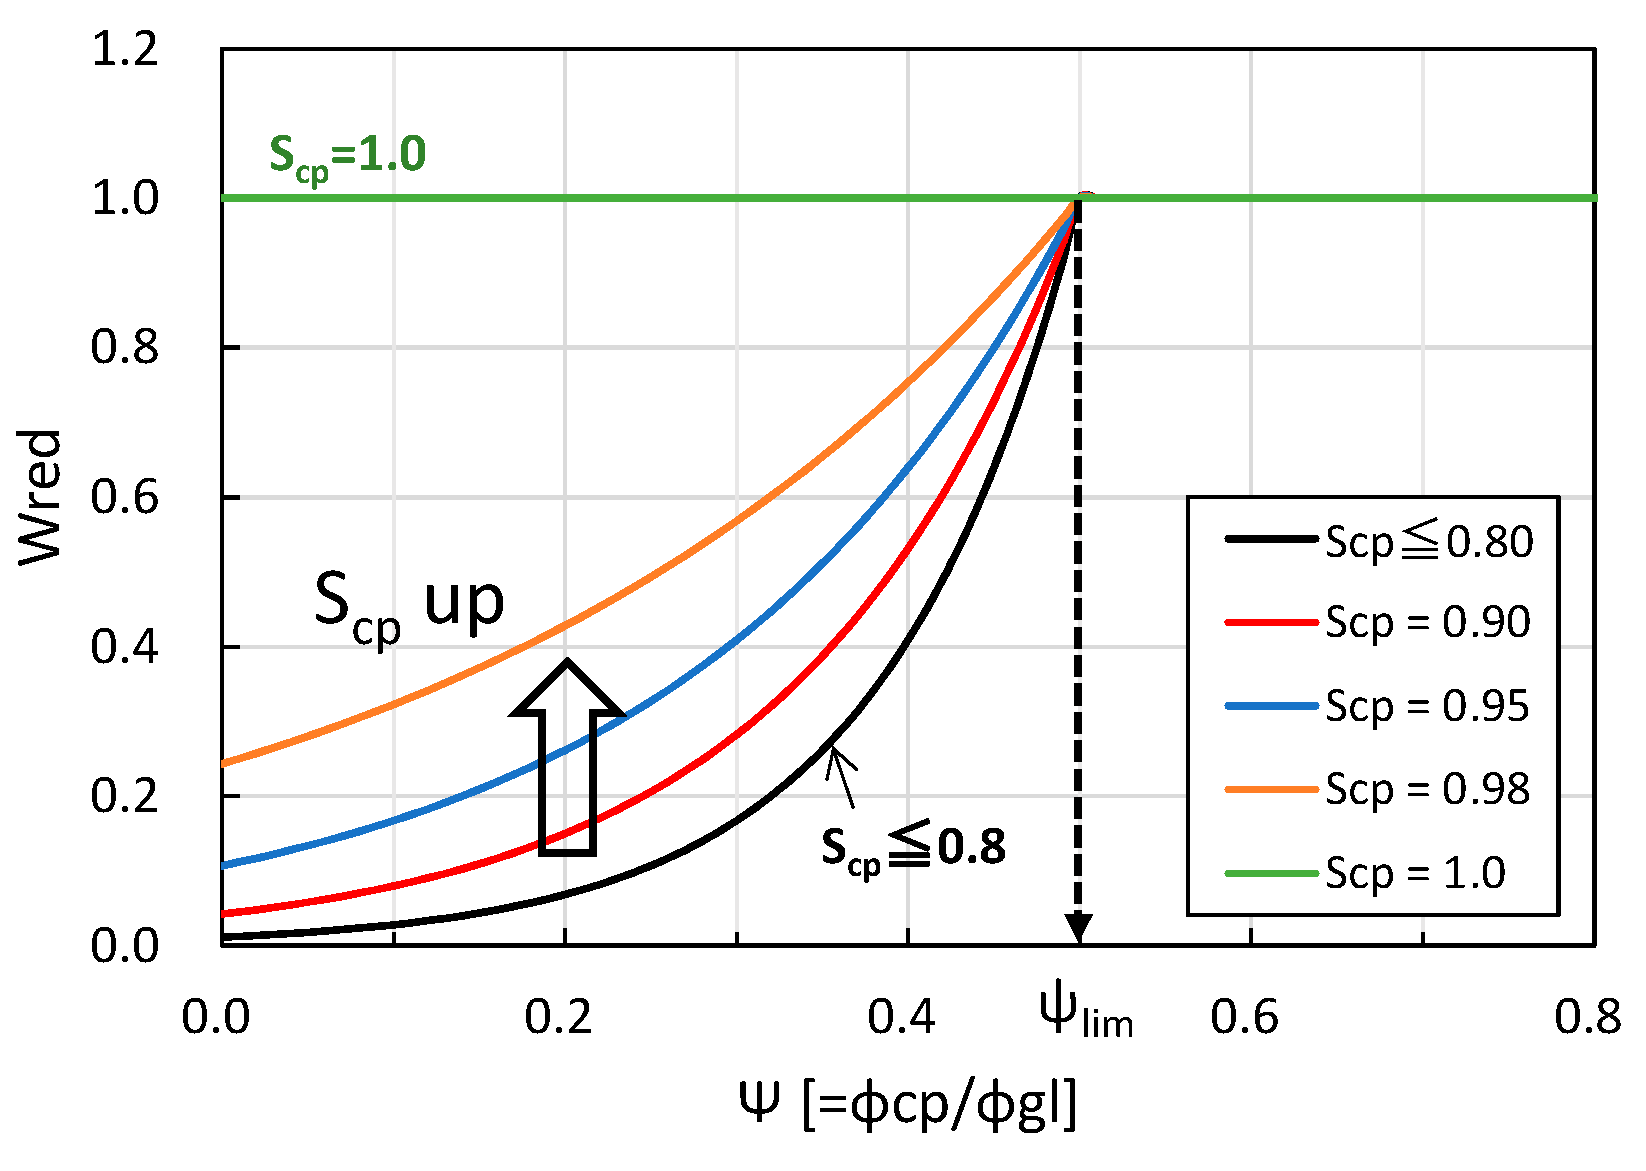
Based on the above discussion, it was hypothesized that only part of condensed water is available for hydration due to discontinuous fine pore structures, which are peculiarly formed in a low W/C mixture. Specifically, this paper proposes an extensive model in which the amount of free water available for hydration is reduced according to a new evaluation parameter of discontinuity of pore structures. The proposed formulation is shown as follows:
where Ψ is the porosity ratio of capillary to gel, which is an indirect parameter simply representing discontinuity of pore structures, Ψlim is the critical value of Ψ at which existing condensed water is fully available wherever it is, is the modified amount of free water available for hydration, wfree is the amount of free water, wred is the reduction factor against the amount of free water, Scp is the average saturation degree of capillary pores, and a is the constant that stands for an impact of Scp on the reduction factor, wred. In short, by using the above extensive model, the available free water is limited with wred, only when both of the following conditions are met; Ψ is smaller than Ψlim, and Scp is unsaturated (less than 1.0). Herein, Ψlim and a were finally determined through various sensitive analyses and regarded as 0.5 and 10.0, respectively, in this paper. Figure 22 displays the relationship between Ψ and wred, defined in Equation (9). In the range of Ψ ≥ Ψlim (= 0.5), this extensive model can be considered the same as the original one, because wred remains 1.0. On the other hand, as the lower Ψ falls in the range of Ψ < Ψlim, the amount of free water available for hydration is more limited according to Scp. In the case of Scp = 1.0, condensed water naturally exists around unreacted cement particles, enabling hydration to proceed continuously without limitation regardless of Ψ.
The comparative results based on this extensive model are presented in Figure 23, Figure 24 and Figure 25 in comparison with Figure 16, Figure 17 and Figure 18 before extension. In Figure 23, each numerical case provides good agreement with the experiment. Moreover, the different growing curve of the compressive strength could be properly traced between the sealing at 60°C and the exposure to the environment at 60 °C in R.H. 90%. This enhancement was attained by incorporating the influence of the saturation degree of capillary pores into wred. In Figure 24, it can be observed that the W/C55% mixture is simulated well similarly to the result before extension as shown in Figure 17, and the result of the W/C35% mixture is significantly improved by using the extensive model at the same time. Then, Figure 25 is found to be equivalent to Figure 18. This results from the fact that Ψ never reaches Ψlim (= 0.5) during these ages, because the W/C is 60%.
These results reveal that the proposed extensive model works properly to enhance simulation accuracy, covering the peculiar hydration in a low W/C mixture. In other words, this extensive modeling can be applied to arbitrary W/C mixtures in a unified approach.
4. Influence on Time-Dependent Deformation Based on the Proposed Extensive Model
In this chapter, the extensive DuCOM, which was tackled and verified in the previous chapters, is coupled with COM3, with evaluation of time-dependent deformation for a long time being carried out through the integrated analysis (Figure 5, Part C)
As illustrated in Figure 1, (A) DuCOM and (B) COM3 are linked with (C) the multiscale constitutive model. In DuCOM, pores are classified into interlayer, gel and capillary pores, according to sizes, formation process and whether or not the pore space is available for precipitating cement hydrates. Their thermodynamic moisture states in micro-pores can be calculated by the basic components of DuCOM and transferred to the constitutive model. The constitutive model is based on the rheological model of solidifying cluster proposed by Asamoto, et al. [28]. Although the brief explanation to estimate time-dependent deformation is described in the introduction, the detail modeling and mathematical formulations are explained in [1,28]. For example, the dashpot viscosity and plastic strain limit are tailored for association with pore saturation. It is assumed that dry, empty pores may rapidly reach converged plasticity while liquid-filled pores may exhibit slow viscous flow. As creep deformation in the submerged state is smaller than when dry, and since lower humidity causes greater creep, larger ultimate plastic strain is assumed under severe drying conditions in the model.
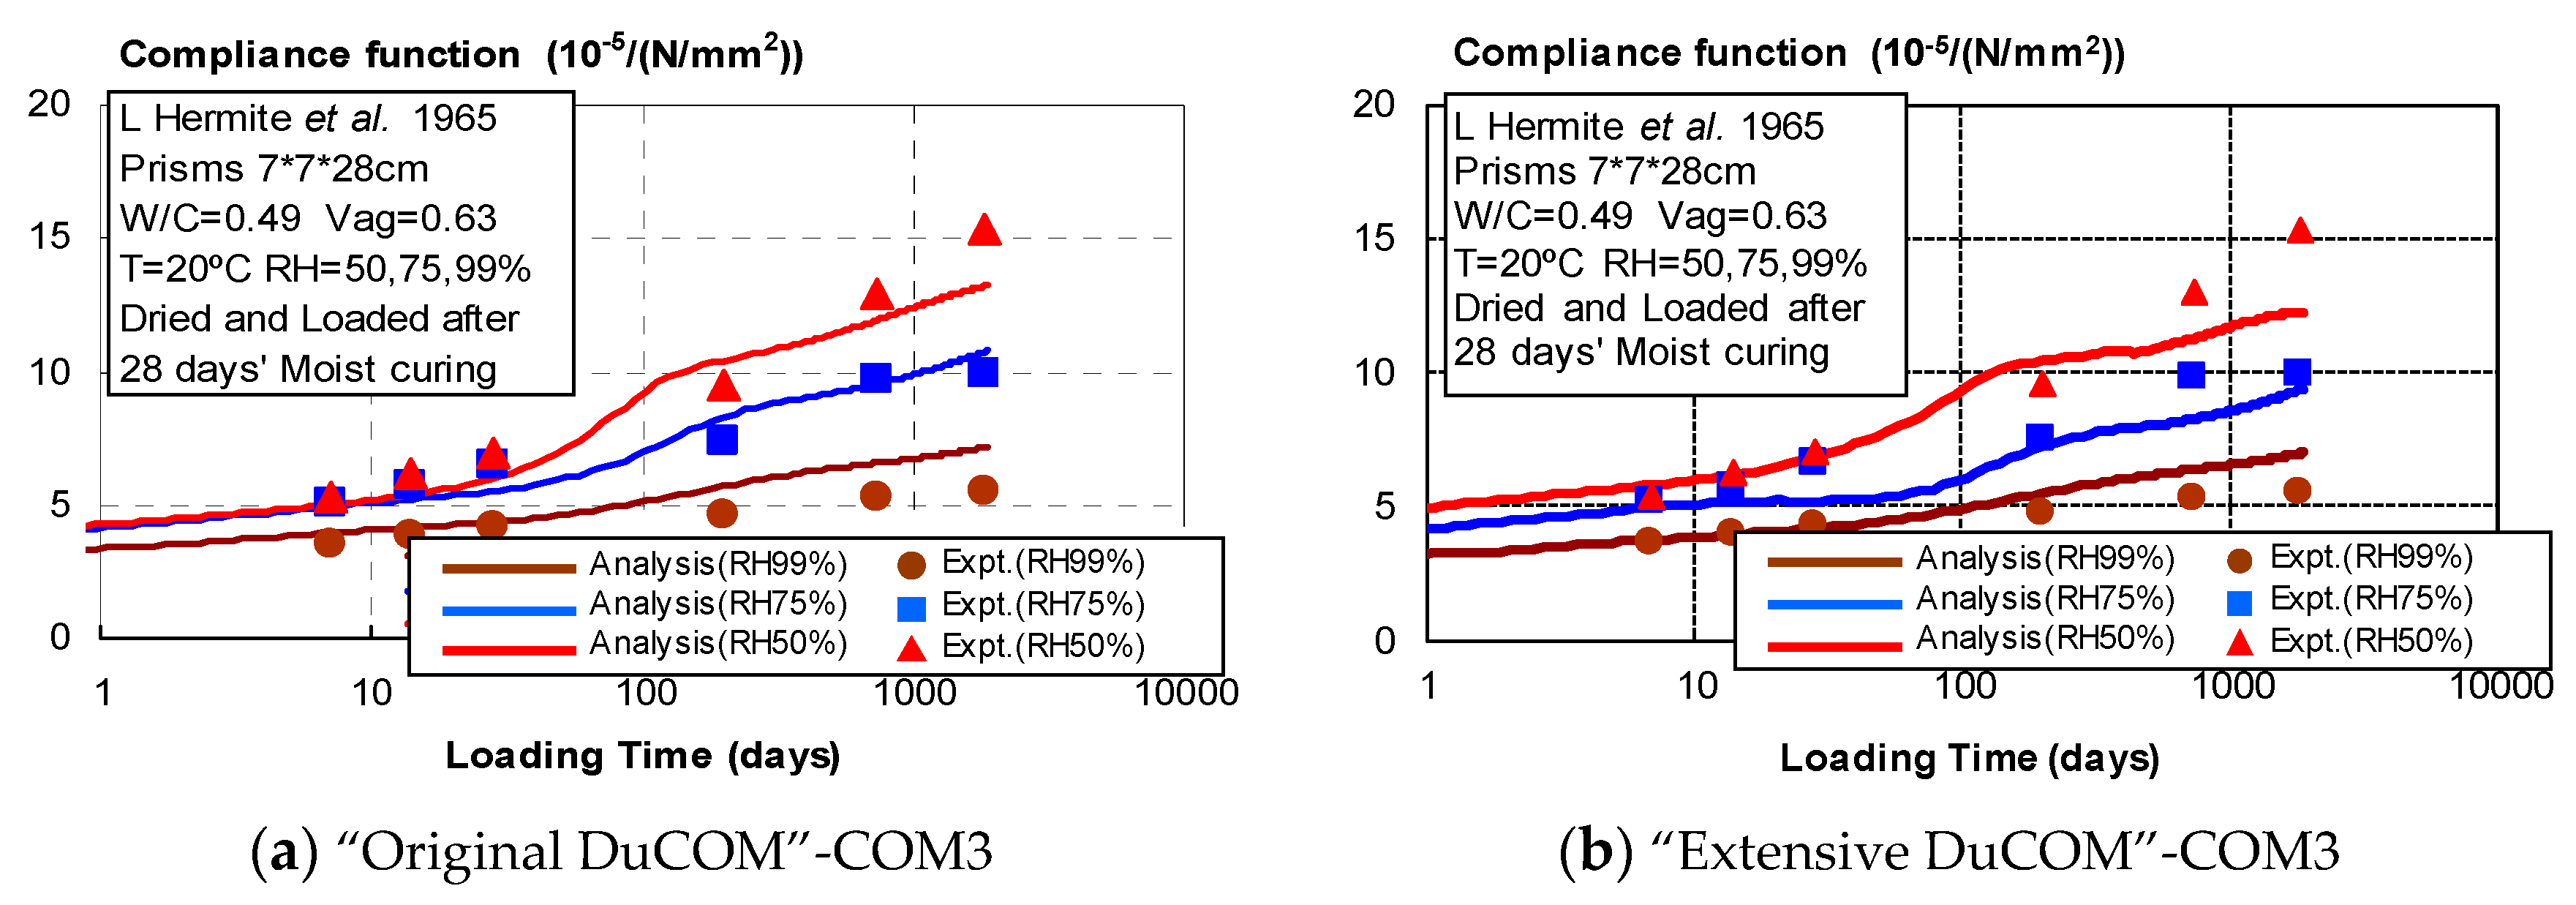
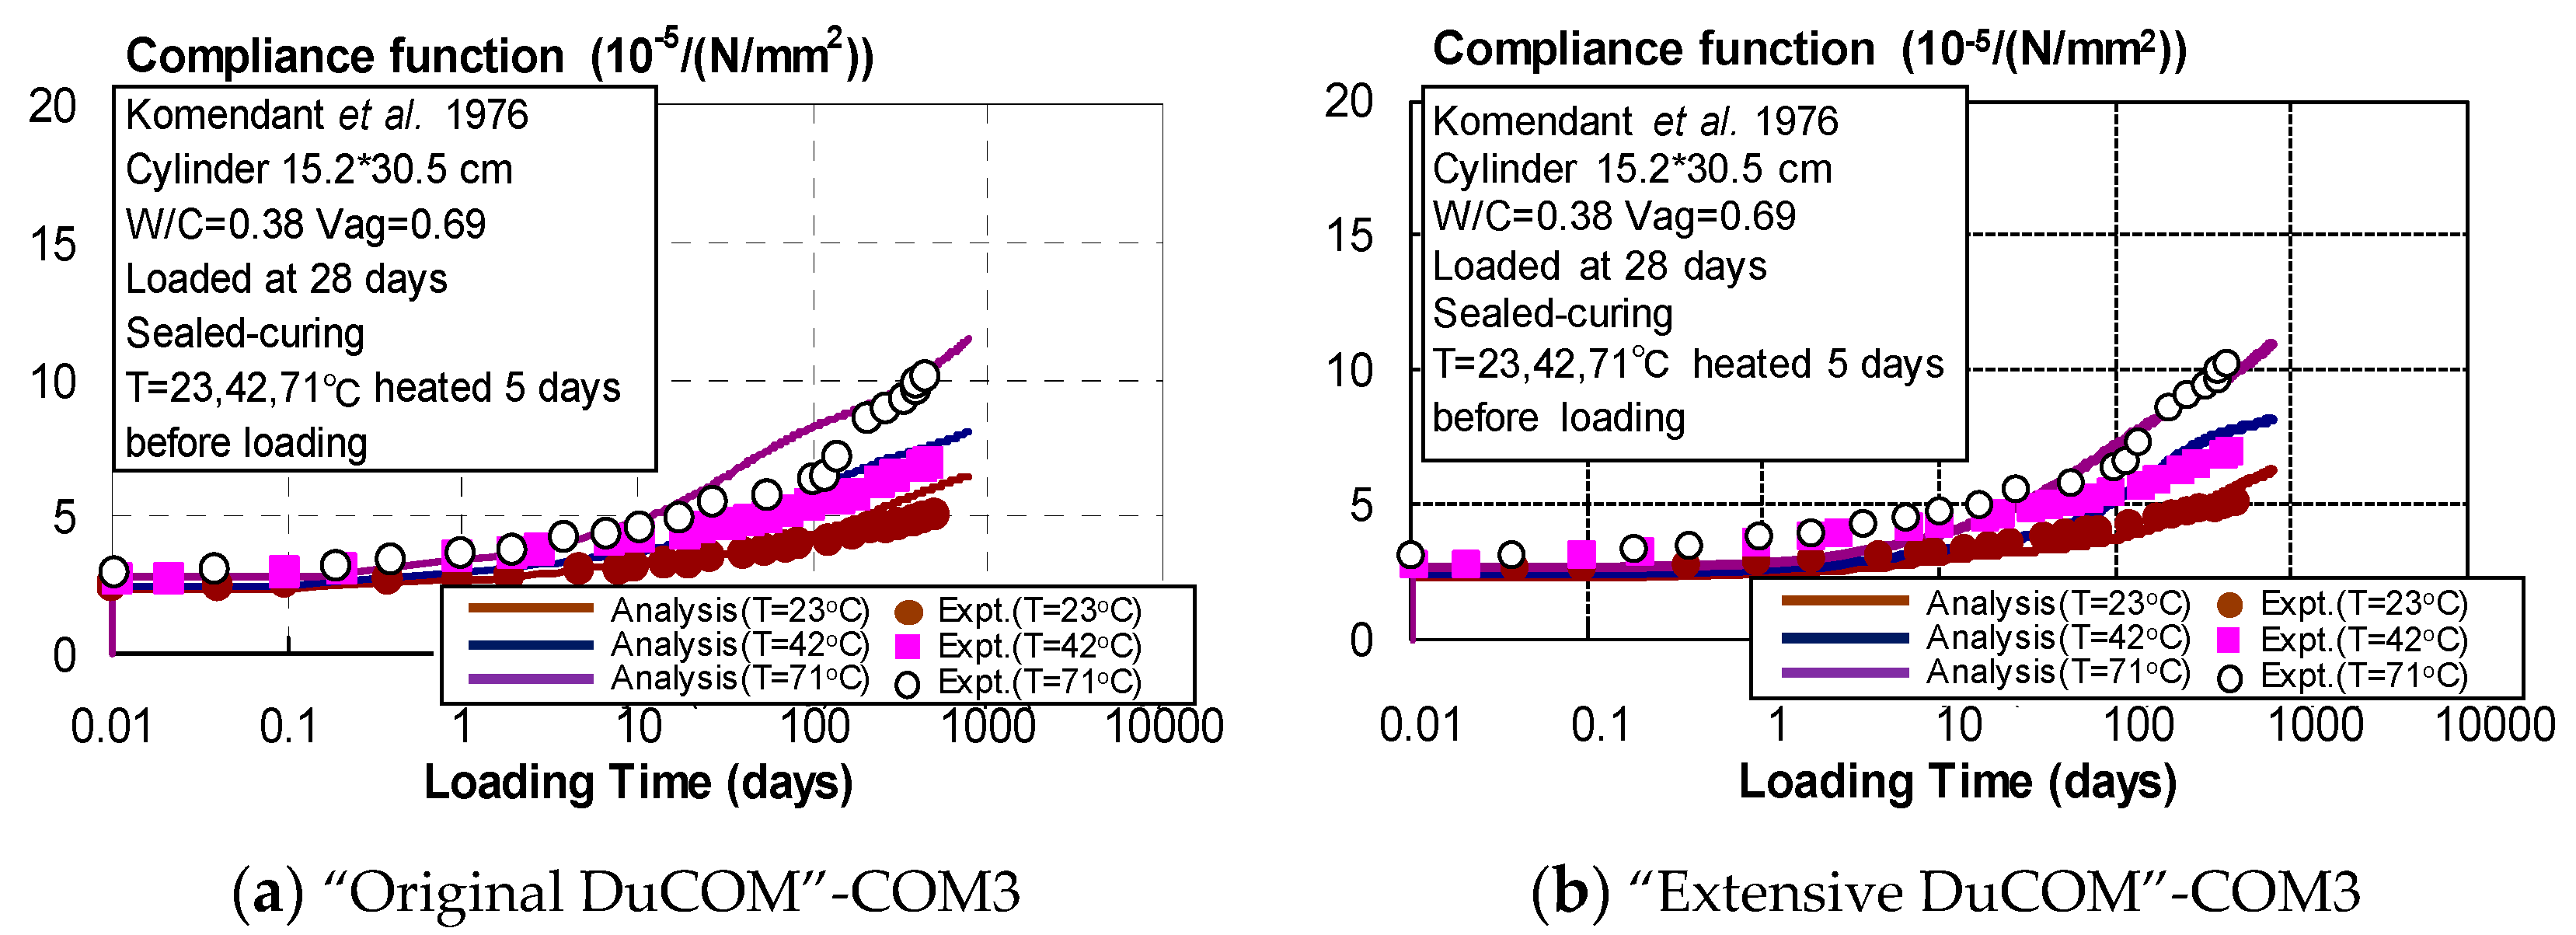
Figure 26 shows the comparative results of drying creep under different relative humidities at 20 °C between the past experiment [31] and the analysis by using (a) “Original DuCOM”-COM3 or (b) “Extensive DuCOM”-COM3. Both (a) and (b) analyses provided good results to simulate the long-term experiments regardless of the relative humidity. As the W/C of the experiment corresponds to 49%, the reduction factor wred in the extensive model keeps 1.0 during the loading time, leading to similar results except for the influence of the modification of the original multicomponent hydration model (Figure 5, Part A). Similarly, Figure 27 shows the comparative results of basic creep under different temperatures without drying [32]. It was confirmed that the analysis (b) shows better agreement than (a), specifically in the case of T = 71 °C. This seems to be caused by the higher saturation degree of gel pores in (b), resulting from stagnation of hydration with the extensive modeling for a low W/C mixture. The higher the environmental temperature, the more remarkably the stagnation effect appears, leading to mitigation of basic creep. Consequently, the large discrepancy in (a) which was seen at higher temperature is greatly improved in (b).
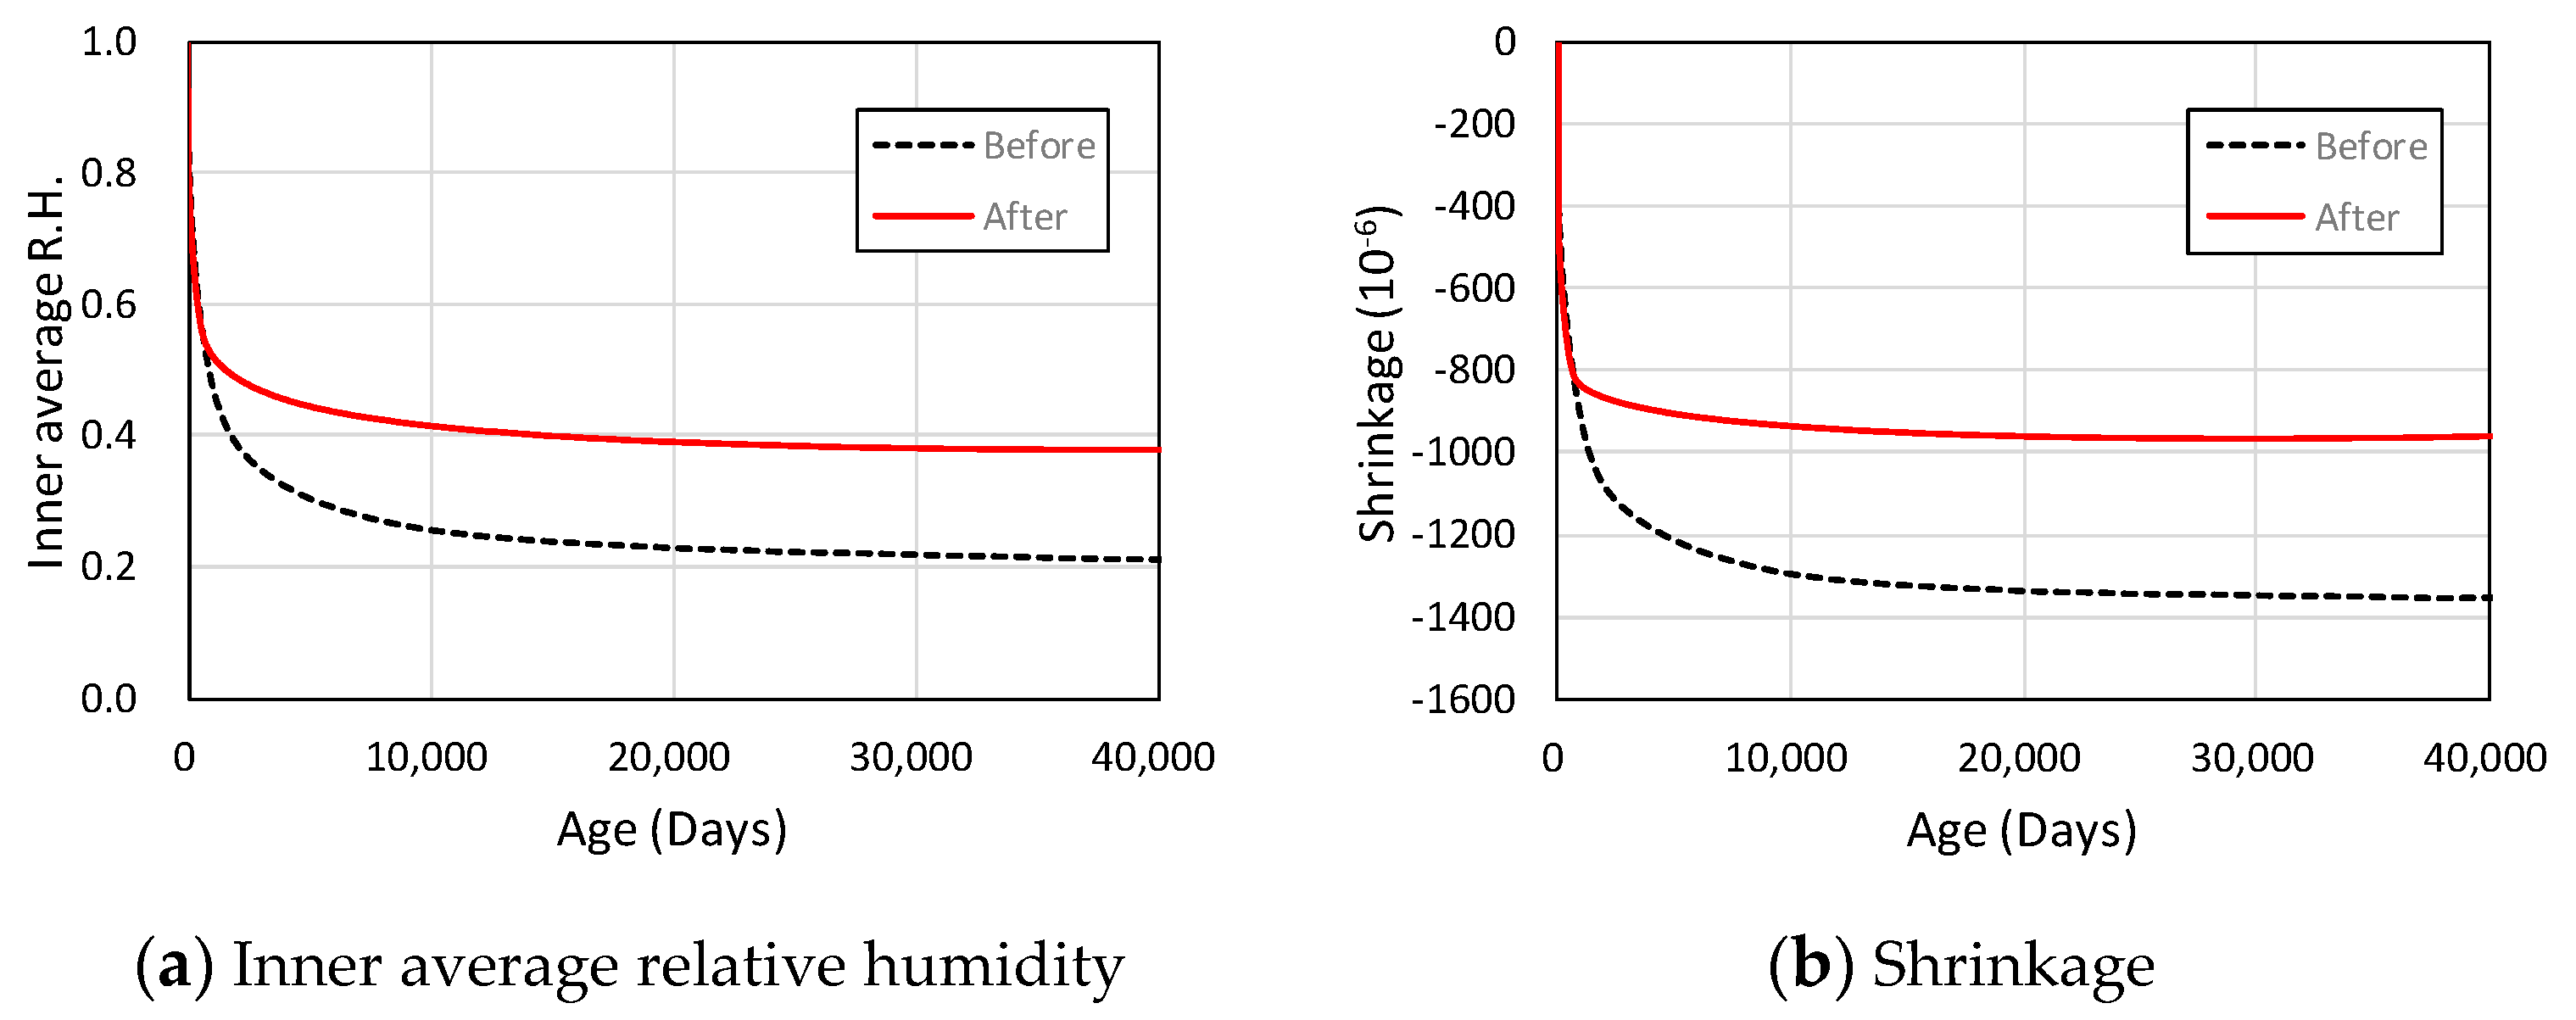
In addition, assuming application of the extensive model to a practical mass concrete structure, predictive simulations over 100 years were conducted before and after the extensive modeling. It was assumed in the analysis that the mixture is the same as Reference [27], OPC, W/C = 30% and the boundary condition is continuously sealed at 20 °C just after casting. The comparative results are presented in Figure 28. In the case of the extensive model, the reduction factor wred begins to work at the 1.5-year age (about 550 days) and after that excessive hydration in the fine micro-pore structures is mitigated. As a result, it was suggested that the differences of the inner average relative humidity and the shrinkage between before and after the extensive modeling are 20% and 400μ, respectively, at the 100-year age. Of course, this validity should be checked in the future due to scarcity of monitoring data currently available on practical low W/C structures with a long history. Anyway, the effect considering the peculiar hydration in fine micro-pore structures into the integrated analysis affects internal stress and volumetric changes driven by shrinkage, inducing fractures. Subsequently, the fractures are undertaken in COM3 and their propagated damages due to external mechanical actions are sent back to DuCOM for the next step. In this way, long-term behavior prediction of a practical large-scale structure to which a low W/C mixture is applied can be expected to influence greatly and the practical benefit of this study is demonstrated in a unified approach.
5. Conclusions
This study aims at enhancing integrated multiscale thermodynamic analysis by reflecting a benefit obtained by recent technical evolutions, which were not available when the original model was formerly verified, and further extending the model to resolve concerns recently identified in the case of a low W/C mixture in a specific condition.
The conclusions achieved in this study are summarized as follows:
- Through the reverification study of the original multicomponent hydration model for hydration degrees of cement clinkers in addition to adiabatic mass temperature rises, the modified model agreed well with the related experimental results, providing the resolution of remarkable discrepancy observed especially in hydration degree of C2S.
- The peculiar hydration tendency which appears in a low W/C mixture under long-term normal or high temperature curing could be traced well by the extensive modeling proposed for continuous hydration considering spatial condensed water in fine micro-pore structures.
- As a result of the evaluation of time-dependent deformation for a long time by the integrated analysis coupling the extensive DuCOM with COM3, both drying and basic creep under different temperatures displayed good agreement between the experiments and the analyses.
- These achievements demonstrated the validity of this study and the beneficial possibility of application to various in situ conditions in a unified approach.
Author Contributions
Conceptualization, K.K. and T.I.; Formal analysis, K.K.; Investigation, K.K.; Methodology, K.K.; Supervision, T.I.; Validation, T.I.; Writing—original draft, K.K.; Writing—review and editing, T.I.
Funding
This research received no external funding.
Conflicts of Interest
The authors declare no conflict of interest.
References
- Maekawa, K.; Ishida, T.; Kishi, T. Multi-Scale Modeling of Structural Concrete; Taylor & Francis: New York, NY, USA, 2009; ISBN 978-0-415-46554-0. [Google Scholar]
- Maekawa, K.; Chaube, R.P.; Kishi, T. Modeling of Concrete Performance; E&FN Spon: London, UK, 1999; ISBN 978-0-419-24200-0. [Google Scholar]
- Maekawa, K.; Pimanmas, A.; Okamura, H. Nonlinear Mechanics of Reinforced Concrete; Spon Press: London, UK, 2003; ISBN 978-0-415-27126-4. [Google Scholar]
- Maekawa, K.; Ishida, T.; Kishi, T. Multi-scale modeling of concrete performance: Integrated material and structural mechanics. J. Adv. Concr. Technol. 2003, 1, 91–126. [Google Scholar] [CrossRef]
- Bazant, Z.P.; Prasannan, S. Solidification theory for concrete Creep I Formation II: Verification and application. J. Eng. Mech. ASCE 1989, 115, 1691–1725. [Google Scholar] [CrossRef]
- Ishida, T.; Pen, K.; Tanaka, Y.; Kashimura, K.; Iwaki, I. Numerical simulation of early age cracking of reinforced concrete bridge decks with a full-3D multiscale and multi-chemo-physical integrated analysis. Appl. Sci. 2018, 8, 394. [Google Scholar] [CrossRef]
- Maekawa, K.; Chijiwa, N.; Ishida, T. Long-term deformational simulation of PC bridges based on the thermo-hydro model of micro-pores in cementitious composites. Cem. Concr. Res. 2011, 41, 1310–1319. [Google Scholar] [CrossRef]
- Ohno, M.; Chijiwa, N.; Suryanto, B.; Maekawa, K. An investigation into the long-term excessive deflection of PC viaducts by using 3D multi-scale integrated analysis. J. Adv. Concr. Technol. 2012, 10, 47–58. [Google Scholar] [CrossRef]
- Tanaka, Y.; Ishida, T.; Iwaki, I.; Sato, K. Multiple protection design for durable concrete bridge deck in cold regions. J. JSCE 2017, 5, 68–77. [Google Scholar] [CrossRef]
- Kishi, T.; Maekawa, K. Multi-component model for hydration heat of Portland cement. J. JSCE 1995, 29, 99–109. [Google Scholar]
- Kishi, T.; Maekawa, K. Multi-component model for hydration heat of blended cement with blast slag and fly ash. J. JSCE 1996, 33, 131–143. [Google Scholar]
- Walenta, G.; Fullmann, T.; Gimenez, M. Quantitative Rietveld analysis of cement and clinker. Int. Cem. Rev. 2001, 30, 51–54. [Google Scholar]
- Scrivener, K.L.; Fullmann, T.; Gallucci, E.; Walenta, G.; Bermejo, E. Quantitative study of Portland cement hydration by X-ray diffraction/Rietveld analysis and independent methods. Cem. Concr. Res. 2004, 34, 1541–1547. [Google Scholar] [CrossRef]
- Ishida, T.; Wang, T. Future of multiscale modelling of concrete—Toward a full integration of cement chemistry and concrete structural engineering. RILEM Tech. Lett. 2018, 3, 17–24. [Google Scholar] [CrossRef]
- Odler, I.; Schuppstuhl, J. Combined hydration of tricalcium silicate and β-dicalcium silicate. Cem. Concr. Res 1982, 12, 13–20. [Google Scholar] [CrossRef]
- Sugiyama, H.; Masuda, Y. The effect of high-temperature curing in early ages on the hydration of cement and the formation of microstructure. Cem. Sci. Concr. Technol. 2000, 9, 638–645. [Google Scholar]
- Hyeon, C. Basic Study on Thermal Stress Simulation of High-Strength Concrete and Mass Concrete. Ph.D. Thesis, University of Tokyo, Tokyo, Japan, 1995. [Google Scholar]
- Sagawa, T.; Katsura, O.; Sekiguchi, T.; Wakabayashi, S. Effect of water to cement ratio and curing condition on hydration of Portland cement compounds. Cem. Sci. Concr. Technol. 2004, 58, 23–30. [Google Scholar]
- Maruyama, I.; Matsushita, T.; Noguchi, T.; Hosokawa, Y.; Yamada, K. Rate of hydration of Alite and Belite in Portland cement—Hydration system of Portland cement Part, I. J. Struct. Constr. Eng. 2010, 75, 681–688. [Google Scholar] [CrossRef]
- Maruyama, I.; Igarashi, G. Cement reaction and resultant physical properties of cement paste. J. Adv. Concr. Technol. 2014, 12, 200–213. [Google Scholar] [CrossRef]
- Otabe, Y. Normalization of the Multi-Component Hydration Model and Development of Growth of Compressive Strength Model Focusing on Formulation of Hydrated Microstructures. Ph.D. Thesis, University of Tokyo, Tokyo, Japan, 2005. [Google Scholar]
- Kinomura, K. Long-Term Physical Property Changes of Hardened Cementitious Materials Induced by Loading History of Temperature and Moisture and Enhanced Modeling between Hydration and Water Equilibrium in Fine-Micro Structures. Ph.D. Thesis, University of Tokyo, Tokyo, Japan, 2018. [Google Scholar]
- Japan Cement Association. A Study on the Adiabatic Temperature Rise of Concrete Using Various Cements; Report of the Technical Committee on Concrete; Japan Cement Association: Tokyo, Japan, 2014. [Google Scholar]
- Ishida, T.; Maekawa, K.; Kishi, T. Enhanced modeling of moisture equilibrium and transport in cementitious materials under arbitrary temperature and relative humidity history. Cem. Concr. Res. 2007, 37, 565–578. [Google Scholar] [CrossRef]
- Nakarai, K.; Ishida, T.; Kishi, T.; Maekawa, K. Enhanced thermodynamics analysis coupled with temperature-dependent microstructures of cement hydrates. J. JSCE 2005, 69, 61–78. [Google Scholar] [CrossRef]
- Hillerborg, A. A modified adsorption theory. Cem. Concr. Res. 1985, 15, 809–816. [Google Scholar] [CrossRef]
- Kinomura, K.; Ishida, T. Effect on some properties of mortar including fly-ash due to high temperature condition after long age. Cem. Sci. Concr. Technol. 2017, 71, 161–168. [Google Scholar] [CrossRef]
- Asamoto, S. Enhanced Multi-Scale Constitutive Model of Solidifying Cementitious Composites and Application to Cracking Assessment of Concrete Structures. Ph.D. Thesis, University of Tokyo, Tokyo, Japan, 2006. [Google Scholar]
- Cano-Barrita, P.F.d.J.; Balcom, B.J.; Bremner, T.W.; MacMillan, M.B.; Langley, W.S. Moisture distribution in drying ordinary and high performance concrete cured in a simulated hot dry climate. Mater. Struct. 2004, 37, 522–531. [Google Scholar] [CrossRef]
- Kamada, T. Comprehensive Study on Stagnation Phenomenon and its Dominant Mechanism of Salt Penetration into Concrete. Ph.D. Thesis, University of Tokyo, Tokyo, Japan, 2017. [Google Scholar]
- L’Hermite, R.G.; Mamillan, M.; Lefeve, C. Nouveau resultants de ercherches sur la deformation et la rupture du beton. Ann. Inst. Techn. Batiment Trav. Publics 1965, 207–208, 323–360. [Google Scholar]
- Kommendant, G.J.; Polivka, M.; Pirtz, D. Study of Concrete Properties for Prestressed Concrete Reactor Vessels; Final Report No. UCSESM 76-3 (to General Atomic Company); Department Civil Engineering, University of California Berkeley: Berkeley, CA, USA, 1976. [Google Scholar]
Figure 1.
Scheme of the integrated multi-scale analysis system, Durability of Concrete Model (DuCOM)-COM3.
Figure 1.
Scheme of the integrated multi-scale analysis system, Durability of Concrete Model (DuCOM)-COM3.

Figure 2.
Target of this study in DuCOM-COM3.

Figure 3.
Comparison of compressive strength and weight loss. (Dot: experiment, Solid/chain line: analysis).
Figure 3.
Comparison of compressive strength and weight loss. (Dot: experiment, Solid/chain line: analysis).

Figure 4.
Numerical histories along the specific environmental condition as shown in Figure 2.
Figure 4.
Numerical histories along the specific environmental condition as shown in Figure 2.

Figure 5.
Configuration of this study.

Figure 6.
Comparison of degree of hydration among different curing temperatures based on the original model (OPC, W/C = 50%) [18].
Figure 6.
Comparison of degree of hydration among different curing temperatures based on the original model (OPC, W/C = 50%) [18].

Figure 7.
Comparison of degree of hydration among different cement types based on the original model (W/C40%, Seal-cured at 20 °C) [20].
Figure 7.
Comparison of degree of hydration among different cement types based on the original model (W/C40%, Seal-cured at 20 °C) [20].

Figure 8.
Procedure of the repetitive modification study.

Figure 9.
Modified settings of the reference heat rate and thermal activity.

Figure 10.
Modification factors of the heat generation rate for C3S and C2S.

Figure 11.
Comparison of degree of hydration among different curing temperatures based on the modified model (OPC, W/C = 50%) [18].
Figure 11.
Comparison of degree of hydration among different curing temperatures based on the modified model (OPC, W/C = 50%) [18].

Figure 12.
Comparison of degree of hydration among different cement types based on the modified model (W/C40%, Seal-cured at 20 °C) [20].
Figure 12.
Comparison of degree of hydration among different cement types based on the modified model (W/C40%, Seal-cured at 20 °C) [20].

Figure 13.
Comparison of adiabatic mass temperature rises based on the modified model [23].
Figure 13.
Comparison of adiabatic mass temperature rises based on the modified model [23].

Figure 14.
Enhanced moisture isotherm model considering the time-dependent dispersion of ink-bottle water [1,24].

Figure 15.
Enhanced moisture isotherm model of interlayer water under different temperature conditions [1,24].

Figure 16.
Comparison of compressive strength and weight loss based on the modified model (W/C = 30%) [27]. (Dot: experiment, Solid/chain line: analysis).
Figure 16.
Comparison of compressive strength and weight loss based on the modified model (W/C = 30%) [27]. (Dot: experiment, Solid/chain line: analysis).

Figure 17.
Comparison of weight loss based on the modified model (W/C = 35%, 55%) [28].
Figure 17.
Comparison of weight loss based on the modified model (W/C = 35%, 55%) [28].

Figure 18.
Comparison of weight loss based on the modified model (W/C = 60%) [29].
Figure 18.
Comparison of weight loss based on the modified model (W/C = 60%) [29].

Figure 19.
Numerical history of each porosity and saturation degree of capillary, gel and interlayer pores in the case of Figure 16d.
Figure 19.
Numerical history of each porosity and saturation degree of capillary, gel and interlayer pores in the case of Figure 16d.

Figure 20.
Schematic view of fine micro-pore structure resulting from dense precipitation of hydration products in open spaces.
Figure 20.
Schematic view of fine micro-pore structure resulting from dense precipitation of hydration products in open spaces.

Figure 21.
Modeling scheme on redistribution of trapped “ink-bottle” water and increase in relative humidity at high temperature [24].
Figure 21.
Modeling scheme on redistribution of trapped “ink-bottle” water and increase in relative humidity at high temperature [24].

Figure 22.
Relationship between the porosity ratio of capillary to gel, Ψ and the reduction factor against the amount of free water, wred.
Figure 22.
Relationship between the porosity ratio of capillary to gel, Ψ and the reduction factor against the amount of free water, wred.

Figure 23.
Comparison of compressive strength and weight loss based on the extensive model (W/C = 30%) [27]. (Dot: experiment, Solid/chain line: analysis).
Figure 23.
Comparison of compressive strength and weight loss based on the extensive model (W/C = 30%) [27]. (Dot: experiment, Solid/chain line: analysis).

Figure 24.
Comparison of weight loss based on the extensive model (W/C = 35%, 55%) [28].
Figure 24.
Comparison of weight loss based on the extensive model (W/C = 35%, 55%) [28].

Figure 25.
Comparison of weight loss based on the extensive model (W/C = 60%) [29].
Figure 25.
Comparison of weight loss based on the extensive model (W/C = 60%) [29].

Figure 26.
Comparison of drying creep under different relative humidity at 20 °C [31].
Figure 26.
Comparison of drying creep under different relative humidity at 20 °C [31].

Figure 27.
Comparison of basic creep under different temperatures without drying [32].
Figure 27.
Comparison of basic creep under different temperatures without drying [32].

Figure 28.
Comparison of inner average relative humidity and shrinkage between before and after the extensive modeling (W/C = 30%, OPC).
Figure 28.
Comparison of inner average relative humidity and shrinkage between before and after the extensive modeling (W/C = 30%, OPC).


Table 1.
Experimental conditions in the past studies using various types of portland cement.
| Curing Condition | Type of Cement (W/C) | Blane Value [cm2/g] | Measurement of Hydration Degree | Evaluation Method | Reference |
|---|---|---|---|---|---|
| Sealing at 10, 20, 30 °C | HPC 1) | 5123 | C3S | X-ray diffraction (XRD)/internal standard method | Hyeon [17] |
| OPC 2) | 4227 | C2S | |||
| MPC 3) | 4346 | C3A | |||
| High Belite (50%) | 4530 | C4AF | |||
| Water curing at 3, 20, 35, 50 °C after sealing for 2 days at 20 °C | OPC 2) (50%, 40%, 30%) | 3190 | C3S C2S C3A * C4AF * | XRD/Rietveld | Sagawa [18] |
| Sealing at 10, 20, 40 °C | OPC 2) | 3300 | C3S | XRD/Rietveld | Maruyama [19] |
| LPC 4) (55%, 35%) | 3430 | C2S | |||
| Sealing at 20 °C | OPC 2) | 3160 | C3S C2S | XRD/Rietveld | Maruyama [20] |
| MPC 3) | 3210 | ||||
| LPC 4) (55%, 40%) | 3400 |
* Measured only in the case of W/C = 50%. 1) High early strength Portland Cement; 2) Ordinary Portland Cement; 3) Moderate heat Portland Cement; 4) Low heat Portland Cement.
Table 2.
Mineral composition and physical property of the cement used in the adiabatic mass temperature rise tests [23].
Table 2.
Mineral composition and physical property of the cement used in the adiabatic mass temperature rise tests [23].
| Type of Cement | Density [g/cm3] | Blane Value [cm2/g] | Mineral Composition [%] | |||
|---|---|---|---|---|---|---|
| C3S | C2S | C3A | C4AF | |||
| OPC (N) | 3.15 | 3260 | 59.4 | 13.9 | 9.6 | 9.0 |
Table 3.
Details of the mixtures and the experimental conditions in the adiabatic mass temperature rise tests [23].
Table 3.
Details of the mixtures and the experimental conditions in the adiabatic mass temperature rise tests [23].
| Type of Cement | Casting Temp. [°C] | W/C [%] | Unit Weight (kg/m3) | Chemical Admixture [C×%] | Air Content [%] | |||
|---|---|---|---|---|---|---|---|---|
| Water | Cement | Sand | Aggregate | |||||
| OPC (N) | 20 | 57.1 | 160 | 280 | 870 | 1005 | 0.25 | 5.3 |
| 10 | 47.1 | 160 | 340 | 847 | 978 | 0.25 | 4.0 | |
| 20 | 5.5 | |||||||
| 30 | 6.0 | |||||||
| 20 | 40.0 | 160 | 400 | 823 | 951 | 0.25 | 5.2 | |
Table 4.
Experimental conditions in the past studies.
| Verification Target | Type of Specimen W/C | Curing Condition | Reference |
|---|---|---|---|
| Compressive strength Weight loss | Mortar 30% | Exposure to a given environment after sealing at 20 °C for a given age as shown in Figure 16 | Kinomura [27] |
| Weight loss | Mortar 35%, 55% | Sealing at 20 °C for 1 day, water curing at 20 °C for 60 days, and then exposure to 20 °C in R.H. 70% | Asamoto [28] |
| Weight loss | Concrete 60% |
| Cano [29] |
© 2019 by the authors. Licensee MDPI, Basel, Switzerland. This article is an open access article distributed under the terms and conditions of the Creative Commons Attribution (CC BY) license (http://creativecommons.org/licenses/by/4.0/).
Share and Cite
MDPI and ACS Style
Kinomura, K.; Ishida, T. Extensive Modeling of Peculiar Hydration in Fine Micro-Pore Structures Applicable to Integrated Thermodynamic Analysis for Portland Cement. Appl. Sci. 2019, 9, 2137. https://doi.org/10.3390/app9102137
AMA Style
Kinomura K, Ishida T. Extensive Modeling of Peculiar Hydration in Fine Micro-Pore Structures Applicable to Integrated Thermodynamic Analysis for Portland Cement. Applied Sciences. 2019; 9(10):2137. https://doi.org/10.3390/app9102137
Chicago/Turabian StyleKinomura, Koji, and Tetsuya Ishida. 2019. "Extensive Modeling of Peculiar Hydration in Fine Micro-Pore Structures Applicable to Integrated Thermodynamic Analysis for Portland Cement" Applied Sciences 9, no. 10: 2137. https://doi.org/10.3390/app9102137
Note that from the first issue of 2016, this journal uses article numbers instead of page numbers. See further details here.