Bond Fatigue of TRC with Epoxy Impregnated Carbon Textiles


Institute of Concrete Structures, 01062 TU Dresden, Germany
*
Author to whom correspondence should be addressed.
Appl. Sci. 2019, 9(10), 1980; https://doi.org/10.3390/app9101980
Submission received: 29 March 2019
/
Revised: 29 April 2019
/
Accepted: 8 May 2019
/
Published: 15 May 2019
(This article belongs to the Special Issue Textile Reinforced Cement Composites: New Insights in Structural and Material Engineering)
Abstract
:For the economical construction of fatigue loaded structures with textile reinforced concrete (TRC), it is necessary to investigate the fatigue behavior of the materials. Since next to the tensile load-bearing behavior, the bond behavior of a material is crucial as well, the present paper deals with the bond fatigue of TRC with epoxy-impregnated carbon textiles. First, static tests are carried out to determine the sufficient anchorage length of the investigated material combination. Afterwards, the influence of cyclic loading on the necessary anchorage length, deformation, stiffness, and residual strength is investigated. The results of the cyclic tests are summarized in stress-number of cycles to failure (S-N) diagrams. In the end, it can be said that the cyclic loading has no negative impact on the necessary anchorage length. If specimens withstand the cyclic loading, there is no difference between their residual strength and the reference strength. The failure of specimens occurs only at high load levels, provided that the anchorage length is sufficient.
1. Introduction
Textile reinforced concrete (TRC) has been under investigation for about two decades now. During this time, it was used—among other applications—for the construction of several bridges, e.g., [1,2,3,4,5,6,7,8,9]. Whilst the pedestrian bridges were built without prior separate fatigue investigations, the fatigue resistance of the road bridges was tested in the laboratory on true scaled structures. However, it would be uneconomical to perform a fatigue test on an entire structure every time. Therefore, it is necessary to have a closer look at the fatigue behavior of textile reinforced concrete. This is among other things the objective of the research projects C3-V1.2 and C3-V2.1, belonging to the research program C3–Carbon Concrete Composite [10].
Currently, there are already some investigations on the tensile fatigue behavior of TRC. In [11,12,13,14], tensile fatigue tests with different carbon textiles were carried out, and in [15], the tensile fatigue behavior of an alkali-resistant glass textile was investigated. Since the high tensile strength of technical textiles is only advantageous when the occurring forces can be transmitted from the concrete to the textile, the bond behavior of TRC should not be ignored. As the authors don’t know any research concerning the topic of bond fatigue of TRC, our own investigations were carried out and are presented in this paper.
For the investigation of bond fatigue, a suitable test setup was developed [16]. Whilst here flexible carbon textiles with a styrene-butadiene impregnation were tested, the applicability of the test setup also for stiff carbon textiles with an epoxy impregnation was proved in [17]. On the basis of this research, more precise investigations on the influence of load level and anchorage length on deformation, stiffness, and number of cycles to failure were done. The results are presented in the following sections.
2. Materials and Methods
2.1. Materials
The investigations were made with a material combination that is usually used for newly built structures out of TRC. As reinforcement, a stiff carbon textile impregnated with epoxy resin was used and embedded in a high-strength concrete. Figure 1 shows the biaxial textile (solidian GRID Q95/95-CCE-38) from solidian GmbH with a 38-mm axial fibre strand distance in both directions [18]. More information about the textile is shown in Table A1 in Appendix A.
The related high-strength concrete (HF-2-145-5) was specially developed for use in TRC [19]. The maximum grain size was 5 mm, and was realized by grit instead of gravel. Further information on the composition can be found in Table A2. The average compressive strength and flexural strength of tested specimens at the age of 28 days was 127 N/mm2 and 12 N/mm2, respectively. The values were determined on three prisms (40 × 40 × 160 mm) according to [20].
2.2. Samples
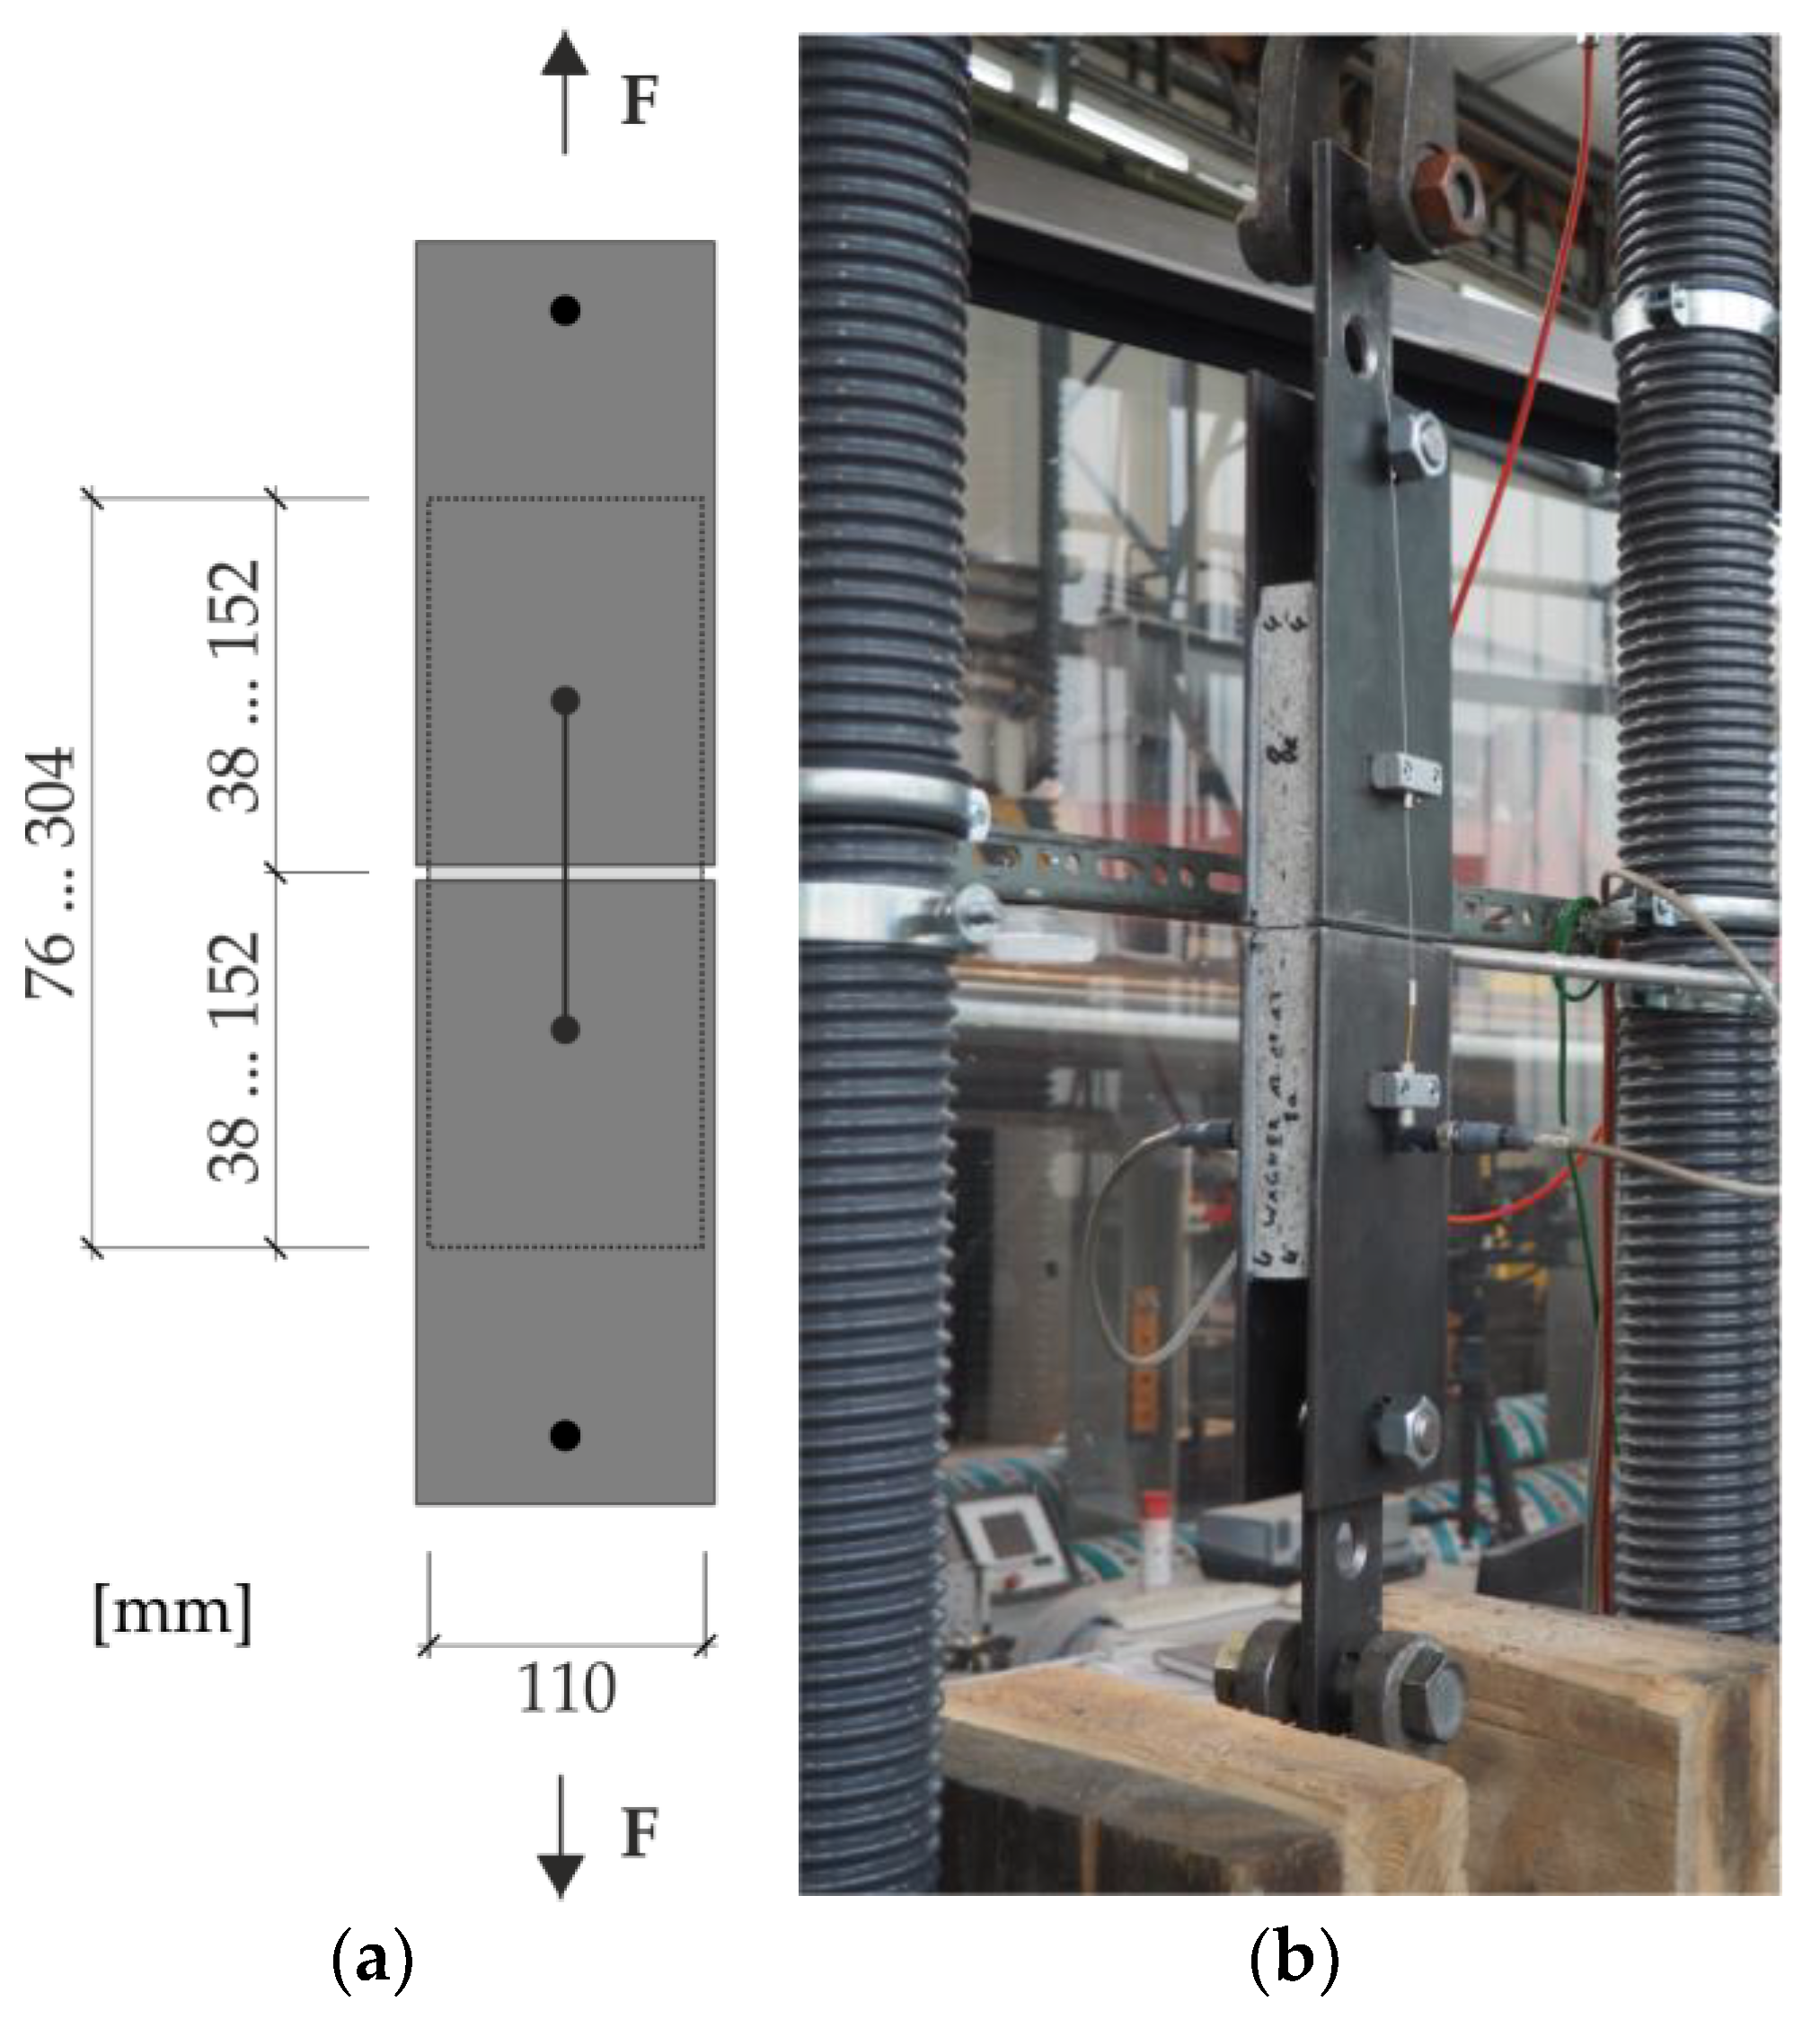
As no standard for TRC exists yet, the geometry of the specimens was chosen according to testing recommendations for TRC [21], which were created in a previous research project of the research programme C3. The specimens were 110 mm wide and 30 mm thick. The anchorage length was varied, so that the specimens had lengths between 76–304 mm. The samples were centrally reinforced with one textile layer with three fiber strands in the longitudinal direction.
They were manufactured in coated timber formworks (Figure 2a). First, huge concrete panels with a size of 990 mm × 380 mm × 30 mm were casted. During the casting process, the textile was clamped at two sides to fix it in its position. After casting, the panels were left in the formwork for one day covered with foil. Afterwards, they were stored in water until the seventh day after casting. From here until testing, they were stored in a climate chamber at a temperature of 20 °C and 65% relative humidity. Before the testing, at a minimum age of 28 days, the specimens were sawed out of the panels (Figure 2b).
2.3. Test Setup
The test setup for the investigation of the bond bearing behavior of the chosen material combination is known as the ‘double-sided textile pull-out (DPO) test’ (Figure 3a). Initially, the test was developed at RWTH Aachen University, e.g., [22], for the determination of the needed anchorage length. Stuck steel plates define the investigated anchorage length on both ends of the specimen. A small gap between the steel plates works as a predetermined breaking point in the middle of the specimen. By pulling the steel plates apart, tension is initiated in the specimen and hence in the textile as well. If the textile ruptures, the chosen anchorage length was long enough to transfer the complete tensile load. If bond failure occurs and the textile, e.g., pulls out, the anchorage length was too short. The applicability of the test setup for fatigue tests was investigated e.g., in [16].
The tests were carried out in a servo-hydraulic tension testing machine with accuracy class 1 and a load capacity of 100 kN for cyclic tests. During the tests, the machine force was recorded by a load cell. The deformation of the specimen at the predetermined breaking point was measured by two extensometers, which were fixed on the steel plates on both sides of the specimens. In the cyclic tests, the number of load cycles was recorded as well.
2.4. Load Regime and Experimental Program
In order to define the load levels of the cyclic tests, first the reference strength had to be determined. As in the cyclic tests, the influence of cyclic loading on the necessary anchorage length ought to be investigated. The static reference tests were done with different anchorage lengths as well, which were defined as a multiple of the fiber strand distance, a. There were four different anchorage lengths varying between 1a–4a. The minimum number of specimens per length was 10. The average value per length was set as the reference strength for the cyclic tests.
The load regime for the cyclic tests was the following. First, the specimen was loaded path-controlled up to a defined mean stress. Thereby, it was important that the crack in the middle of the specimen had completely developed. Afterwards, the cyclic loading was started, force-controlled with a sinusoidal oscillation and constant amplitude. The load frequency was 12 Hz. The maximum number of load cycles was set to 2 × 10⁶ to limit the duration of the test, and because this is a usual choice for cyclic tests with concrete or steel. Afterwards, runouts that withstood the cyclic loading were tested path-controlled until failure to determine their residual strength.
To reduce the amount of data, measurements, e.g., the force and deformation during the cyclic loading, were done in intervals. After a defined period of time, 800 measuring values were recorded with a measuring rate of 400 Hz. The duration of this period increased over the course of the cyclic testing: during the first load cycles, every measuring point was recorded, until approximately the 5000th load cycle, the period was 10 seconds; until 30,000 load cycles, it was three minutes, and afterwards, it was 15 min.
The experimental program is shown in Table 1. Per anchorage length, two different minimum stresses σmin were investigated with different related maximum stresses σmax. The load levels are specified as a percentage of the reference strength. As one of the goals of the research project C2-V2.1 is to create stress-number of cycles to failure (S-N) diagrams for TRC, load levels had to be chosen that lead to the failure of the specimens. Since preliminary tests showed that only high amplitudes cause failure, a maximum σmin of 50% was set. The second σmin of 30% was chosen as a compromise between the distance of the two investigated minimum stresses and the limit of the testing machine (regarding the combination of amplitude and frequency). The related maximum stress was increased after each test series, with the aim to force the failure of the specimens. Each test series contained four specimens. However, especially in test series with short anchorage lengths, some specimens failed already during the static loading up to the mean stress. So, these specimens could not be taken into account in the evaluation in the following section.
3. Results
3.1. Reference Tests
The results of the reference tests with different anchorage lengths are displayed in Figure 4. Here, one can see the reached maximum stress and the related measured anchorage length per specimen. Additionally, the average tensile strength (grey line) and the range of variation of this material combination (grey area) can be seen. These values were determined in tensile tests according to [23].
It is clearly visible that the maximum textile stress increases with increasing anchorage length. However, the increase stops at the anchorage length of 3a, and the specimens with 4a anchorage length reach nearly the same values as the ones with 3a. One may assume that an anchorage length of 3a is sufficient to transfer the maximally possible bond force of this material combination and that longer anchorage lengths do not lead to higher loads. None of the specimens failed due to textile rupture, but rather by spalling in the reinforcement layer. Therefore, the maximally reached values are lower than the tensile strength. However, the values are quite close to the range of variation of the tensile strength, and therefore, the results are considered acceptable for the moment.
3.2. Cyclic Stress–Strain Behavior
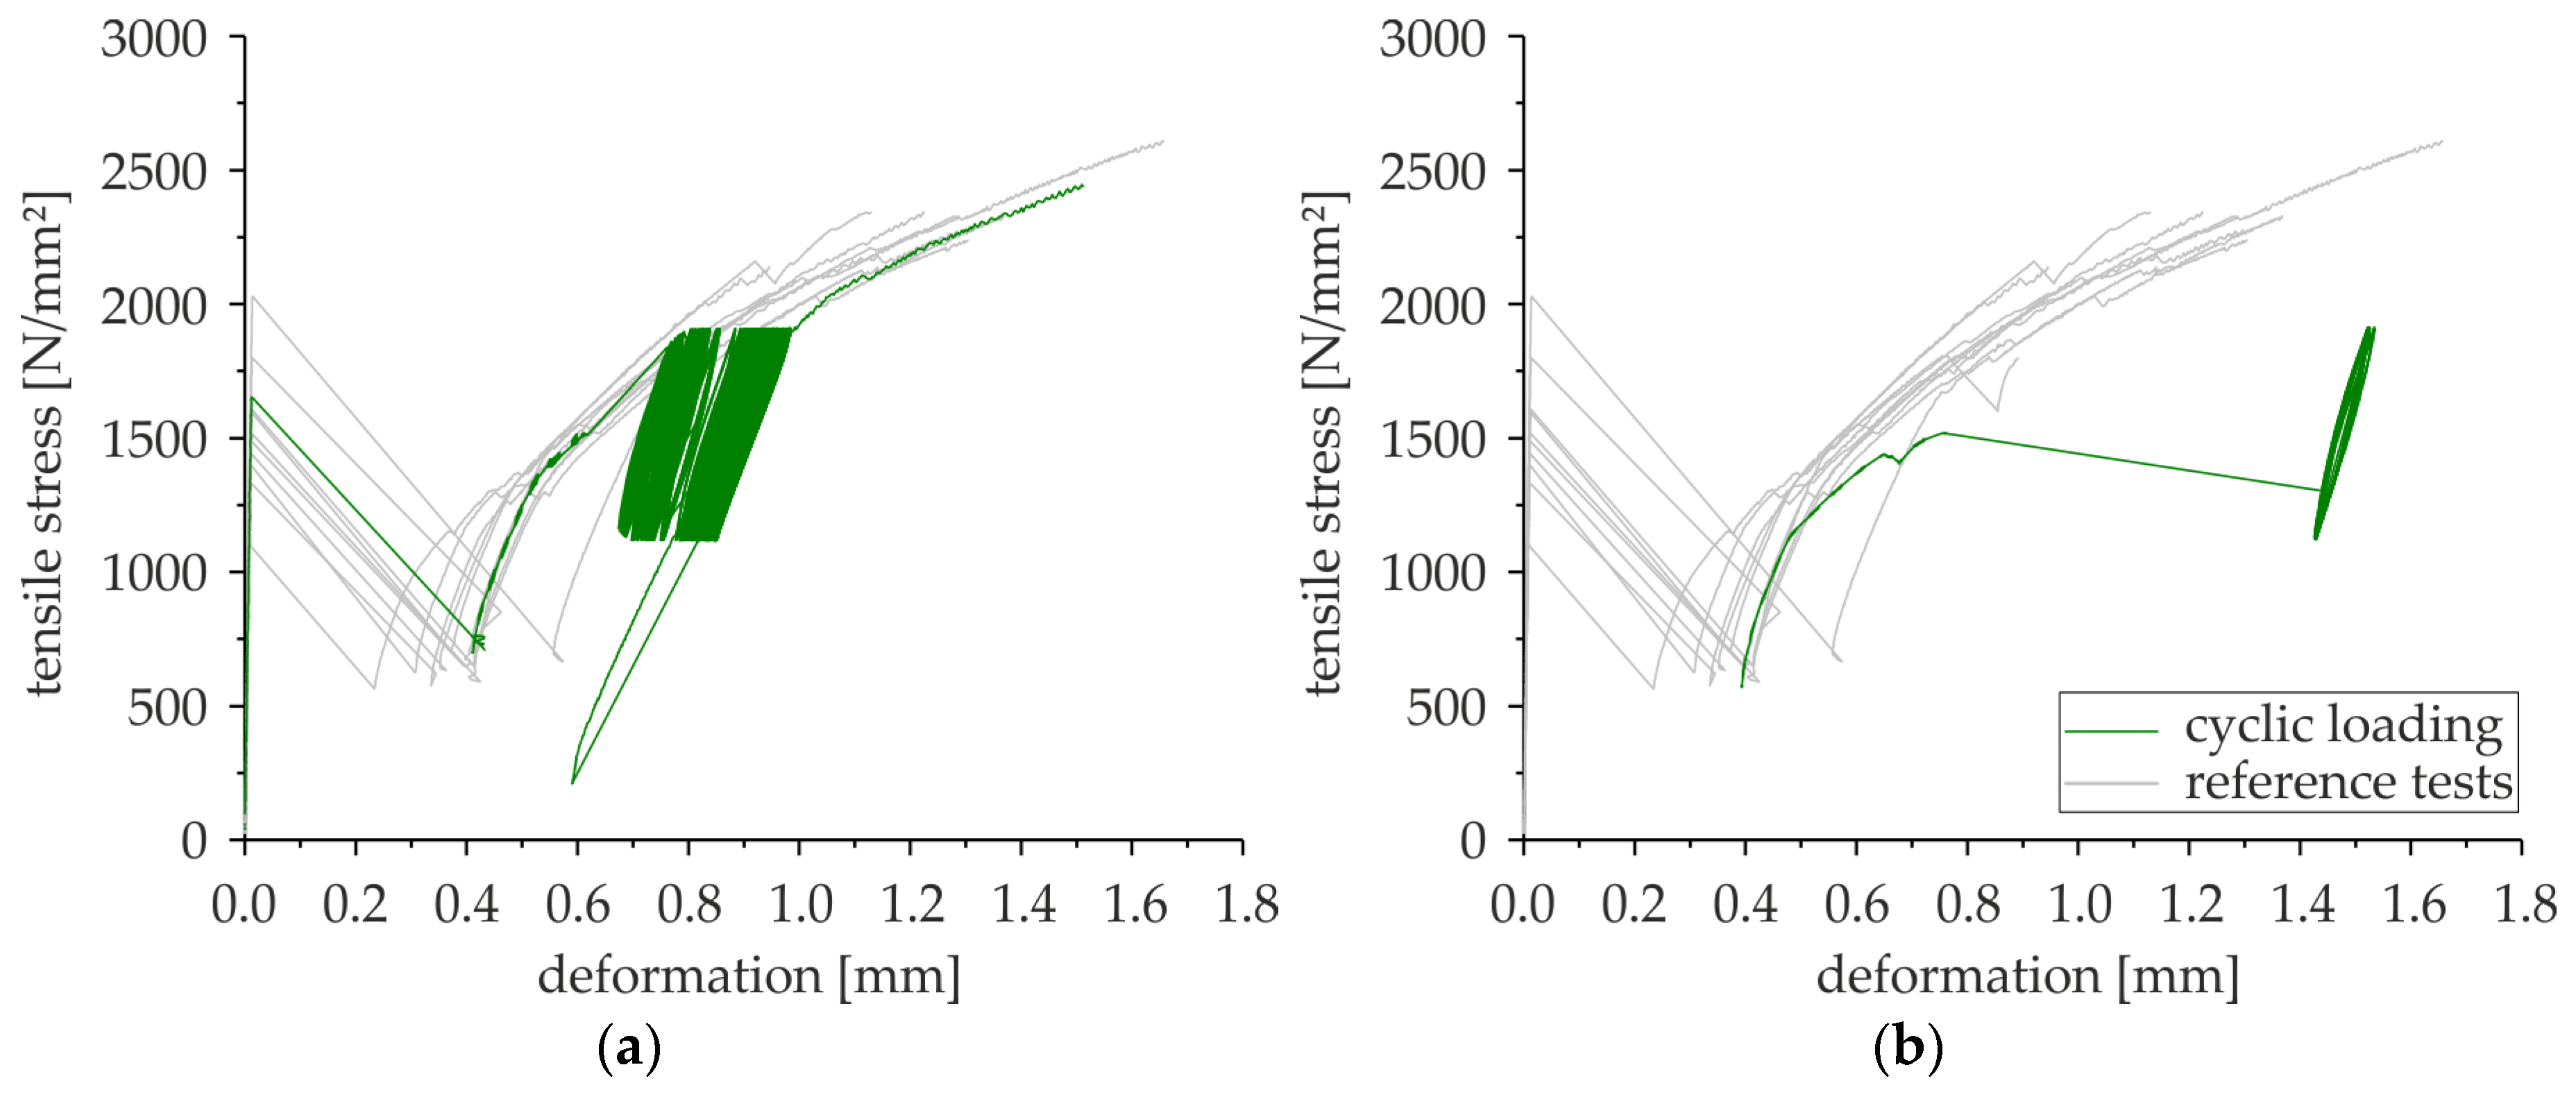
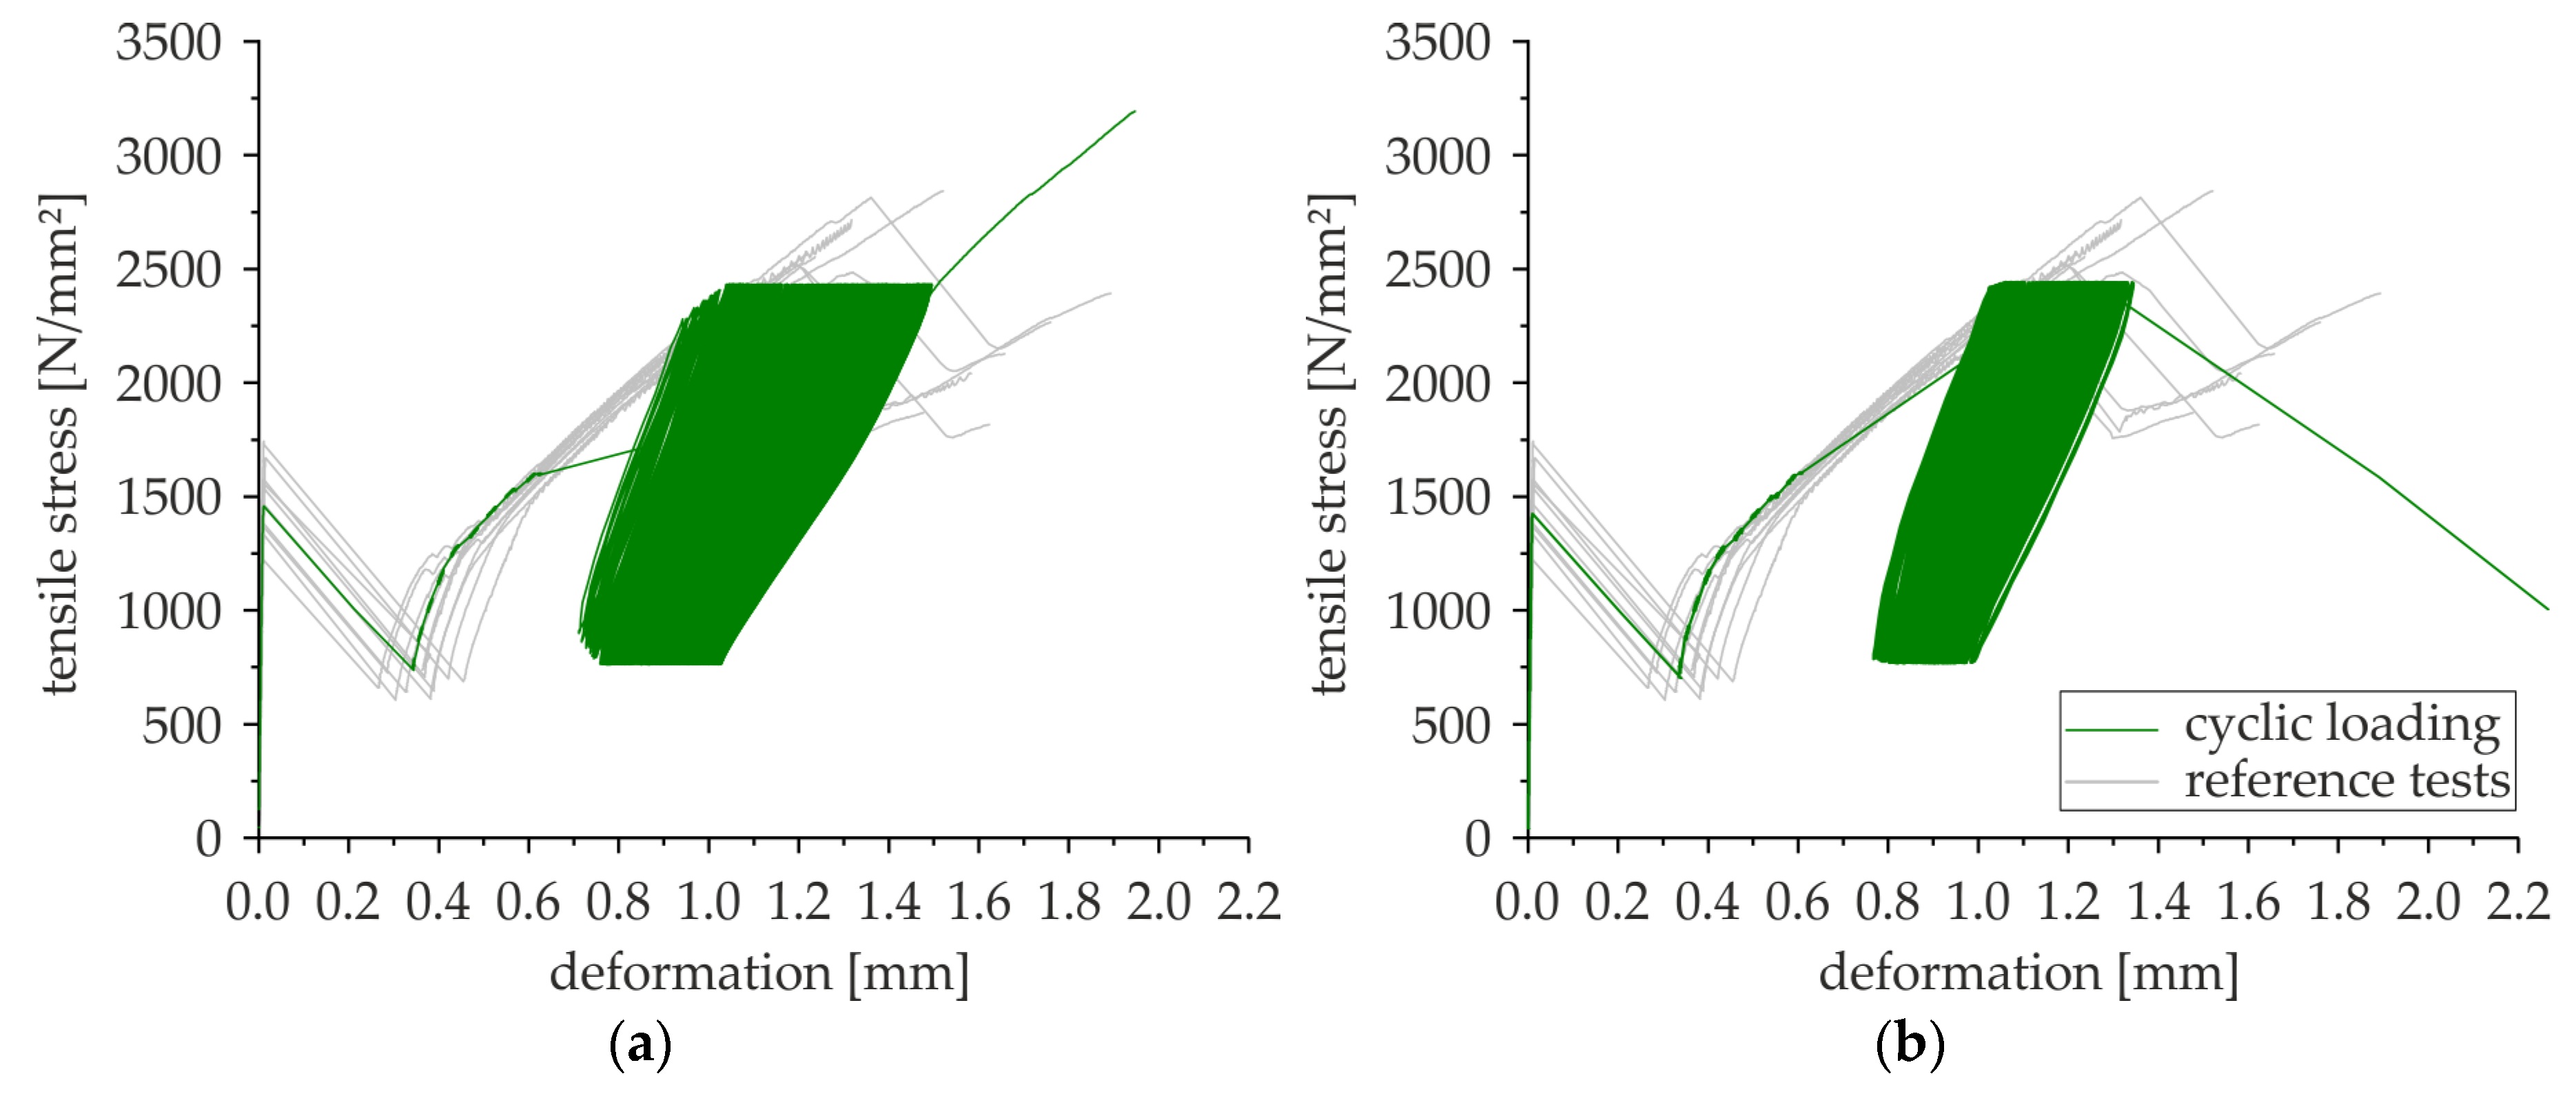
In Figure 5, exemplary stress–deformation curves of a non-failed and a failed specimen are shown. Furthermore, the curves of the reference tests are displayed in the background. Both specimens were tested at the same load level, which was located in the transition area to the fatigue strength. This area is usually characterized by the simultaneous appearance of failed and non-failed specimens, as well as a large scattering in the number of cycles to failure. In the present diagrams, specimens with an anchorage length of 3a were chosen. Examples for cyclic stress–deformation curves of specimens with shorter or longer anchorage lengths are shown in Appendix B, Figure A1,Figure A2 and Figure A3.
Generally, the cyclic stress–deformation curves consist of three different sections. The first section includes the static loading up to the required mean stress and the formation of the crack in the predetermined breaking point. Therefore, the shape of this section of the curve follows that of the reference tests. The second part of the curve starts with the beginning of the cyclic loading. The increase and decrease of the stress during the cyclic loading are clearly visible. At the same time, the deformation increases with an increasing number of load cycles. In the case that the specimen fails due to the cyclic loading (in the present investigations, failure occurred in the form of splitting in the reinforcement layer), the cyclic stress–deformation curve ends up at this point (Figure 5b). If the specimen survived (Figure 5a), there is a third section of the stress–deformation curve. Due to the stopping of the testing machine after reaching the required number of load cycles, the third section of the curve begins with a decrease of stress and deformation. Afterwards, the residual strength of the specimen is determined statically. Therefore, the stress–deformation curve increases steeply until the failure of the specimen. Hereby, this part of the curve approximates the curves of the reference tests (grey in Figure 5), and its slope—and thus the stiffness of the specimens—was nearly the same or even steeper (higher stiffness), compared to the reference tests.
3.3. Development of Deformation
3.3.1. General Remarks
The development of deformation during the cyclic loading can be shown in cyclic creep curves. According to e.g., [24,25], these curves are divided into three sections. In the first section, the deformation increases rapidly and non-linearly. Afterwards, in section two, the curve increases linearly and less steeply. Section three is also called the beginning of fatigue failure; it is characterized by a non-linear and rapid increase again. The end of section three and thereby also the cyclic creep curve is marked by the failure of the specimen.
To investigate the deformation behavior of the tested specimens, their cyclic creep curves were compared. Therefore, the average deformation of the two extensometers at mean stress is shown as a function of normalized load cycles, whereby “0” marks the beginning of the cyclic loading. Due to the measurement at intervals, curves of specimens with a very small number of cycles to failure consist of just a few measuring points, and in most cases, their failure was not recorded. For this reason, these curves are shown just until the last measuring point during the cyclic loading.
Exemplary, Figure 6 displays the cyclic creep curves of a failed and a non-failed specimen with the same anchorage length and load level. As one can see, the first two sections of the cyclic creep curve are clearly visible. Remarking on section three is not that simple with the present investigations, because the failure of the specimens mostly was not recorded. Assessing specimens that failed at a quite high number of load cycles, nearly none, or if any, just a low non-linear increase in deformation can be noticed before failure, which means that failure occurs quite abruptly.
As one can see also in Figure 6, the absolute value of deformation is no indicator of impending failure, because the non-failed specimen reached higher deformations than the failed one with the same anchorage length and load level.
3.3.2. Dependence on Load Level
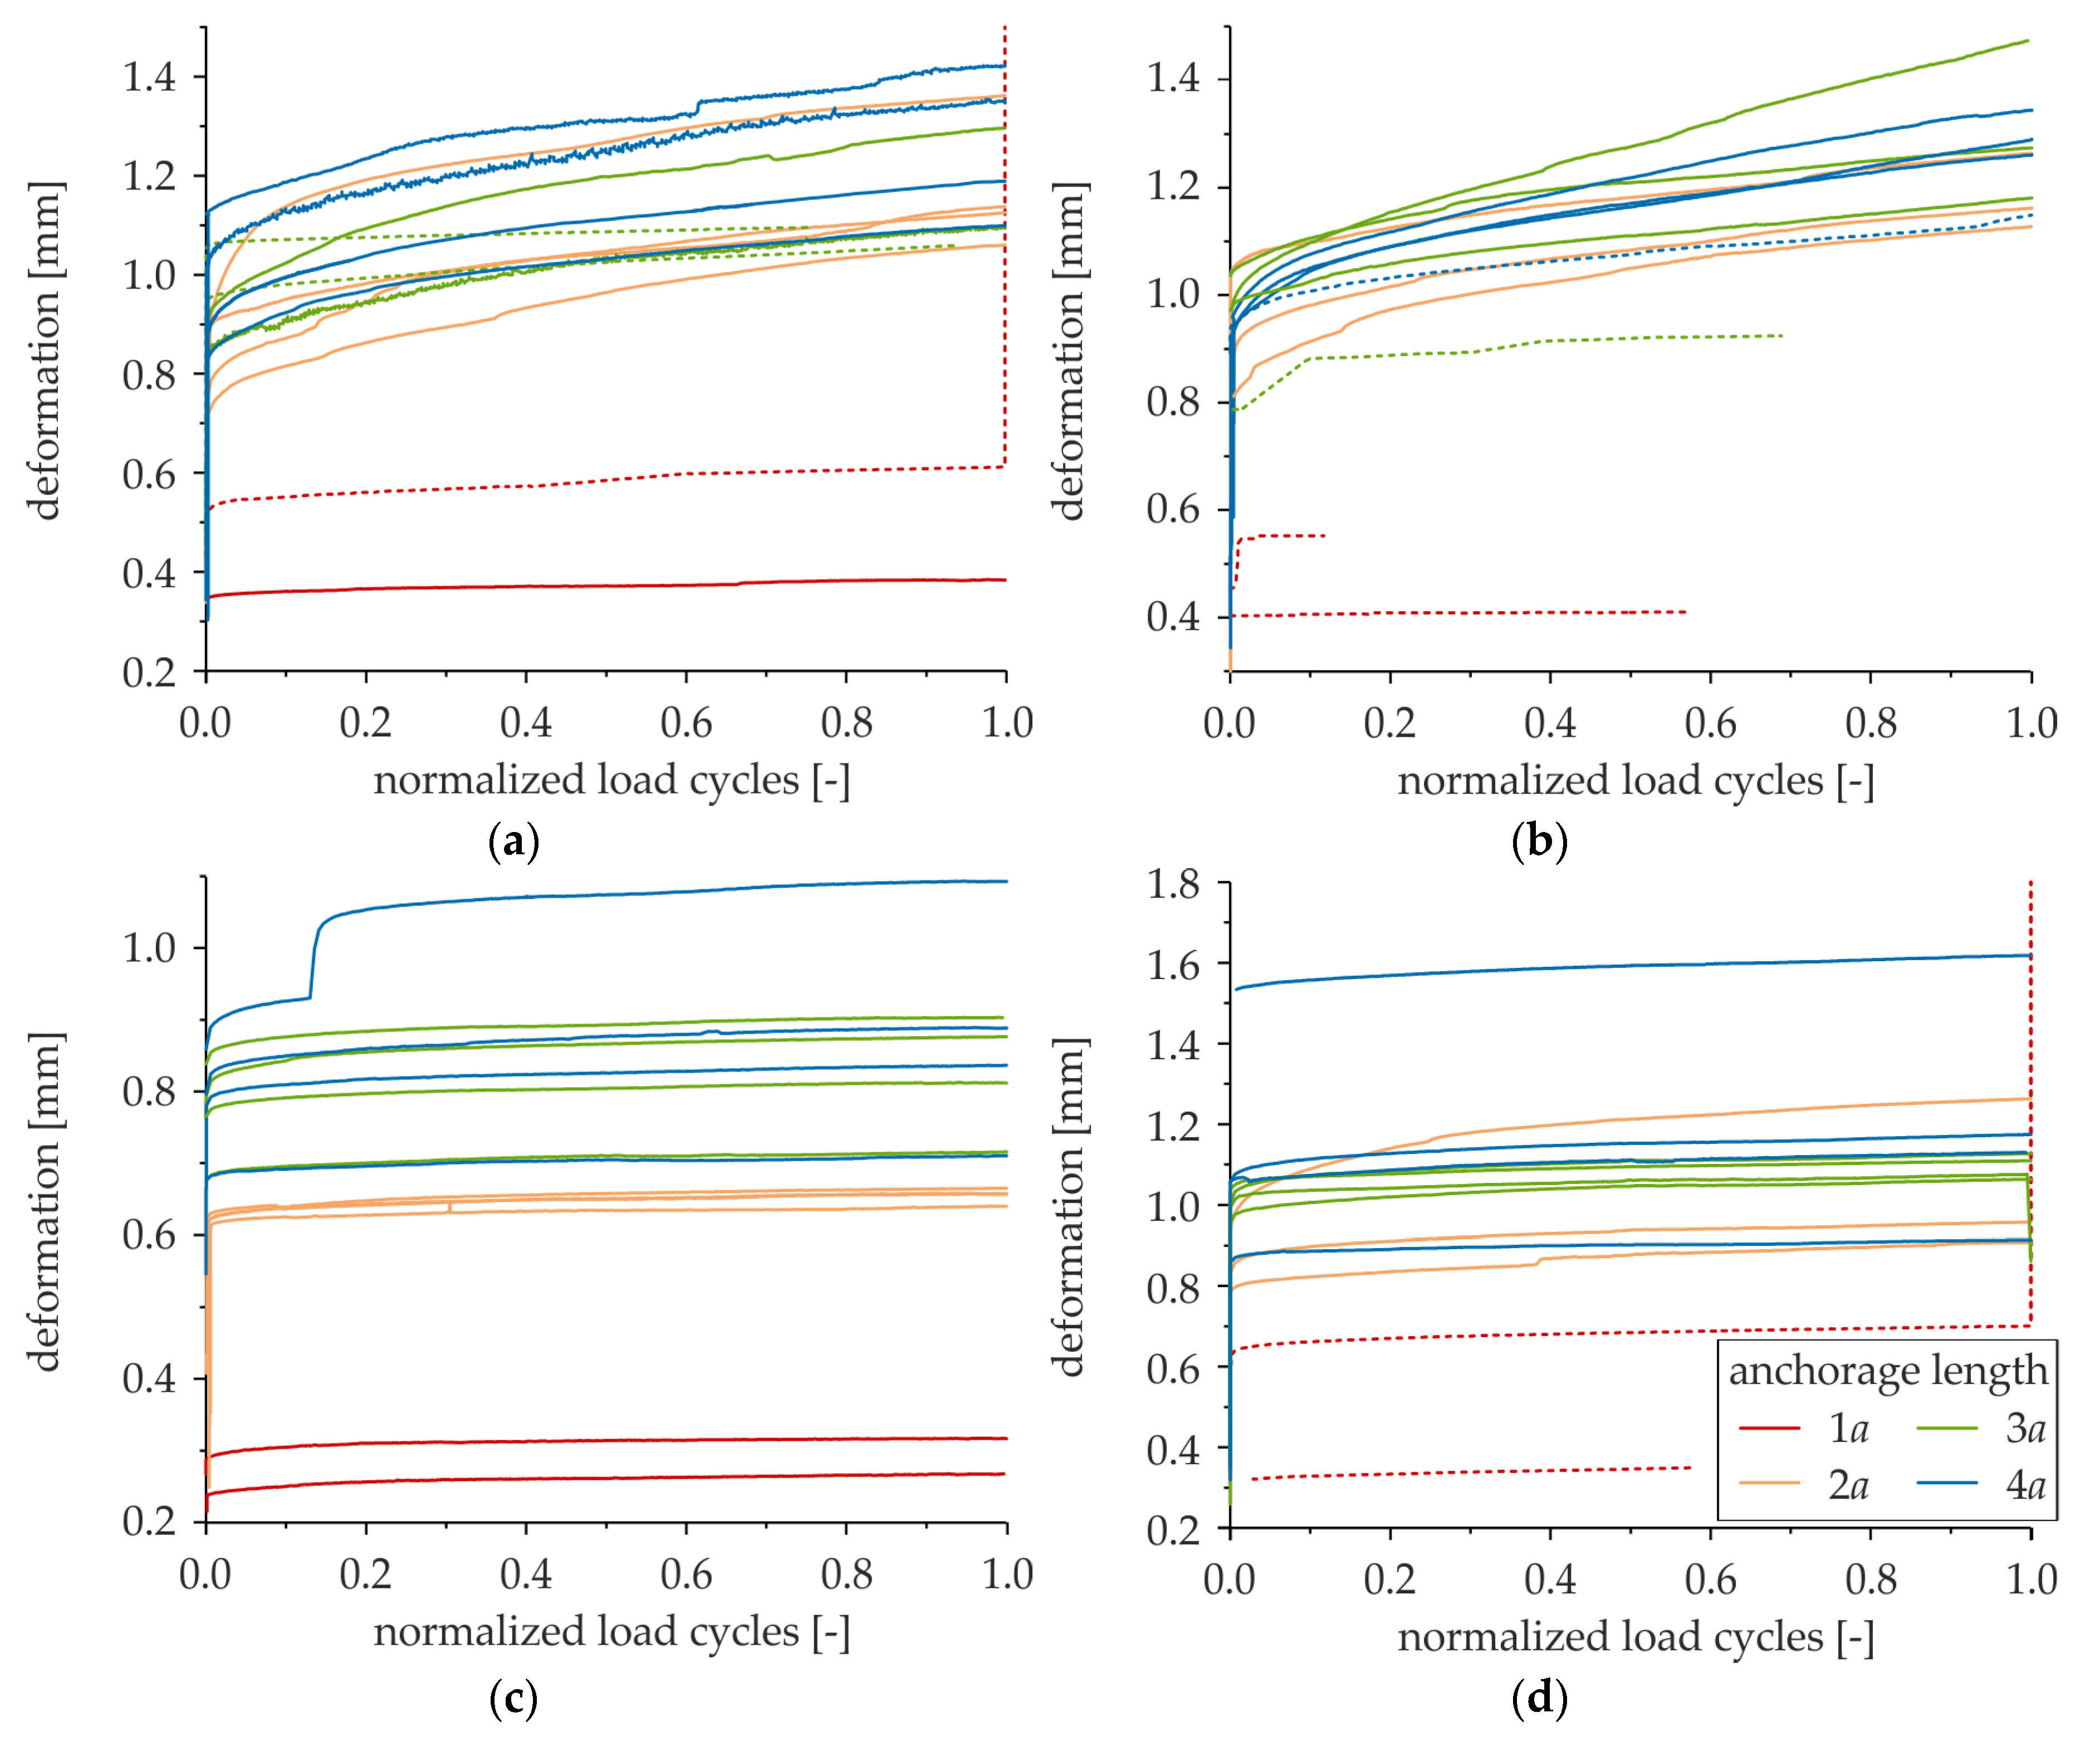
To investigate the influence of the load level on the deformation of the specimens, the cyclic creep curves of specimens with the same anchorage lengths are compared in Figure 7. Here, specimens with an anchorage length of 3a are shown as examples. Figure 7a shows the creep curves of specimens with a minimum stress of 30% and maximum stresses of 90% and 95%, respectively. Figure 7b shows curves of specimens with 50% minimum stress and different maximum stresses between 70–90%. Failed specimens are illustrated by dashed lines. Curves of specimens with other anchorage lengths are shown in Figure A4 in Appendix B.
One can see that deformations become larger with increasing maximum stress. However, not only the maximum stress itself, but also the related amplitude σa affects the amount of deformation. That means, regarding e.g., load levels 30/90 and 50/90 in Figure 8 (showing the same curves as Figure 7 but depending on the amplitude), specimens with the same maximum stress but a higher amplitude (viz. a lower minimum stress) show higher deformations than the ones with a lower amplitude. In addition, it can be seen that not only do deformations become larger with higher amplitudes, but the slope of section two of the cyclic creep curve also becomes steeper.
3.3.3. Dependence on Anchorage Length
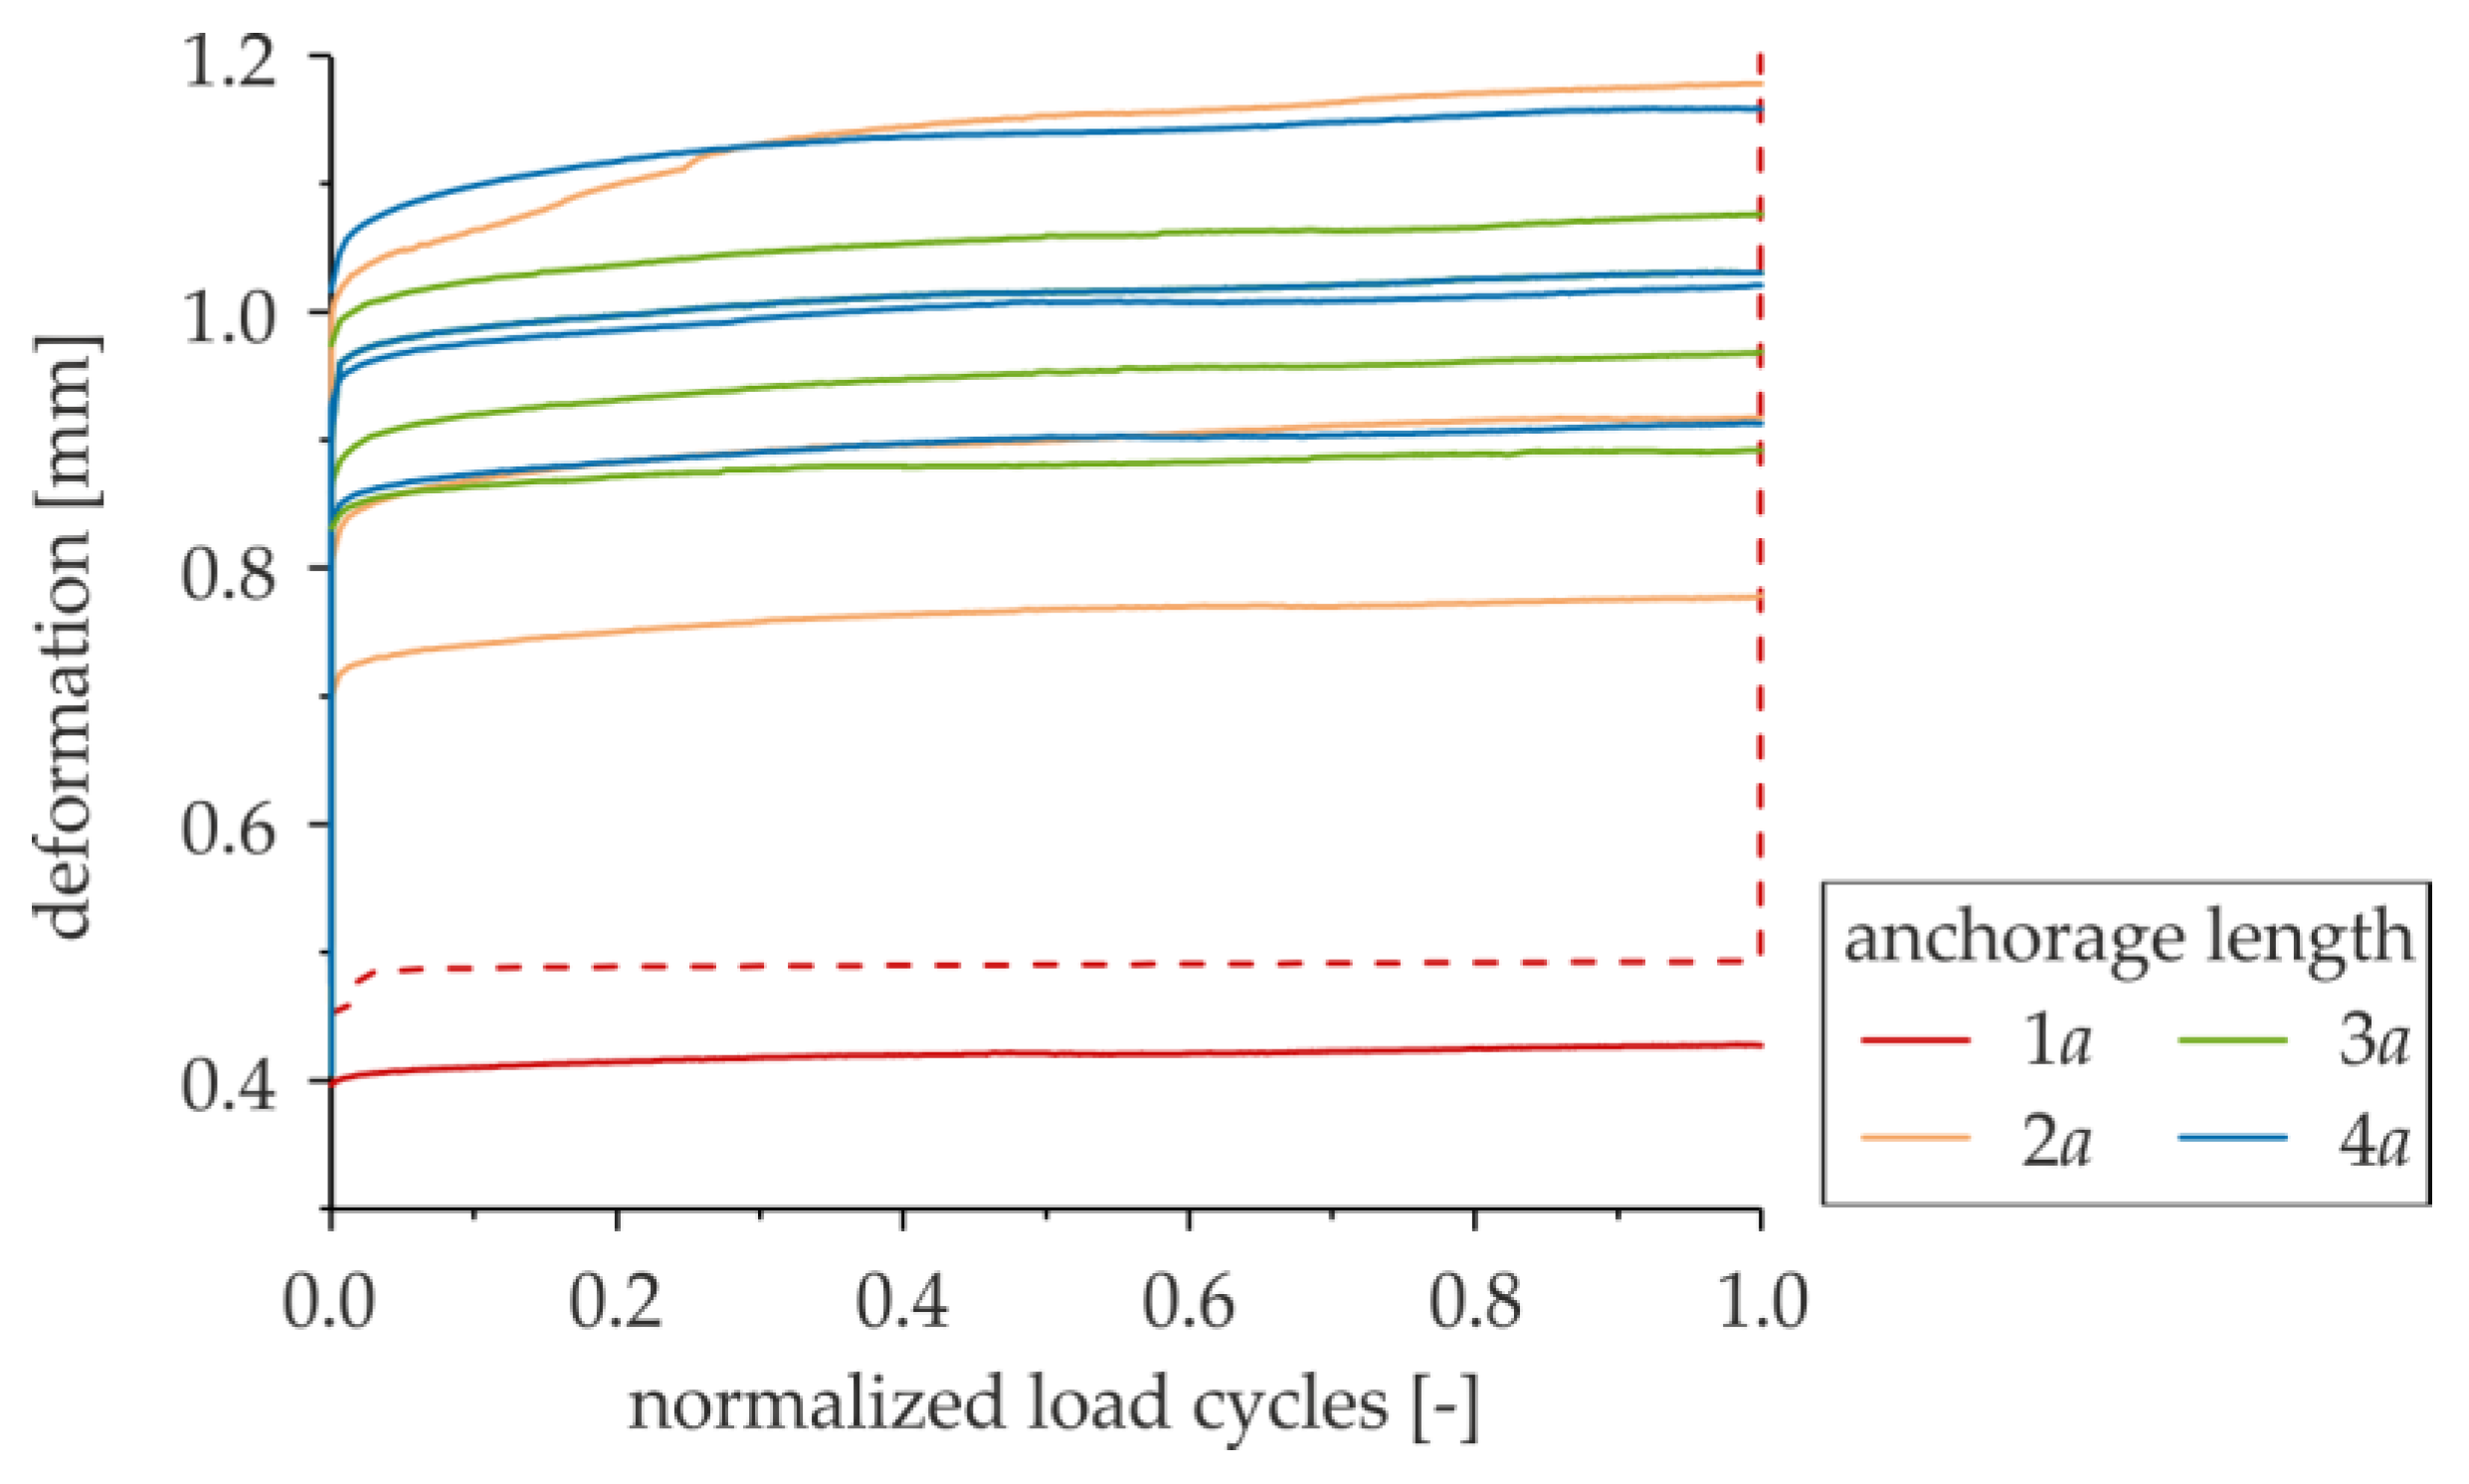
Now, the influence of the anchorage length on the deformation is regarded. Therefore, the four different investigated anchorage lengths were compared at several load levels. Figure 9 shows an example of the cyclic creep curves at a load level of 50/85. The comparison of the creep curves at other load levels is shown in Figure A5. Again, failed specimens are marked by dashed lines.
In Figure 9, it can clearly be seen that the deformation increases with increasing anchorage length. However, the difference between the deformation of specimens with 1a and 2a as anchorage lengths is larger than the difference between specimens with 2a and 3a. Finally, the deformations of specimens with anchorage lengths of 3a and 4a show no differentiation anymore. The reason for this is to be found in the absolute reference strengths, increasing non-linearly with increasing anchorage length (see Section 3.1).
3.4. Development of Stiffness
3.4.1. General Remarks
The development of the stiffness of a specimen can be described by regarding the development of the secant modulus. According to [26], the secant modulus describes the slope of the secant between the maximum and minimum point of a hysteresis loop, and can be determined separately for every single load cycle (Figure 10) [27]. In contrast to [26], in the present investigations, deformations instead of elongations are indicated. Therefore, the physical unit of the secant modulus is instead of (see also [16]).
To compare the absolute stiffnesses of several specimens, the development of their secant modulus is shown as a function of normalized load cycles. Whereby, similar to the deformations, “0” marks the beginning of the cyclic loading. As already explained in Section 3.3.1, due to the measurement in intervals, curves of failed specimens are only drawn until the last measuring point before failure.
3.4.2. Dependence on Load Level
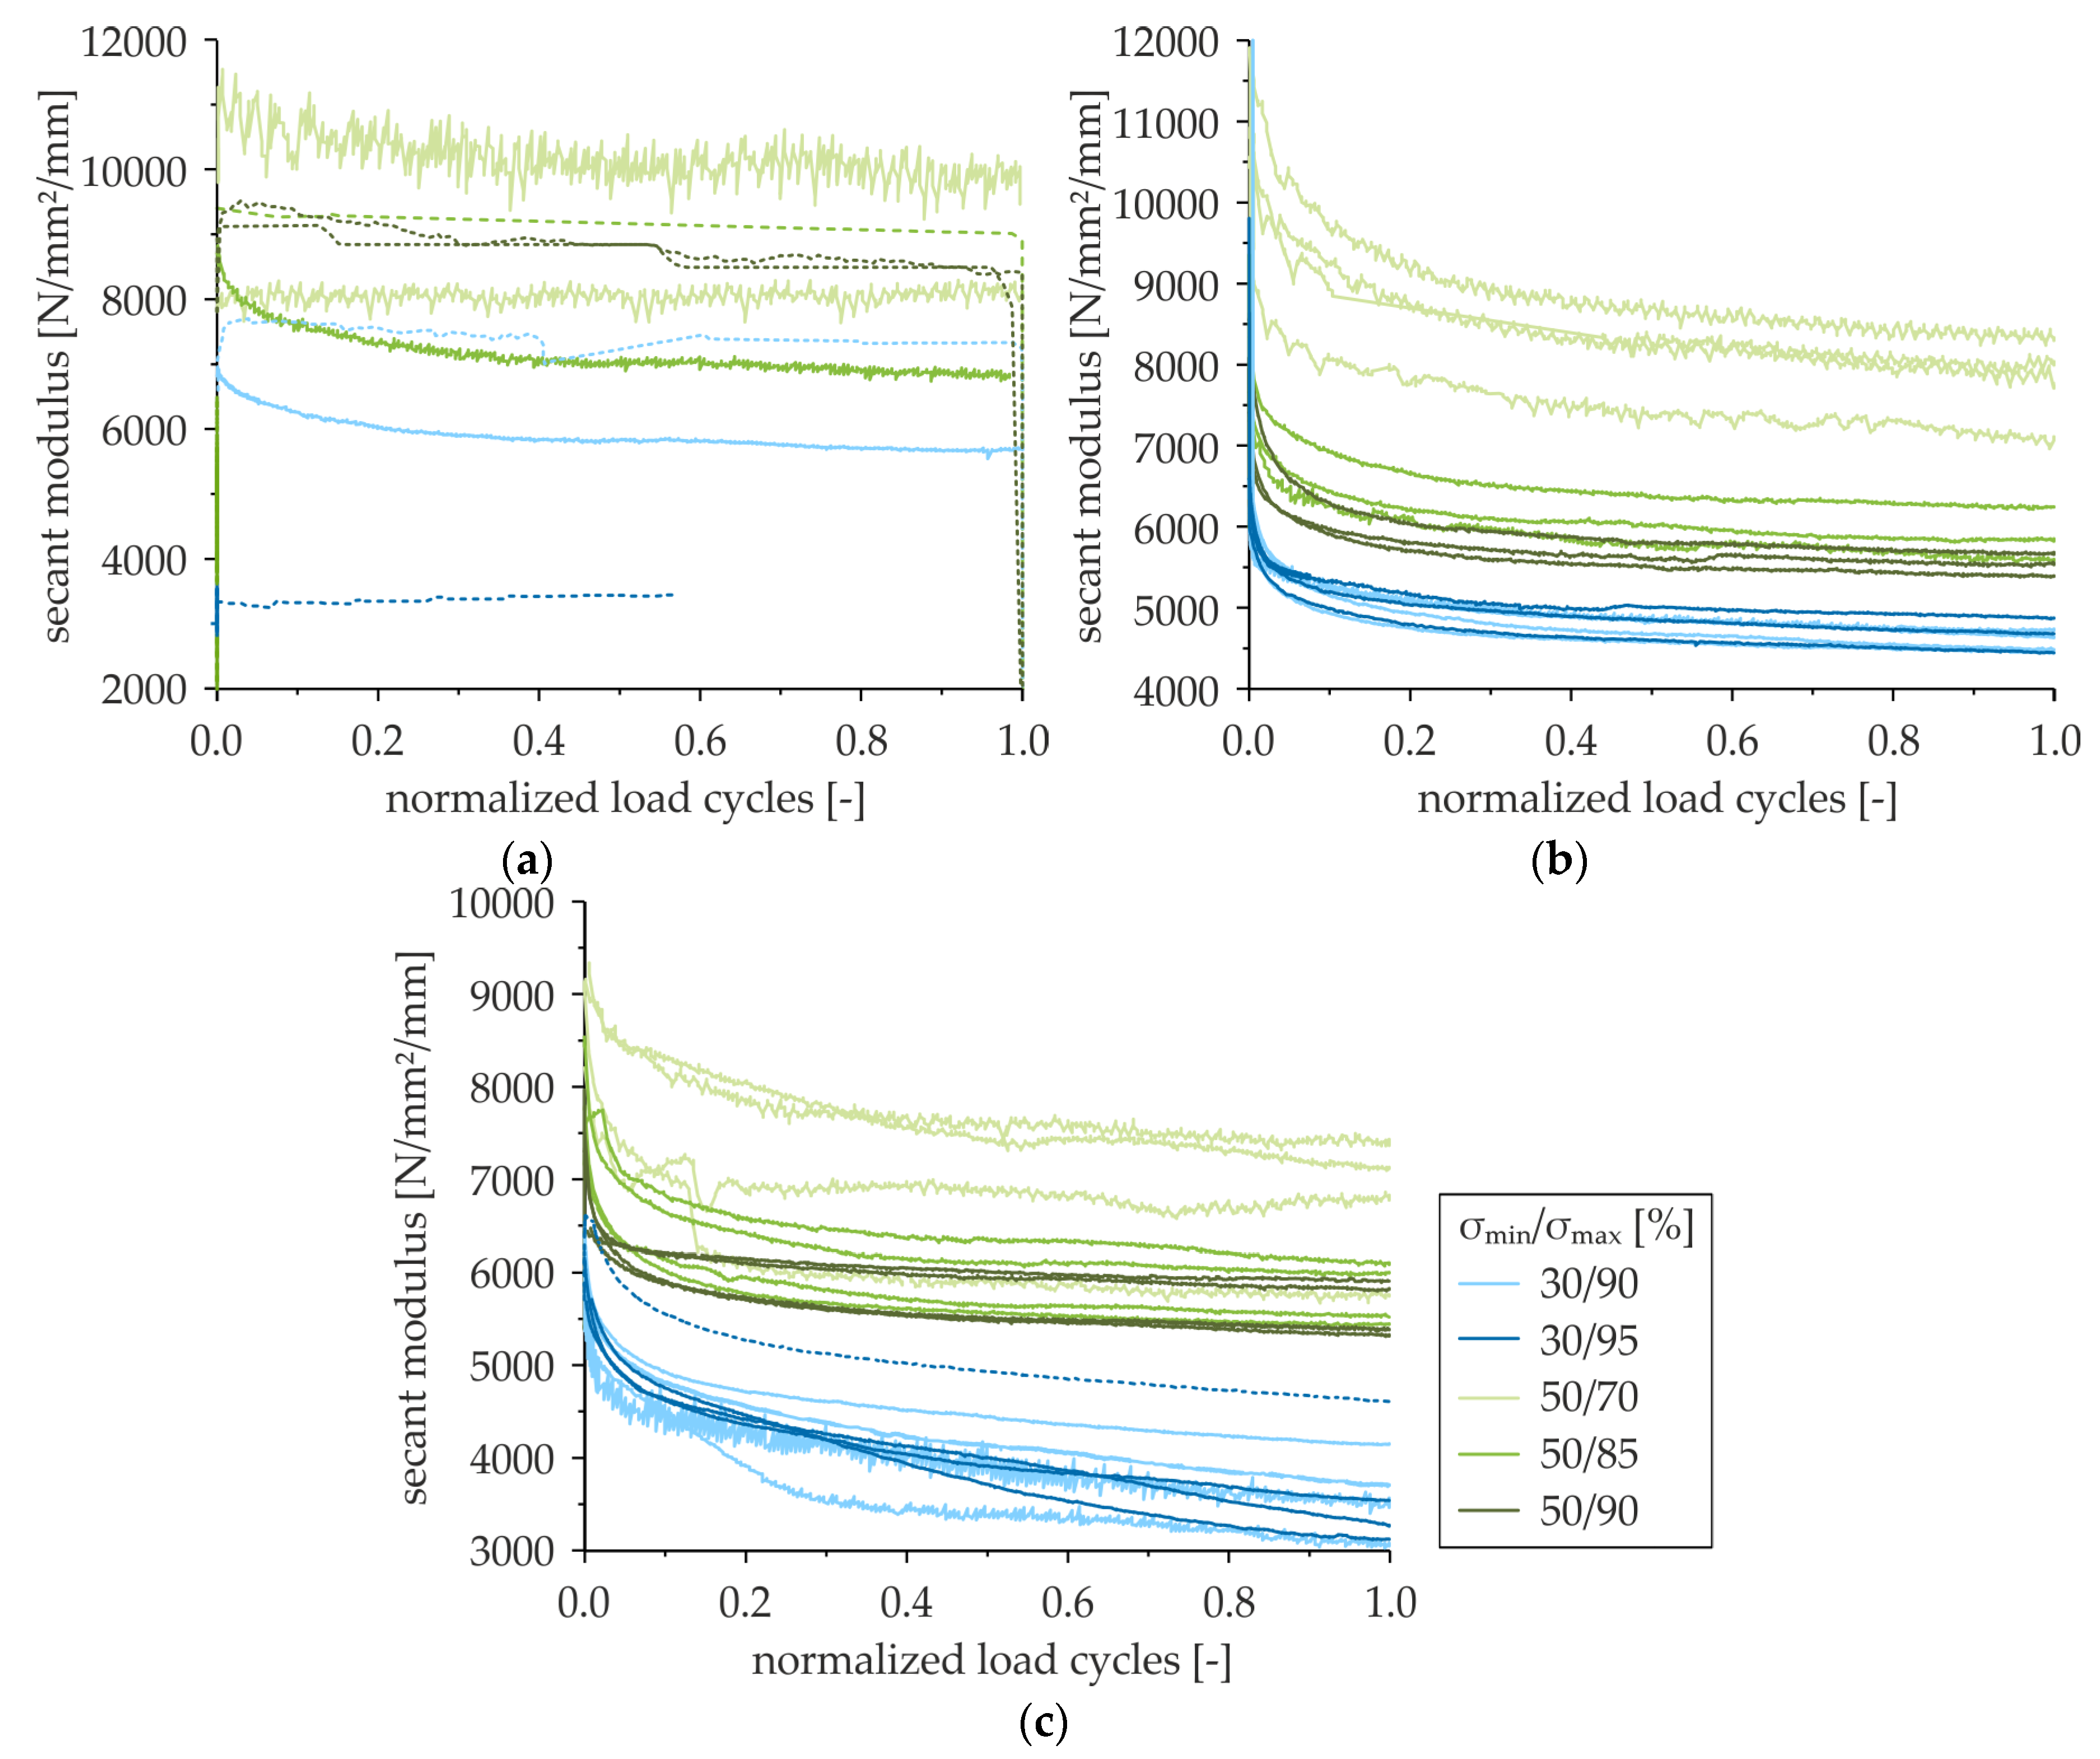
The dependence of the stiffness on the load level is shown in Figure 11. As an example, here, the curves of specimens with 3a as an anchorage length are shown. The evaluations for the other anchorage lengths can be seen in Figure A6. Similar to the deformations, there is a clear relation between the amplitude and the secant modulus, which becomes lower with increasing amplitude. When calculating the secant modulus, the deformation is the denominator; hence, it is mathematically justified that the secant modulus has to become lower with increasing amplitude (see also [16]), because the deformation increases with increasing amplitude (see Section 3.3.2). Comparing the curves with high amplitudes (blue and purple) with the ones with lower amplitudes (orange, yellow, and green), one can see that—similar to the deformations—there is a difference in their decrease, which is lower in the curves with lower amplitudes.
3.4.3. Dependence on Anchorage Length
Similar to the investigation of deformations, now the dependence of the absolute stiffness on the anchorage length is regarded. Figure 12 shows the development of the stiffness of specimens with the four investigated anchorage lengths at a load level of 50/85. The curves at the other load levels can be found in Figure A7. As one can see, the absolute stiffness decreases with increasing anchorage length. However, there is just a small increase between the specimens with 2a and 3a, and no increase between the specimens with an anchorage length of 3a and 4a. The reason is also a mathematical one, remembering that the stiffness depends on the deformation, and that there was also nearly no increase of deformation between specimens with an anchorage length of 2a and longer ones (see Section 3.3.3).
3.5. S-N Diagram
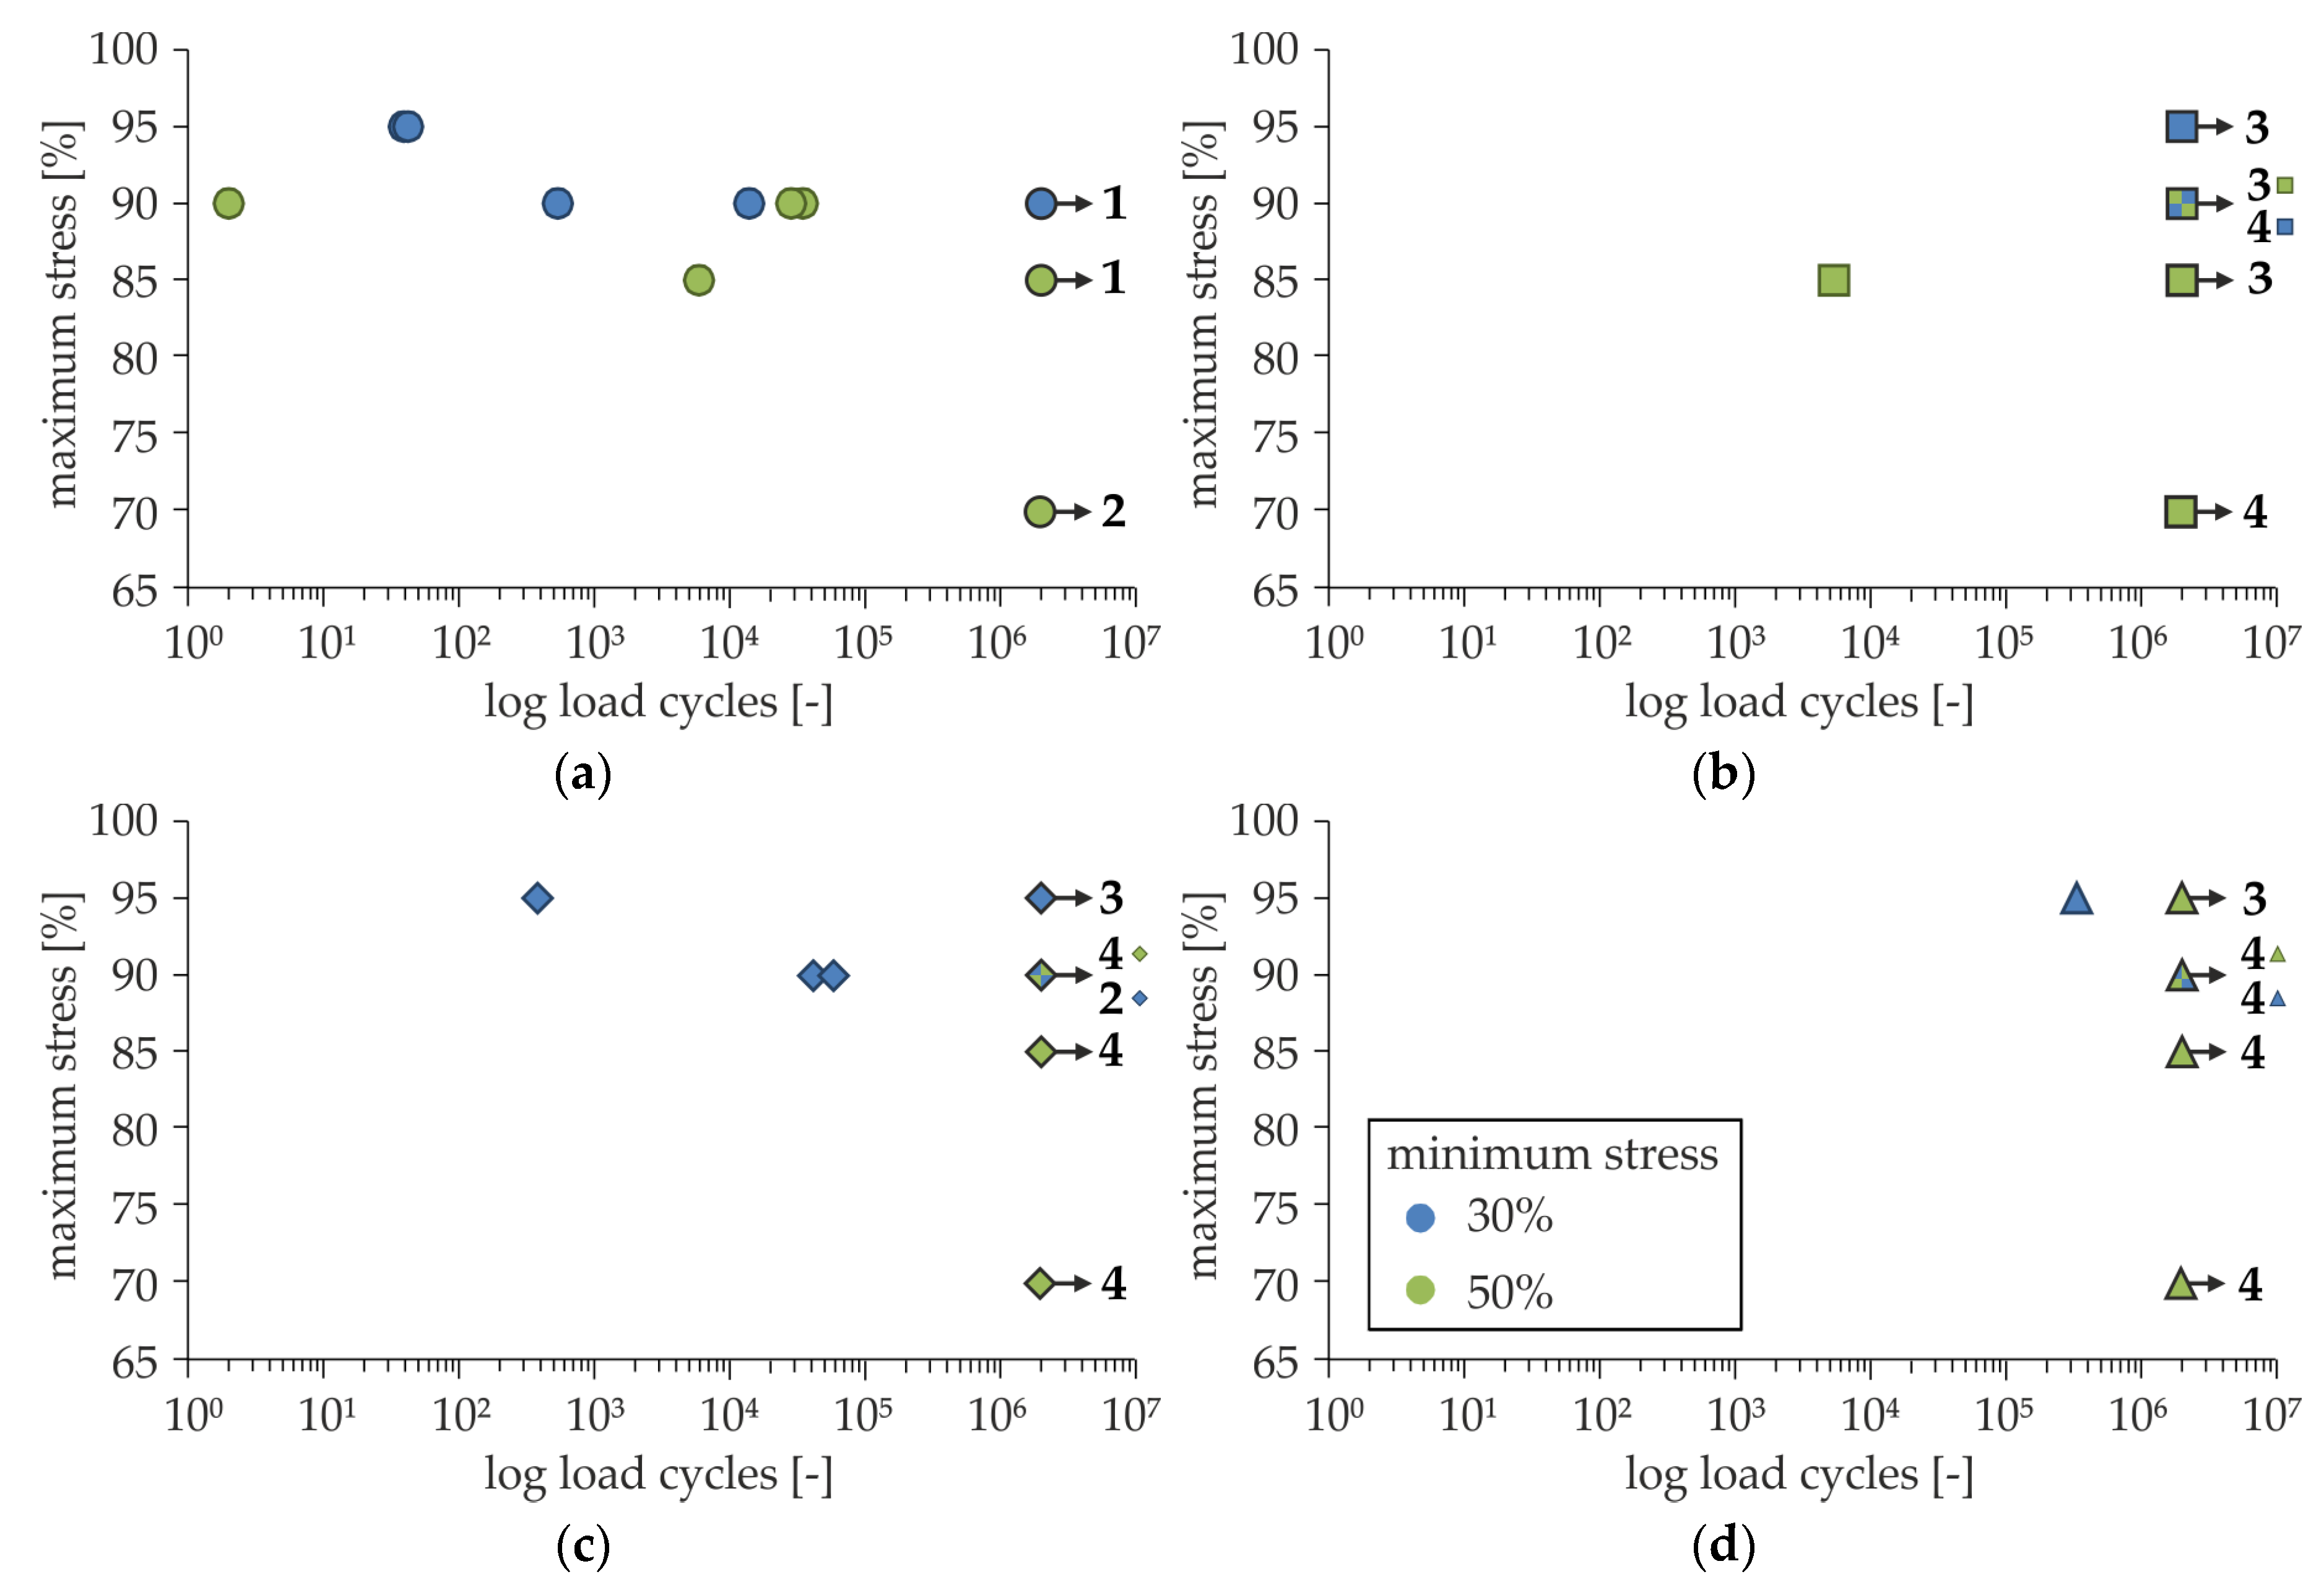
The most common way of evaluating fatigue tests is to create S-N diagrams. Here, the number of cycles to failure N at a defined load level S can be read off. Figure 13 shows the S-N diagram for the present investigations. The two different minimum stresses are marked by two different colors. The related maximum stresses can be seen at the y-axis. The different anchorage lengths are defined by different symbols. Runouts are edged by a black line, and marked by an arrow with the number of non-failed specimens. For a better understanding, the S-N diagram is broken down by the anchorage lengths in Figure A8, and the results are listed in Table A3.
As one can see in Figure 13, there is only a very small number of failed specimens. Only at high loads (σmax ≥85%) and with 1a as the anchorage length did failure occur rapidly and assuredly. Specimens with anchorage lengths of 2a or longer failed seldom, and even at high loads (e.g., σmax = 95%), runouts occurred.
In the S-N diagram in Figure 14, the maximum stresses are shown as absolute stresses, ignoring the different minimum stresses. Furthermore, the mean tensile strength and its range of variation and the reference stresses of the different anchorage lengths are shown. It can clearly be seen that with shorter anchorage lengths (1a and 2a), the transmittable load is quite low. Only with anchorage lengths of 3a or 4a can loads close to the tensile strength be reached. However, from 3a to 4a, no significant increase in transmittable load can be noticed.
3.6. Residual Strength
If specimens withstood the cyclic loading, their residual strength was tested subsequently. In Figure 15, the residual strengths are compared to the reference strengths from Section 3.1. The results above the grey line mean a higher residual strength compared to the reference strength, and the results below the line mean a lower residual strength. Figure 15a displays the results of the specimens with a minimum stress of 30%, and Figure 14b displays the ones with 50% minimum stress. Different symbols stand for the different anchorage lengths, and the darker the color of the symbols, the higher the related maximum stress. The single values of the results can also be found in Table A3.
As one can see in Figure 15, the residual strengths are higher or at least at the same level than the reference strengths, and even high maximum stresses seem not to cause damage, leading to lower residual strengths. That means that there is no negative impact on the load-bearing capacity of the material by fatigue loading. A load increase after cyclic loading is not unusual, and is often noticed in fatigue experiments with several materials. A final explanation for this phenomenon has not been found yet. In the present investigation, the reason for the load increase could be the activation of more filaments in a fiber strand due to the cyclic loading. However, this theory still has to be proven.
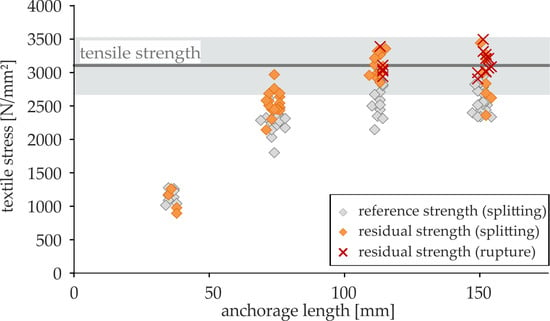
In Figure 16, the dependence of the textile stress on the anchorage length, which is known from Section 3.1, is supplemented by the determined residual stresses. The test results of the reference stresses, all of them failed by splitting, are marked by grey rhombs, whilst orange rhombs mark the splitted specimens in residual strength tests. If specimens in residual strength testing failed by textile rupture, the results are displayed by red crosses.
As one can see, textile rupture only occurred at the long anchorage lengths of 3a or higher, where the residual strengths reach the value of the mean textile stress. However, there was no dependence of the failure mode on the applied load level. Furthermore, as splitting and rupture occur at the same stresses, the failure mode is also not dependent on the value of the residual strength.
4. Summary, Conclusions, and Outlook
Regarding the results from Section 3, it can be stated that the cyclic loading has no negative impact on the required anchorage length for the investigated material combination. This assertion is justified by the following. First, there was no further increase in deformation when the anchorage length was increased from 3a to 4a (Section 3.3.3). Additionally, there was no decrease in absolute stiffness regarding these specimens (Section 3.4.3). Finally, in testing the residual strength, there was no load increase from an anchorage length of 3a, and some of these specimens failed by textile rupture at the level of the tensile strength, which is an indicator that the tested anchorage length is sufficient to transfer the complete tensile load, even after cyclic loading.
In conclusion, it can be said that the bond fatigue behavior of the investigated material combination is quite good, provided that the anchorage length is sufficient. The development of the deformation and stiffness of a specimen during cyclic loading depends on the applied maximum load as well as on the related minimum load (Section 3.3.2 and Section 3.4.2). However, even at high maximum loads (e.g., σmax = 95%), runouts occurred (Section 3.5). The tested residual strengths of runouts were generally higher or at least at the same level than the reference strengths (Section 3.6). Regarding the stress–deformation curves, the curve of the residual strength meets the curves of the reference tests again (Section 3.2); thus—regarding runouts—no negative impact of the cyclic loading can be detected. However, as there was nearly no third section of the observed cyclic creep curves of the failed specimen (Section 3.3.1), one may assume that cyclic failure occurs quite abruptly without advance notice. For this reason, it is strongly recommended to not extrapolate the S-N curves over the experimentally proven load levels.
Whilst doing the above described investigations, the following concerning the use of DPO tests was found by Schütze and Curbach in [28]: a material combination (carbon textile with polyacrylate-based impregnation and fine grain concrete) usually used for the strengthening of existing reinforced concrete structures was tested in static DPO tests. Independently of the anchorage length, all the specimens failed due to splitting at quite low loads, and no increase of load with increasing anchorage length could be detected. Firstly, it is assumed that due to eccentricity between the stuck steel plates and the textile layer, there is a moment leading to splitting, and secondly, that the stuck steel plates block the formation of cracks, except for the one in the middle of the specimen. At this point, the whole deformation is concentrated, and the critical deformation, leading to splitting, is reached quite early. The investigations with this material combination have shown that the DPO test only represents the bond behavior of some specific situations, and cannot be used to determine the necessary anchorage length for thin layers of this material combination. For this material combination, much more realistic results were reached with an overlap test (e.g., according to [29]). Even though the findings in [28] were made with a different material combination than in the research presented in Section 3, comparative studies using overlap tests with the material combination described in Section 2 of the present paper should be done to prove the obtained results.
Author Contributions
Conceptualization, M.C.; Formal analysis, J.W.; Funding acquisition, M.C.; Investigation, J.W.; Project administration, M.C.; Supervision, M.C.; Validation, J.W. and M.C.; Visualization, J.W.; Writing—original draft, J.W.; Writing—review & editing, M.C.
Funding
This research was funded by the German Federal Ministry of Education and Research. The experiments were carried out in the projects C3-V1.2 ‘Verification and testing concepts for standards and approvals’ (funding period: 01.2016–04.2018, grant number: 03ZZ0312A) and C3-V2.1 ‘Long-term behaviour of carbon reinforced concrete’ (funding period: 09.2017–02.2020, grant number: 03ZZ0321A) as part of the project consortium ‘C3—Carbon Concrete Composites’ with circa 170 partners all over Germany.
Acknowledgments
First of all, we would like to thank the colleagues in the Otto Mohr Laboratory, where the specimens were produced and the experiments took place. Further thanks for the good cooperation go to the colleagues and partners in the research projects. For the provision of the carbon textile free of charge, we would also like to thank solidian GmbH!
Conflicts of Interest
The authors declare no conflict of interest.
Appendix A. Materials
Textile “solidian GRID Q95/95-CCE-38”

Table A1.
Characteristics of the textile (values according to [18]).
Table A1.
Characteristics of the textile (values according to [18]).
| Longitudinal | Transversal | ||
|---|---|---|---|
| Fiber strand distance | [mm] | 38 | 38 |
| Cross-section of the strand | [mm2] | 3.62 | 3.62 |
| Average tensile strength | [N/mm2] | 3200 | 3300 |
| Modulus of elasticity | [N/mm2] | >220000 | >205000 |
Concrete “HF-2-145-5”
Table A2.
Composition of the concrete (values according to [19]).
Table A2.
Composition of the concrete (values according to [19]).
| Ingredients | Quantity [kg/m3] |
|---|---|
| Binder | 621 |
| Quartz fine sand | 250 |
| Sand 0/2 | 530 |
| Granite grit 2/5 | 837 |
| Super-plasticizer | 16 |
| Water | 145 |
Appendix B. Results
Cyclic stress–deformation curves
Figure A1.
Cyclic stress–deformation curves (here: anchorage length = 1a): (a) non-failed specimen; (b) failed specimen (load cycles: 34323).
Figure A1.
Cyclic stress–deformation curves (here: anchorage length = 1a): (a) non-failed specimen; (b) failed specimen (load cycles: 34323).

Figure A2.
Cyclic stress–deformation curves (here: anchorage length = 2a): (a) non-failed specimen; (b) failed specimen (load cycles: 5308).
Figure A2.
Cyclic stress–deformation curves (here: anchorage length = 2a): (a) non-failed specimen; (b) failed specimen (load cycles: 5308).

Figure A3.
Cyclic stress–deformation curves (here: anchorage length = 4a): (a) non-failed specimen; (b) failed specimen (load cycles: 328198).
Figure A3.
Cyclic stress–deformation curves (here: anchorage length = 4a): (a) non-failed specimen; (b) failed specimen (load cycles: 328198).

Cyclic creep curves depending on the load level
Figure A4.
Comparison of normalized cyclic creep curves depending on the load level: (a) anchorage length = 1a; (b) anchorage length = 2a; (c) anchorage length = 4a.
Figure A4.
Comparison of normalized cyclic creep curves depending on the load level: (a) anchorage length = 1a; (b) anchorage length = 2a; (c) anchorage length = 4a.

Cyclic creep curves depending on the anchorage length
Figure A5.
Comparison of normalized cyclic creep curves depending on the anchorage length: (a) σmin/σmax = 30%/90%; (b) σmin/σmax = 30%/95%; (c) σmin/σmax = 50%/70%; and (d) σmin/σmax = 50%/90%.
Figure A5.
Comparison of normalized cyclic creep curves depending on the anchorage length: (a) σmin/σmax = 30%/90%; (b) σmin/σmax = 30%/95%; (c) σmin/σmax = 50%/70%; and (d) σmin/σmax = 50%/90%.

Development of secant modulus depending on the load level
Figure A6.
Comparison of the normalized development of the secant modulus depending on the load level: (a) anchorage length = 1a; (b) anchorage length = 2a; and (c) anchorage length = 4a.
Figure A6.
Comparison of the normalized development of the secant modulus depending on the load level: (a) anchorage length = 1a; (b) anchorage length = 2a; and (c) anchorage length = 4a.

Development of secant modulus depending on the anchorage length
Figure A7.
Comparison of the normalized development of the secant modulus depending on the anchorage length: (a) σmin/σmax = 30%/90%; (b) σmin/σmax = 30%/95%; (c) σmin/σmax = 50%/70%; and (d) σmin/σmax = 50%/90%.
Figure A7.
Comparison of the normalized development of the secant modulus depending on the anchorage length: (a) σmin/σmax = 30%/90%; (b) σmin/σmax = 30%/95%; (c) σmin/σmax = 50%/70%; and (d) σmin/σmax = 50%/90%.

S-N diagram broken down by the anchorage lengths
Figure A8.
S-N diagrams with relative maximum stresses and two different minimum stresses: (a) anchorage length = 1a; (b) anchorage length = 2a; (c) anchorage length = 3a; and (d) anchorage length = 4a.
Figure A8.
S-N diagrams with relative maximum stresses and two different minimum stresses: (a) anchorage length = 1a; (b) anchorage length = 2a; (c) anchorage length = 3a; and (d) anchorage length = 4a.

Test results number of cycles to failure and residual strength
Table A3.
Test results.
| Anchorage Length | Load Level σmin/σmax [%] | Number of Cycles to Failure | Residual Strength [N/mm2] | Anchorage Length | Load Level σmin/σmax [%] | Number of Cycles to Failure | Residual Strength [N/mm2] |
|---|---|---|---|---|---|---|---|
| 1a | 30/90 | 532 | - | 2a | 30/90 | 2009000 * | 2296 |
| 13801 | - | 2009000 * | 2567 | ||||
| 2009000 * | 1169 | 2009000 * | 2677 | ||||
| 30/95 | 39 | - | 2009000 * | 2629 | |||
| 42 | - | 30/95 | 2009000 * | 2447 | |||
| 50/70 | 2009000 * | 976 | 2009000 * | 2753 | |||
| 2009000 | 895 | 2009000 * | 2961 | ||||
| 50/85 | 5865 | - | 50/70 | 2009000 * | 2501 | ||
| 2009000 * | 1259 | 2009000 * | 2536 | ||||
| 50/90 | 2 | - | 2009000 * | 2478 | |||
| 28112 | - | 2009000 * | 2429 | ||||
| 34323 | - | 50/85 | 5308 | - | |||
| 3a | 30/90 | 41078 | - | 2009000 * | 2683 | ||
| 57733 | - | 2009000 * | 2449 | ||||
| 2009000 * | 2965 | 2009000 * | 2447 | ||||
| 2009000 * | 3379 | 50/90 | 2009000 * | 2137 | |||
| 30/95 | 378 | 2009000 * | 2443 | ||||
| 2009000 * | 3083 | 2009000 * | 2576 | ||||
| 2009000 * | 3326 | 4a | 30/90 | 2009000 * | 2897 | ||
| 2009000 * | 2844 | 2009000 * | 3000 | ||||
| 50/70 | 2009000 * | 3015 | 2009000 * | 3433 | |||
| 2009000 * | 2930 | 2009000 * | 3306 | ||||
| 2009000 * | 3101 | 30/95 | 328198 | - | |||
| 2009000 * | 2944 | 2009000 * | 3262 | ||||
| 50/85 | 2009000 * | 3107 | 2009000 * | 3201 | |||
| 2009000 * | 3039 | 2009000 * | 2990 | ||||
| 2009000 * | 2964 | 50/70 | 2009000 * | 2353 | |||
| 2009000 * | 3257 | 2009000 * | 2828 | ||||
| 50/90 | 2009000 * | 3311 | 2009000 * | 2683 | |||
| 2009000 * | 2949 | 2009000 * | 3197 | ||||
| 2009000 * | 3206 | 50/85 | 2009000 * | 3057 | |||
| 2009000 * | 3348 | 2009000 * | 3007 | ||||
| 2009000 * | 2615 | ||||||
| 2009000 * | 3261 | ||||||
| 50/90 | 2009000 * | 2994 | |||||
| 2009000 * | 3204 | ||||||
| 2009000 * | 3077 | ||||||
| 2009000 * | 3485 |
* Runout.
References
- Scheerer, S.; Chudoba, R.; Garibaldi, M.P.; Curbach, M. Shells made of Textile Reinforced Concrete—Applications in Germany. J. Int. Assoc. Shell Spat. Struct. JIASS 2017, 58, 79–93. [Google Scholar] [CrossRef]
- Curbach, M.; Graf, W.; Jesse, D.; Sickert, J.-U.; Weiland, S. Segmentbrücke aus textilbewehrtem Beton—Konstruktion, Fertigung, numerische Berechnung. Beton-und Stahlbetonbau 2007, 102, 342–352. [Google Scholar] [CrossRef]
- Michler, H. Segmentbrücke aus textilbewehrtem Beton—Rottachsteg Kempten im Allgäu. Beton-und Stahlbetonbau 2013, 108, 325–334. [Google Scholar] [CrossRef]
- Kulas, C.; Goralski, K. Die weltweit längste Textilbetonbrücke—Technische Details und Praxiserfahrungen. Beton-und Stahlbetonbau 2014, 109, 812–817. [Google Scholar] [CrossRef]
- Rempel, S.; Hegger, J.; Kulas, C. A pedestrian bridge made of textile reinforced concrete. In Proceedings of the 16th European Bridge Conference, Endinburgh, UK, 23–25 June 2015. [Google Scholar]
- Helbig, T.; Rempel, S.; Unterer, K.; Kulas, C.; Hegger, J. Fuß- und Radwegbrücke aus Carbonbeton in Albstadt-Ebingen—Die weltweit erste ausschließlich carbonfaserbewehrte Betonbrücke. Beton-und Stahlbetonbau 2016, 111, 676–685. [Google Scholar] [CrossRef]
- Rempel, S.; Kulas, C.; Will, N.; Bielak, J. Extremely Light and Slender Precast Pedestrian-Bridge Made Out of Textile-Reinforced Concrete (TRC). In Proceedings of the fib Symposium, Maastricht, The Netherlands, 12–14 June 2017. [Google Scholar] [CrossRef]
- Rempel, S. Erste Straßenbrücke aus Carbonbeton. In Proceedings of the 9th Carbon- und Textilbetontage, Dresden, Germany, 26–27 September 2017. [Google Scholar]
- Bielak, J.; Bergmann, S.; Hegger, J. Querkrafttragfähigkeit von Carbonbeton-Plattenbrücken mit C-förmiger Querkraftbewehrung—Theoretische und experimentelle Untersuchungen für zwei Straßenbrücken in Gaggenau. Beton-und Stahlbetonbau 2019, 114. [Google Scholar] [CrossRef]
- Homepage of the Project Carbon Concrete Composite. Available online: www.bauen-neu-denken.de (accessed on 21 March 2019).
- Jesse, F. Ermüdet Textilbeton? Verhalten unter nicht-ruhender Beanspruchung. In Proceedings of the 4th Anwendertagung Textilbeton, Dresden, Germany, 27–28 September 2012. [Google Scholar]
- Feix, J.; Hansl, M. Pilotanwendungen von Textilbeton für Verstärkungen im Brückenbau. In Proceedings of the 25th Dresdner Brückenbausymposium, Dresden, Germany, 9–10 March 2015; Curbach, M., Ed.; pp. 99–110. [Google Scholar]
- Schütze, E.; Lorenz, E.; Curbach, M. Static and Dynamic Fatigue Strength of Textile Reinforced Concrete. In Proceedings of the IABSE Conference, Nara, Japan, 13–15 May 2015; IABSE, Ed.; pp. 332–333. [Google Scholar]
- Holz, K.; Schütze, E.; Garibaldi, P.; Curbach, M. Determination of Material Properties of TRC under Cyclic Loads. ACI Spec. Publ. SP-ACI 549-01 2018, 324, 1–16. [Google Scholar]
- De Munck, M.; Tysmans, T.; Wastiels, J.; Kapsalis, P.; Vervloet, J.; El Kadi, M.; Remy, O. Fatigue Behaviour of Textile Reinforced Cementitious Composites and Their Application in Sandwich Elements. Appl. Sci. 2019, 9, 1293. [Google Scholar] [CrossRef]
- Wagner, J.; Holz, K.; Curbach, M. Zyklische Verbundversuche mit Carbonbeton. Beton-und Stahlbetonbau 2018, 113, 525–534. [Google Scholar] [CrossRef]
- Wagner, J.; Curbach, M. Tensile load bearing and Bond Behaviour of Carbon Reinforced Concrete under cyclic Loading. In Proceedings of the fib Congress, Melbourne, Australia, 7–11 October 2018; Foster, S., Gilbert, R., Mendis, P., Al-Mahaidi, R., Millar, D., Eds.; [Google Scholar]
- Solidian GmbH. Technical Data Sheet Solidian GRID Q95/95-CCE-38. 2017. Available online: https://www.solidian.com/fileadmin/user_upload/pdf/TDS/solidian_GRID_Q95.95-CCE-38.pdf (accessed on 14 May 2019).
- Schneider, K.; Butler, M.; Mechtcherine, V. Carbon Concrete Composites C3—Nachhaltige Bindemittel und Betone für die Zukunft. Beton-und Stahlbetonbau 2017, 112, 784–794. [Google Scholar] [CrossRef]
- DIN EN 196-1. Prüfverfahren für Zement–Teil 1: Bestimmung der Festigkeit; Deutsche Fassung EN 196-1:2016; Beuth: Berlin, Germany, November 2016. [Google Scholar]
- Bielak, J.; Scholzen, A.; Chudoba, R.; Schütze, E.; Schmidt, J.; Reichel, S. Prüfempfehlung zur Verwendung in C3—Beidseitiger Textilauszugversuche/Double Sided Textile Pull-Out (DPO). In Ergebnisbericht Vorhaben B3—Konstruktionsgrundsätze, Sicherheits-und Bemessungskonzepte sowie standardisierte Prüfmethoden für Carbonbeton; Research Report; TU Dresden: Dresden, Germany, 2016. [Google Scholar]
- Bielak, J.; Li, Y.; Hegger, J.; Chudoba, R. Numerical and Experimental Characterization of Anchorage Length for Textile Reinforced Concrete. In RILEM Bookseries 15, Proceedings of Strain-Hardening Cement-Based Composites (SHCC4), Dresden, Germany, 18–20 September 2017; Mechtcherine, V., Slowik, V., Kabele, P., Eds.; Springer: Berlin/Heidelberg, Germany, 2018; pp. 409–417. [Google Scholar]
- Schütze, E.; Bielak, J.; Scheerer, S.; Hegger, J.; Curbach, M. Einaxialer Zugversuch für Carbonbeton mit textiler Bewehrung/Uniaxial tensile test for carbon reinforced concrete with textile reinforcement. Beton-und Stahlbetonbau 2018, 113, 33–47. [Google Scholar] [CrossRef]
- Klausen, D. Festigkeit und Schädigung von Beton bei häufig wiederholter Beanspruchung. Ph.D. Dissertation, TU Darmstadt, Darmstadt, Germany, 1978. [Google Scholar]
- Balázs, G.L. Deformation based fatigue failure criterion. In, Localized Damage III—Computer-Aided Assessment and Control; Aliabadi, M.H., Carbinteri, A., Kaliszky, S., Cart-Wright, D.J., Eds.; Computational Mechanics Publications: Southampton, UK, 1994; pp. 631–638. [Google Scholar]
- Holmen, J.O. Fatigue of Concrete by Constant and Variable Amplitude Loading. Ph.D. Dissertation, University of Trondheim, Norwegian Institute of Technology, Division of Concrete Structures, Trondheim, Norway, 1979. [Google Scholar]
- Oneschkow, N. Analyse des Ermüdungsverhaltens von Beton anhand der Dehnungsentwicklung, 2nd ed.; Berichte aus dem Institut für Baustoffe, Heft 13; Institut für Baustoffe, Leibniz Universität Hannover: Hannover, Germany, 2016. [Google Scholar]
- Schütze, E.; Curbach, M. Zur experimentellen Charakterisierung des Verbundverhaltens von Carbonbeton mit Spalten als maßgeblichem Versagensmechanismus. Bauingenieur 2019, 94, 133–141. [Google Scholar]
- Lorenz, E. Endverankerung und Übergreifung textiler Bewehrungen in Betonmatrices. Ph.D. Dissertation, TU Dresden, Dresden, Germany, 2014. [Google Scholar]
Figure 1.
Carbon textile impregnated with epoxy resin.

Figure 2.
Manufacturing of the specimens: (a) Casting of huge panels; (b) Sawing out of specimens (exemplary cut).
Figure 2.
Manufacturing of the specimens: (a) Casting of huge panels; (b) Sawing out of specimens (exemplary cut).

Figure 3.
Test setup for static and cyclic double-sided textile pull-out (DPO) tests: (a) Specimen geometry; (b) Testing machine with specimen.
Figure 3.
Test setup for static and cyclic double-sided textile pull-out (DPO) tests: (a) Specimen geometry; (b) Testing machine with specimen.

Figure 4.
Maximum reached stresses in static double-sided textile pull-out (DPO) tests with different anchorage lengths.
Figure 4.
Maximum reached stresses in static double-sided textile pull-out (DPO) tests with different anchorage lengths.

Figure 5.
Cyclic stress–deformation curves (here: anchorage length = 3a; σmin/σmax = 30%/90%): (a) non-failed specimen; (b) failed specimen (load cycles: 57733).
Figure 5.
Cyclic stress–deformation curves (here: anchorage length = 3a; σmin/σmax = 30%/90%): (a) non-failed specimen; (b) failed specimen (load cycles: 57733).

Figure 6.
Comparison of cyclic creep curves of a failed and a non-failed specimen (here: anchorage length = 4a; σmin/σmax = 30%/95%).
Figure 6.
Comparison of cyclic creep curves of a failed and a non-failed specimen (here: anchorage length = 4a; σmin/σmax = 30%/95%).

Figure 7.
Comparison of normalized cyclic creep curves depending on the load level (here: anchorage length = 3a): (a) 30% minimum stress; (b) 50% minimum stress.
Figure 7.
Comparison of normalized cyclic creep curves depending on the load level (here: anchorage length = 3a): (a) 30% minimum stress; (b) 50% minimum stress.

Figure 8.
Comparison of normalized cyclic creep curves depending on the amplitude (here: anchorage length = 3a).
Figure 8.
Comparison of normalized cyclic creep curves depending on the amplitude (here: anchorage length = 3a).

Figure 9.
Comparison of normalized cyclic creep curves of different anchorage lengths at similar load level (here: σmin/σmax = 50%/85%).
Figure 9.
Comparison of normalized cyclic creep curves of different anchorage lengths at similar load level (here: σmin/σmax = 50%/85%).

Figure 10.
Determination of the secant modulus.

Figure 11.
Comparison of the normalized development of the secant modulus depending on the amplitude (here: anchorage length = 3a).
Figure 11.
Comparison of the normalized development of the secant modulus depending on the amplitude (here: anchorage length = 3a).

Figure 12.
Comparison of the normalized development of the secant modulus of different anchorage lengths at similar load level (here: σmin/σmax = 50%/85%).
Figure 12.
Comparison of the normalized development of the secant modulus of different anchorage lengths at similar load level (here: σmin/σmax = 50%/85%).

Figure 13.
S-N diagram with relative maximum stresses for DPO tests with different anchorage lengths and two different minimum stresses.
Figure 13.
S-N diagram with relative maximum stresses for DPO tests with different anchorage lengths and two different minimum stresses.

Figure 14.
S-N diagram with absolute maximum stresses for DPO tests with different anchorage lengths.
Figure 14.
S-N diagram with absolute maximum stresses for DPO tests with different anchorage lengths.

Figure 15.
Comparison of residual and reference stresses: (a) 30% minimum stress; (b) 50% minimum stress.
Figure 15.
Comparison of residual and reference stresses: (a) 30% minimum stress; (b) 50% minimum stress.

Figure 16.
Comparison of textile stresses and failure mechanisms in reference and residual strength tests with different anchorage lengths.
Figure 16.
Comparison of textile stresses and failure mechanisms in reference and residual strength tests with different anchorage lengths.

Table 1.
Experimental program.
| Anchorage Length | Number of Tested (Evaluated *) Specimens at Load Level σmin/σmax [%] | ||||
|---|---|---|---|---|---|
| 30/90 | 30/95 | 50/70 | 50/85 | 50/90 | |
| 1a | 4 (3) | 4 (2) | 4 (2) | 4 (2) | 4 (3) |
| 2a | 4 | 4 (3) | 4 | 4 | 4 (3) |
| 3a | 4 | 4 | 4 | 4 | 4 |
| 4a | 4 | 4 | 4 | 4 | 4 |
* If different to number of tested specimens.
© 2019 by the authors. Licensee MDPI, Basel, Switzerland. This article is an open access article distributed under the terms and conditions of the Creative Commons Attribution (CC BY) license (http://creativecommons.org/licenses/by/4.0/).
Share and Cite
MDPI and ACS Style
Wagner, J.; Curbach, M. Bond Fatigue of TRC with Epoxy Impregnated Carbon Textiles. Appl. Sci. 2019, 9, 1980. https://doi.org/10.3390/app9101980
AMA Style
Wagner J, Curbach M. Bond Fatigue of TRC with Epoxy Impregnated Carbon Textiles. Applied Sciences. 2019; 9(10):1980. https://doi.org/10.3390/app9101980
Chicago/Turabian StyleWagner, Juliane, and Manfred Curbach. 2019. "Bond Fatigue of TRC with Epoxy Impregnated Carbon Textiles" Applied Sciences 9, no. 10: 1980. https://doi.org/10.3390/app9101980
Note that from the first issue of 2016, this journal uses article numbers instead of page numbers. See further details here.