Simulation Model and Method for Active Torsional Vibration Control of an HEV

School of Automotive and Transportation Engineering, Hefei University of Technology, Hefei 230009, China
*
Author to whom correspondence should be addressed.
Appl. Sci. 2019, 9(1), 34; https://doi.org/10.3390/app9010034
Submission received: 20 November 2018
/
Revised: 14 December 2018
/
Accepted: 17 December 2018
/
Published: 22 December 2018
(This article belongs to the Section Acoustics and Vibrations)
Abstract
:Featured Application
The active torsional vibration control method proposed in this paper can effectively reduce longitudinal jerk and weaken the degree of resonance without changing the structure of the hybrid electric vehicle powertrain system. It is more convenient than optimizing the spring stiffness of the torsional damper/clutch. The method is also applicable to the hybrid powertrain system including the motor in the field of engineering machinery.
Abstract
Hybrid electric vehicles (HEV) might cause new noise vibration and harshness (NVH) problems, due to their complex powertrain systems. Therefore, in this paper, a new longitudinal dynamic simulation model of a series-parallel hybrid electric bus with an active torsional vibration control module is proposed. First, the schematic diagrams of the simulation model architecture and the active control strategy are given, and the dynamic models of the main components are introduced. Second, taking advantage of the characteristics of hybrid systems, a method of determining the key dynamic parameters by a bench test is proposed. Finally, in a typical bus-driving cycle for Chinese urban conditions, time domain and frequency domain processing methods are used to analyze vehicle body jerk, fluctuation of rotational speed, and torsional angle of the key components. The results show that the active control method can greatly improve the system’s torsional vibration performance when switching modes and at resonance.
1. Introduction
1.1. Motivations and Technical Challenges
Hybrid electric vehicles (HEV) have been widely adopted by the automotive industry as a practical solution to increasing fuel efficiency and extending driving range [1,2,3,4,5,6,7,8]. However, because the configuration is more complicated, if the design is not properly executed torsional vibration problems are more likely to occur, such as torsional damper damage and broken shafts, but it also provides a new means for torsional vibration control [9,10,11]. To develop a hybrid system with excellent performance and improve the powertrain configuration quickly and at low cost, simulation analysis is indispensable. Therefore, accurate kinetic parameters and control performance parameters for critical components are required in a closed drivetrain. Another research hotspot is concerned with how to add the torsional vibration active control module under the original driving and energy management control strategy.
1.2. Literature Review
The literature shows that for low-frequency vibration and control, the 16-degree-of-freedom model based on previous work can be simplified to a three-mass model without substantially changing the low natural frequencies of the system [12]. Dinh [13] proposed a simple mathematical model to describe the dynamic response of the engine start–stop process, which only requires a small data set for parameterization.
Models used to characterize the nonlinear characteristics of engine torque mainly include single-cylinder, mean value, and MAP models based on bench test data [14,15,16,17,18]. The single-cylinder model theoretically describes the real-time output torque of the engine clearly, but most of the model parameters have not been verified. The other two models give the average value of the engine’s real-time output, which cannot reflect instantaneous fluctuation of the torque.
Motor output torque fluctuations are mainly composed of electromagnetic torque and cogging torque. Compared with the engine, the fluctuation amplitude of the motor output torque is small, and it is often studied by analytical and finite element methods [19,20,21]. Its mean value can also be obtained from the controller area network (CAN) bus through the controller. Due to the delay between the controller and the actuator, there is a lag in the response of the motor or engine. This time delay affects the dynamic performance of the drivetrain, including comfort during mode switching, or the effect of active vibration control [11,22].
In the field of active torsional vibration control, the main method is to estimate the amplitude and phase of the target position torque fluctuation through the real-time status of the system. This can be done using the mode-switching signal, the real-time torsional angle, and the speed of each component using an active actuator to compensate the corresponding torque for reducing system torsional vibration [22,23,24,25,26,27,28,29,30,31]. For example, the motor compensation torque can be determined by proportion integration (PI) control [23] or sliding mode control [24] to reduce system vibration by measuring the difference in rotational speed. Ni Chengqun et al. [25] employed fuzzy adaptive proportion integration differentiation (PID) control for engine speed and dynamic torque compensation control, which effectively suppressed the longitudinal degree of jerk during transition from motor–drive to engine–drive and engine–motor–drive. Walker et al. [26] compared traditional vehicles and HEVs, showing that rapid motor response using PID algorithms can greatly reduce vibration during the shifting process. Aiming at the vibration problem caused by time-varying delay characteristics of CAN-bus data transmission, Zhang Hui et al. [22] proposed a robust energy-peak controller to reduce the vibration of the integrated motor–transmission system. Vadamalu and Beid et al. [27] established a predictive model of the power system based on component characteristics and ensured smoothness of power output and vehicle speed by controlling motor torque. Yin Chengliang et al. [28] designed a robust controller based on the mu-synthesis method to reduce vehicle jerk during HEV mode transitions, and a hardware-in-the-loop (HIL) simulation was performed to verify the proposed controller. Li Liang et al. [29] designed an adaptive controller which used the fast response characteristics of the motor and the coordinated control of the engine and clutch to smooth the mode switching process. Awadallah et al. [9] improved shift quality for the P3 HEV using the motor torque compensation method. Wilbanks and Michael [30] used motor output torque composed of a linear combination of constant and time-varying components to offset the nonlinear response of the engine, thereby reducing vibration during engine restart.
1.3. Original Contributions
In our previous work [10,11,31], a seven-degree-of-freedom dynamic model of a series-parallel hybrid powertrain and a 40 s simulation condition were established to study torsional vibration characteristics under various working conditions. We reduced torsional vibration of an auxiliary power unit (APU) during engine cranking by optimizing the spring stiffness of the torsional damper and using an active PID control strategy.
In this paper, our primary target is to establish a simplified, accurate dynamic model to provide a basis for vibration control of a series-parallel hybrid system under actual cycle conditions. There are two original contributions that clearly distinguish our effort from the aforementioned studies:
(1) Considering the relationship between the energy management strategy and the torsional vibration active control module from the vehicle control system level, the bus driving speed cycle typical for a Chinese city is used to analyze the effects of the active control strategy under multiple modes.
(2) Bench testing is used to identify the dynamic parameters of the important components, and the accuracy of the simulation model is verified by the characteristic working condition test.
2. Materials and Methods
2.1. Structure and Working Principles of a Series-Parallel Hybrid System
2.1.1. Structure
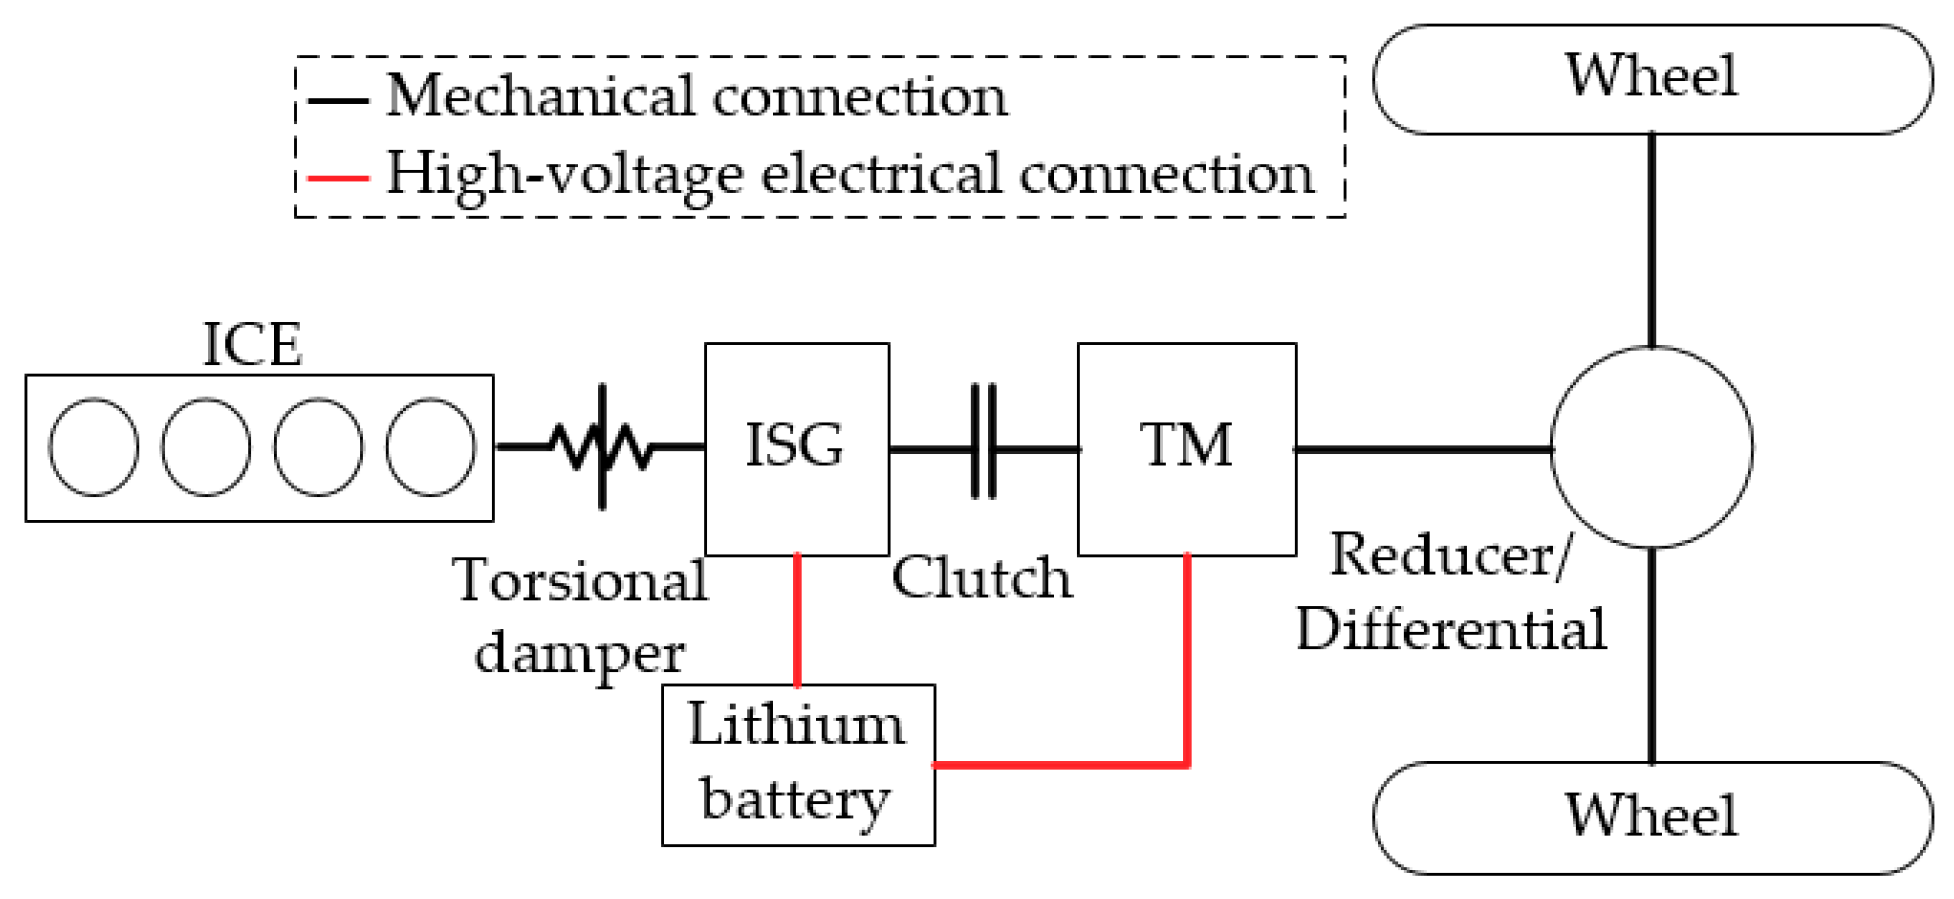
The schematic diagram of the hybrid electric bus studied in this paper is shown in Figure 1. It consists of a six-cylinder diesel internal combustion engine (ICE), two permanent magnet synchronous motors (PMSM): integrated starter generator (ISG) and traction motor (TM), and a torsional damper. System mode switching is achieved by the clutch. The main components and parameters of the hybrid system are shown in Table 1.
2.1.2. Energy Management Strategy
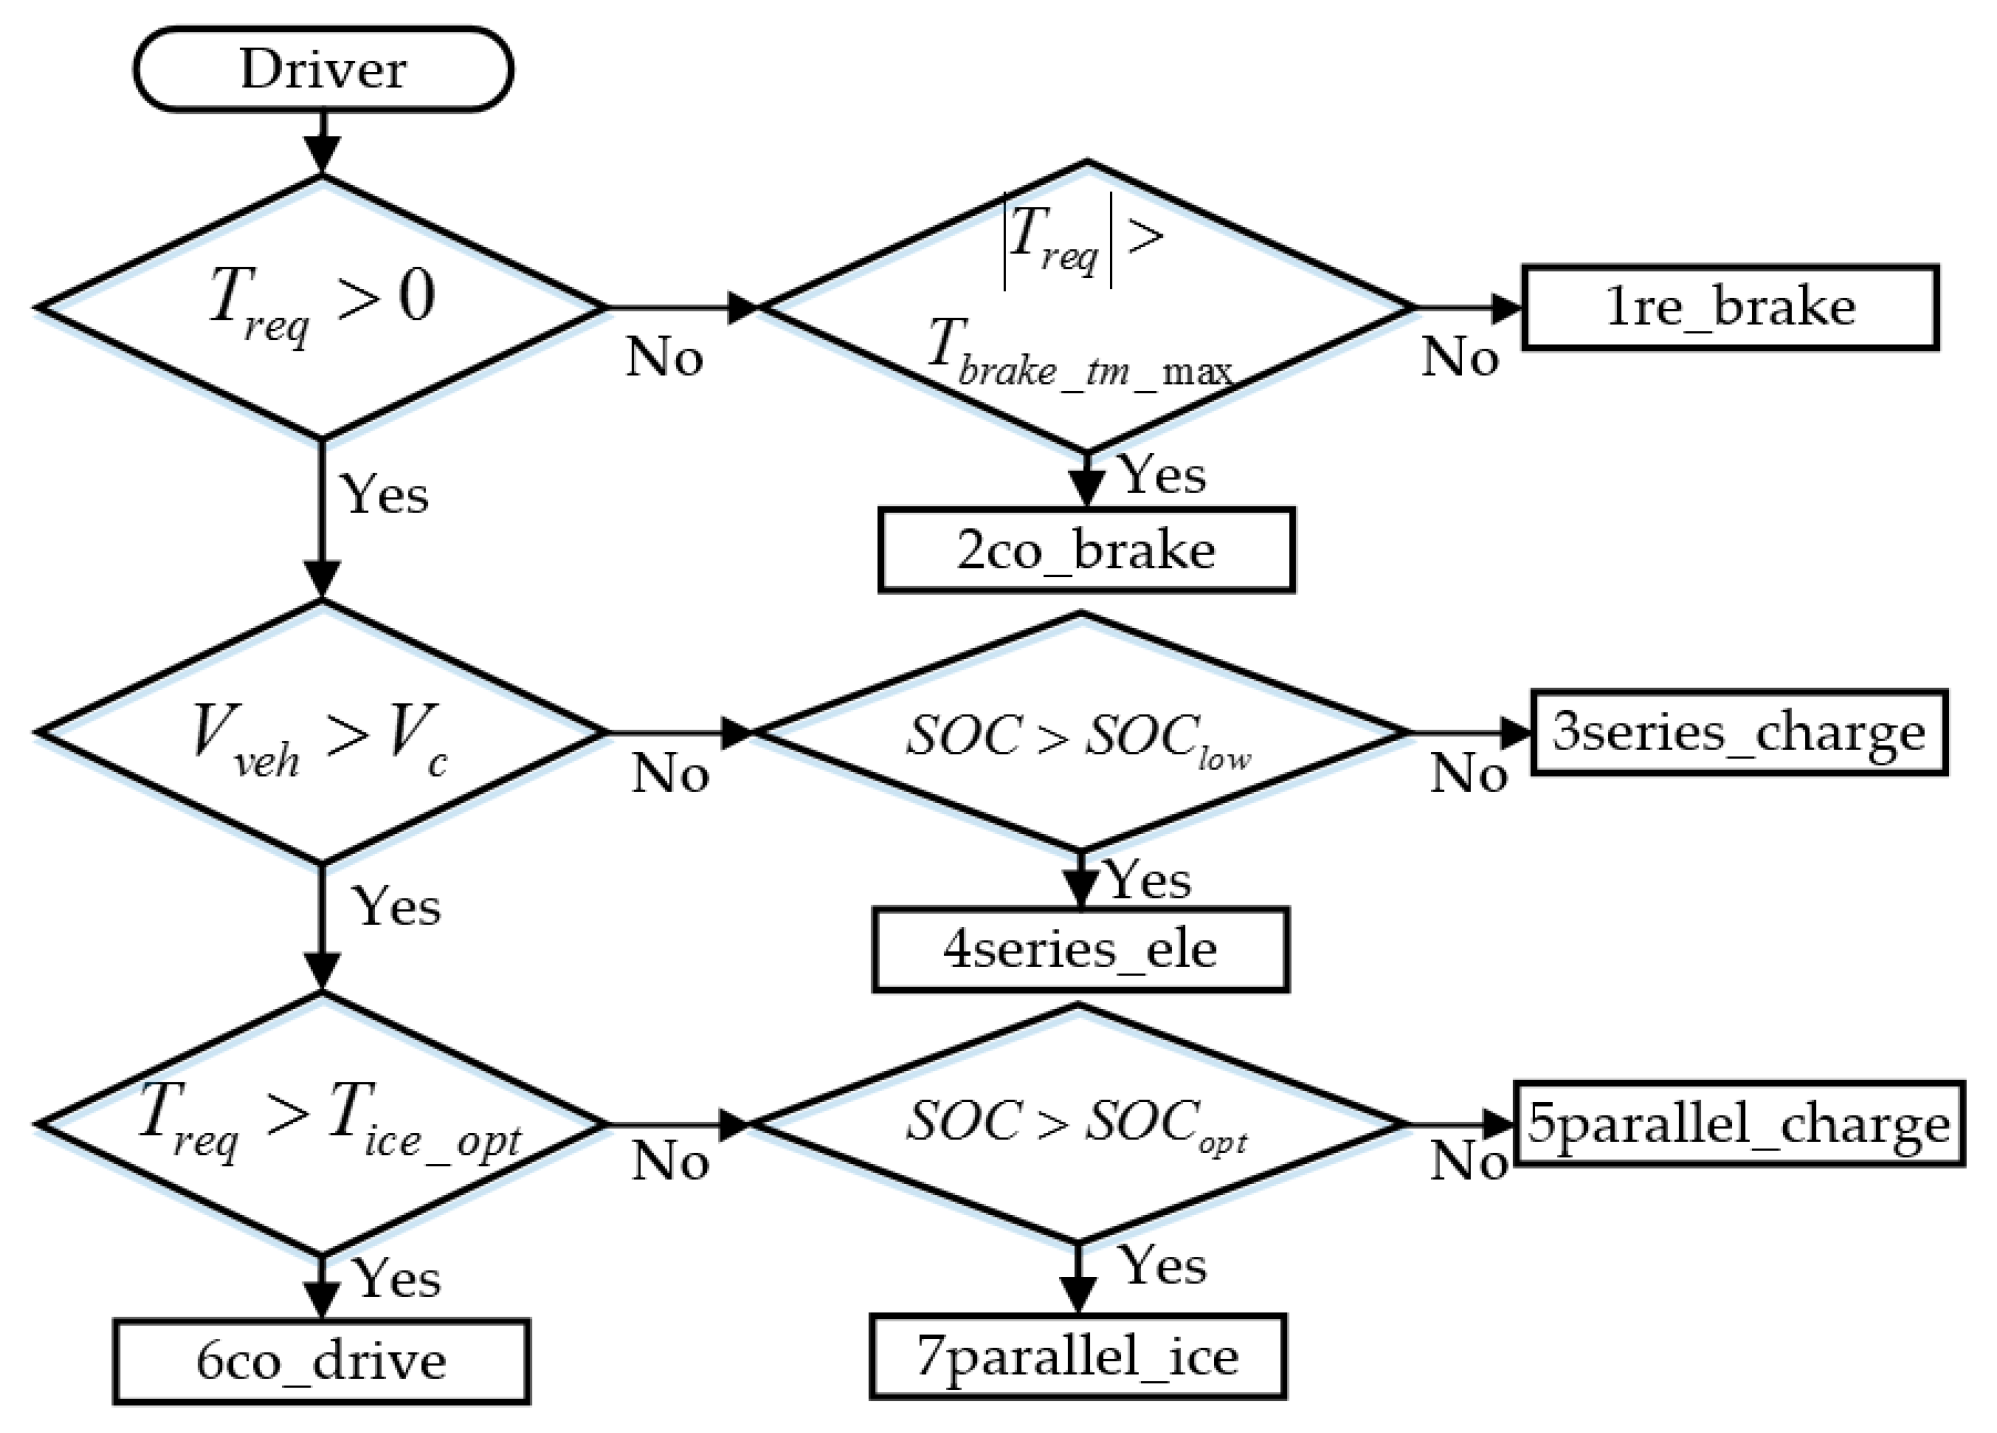
This paper employs a rule-based logic threshold energy management strategy, as shown in Figure 2. , , and represent vehicle real-time demand torque, maximum regenerative braking torque, and engine real-time optimal torque; and are the real-time vehicle speed and mode switching speed threshold; and , and are the real-time state of the battery, the low and high state of charge thresholds, respectively. The strategy is based on the torque demand, vehicle speed, and battery real-time values as the logical judgment value of mode switching. The vehicle’s operation is roughly divided into seven modes: regenerative braking, common braking, series power generation, pure electric, parallel power generation, combined drive, and parallel engine drive. At the combined drive mode, the output torque is provided by the engine and the TM. However, during the parallel engine drive, the output torque is provided only by the engine.
2.1.3. Torsional Vibration Active Control System
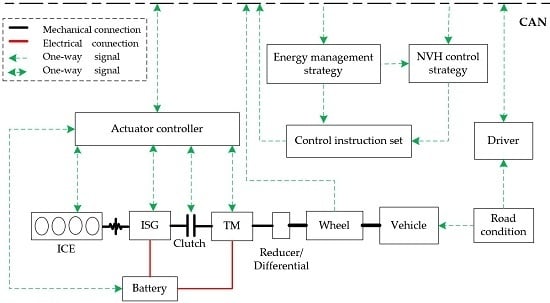
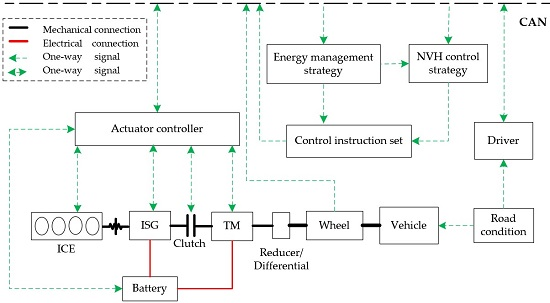
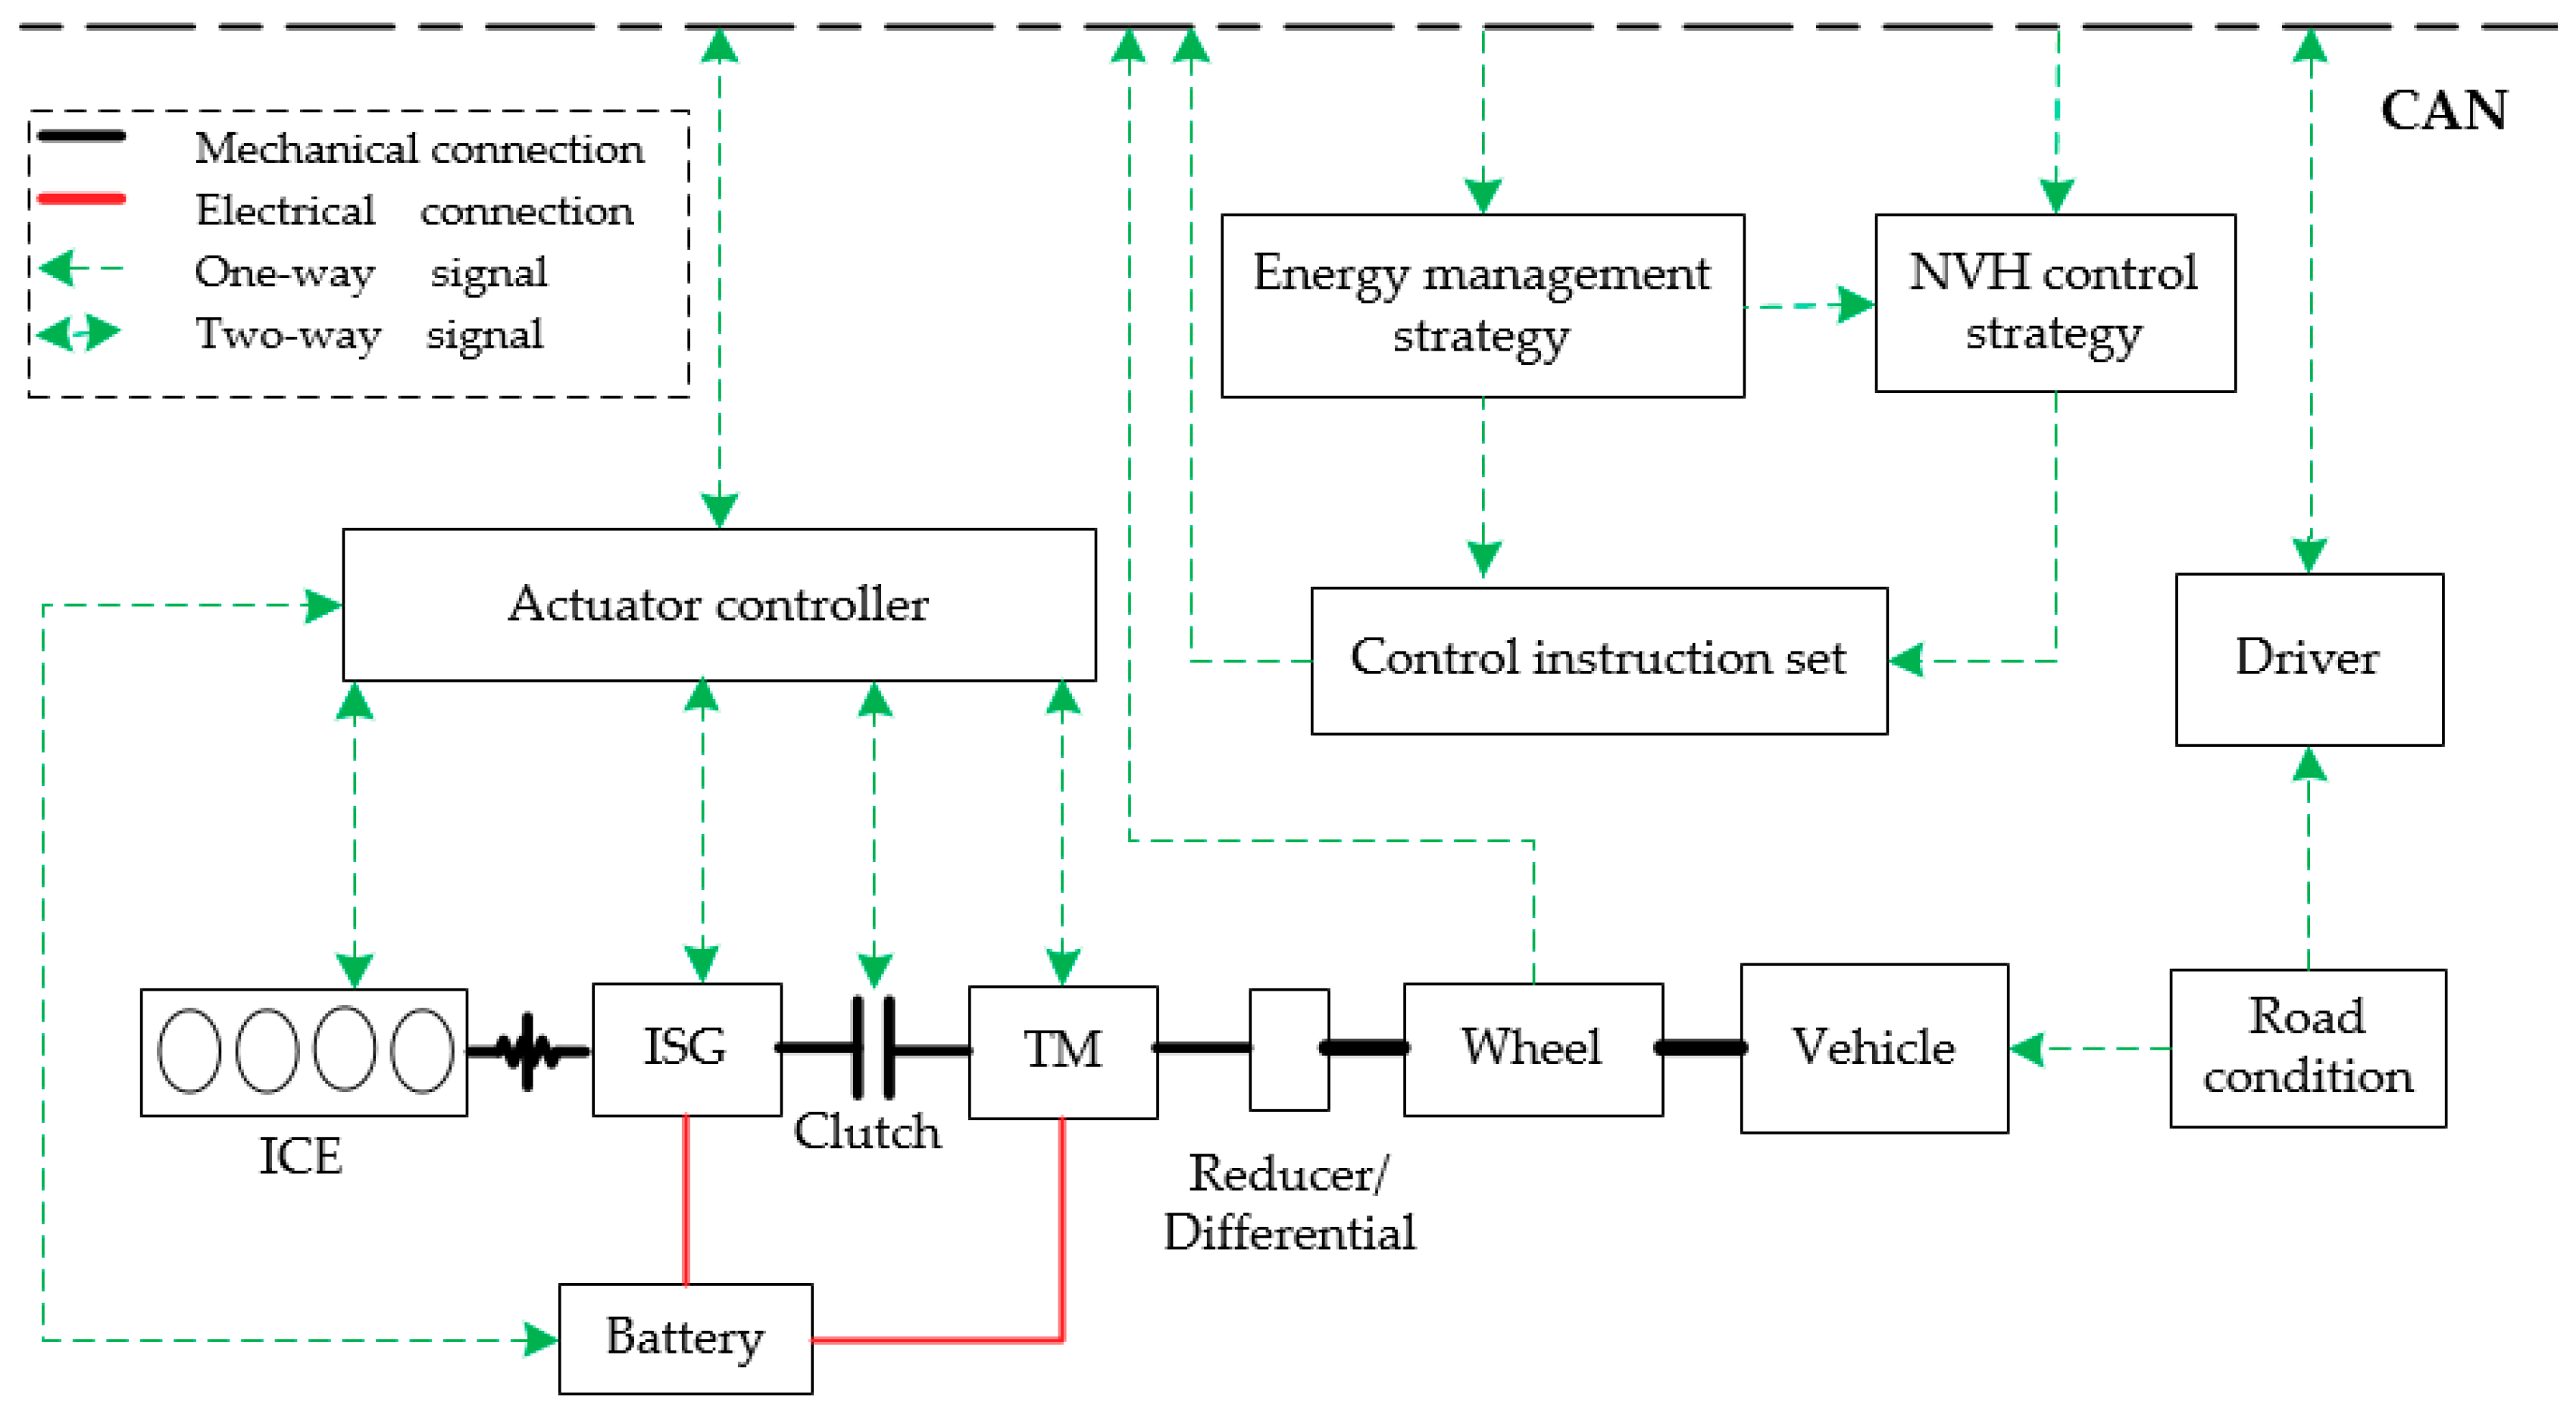
In this paper, the torsional vibration active control module is added to the original vehicle control system. The hierarchical position in the simulation platform is shown in Figure 3, and the specific control strategy logic is shown in Figure 4.
When the vehicle is running, the driver operates the accelerator pedal or the brake pedal according to road conditions and the state of the vehicle. Using this input and the information measured by the vehicle control system, an instruction set is sent to each component actuator, and the corresponding actions are performed.
The specific logic of the active torsional vibration control strategy is: Through controller and driver behavior, a real-time working mode can be obtained, and future mode switching can be predicted thereby predicting the system’s excitation signal or future large disturbance signals. With the real-time status information of the vehicle collected by the sensors, the state observer or estimator can be designed to estimate the key position torque fluctuation, angular acceleration, and speed signals that cannot be obtained by the sensors. Based on this real-time information, an active control strategy controls the torsional vibration using the engine, motors, and clutch. In this paper, we select the existing speed sensors, for example, based on the Hall sensor to measure the engine crankshaft front/flywheel and the wheel, based on the resolver to measure the angle and speed of the two motors.
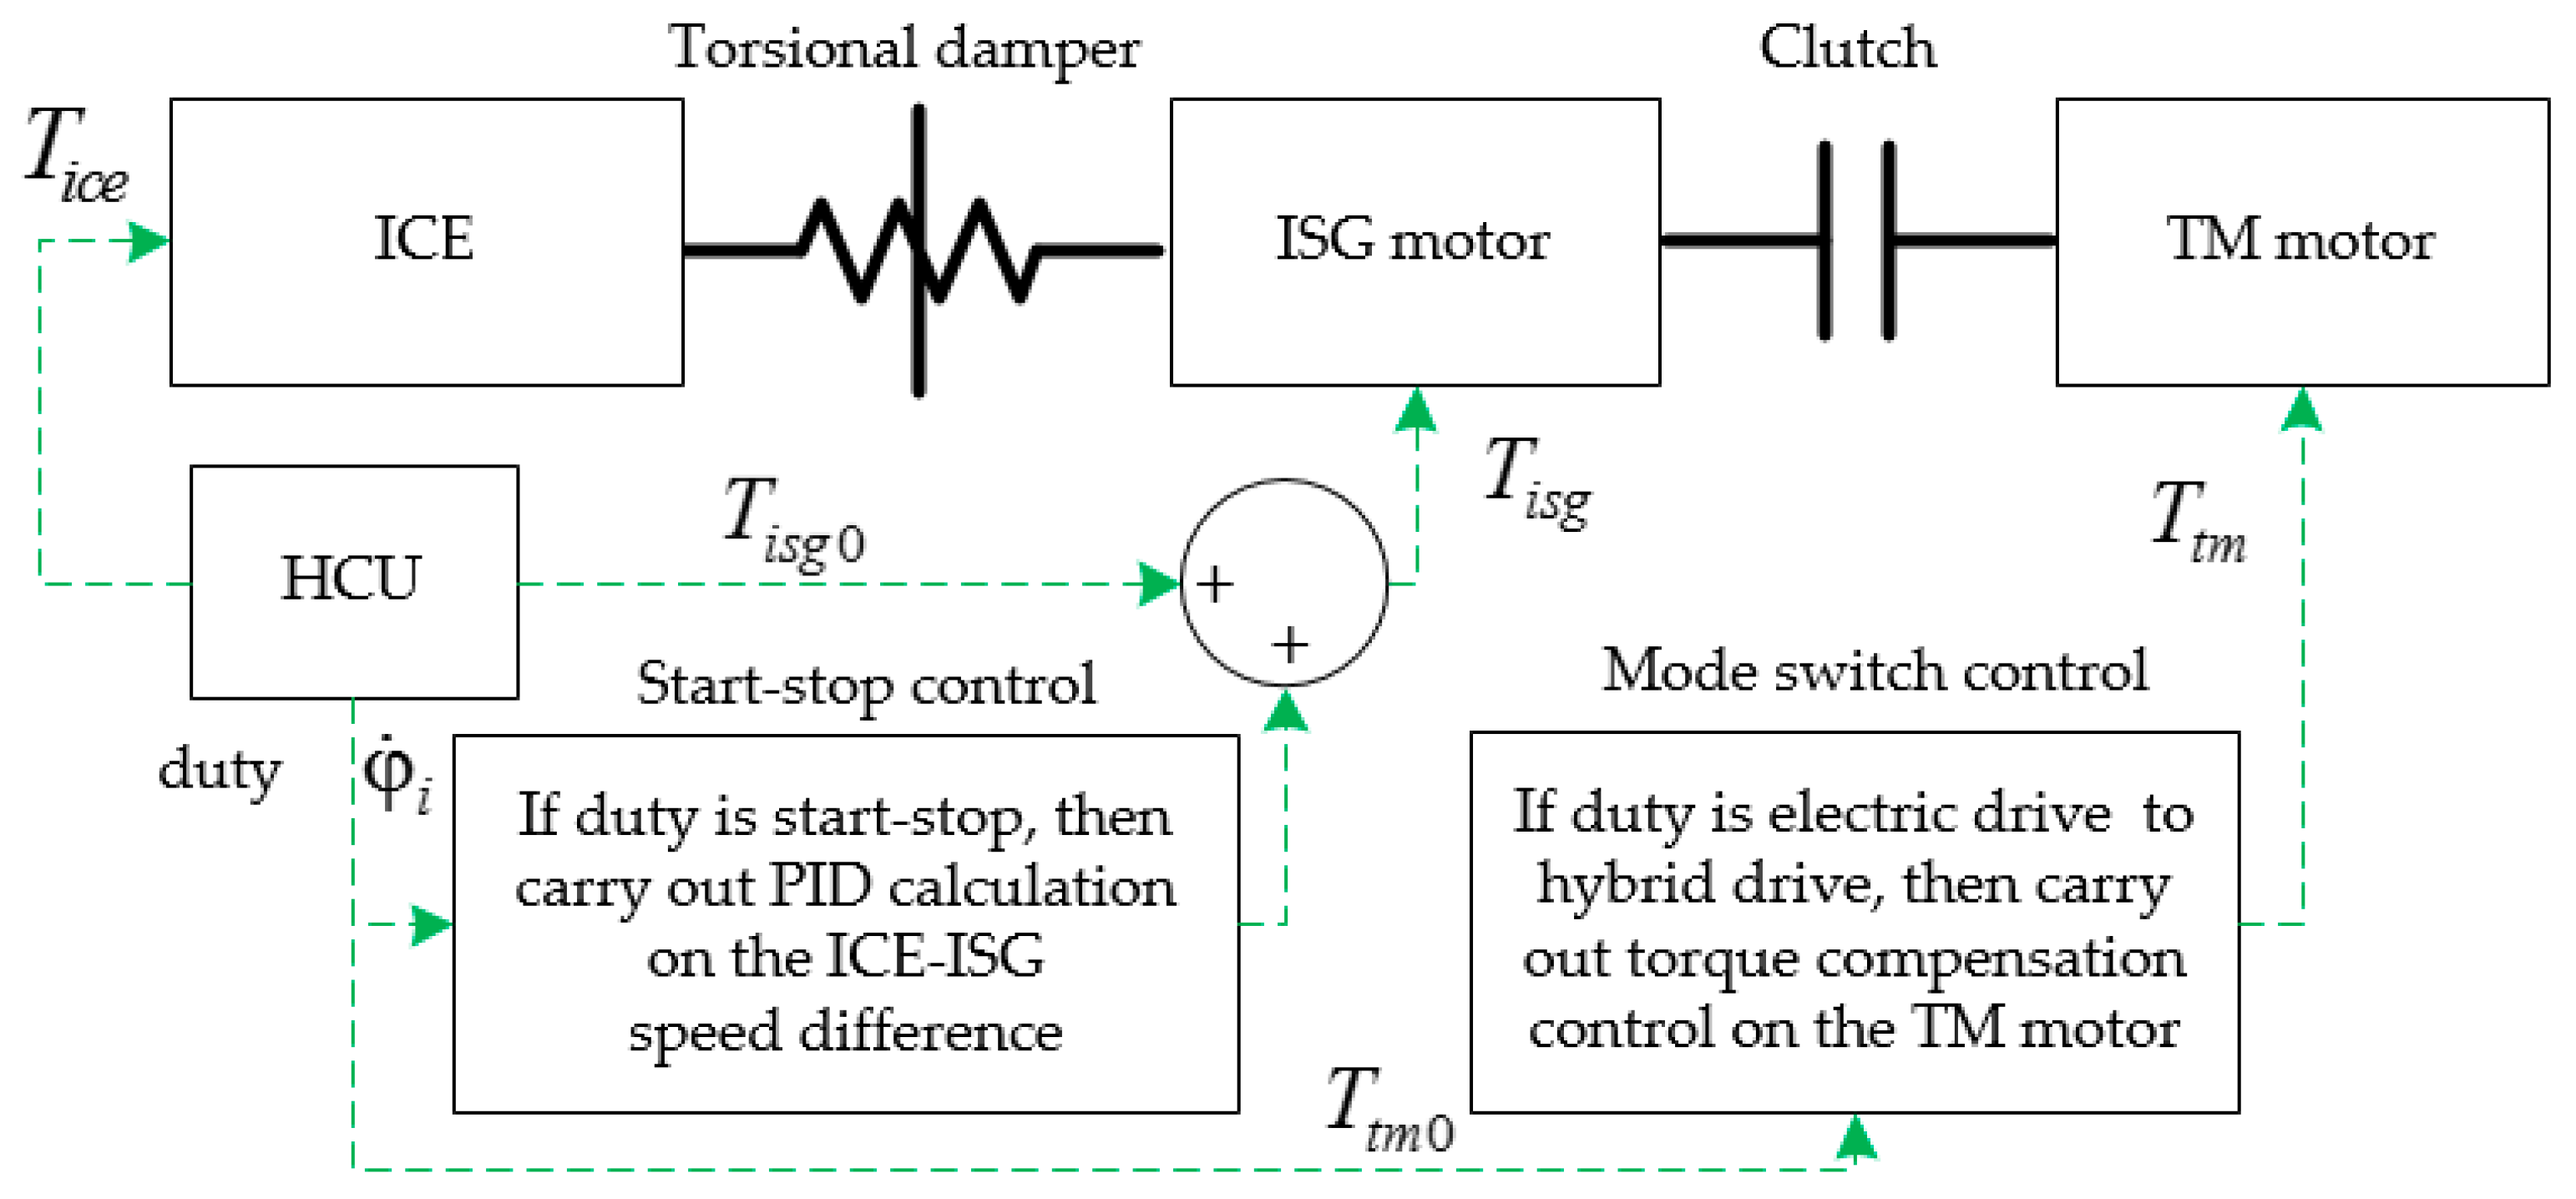
The active control method employed in this paper is: During the start and stop mode of the APU, PID calculation is performed on the engine–ISG speed difference, and the ISG motor output torque is actively controlled to reduce the resonance degree. When switching from pure electric drive mode to hybrid drive mode, the angular acceleration fluctuation of the TM is monitored in real time, and the reverse torque of the TM is output to reduce the switching impact. The specific method is shown in Figure 5:
The PID active control method and control parameter selection in the start–stop process are mainly based on the literature [11]. When the mode is switched, this paper uses the amplitude of the angular acceleration of the TM and multiplies it by its own moment of inertia as the compensation torque.
2.2. Torsional Vibration Dynamics Model of Hybrid Powertrain System
2.2.1. Engine Dynamics Model
According to the single-cylinder model, the gas torque and the reciprocating moment of inertia are derived, and the frequency components are accurate. However, some simplifications in the theoretical derivation process, such as the compression–expansion as a closed adiabatic process and the negation of the late-intake angle and the exhaust advance angle, result in an actual cylinder pressure being lower than the theoretical value during a cycle. Therefore, the theoretical amplitude of the above torque may be significantly different from the actual one. Thus, for the gas torque, this paper introduces a correction coefficient in the expression [31], and improves the calculation accuracy of the model for the torque amplitude by means of the bench test data.
where, is the newly introduced gas torque correction coefficient, is the standard atmospheric pressure, is the real-time cylinder pressure, and is the piston position. The engine structural size parameters include the piston diameter , the connecting rod swing angle , the crank angle , the crankshaft radius , length of connecting rod , and equivalent piston mass . The friction torque is based on the equation of engine speed based on bench test data, which is given by
2.2.2. TM/ISG Dynamics Model
The vehicle uses two permanent magnet synchronous motors, consisting of a stator and a rotor with eight pole pairs. In the transmission system, the motor shaft length is short, the material is steel, and the rigidity is relatively large, so the motor is simplified into a centralized mass model. The stator and the front/rear axles constitute the moment of inertia of the motor, and the uniform distribution of the mass of the motor system along the direction of rotation and the moment of inertia is not time-varying, so the moment of inertia of the motor is considered to be constant. (For example, the piston connecting rod system of an engine has a time-varying equivalent moment of inertia because its position changes with respect to the center of rotation of the crankshaft during operation.)
Considering the motor torque response characteristics as first-order inertia, we can derive:
In the formula, is the target reference value of the motor output torque, is the motor torque response time, is the total harmonic torque of the motor, is the main harmonic of the motor torque fluctuation, is the order amplitude of the torque fluctuation, is the motor pole pair, is the motor speed (r/min), and is the initial rotation angle. According to the literature [17], the motor torque fluctuation amplitude is usually within 10% of the target torque, and the main harmonics include the 6th and 9th order, and 6th order is more significant. In this paper is set to 6 and 9, and the amplitudes used are 10% and 4% of , respectively.
2.2.3. Other Components’ Dynamics Models
The remaining components include the final drive, differential, half shaft, wheels, and the vehicle body. Since the motor and the final drive/differential connection shaft and the gear meshing rigidity are large, we model them as a single rigid part. The half shaft is relatively slender, so it is equivalent to a spring with a high stiffness compared with the spring stiffness of the torsional damper or the clutch in the drivetrain, and its equivalent moment of inertia is equally distributed to the front and rear components. In the wheels, since the tire is composed of rubber and gas, rigidity is low, and it is equivalent to a tangential spring and a damping member, which connect to the hub and the vehicle body with an equivalent moment of inertia.
In summary, the torsional vibration dynamics model of the HEV power transmission system is shown in Figure 6:
2.3. Dynamic Parameters Determination
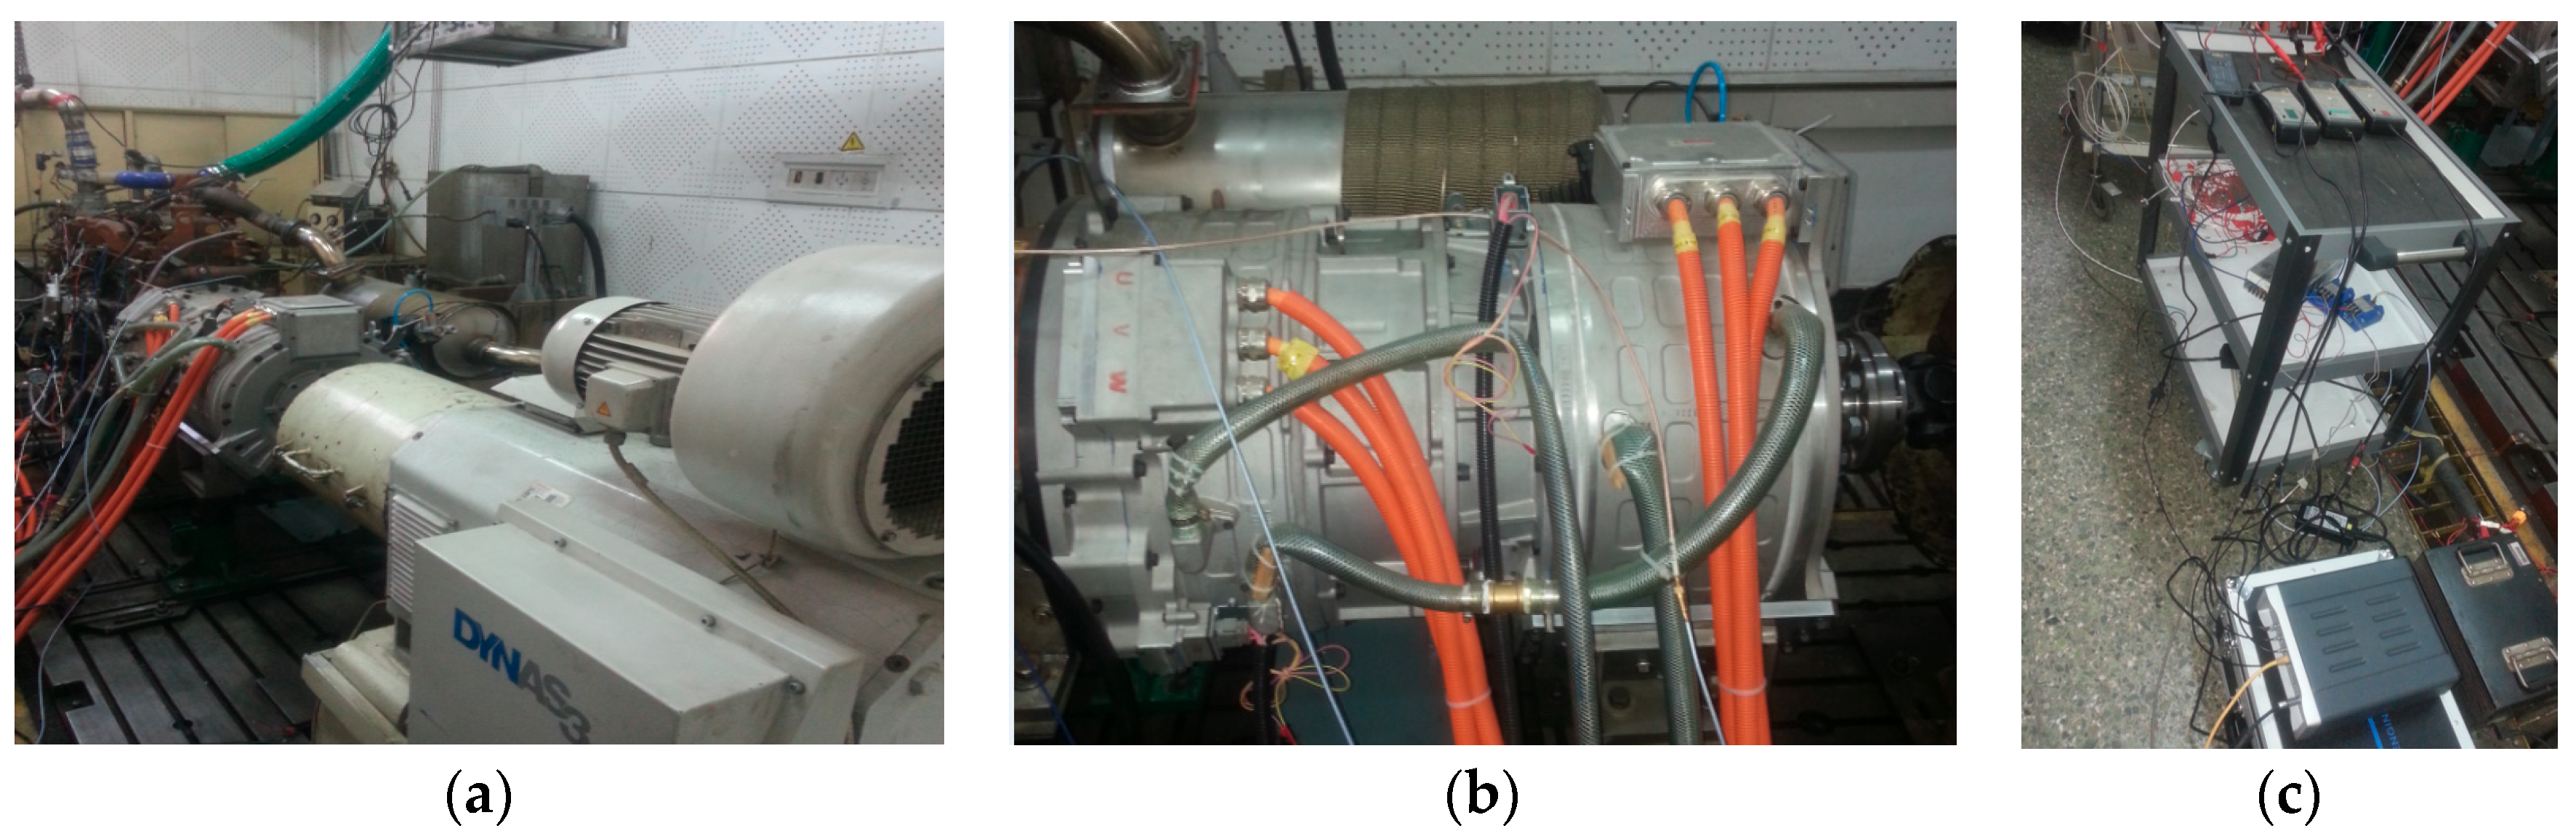
2.3.1. Bench Testing System
The bench test system mainly includes an engine, a torsional damper, a clutch, and a dual-motor system (Figure 7). The output shaft of the TM motor is connected to the dynamometer through a torque flange sensor.
2.3.2. Parameter Determination Method
This section will recognize and correct the engine moment of inertia, engine excitation torque, and motor torque response time. The main steps are as follows: (1) According to the relationship between torque, moment of inertia, and angular acceleration, the engine’s moment of inertia can be identified by simple acceleration and deceleration conditions. (2) Measure the real-time angular deceleration of the engine under the APU system coast down condition, and then calculate the real- time resistance torque. The friction resistance torque can be fitted by smoothing out the fluctuation components of the periodic gas torque and inertia moment. (3) Adjust the correction coefficient of gas torque Z1 by using a cylinder pressure sensor to obtain the real-time cylinder pressure under different operating conditions of the engine. (4) Motor torque response time can be identified by observing the change of the step torque of the motor output.
To this end, the following assumptions are introduced:
First, according to the literature [32,33], in the case of high-speed, axial, and radial heavy-duty roller bearings, frictional torque is mostly in the range of 0.01 to 5.00 Nm. The engine resistance torque is usually 30 to 200 Nm. Since the difference between the two is 2 to 3 orders of magnitude, it is assumed that the rolling resistance at the motor bearing is negligible relative to the engine resistance torque.
Second, the moment of inertia of the drive system outside the engine is mainly from regular shaped components, such as the rotor of the motor, clutch, and connecting shaft, for which exact values can be provided by the supplier.
2.3.3. Engine Moment of Inertia Determination
One way to identify the moment of inertia is to measure the angular acceleration value of the rotating component during acceleration or deceleration and the torque it receives, then use the formula to calculate it. The drive system is subject to various time-varying resistance torques, such as engine frictional resistance torque, during actual operation. To ensure the successful implementation of the above test method, the acceleration curve of the coast down process is subtracted from the acceleration process at the same speed, resulting in the acceleration curve under constant torque.
Assuming that the moment of inertia of the engine is , the total moment of inertia of the motor and other rotating components is , thus, dynamic equations of the acceleration and deceleration of the powertrain can be expressed as:
where and are the lengths of time for acceleration and natural-stopping deceleration processes; , , , are the motor output torque in the acceleration process, the total resistance torque of the system, and the angular acceleration of the engine and the motor; and are the angular acceleration of the engine and motor in the deceleration process, respectively.
Whether in the acceleration or deceleration phase, the real-time resistive torque experienced by the system can be refined to:
where is the total resistance torque of the system, including the resistance torque of the engine and the motor and is the friction coefficient of the motor, which is approximated as 0 according to the assumptions in this section.
The independent variables of the state quantities in Equations (6) to (8) are converted from time to rotational speed, and Equation (7) is subtracted from Equation (6) to get:
where , , , , and are the motor output torque and the engine’s and the motor’s angular accelerations during both the acceleration and deceleration process in the speed coordinate. These parameters can be obtained by experimental measurement. According to the assumptions, is known, so can be found by Equation (9).
2.3.4. Engine Excitation Torque Parameter Correction
According to Equation (7), the resistance torque can be calculated under coast down conditions. Then the corresponding relationship between and can be obtained by combining from measurement in the speed coordinate. By smoothing , the periodic gas torque and the moment of inertia fluctuation can be filtered out, then the relationship between the engine frictional resistance torque and the rotational speed can be fitted.
The gas torque correction factor , can be obtained by collecting the real-time cylinder pressure and comparing it with the theoretical value. It is usually divided into two conditions: engine start–stop process without combustion and normal combustion work.
2.3.5. Motor Torque Response Time Identification
Through bench testing or real vehicle testing, giving the motor a target output torque value, when is equal to one , then according to Equation (4), Therefore, can be found by observing the real-time output torque rise curve of the motor.
3. Results
The main parameters obtained by applying the method proposed in this paper are as shown in Table 2 and Equations (10) and (11):
In this paper, eight groups of tests were done to measure the identified engine moment of inertia with a standard deviation of 0.03 kg·m2 and a relative error of 0.82%. The average torque response time of 12 sets of ISG motors is 0.069 s, the standard deviation is 0.004 s, the relative error is 5.5%.
The engine moment of inertia determination procedure is detailed below:
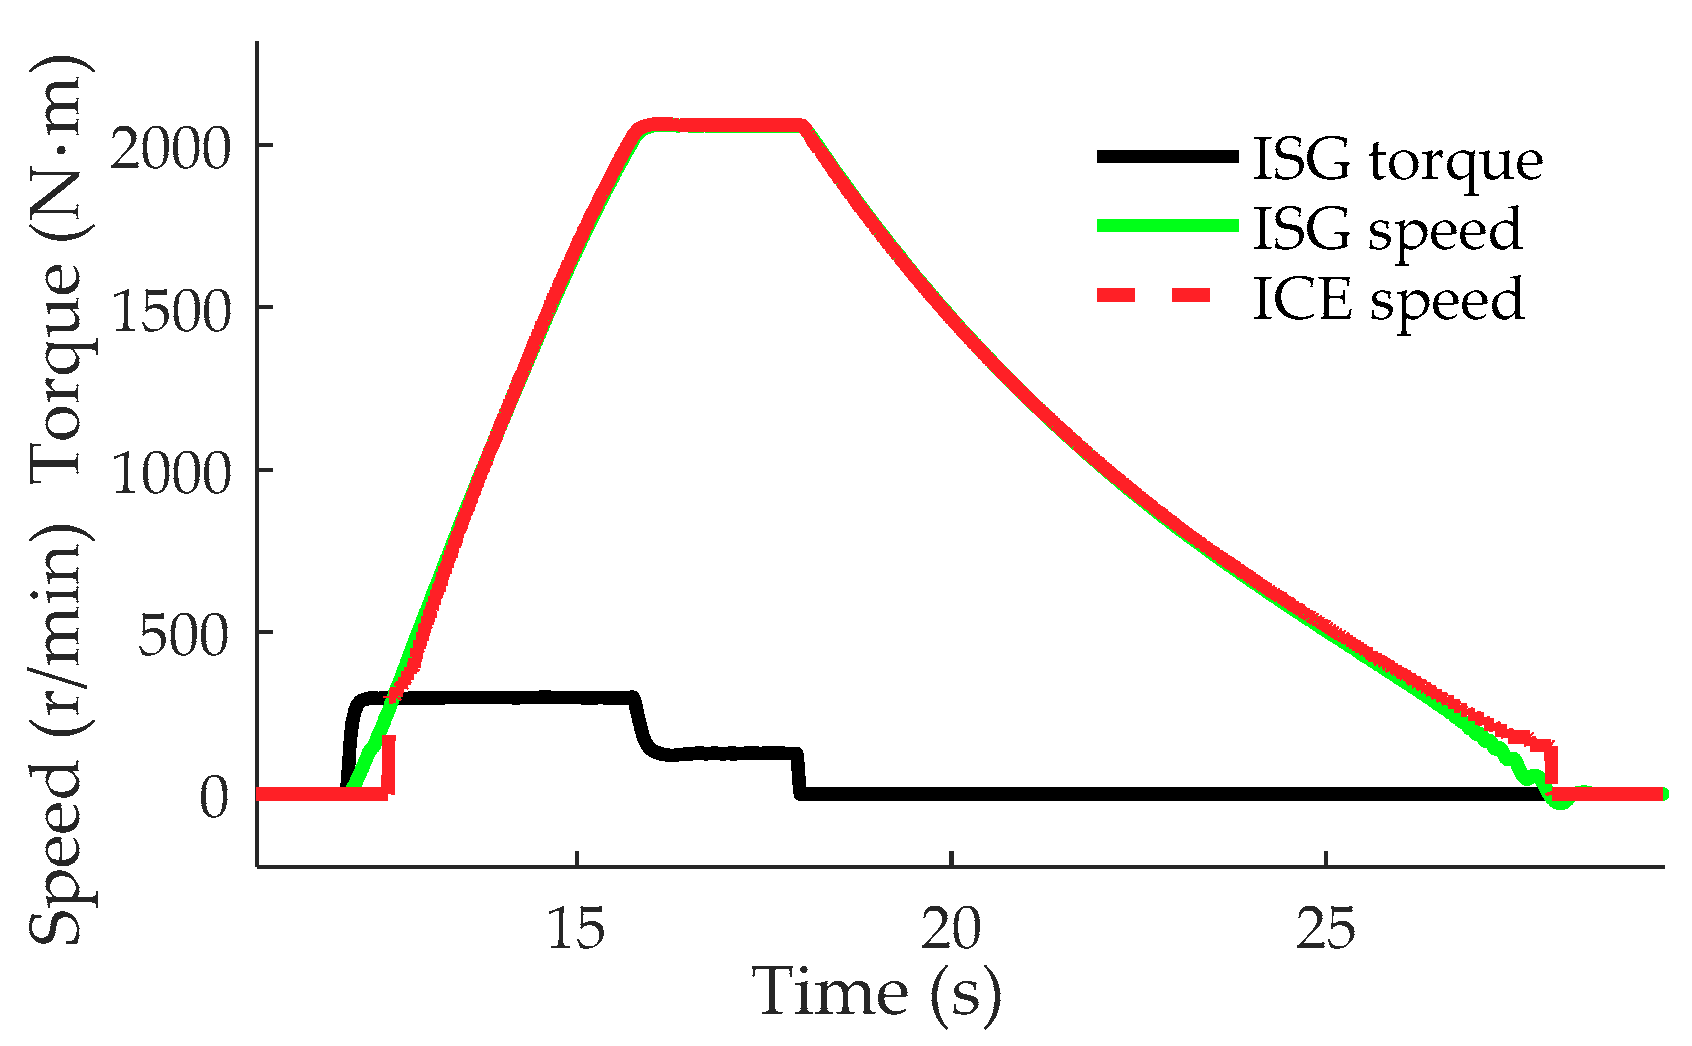
The test conditions are as follows: First, the engine warm up, then turn off the engine and disconnect the clutch. Second, the ISG drags the engine rotation with a torque of 200 Nm and 300 Nm, at which time the engine does not burn but maintains the intake valves of different opening degrees. After accelerating to 2000 r/min and maintaining high-speed rotation for 3 s, the system coast down. The ICE oil temperature at that time was 70 to 73 °C.
Figure 8 shows a set of test results. The data were collected from the CAN bus. From 10 to 26 s, the system under the action of the ISG motor has experienced three conditions: reverse acceleration, high-speed maintenance and natural deceleration.
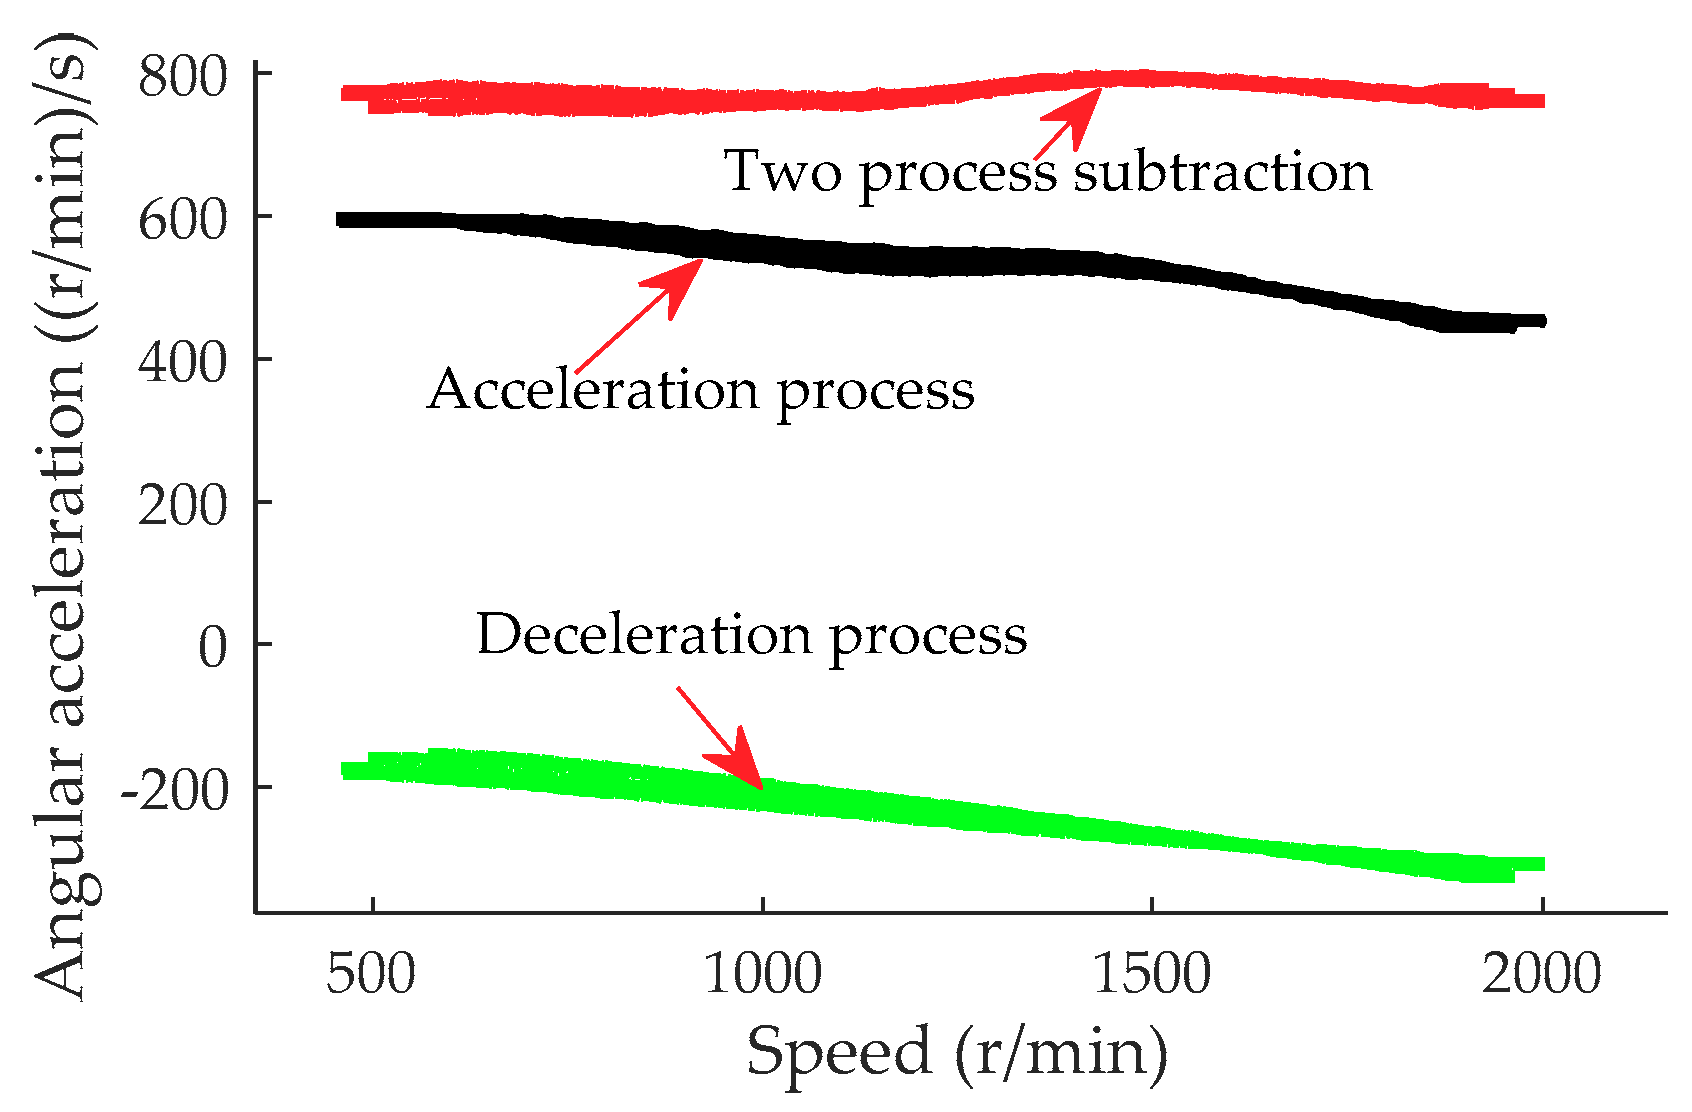
Figure 9 shows the real-time angular acceleration of the engine acceleration and deceleration in the speed coordinate system. It can be seen from the figure that as the rotational speed increases, the angular acceleration in the acceleration process gradually decreases; the angular acceleration in the natural stopping process gradually increases and substantially coincides, because the system resistance torque increases with the increase of the rotational speed. The acceleration and deceleration of the two-stage angular acceleration subtraction result is basically a horizontal line. This result shows that the influence of internal resistance, such as system uncertainty friction, is successfully eliminated, and the obtained angular acceleration of the system is only affected by the constant torque drag of the motor.
Figure 10 shows the real-time moment of inertia of the system at different speeds, which is obtained by dividing the output torque of the ISG motor by the angular acceleration after calculation. The average value over the eight tests is 3.66 kg·m2. Using this value and the total moment of inertia of the ISG motor and the clutch-driven disc from the manufacturer is 2.14 kg·m2, the moment of inertia of the engine assembly is 1.52 kg·m2.
4. Discussion
The simulation model was built using the above parameters and parameters from Table A1, as shown in Figure A1, Figure A2, Figure A3 and Figure A4, the high-speed natural stopping condition simulation was carried out, and the calculated parameters were verified by comparison with the bench test results. In the following figures, the black curve is the simulation result, and the other colored curves are the bench test results under different working conditions.
4.1. Stopping from High Speed
Figure 11 shows a comparison of engine speed tests and simulations during the stopping process. Because the boundary conditions of each test are not completely consistent (such as oil temperature) the time to come to a stop varies by 0.5 s. It is clear that the slopes of the two sets of curves corresponding to the speed drop are consistent in the middle and high-speed regions.
Figure 12 shows the engine speed fluctuation time domain comparison. It can be seen from the figure that the trends of the simulation and experiment are basically the same; during the stopping process, the speed fluctuation first decreases and then increases. The maximum amplitude of fluctuation at 200 to 300 r/min is due to the 3rd-order main harmonic excitation of the engine, and the system resonates.
4.2. Typical Urban Drive Cycles
To reproduce the torsional vibration of the drivetrain during actual drive cycles, we selected the typical bus driving cycle in Chinese urban conditions as shown in Figure 13, of which the segment from 570 to 710 s is a representative working condition [34]. This segment includes complete features, such as start-up, pure electric acceleration to medium-high speed, switching to the hybrid mode, deceleration to medium uniform speed, and braking to a stop.
4.3. Vibration Control Performance
Vehicle speed with and without active control is shown in Figure 14. From 0 to 26 s electric drive mode is used to accelerate from 0 to 35 km/h; from 26 to 42 s, it accelerates slowly in hybrid drive mode to 48 km/h; from 42 to 65 s regenerative braking is used to decelerate to 20 km/h, and a constant speed is maintained until 102 s; finally, from 102 to 160 s acceleration, then braking to a stop are performed. The partial magnified view of the red dotted line in the figure shows the fluctuation of the vehicle speed before and after active torsional vibration control during mode switching was used.
It can be seen from Figure 15 that body jerk was ±6 m/s3 due to mode switching at around 26 s, but is reduced to ±2 m/s3 with active control. It also can be seen that for the start, sudden acceleration, and deceleration conditions, body jerk is generally within ±2 m/s3 both with and without active control.
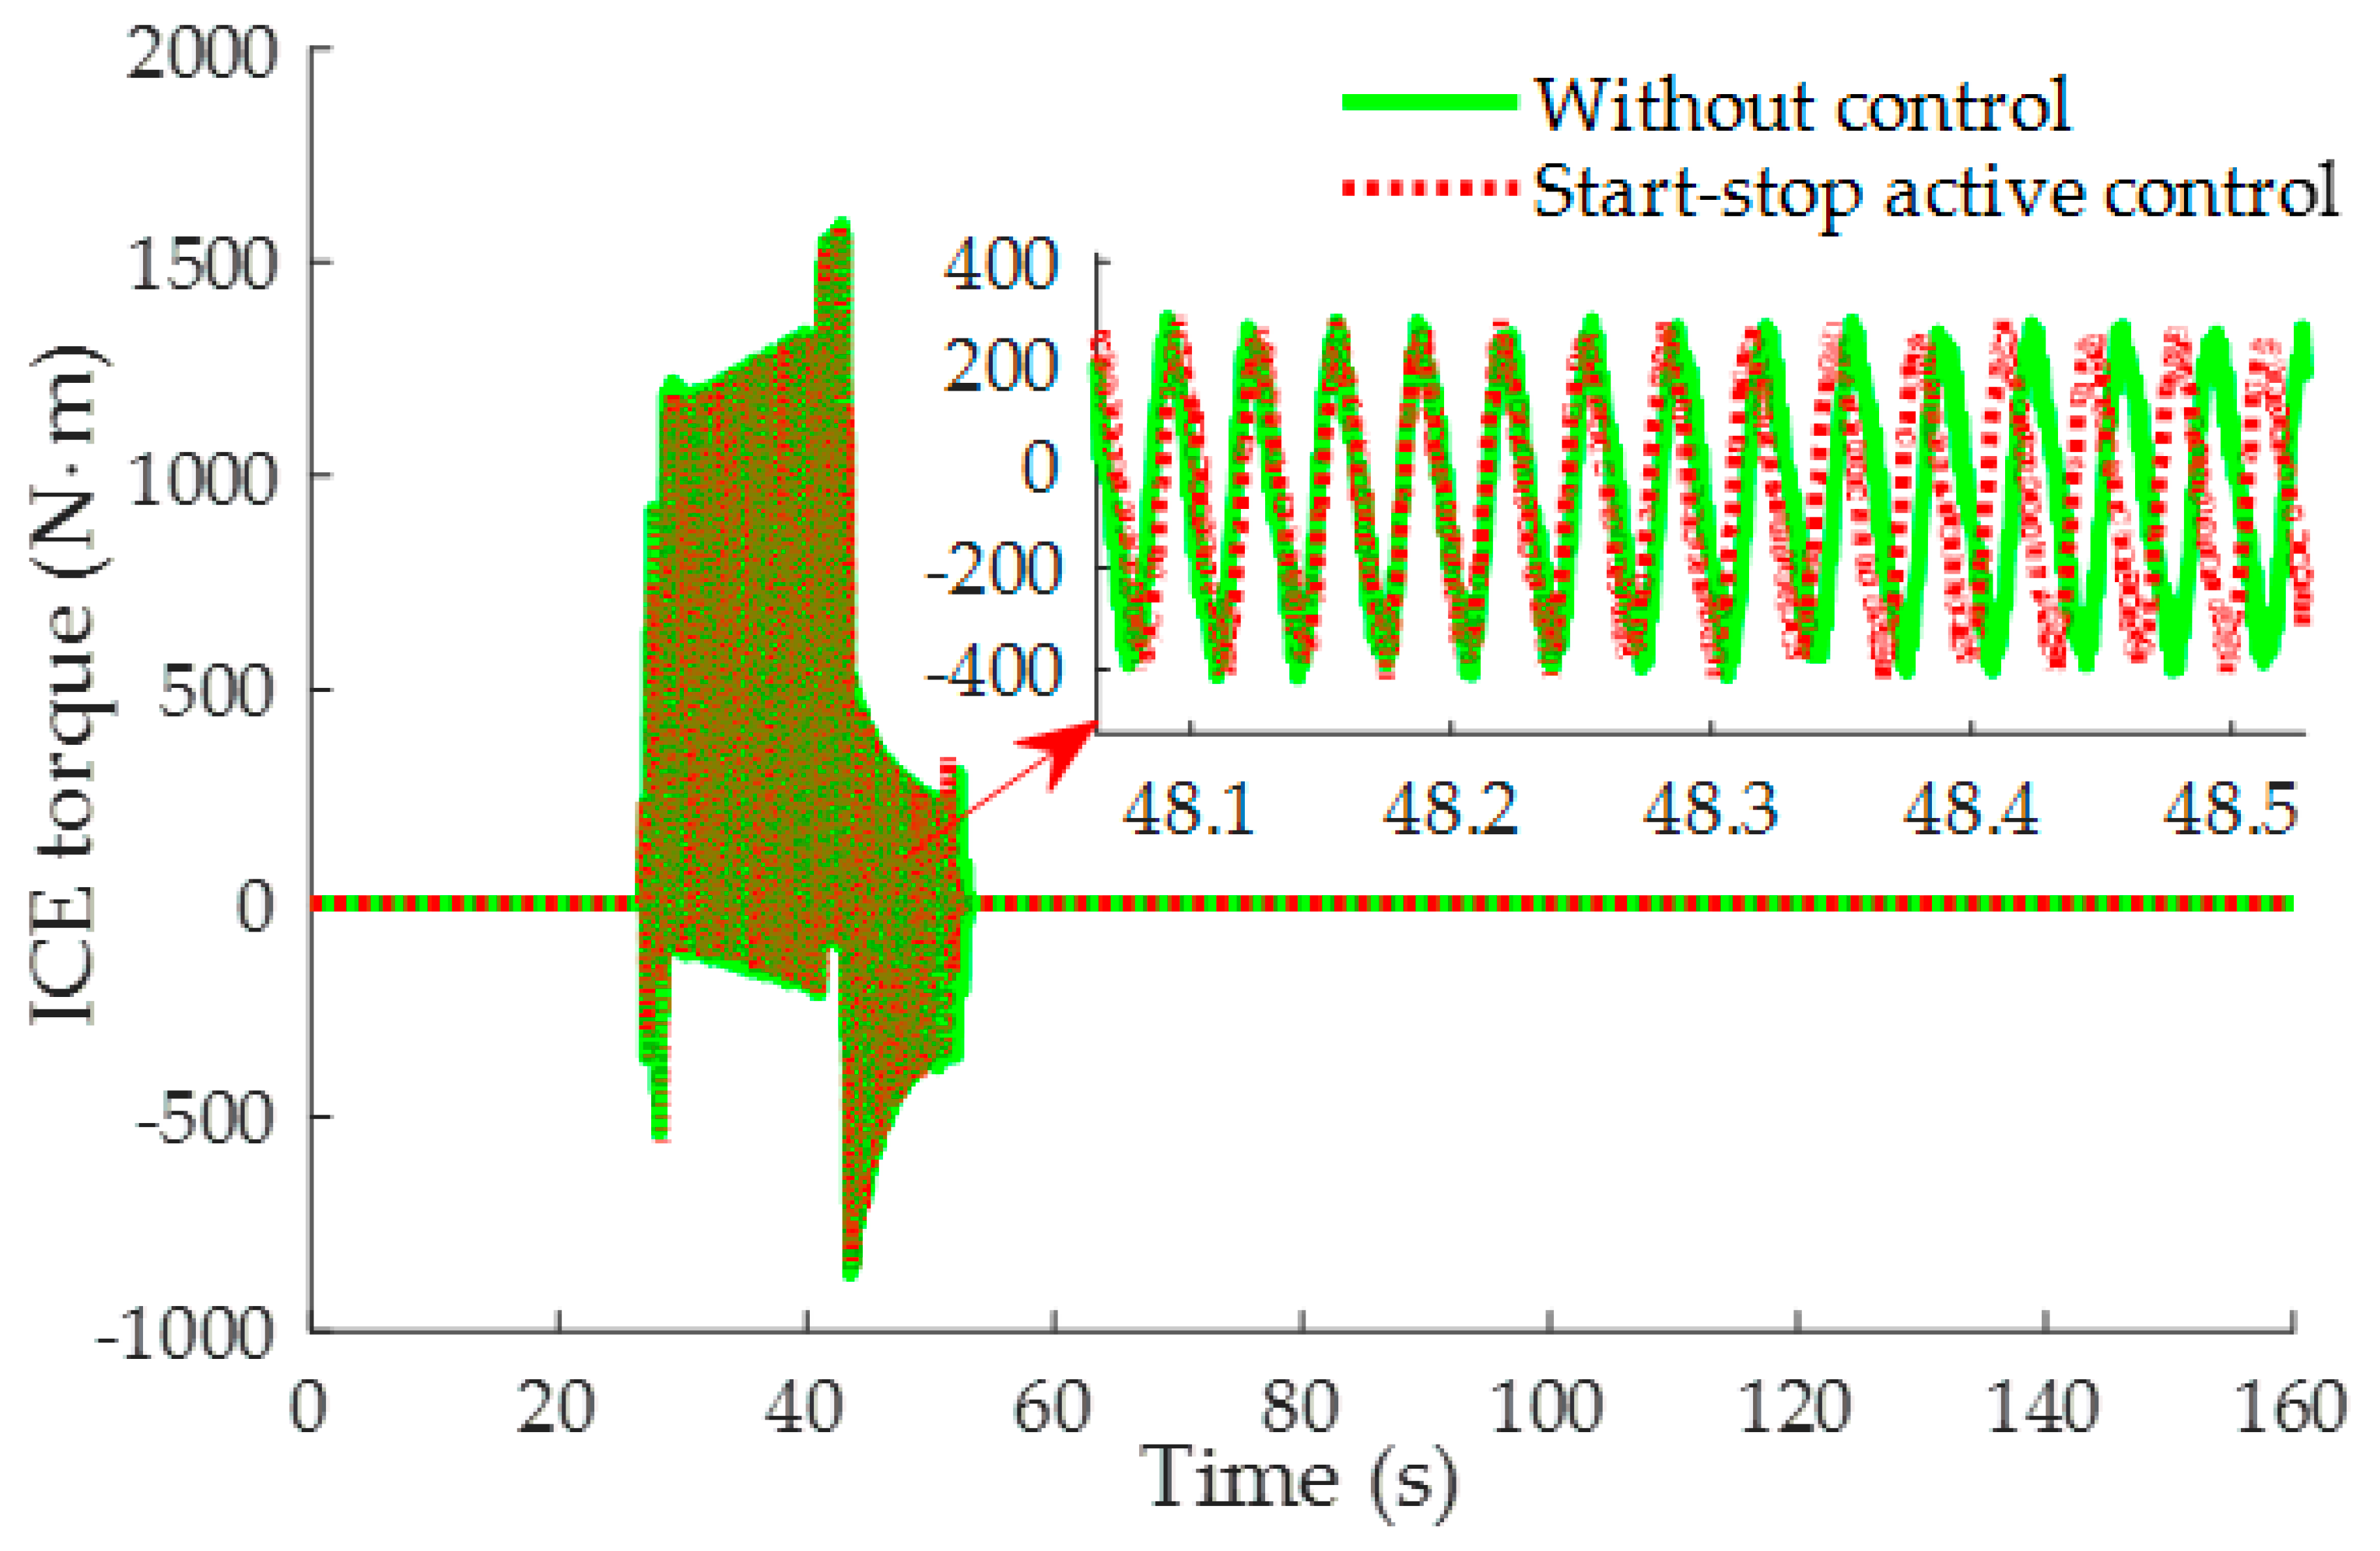
The output torque of the ICE, ISG motor, and TM motor both with and without active control are shown in Figure 16, Figure 17 and Figure 18.
With and without active control, the engine output torque is basically the same, that is, the main excitation source characteristics of the system have not changed according to Figure 16. In Figure 17, for active control, the ISG motor drives the engine with a constant torque of 500 Nm between about 27 and 27.5 s. However, with active control during the start-stop process, the ISG motor not only outputs fluctuating torque at the beginning but also outputs varying-frequency fluctuating torques to reduce system vibration from 47 to 52 s during the engine shutdown process.
From 26 to 45 s in Figure 18, the hybrid drive mode is being used. Before active control, the output torque of the TM motor quickly changes from 500 Nm to 0 Nm after receiving the mode-switch command. However, active control causes the TM to output fluctuating torque to counteract the vibration transmitted from the engine.
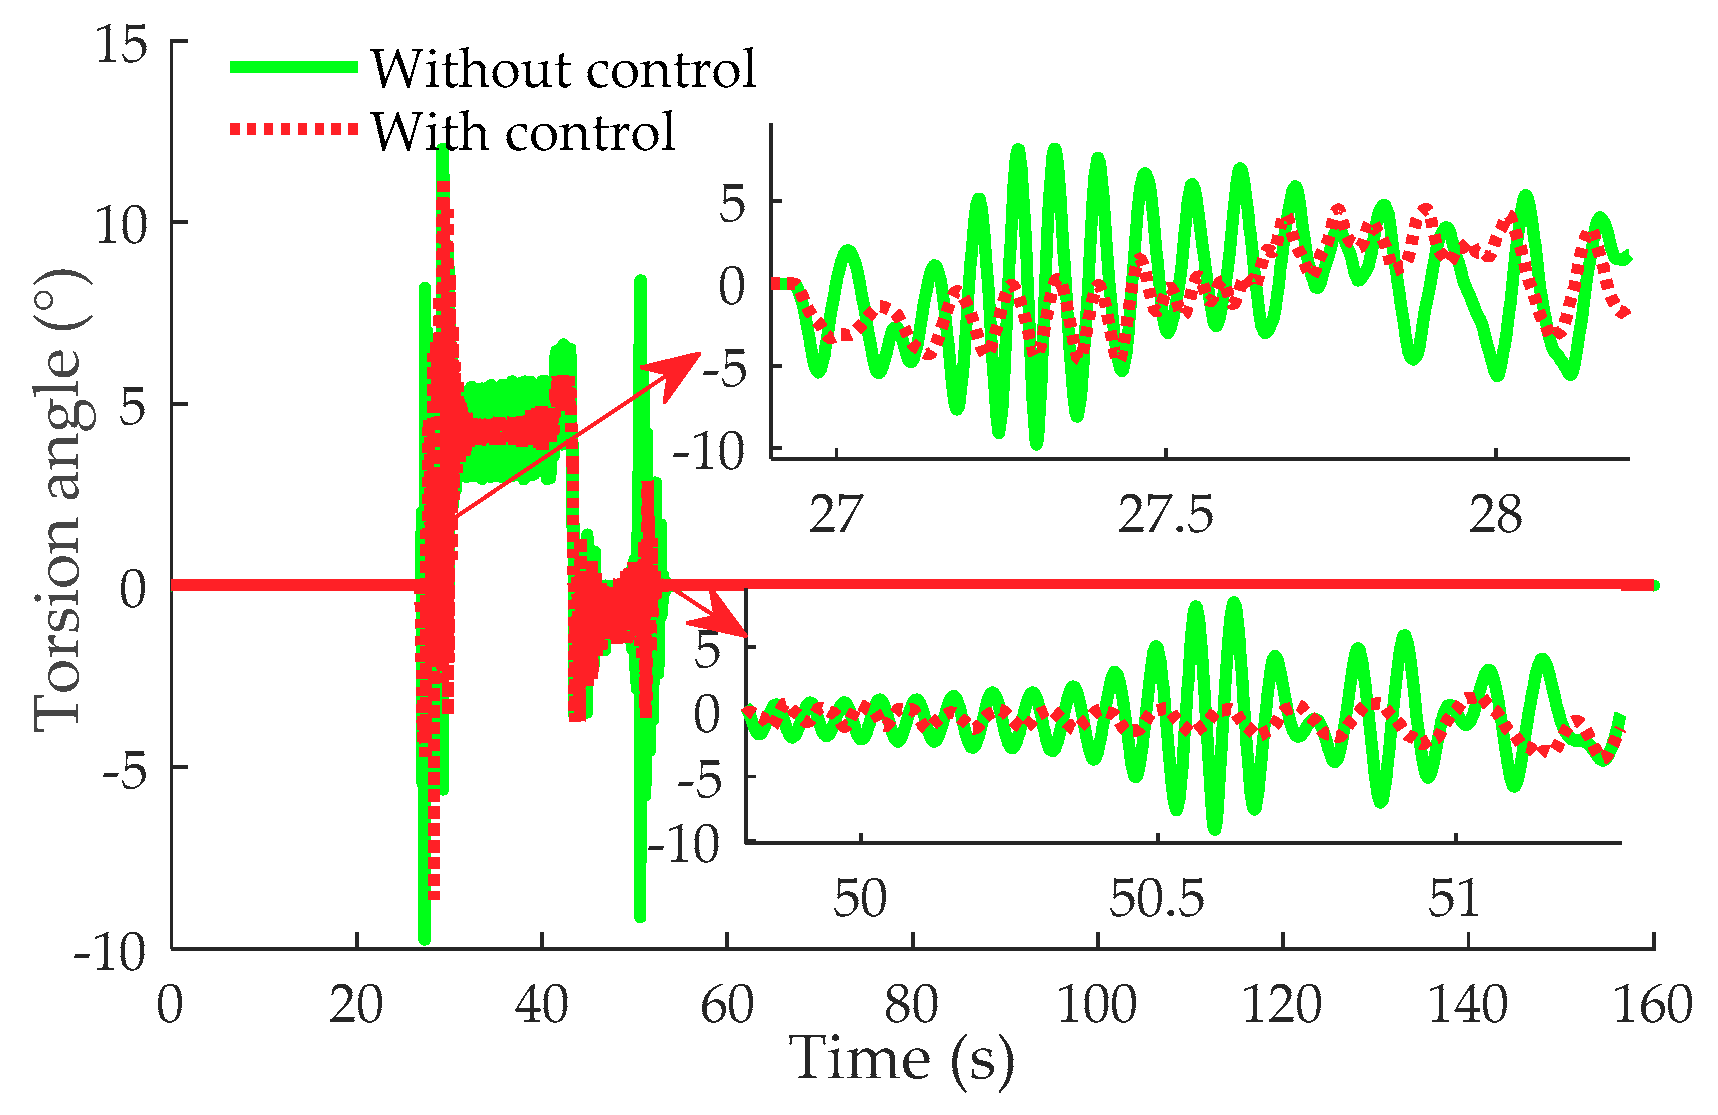
For the start and stop conditions of the APU, the engine speed and the damper torsion angle are shown in Figure 19 and Figure 20:
It can be seen from Figure 19 that the engine speed has a large difference at 30 s and 1200 r/min and at 52 s and 300 r/min. In Figure 20, during the engine start–stop process, the real-time rotation angle of the torsional damper is shown in two partial enlarged views in the figure. It can be seen that with active control, the amplitude of the torsion angle fluctuation is greatly reduced. At 50.5 s, the resonance caused by the system speed at 200 to 300 r/min was successfully eliminated.
5. Conclusions
This paper proposes a new longitudinal dynamics simulation model of a series-parallel HEV for torsional vibration study, and a torsional active control strategy under typical working conditions was designed. The following conclusions can be drawn based on the simulations and bench tests:
(1) The proposed dynamic model and parameter determination method can reproduce resonance phenomenon at the critical speed and the impact phenomenon during mode switching or rapid acceleration/rapid deceleration. It is verified by the bench test to meet the needs of torsional vibration research.
(2) The designed torsional vibration active control module can integrate well with the original vehicle control system, such as the energy management strategy module, to complete dynamic simulation of Chinese buses under typical urban conditions.
(3) The APU start–stop control based on a PID algorithm and the torque-compensation control of the TM based on torque fluctuation state observation at mode switching, effectively reduce longitudinal jerk and weaken the degree of resonance of the critical speed. Vehicle body jerk when switching from electric drive mode to hybrid drive mode is reduced to 1/3 of the original, and the torsion angle fluctuation of the damper is reduced from ±8° to ±3° during the engine stopping process.
Author Contributions
Conceptualization, methodology, writing—original draft preparation, B.Z. and H.Z.; validation, simulation, B.Z. and B.D.; writing—review and editing, H.Z.
Funding
This research was funded by the State Key Laboratory of Automotive Safety and Energy, grant number ZZ2014-082.
Acknowledgments
We would like to thank Editage for English language editing.
Conflicts of Interest
The authors declare no conflict of interest.
Appendix A
Figure A1.
Dynamic model in AMESim.

Figure A2.
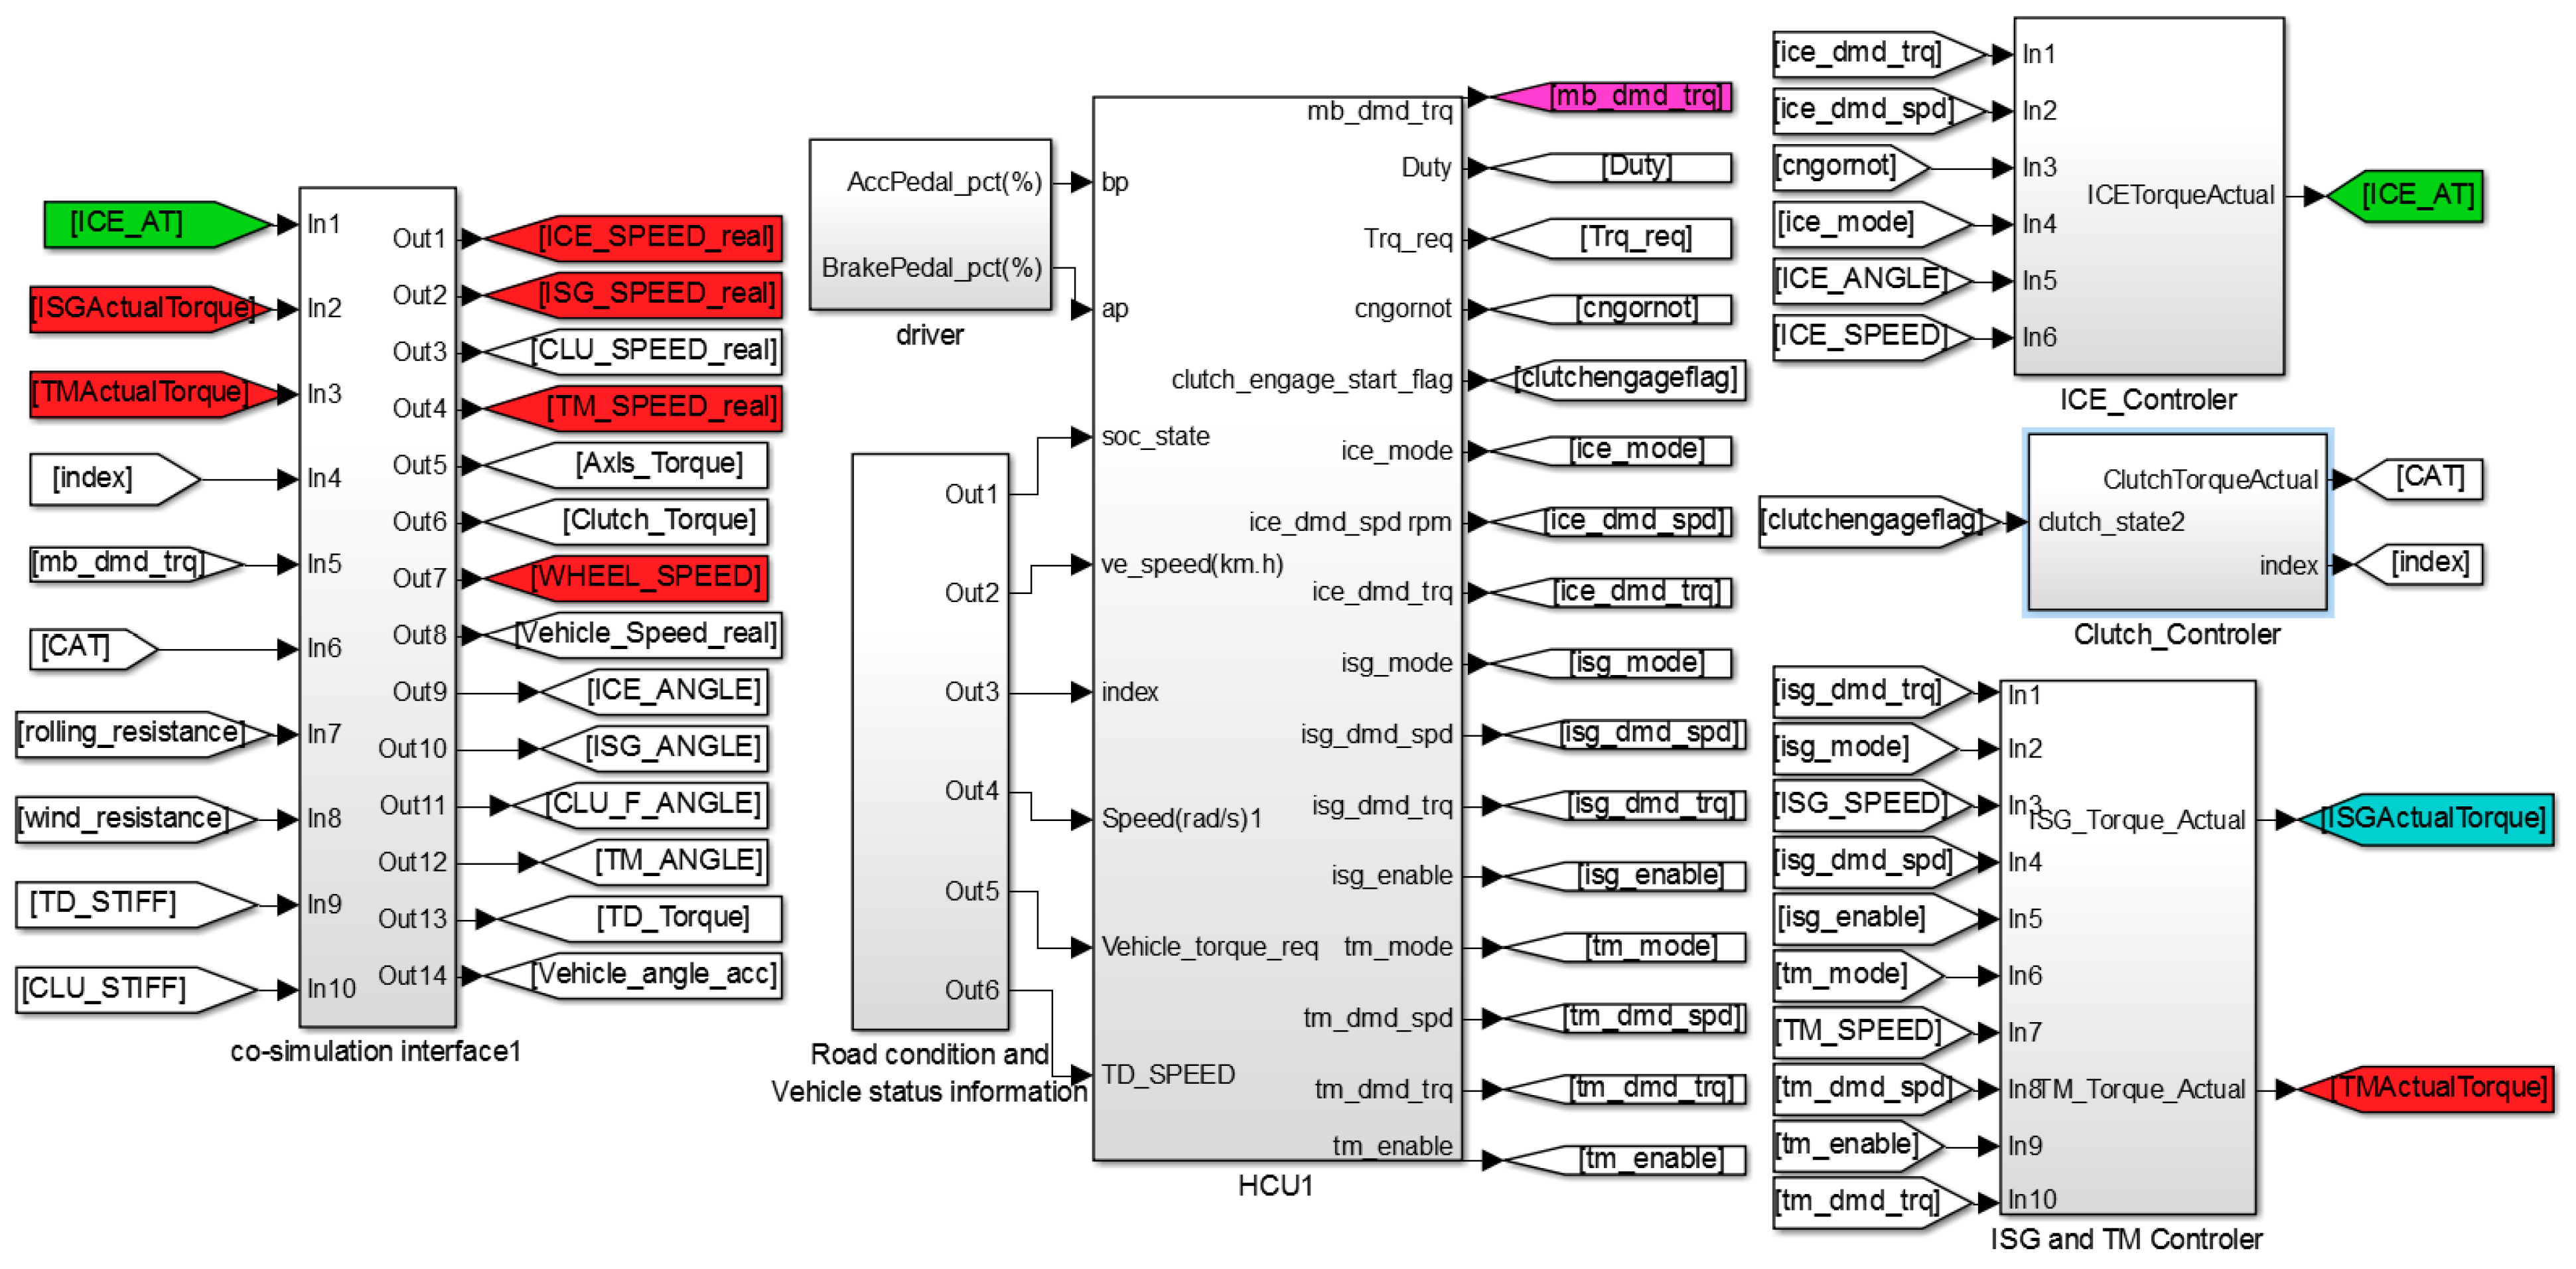
Control model in Simulink.

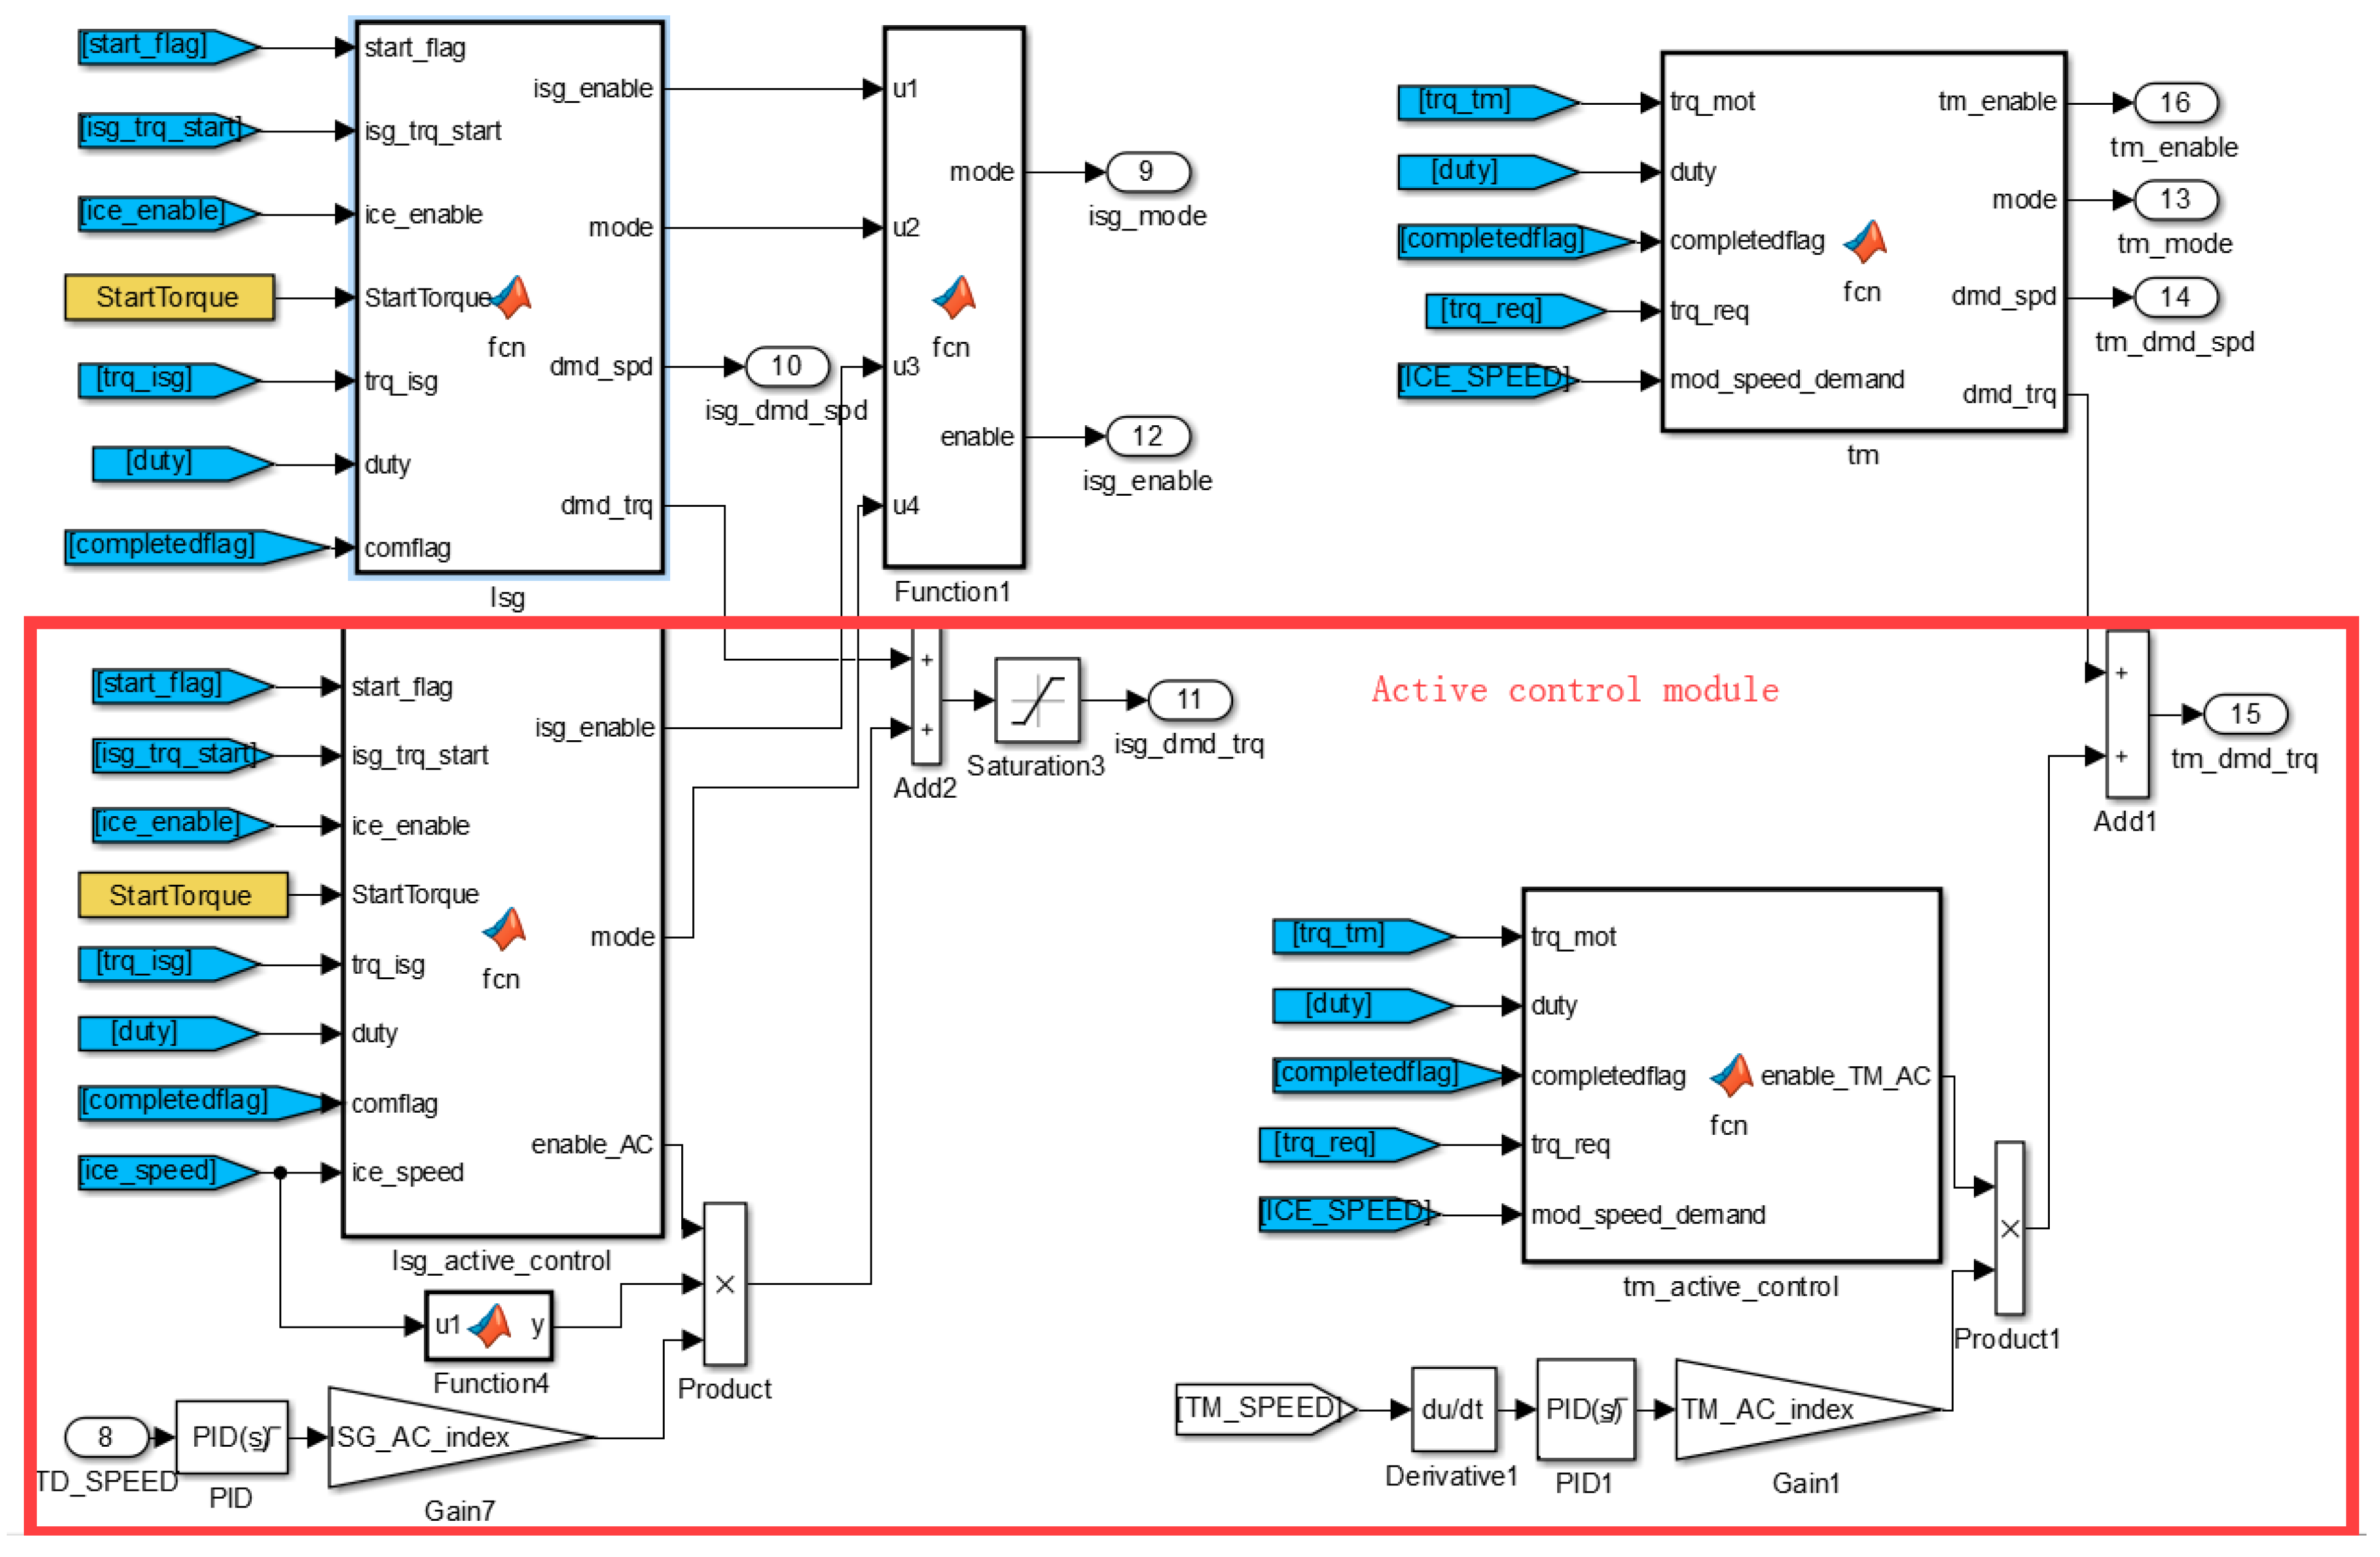
Figure A3.
Active control module in Simulink.

Figure A4.
ISG controler in Simulink.

We use a fixed-step size (1 ms) and select automatic solver from Simulink for co-simulation.
Appendix B

Table A1.
Main components and parameters of the simulation system.
| Parameter | Value (kg·m2) | Parameter | Value (Nm/°) | Parameter | Value (Nm/(r/min)) |
|---|---|---|---|---|---|
| 1.52 | Figure A5 | 0.6 | |||
| 2.14 | Figure A6 | 0.5 | |||
| 0.08 | 1500 | 0.1 | |||
| 2.22 | 900 | 150 | |||
| 18 | |||||
| 4950.45 |
The clutch and torsional damper values are provided by the manufacturer. The transmission ratio of the main reducer is 6.43, the radius of the wheel is 0.505 m.
Figure A5.
Torsional damper stiffness curve.

Figure A6.
Clutch stiffness curve.

References
- Zhang, B.Z. A Study on Energy Management Control Strategy for Plug-In Hybrid Electric Vehicle. Ph.D. Thesis, Hefei University of Technology, Hefei, China, 2011. [Google Scholar]
- Wu, D. Research on Energy Optimal Management Control Strategy for ISG Hybrid Electric Vehicle. Ph.D. Thesis, Hefei University of Technology, Hefei, China, 2013. [Google Scholar]
- Li, L.; Yang, C.; Zhang, Y.H.; Zhang, L.P.; Song, J. Correctional DP-based energy management strategy of plug-in hybrid electric bus for city-bus route. IEEE Trans. Veh. Technol. 2015, 64, 2792–2803. [Google Scholar] [CrossRef]
- Zeng, X.H.; Yang, N.N.; Wang, J.N.; Song, D.F.; Zhang, N.; Shang, M.L.; Liu, J.X. Predictive-model-based dynamic coordination control strategy for power-split hybrid electric bus. Mech. Syst. Signal Process. 2015, 60–61, 785–798. [Google Scholar] [CrossRef]
- Mahmoudzadeh, A.A.; Pesiridis, A.; Karvountzis, K.A.; Esfahanian, V. Hybrid electric vehicle performance with organic Rankine cycle waste heat recovery system. Appl. Sci. 2017, 7, 437. [Google Scholar] [CrossRef]
- Lin, C.; Sun, S.X.; Walker, P.; Zhang, N. Off-Line optimization based active control of torsional oscillation for electric vehicle drivetrain. Appl. Sci. 2017, 7, 1261. [Google Scholar] [CrossRef]
- Hu, Y.; Li, W.M.; Xu, K.; Zahid, T.; Qin, F.Y.; Li, C.M. Energy management strategy for a hybrid electric vehicle based on deep reinforcement learning. Appl. Sci. 2018, 8, 187. [Google Scholar] [CrossRef]
- Xiao, R.X.; Liu, B.S.; Shen, J.W.; Guo, N.Y.; Yan, W.S.; Chen, Z. Comparisons of energy management methods for a parallel plug-in hybrid electric vehicle between the convex optimization and dynamic programming. Appl. Sci. 2018, 8, 218. [Google Scholar] [CrossRef]
- Awadallah, M.; Tawadros, P.; Walker, P.; Zhang, N. Dynamic modelling and simulation of a manual transmission based mild hybrid vehicle. Mech. Mach. Theory 2017, 112, 218–239. [Google Scholar] [CrossRef]
- Yan, M.G.; Zhang, Y.; Hou, Z.C.; Yang, F.Y.; Yu, P. Torsional vibration response and parameter influence analysis for the entire drive line of a hybrid electric bus. Eng. Mech. 2014, 31, 223–227. [Google Scholar]
- Zhong, B.Q.; Hou, Z.C.; Liu, R.X. PID control on the torsional vibration of an auxiliary power unit during starting. Automot. Eng. 2018, 2, 143–149. [Google Scholar]
- Tang, X.L.; Yang, W.; Hu, X.S.; Zhang, D.J. A novel simplified model for torsional vibration analysis of a series-parallel hybrid electric vehicle. Mech. Syst. Signal Process. 2017, 85, 329–338. [Google Scholar] [CrossRef]
- Dinh, T.Q.; Marco, J.; Greenwood, D.; Harper, L.; Corrochano, D. Powertrain modelling for engine stop–start dynamics and control of micro/mild hybrid construction machines. Proc. Inst. Mech. Eng. Part K 2017, 231, 439–456. [Google Scholar] [CrossRef] [Green Version]
- Du, C.Q.; Yan, F.W.; Yan, Y.B.; Yang, P.L. Methods of engine torque estimation for control algorithms. Trans. CSICE 2008, 26, 446–451. [Google Scholar]
- Yan, Y.B. Study on the Dynamic Control in Parallel Hybrid Electric Vehicle. Ph.D. Thesis, Wuhan University of Technology, Wuhan, China, 2008. [Google Scholar]
- Zhu, F.T. Architecture Design, Analysis and Mode Transition Research of a Multi-Mode Hybrid Powertrain Using a Single Electric Machine. Ph.D. Thesis, Shanghai Jiao Tong University, Shanghai, China, 2014. [Google Scholar]
- Bian, H.R.; Xu, Z.F.; Zeng, F.Q.; Zi, X.Y.; Zhang, Y.F. Start-up performance simulation of military hybrid vehicle engine based on ISG. J. Mil. Transp. Univ. 2017, 19, 30–34. [Google Scholar]
- Yuan, W.; Tian, Z.L.; Yang, Z.J.; Ding, K. Analysis and improvement of the torsional vibration of car powertrain under acceleration condition. Automot. Eng. 2018, 40, 91–97. [Google Scholar]
- Aydin, M.; Gulec, M. Reduction of cogging torque in double-rotor axial-flux permanent-magnet disk motors: A review of cost-effective magnet-skewing techniques with experimental verification. IEEE Trans. Ind. Electr. 2014, 61, 5025–5034. [Google Scholar] [CrossRef]
- Zuo, S.G.; Wu, S.L.; Wu, X.D.; Shen, J.; Lin, F. Analytical model and optimization of torque of an axial flux permanent magnet synchronous motor. Trans. China Electr. Soc. 2016, 31, 46–53. [Google Scholar]
- Chen, S.Y.; Yu, P.; Zhang, T.; Yu, Y. Active control of the electrical machines fluctuating torque based on current harmonics optimization. Mechatronics 2016, 22, 41–45. [Google Scholar]
- Zhu, X.Y.; Zhang, H.; Cao, D.P.; Fang, Z.D. Robust control of integrated motor-transmission powertrain system over controller area network for automotive applications. Mech. Syst. Signal Process. 2015, 58–59, 15–28. [Google Scholar] [CrossRef]
- Syed, F.U.; Kuang, M.L.; Hao, Y. Active damping wheel-torque control system to reduce driveline oscillations in a power-split hybrid electric vehicle. IEEE Trans. Veh. Technol. 2009, 58, 4769–4785. [Google Scholar] [CrossRef]
- Kou, Y.S.; Weslati, F. Development of a Hybrid Powertrain Active Damping Control System via Sliding Mode Control Scheme; SAE Technical Paper 2013-01-0486; SAE: Warrendale, PA, USA, 2013. [Google Scholar]
- Ni, C.Q.; Zhang, Y.T.; Zhao, Q.; Adel, B. Dynamic torque control strategy of engine clutch in hybrid electric vehicle. J. Mech. Eng. 2013, 49, 114–121. [Google Scholar] [CrossRef]
- Walker, P.D.; Zhang, N. Active damping of transient vibration in dual clutch transmission equipped powertrains: A comparison of conventional and hybrid electric vehicles. Mech. Mach. Theory 2014, 77, 1–12. [Google Scholar] [CrossRef] [Green Version]
- Vadamalu, R.S.; Beidl, C. MPC for active torsional vibration reduction of hybrid electric powertrains. IFAC-PapersOnline 2016, 49, 756–761. [Google Scholar] [CrossRef]
- Zhang, H.; Zhang, Y.; Yin, C.L. Hardware-in-the-Loop simulation of robust mode transition control for a series–parallel hybrid electric vehicle. IEEE Trans. Veh. Technol. 2016, 65, 1059–1069. [Google Scholar] [CrossRef]
- Yang, C.; Song, J.; Li, L.; Li, S.B.; Cao, D.P. Economical launching and accelerating control strategy for a single-shaft parallel hybrid electric bus. Mech. Syst. Signal Process. 2016, 76–77, 649–664. [Google Scholar] [CrossRef]
- Wilbanks, J.; Michael, J.L. Two-Scale command shaping for reducing powertrain vibration during engine restart. J. Dyn. Syst. Meas. Control 2017, 112, 218–239. [Google Scholar]
- Yan, M.G. Torsional Vibration Analysis and Control for the Driveline of a Hybrid Electric Bus. Master’s Thesis, Tsinghua University, Beijing, China, 2015. [Google Scholar]
- Tao, R.; Hou, Z.C. Measurement and curve fitting of the friction torque of rolling bearings subjected to radial loads. J. Tsinghua Univ. 2014, 54, 744–749. [Google Scholar]
- Mo, Y.M.; Lei, Z.D.; Li, D.Y.; Ren, L.S.; Huang, Y.M. An experimental study on the effects of grease on the friction torque of hub bearing and the fuel consumption of vehicle. Automot. Eng. 2017, 39, 588–592. [Google Scholar]
- He, Y.; Yang, F.Y.; Yang, Y.P.; Ouyang, M.G. Development of CNG-fueled series hybrid electric city bus. Automot. Eng. 2008, 3, 202–210. [Google Scholar]
Figure 1.
Schematic diagram of the hybrid powertrain system.

Figure 2.
Logic threshold energy management strategy.

Figure 3.
Simulation platform architecture.

Figure 4.
Torsional vibration active control strategy diagram.

Figure 5.
Active torsional vibration control method.

Figure 6.
Schematic diagram of the structure and force of hybrid electric vehicles (HEV) powertrain.
Figure 6.
Schematic diagram of the structure and force of hybrid electric vehicles (HEV) powertrain.

Figure 7.
Bench tests system: (a) overall scene; (b) dual-motor system; (c) data acquisition system.
Figure 7.
Bench tests system: (a) overall scene; (b) dual-motor system; (c) data acquisition system.

Figure 8.
System speed and torque.

Figure 9.
Angular acceleration of engine acceleration and deceleration.

Figure 10.
Total moment of inertia.

Figure 11.
Engine speed during stopping.

Figure 12.
Engine speed fluctuations during stopping.

Figure 13.
Bus speed in Chinese urban conditions.

Figure 14.
Vehicle speed and drive mode.

Figure 15.
Vehicle body jerk.

Figure 16.
Engine output torque.

Figure 17.
Integrated starter generator (ISG) motor output torque.

Figure 18.
Traction motor (TM) motor output torque.

Figure 19.
Engine speed.

Figure 20.
Torsional damper angle.

Figure 21.
Fourier transform (STFT) of TM speed without control.

Figure 22.
STFT of TM speed with control.

Table 1.
Main components and parameters of the hybrid system [31].
Table 1.
Main components and parameters of the hybrid system [31].
| Part Name | Type | Parameter | Value |
|---|---|---|---|
| ICE | Natural gas engine | Power (kW) | 155 |
| Peak torque (Nm) | 710 | ||
| ISG motor | PMSM (Pole pairs: 8) | Power (kW) | 100 |
| Peak torque (Nm) | 850 | ||
| TM motor | PMSM (Pole pairs: 8) | Power (kW) | 135 |
| Peak torque (Nm) | 2100 | ||
| Clutch | Two-stage torsion spring | Stiffness (Nm/°) | ≤±1.5°: 66.7 >±1.5°: 457 |
| Torsional damper | Three-stage torsion spring | Stiffness (Nm/°) | ≤±3°: 60 ±3°–±8°: 190 >±8°: 650 |
Table 2.
Dynamic parameter determination and correction values.
| Parameter | |||
|---|---|---|---|
| Value | 1.52 | 0.07 | 0.07 |
© 2018 by the authors. Licensee MDPI, Basel, Switzerland. This article is an open access article distributed under the terms and conditions of the Creative Commons Attribution (CC BY) license (http://creativecommons.org/licenses/by/4.0/).
Share and Cite
MDPI and ACS Style
Zhong, B.; Deng, B.; Zhao, H. Simulation Model and Method for Active Torsional Vibration Control of an HEV. Appl. Sci. 2019, 9, 34. https://doi.org/10.3390/app9010034
AMA Style
Zhong B, Deng B, Zhao H. Simulation Model and Method for Active Torsional Vibration Control of an HEV. Applied Sciences. 2019; 9(1):34. https://doi.org/10.3390/app9010034
Chicago/Turabian StyleZhong, Biqing, Bin Deng, and Han Zhao. 2019. "Simulation Model and Method for Active Torsional Vibration Control of an HEV" Applied Sciences 9, no. 1: 34. https://doi.org/10.3390/app9010034
Note that from the first issue of 2016, this journal uses article numbers instead of page numbers. See further details here.