1. Introduction
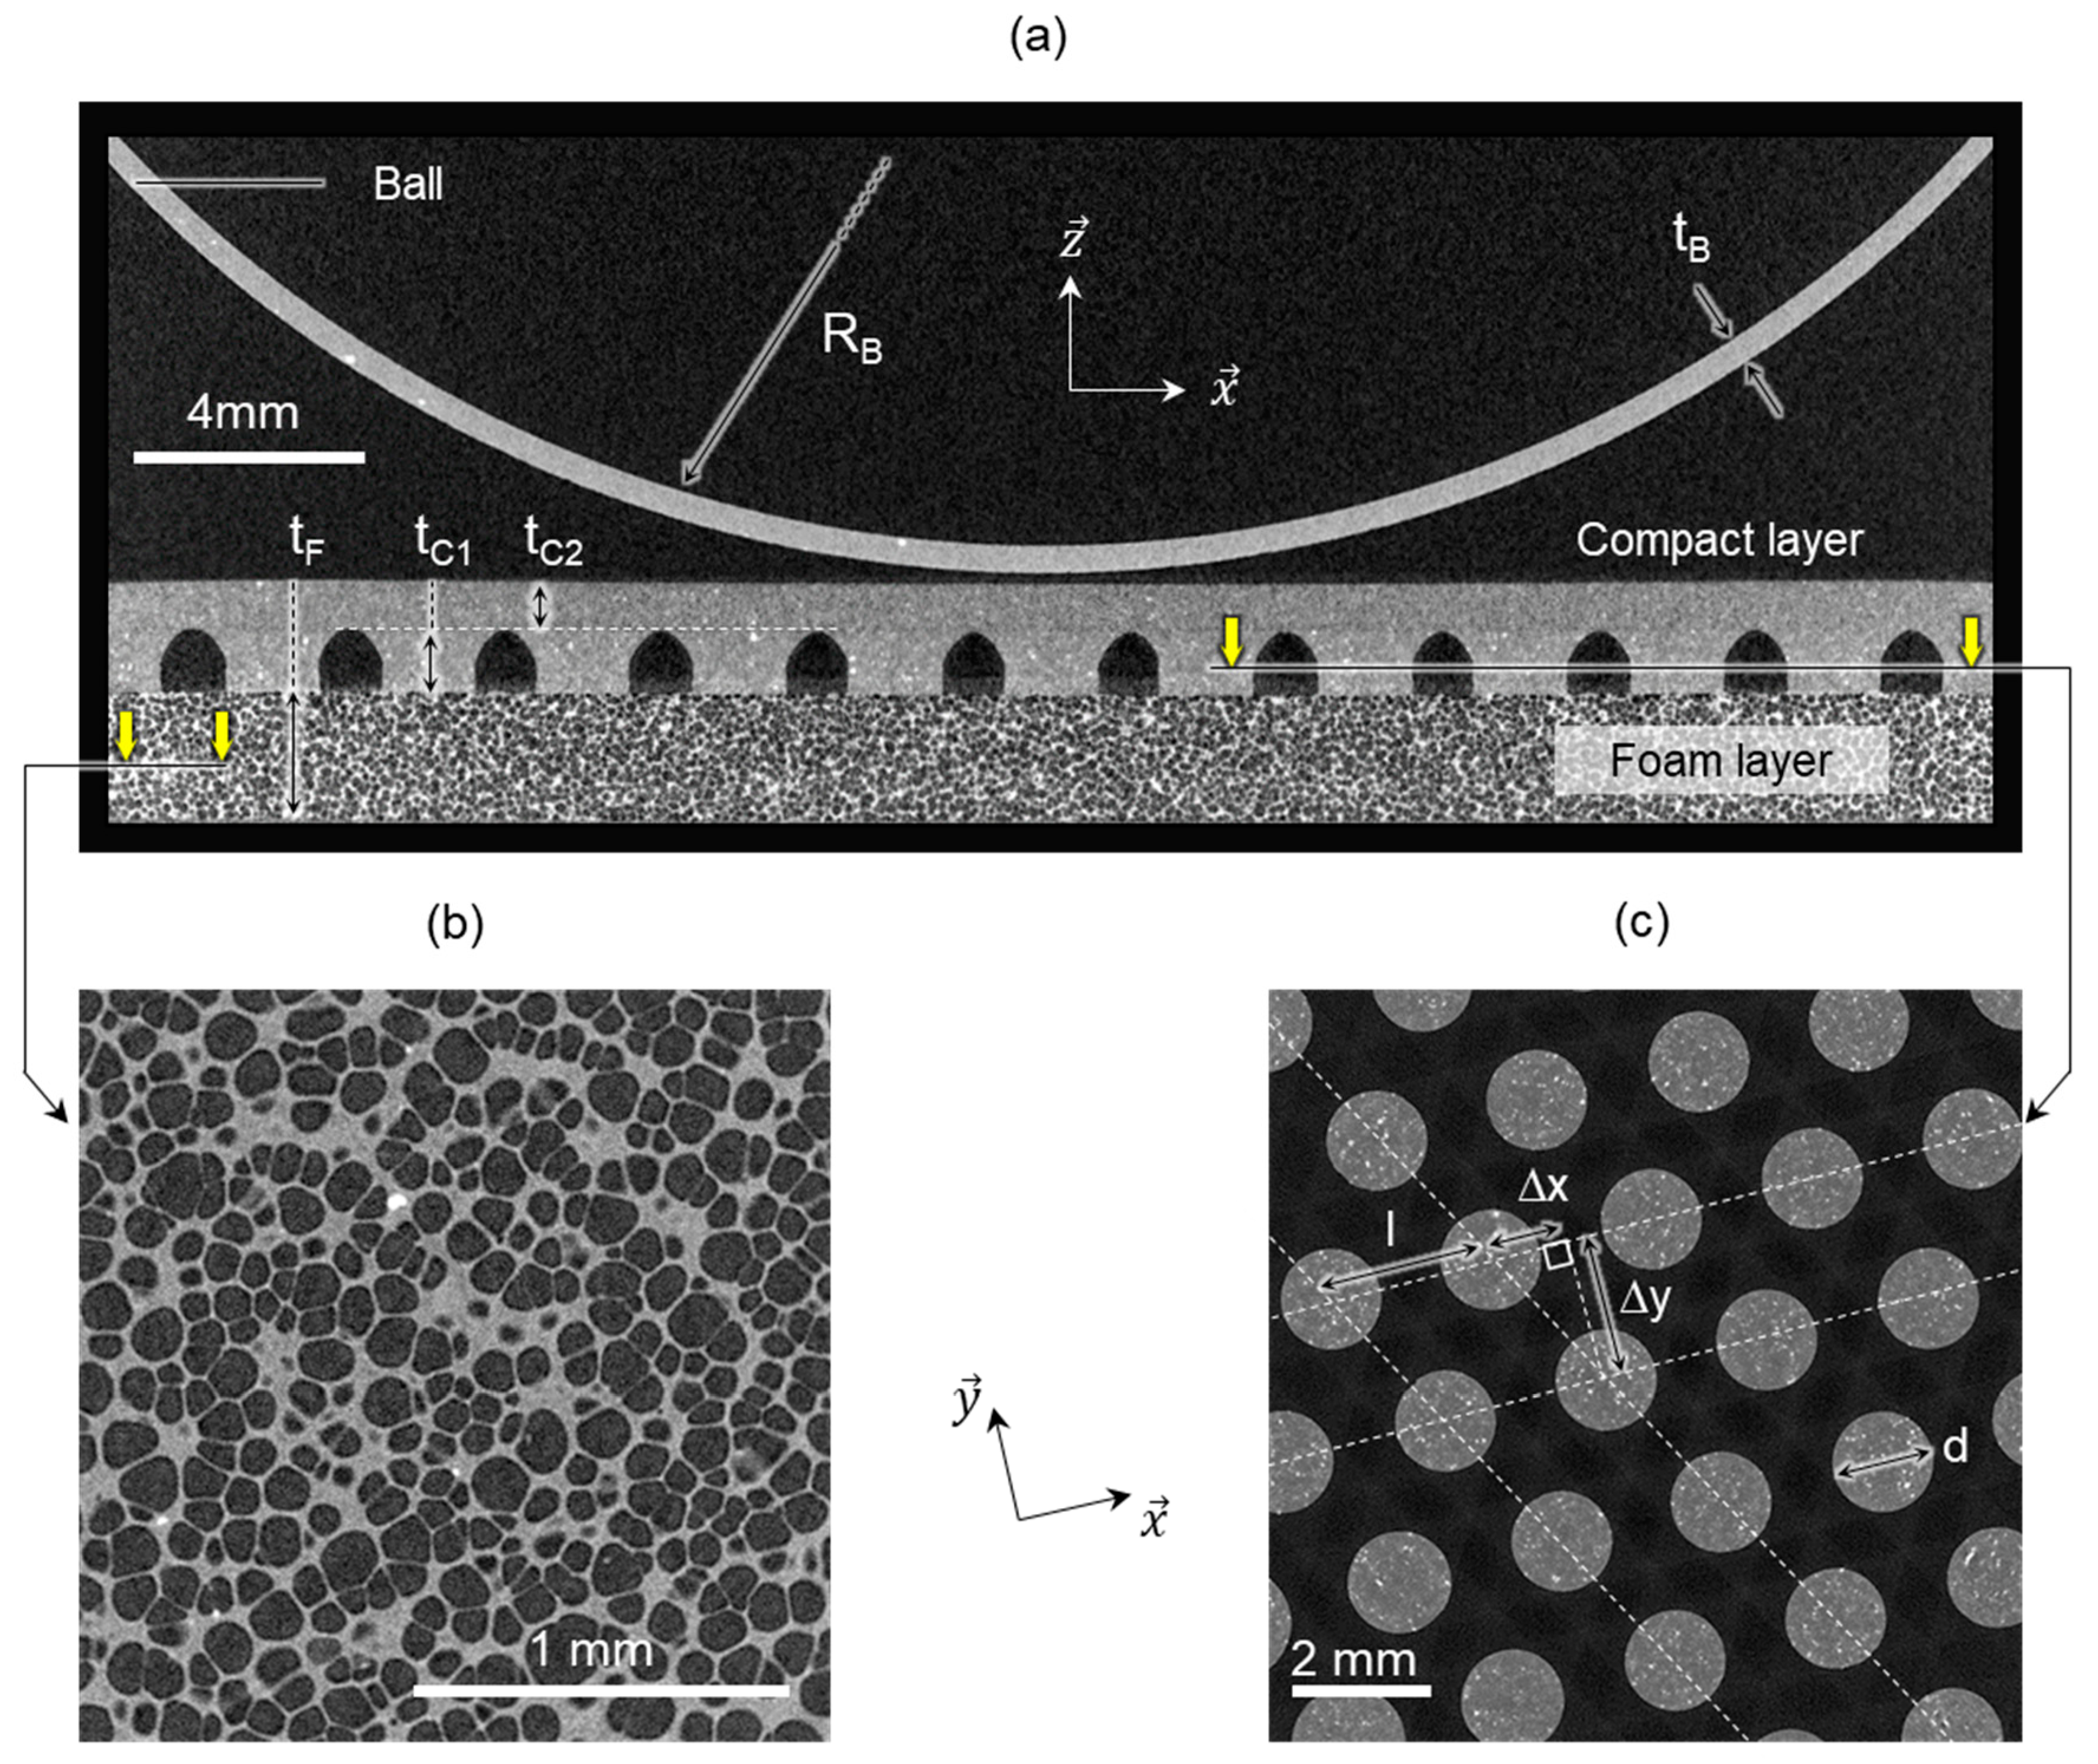
A table tennis racket comprises two polymeric sheets, the foam and the compact that are glued together and on to a wooden paddle. Both polymeric constituents are in their rubbery state at ambient temperature so that they exhibit large and mostly instantaneous reversible deformation when impacted by a ball. Aside from preventing the ball from breaking, these compliant layers trigger the speed and control of the ball and the identification of the design parameters controlling the overall performance is of great importance. Looking at the complex physical phenomenon taking place when the ball impacts a polymeric pad, the friction coefficient, the polymeric intrinsic bulk properties and the layers geometries and architectures correspond to the many potentially adjustable parameters. That being said, when considering the impact problem attention can be focused on the impactor, the target and/or the contact between the two.
While many studies were devoted to studying the kinematic behavior (trajectory and aerodynamics) of a thin shell hollow sphere impacting a flat surface, most of these works used rigid surface, thus being representative of the ball/table impact [
1,
2,
3,
4,
5,
6,
7]. When the rebound of the ball was the focus of attention, the coefficient of restitution, corresponding to the ratio between the incident and reflected linear velocities could be calculated [
2,
8]. This parameter only relied on the kinematic description of the impact and on global dynamics so that little to no attention was often given to the materials description. In the end, the coefficient of restitution metric characterized the overall speed performance during impact, which corresponded to the performance of a given combination of impactor and target as a whole.
Impact under normal incidence (and no spin) was often employed to further study the deforming behavior of the ball when in contact with a rigid surface. For both the quasi-static and the dynamic loading regime, the reversible buckling of the thin-wall sphere has been observed and modeled [
9,
10,
11,
12]. Here, further attention was given to the material mechanical properties. Nevertheless, when used as the model material, the table tennis ball’s celluloid constitutive behavior could be described as an elastic perfectly plastic material [
11] even though polymers are known to be dissipative rate-dependent materials [
13,
14]. Recently, Zhang et. al. used an inverse-fitting method to describe the visco-elastic properties of the celluloid material and to model the impact of a table tennis ball impacting a rigid surface, evidencing the need for the account of the polymeric materials rate-dependency [
8].
The impact of tennis table ball on a racket with coverings had been thoroughly studied by Tiefenbacher et al. [
15] from a macroscopic analysis, both numerically and experimentally. The impact was analyzed based on two restitution coefficients (E
par, normal ball velocity, T
par tangential ball velocity). It was shown that the tangential elasticity of the coverings had a high influence on these coefficients, the authors identified a so called ‘tangential effect’. The details of the ball—covering contact during impact were not discussed but only analyzed through the previous coefficient of restitution that were determined for numerous coverings and impact conditions (velocity, angle and spin frequency). Following that study, Tiefenbacher et al. [
16] had analyzed the influence of special equipment materials on decisive strokes.
The contact conditions during the impact was studied by Cross [
17], but for tennis, golf, basketball and baseball balls. The author based his analysis on the measurement of the tangential and normal forces during the ball–surface impact. The tangential force being seen as a parameter that permit identifying the contact condition: sliding, rolling or gripping of the ball on the impacted surface. The author highlighted that depending on its incidence angle and its linear speed and spin frequency, the ball could grip or slide but did not roll on the impacted surface. However, the author did not consider table tennis balls which behave differently from tennis balls, exhibiting for instance a lower mass/volume ratio.
Finite element modelling (FEM) of sports balls impacting rackets, bats, clubs or surfaces has been considered by many authors in the last two decades. Goodwill, Haake and Allen [
18,
19,
20,
21] extensively investigated the impact of a tennis ball on a rigid surface or on a string bed, studying the contact conditions of the tennis ball with the impacted surface and the reversal of spin. More generally, depending on the sport under investigation, noticeable differences exist between the two impacting bodies. They can be considered rigid, soft, plain or hollow so that the deformations experienced by the ball and/or the target can be large and/or small. Ultimately the corresponding models have to be adapted to these specificities. The constitutive equations, often being nonlinear, has to be implemented in the FEM, requiring most of the time the experimental characterization of the material parameters. Another key point for getting a consistent modeling is the contact formulation and its characteristics: friction coefficient, contact state (stick/slip).
In a recent work, Rinaldi et al. studied the impact response of a ball onto targets corresponding to the polymeric layers of a table tennis paddle [
22]. Normal impacts with varying incident linear velocities and no spin were solely considered and joint experimental measurements and 3D FEM were performed. The linear coefficient of restitution corresponded to the quantitative metric chosen for comparison and fair agreement was obtained. The buckling of the ball was confirmed numerically meaning that the sample/ball contact zone corresponded to a ring with its mean radius increasing till the maximum crushing. It is worth noting that the material properties, the geometry and the local contact zone were considered in the model, so that parametric studies allowed to evidence their importance. Nevertheless, the explored impact conditions were away from realistic conditions where angular velocity (ball spin) and non-normal incidence usually prevail.
Thus, the present research aimed at exploring an enhanced set of incident loading conditions, as well as challenging the finite element model in matching the experimental observations. Along with the large set of impact tests, new metrics had been defined, monitored and confronted.
3. Experimental Results
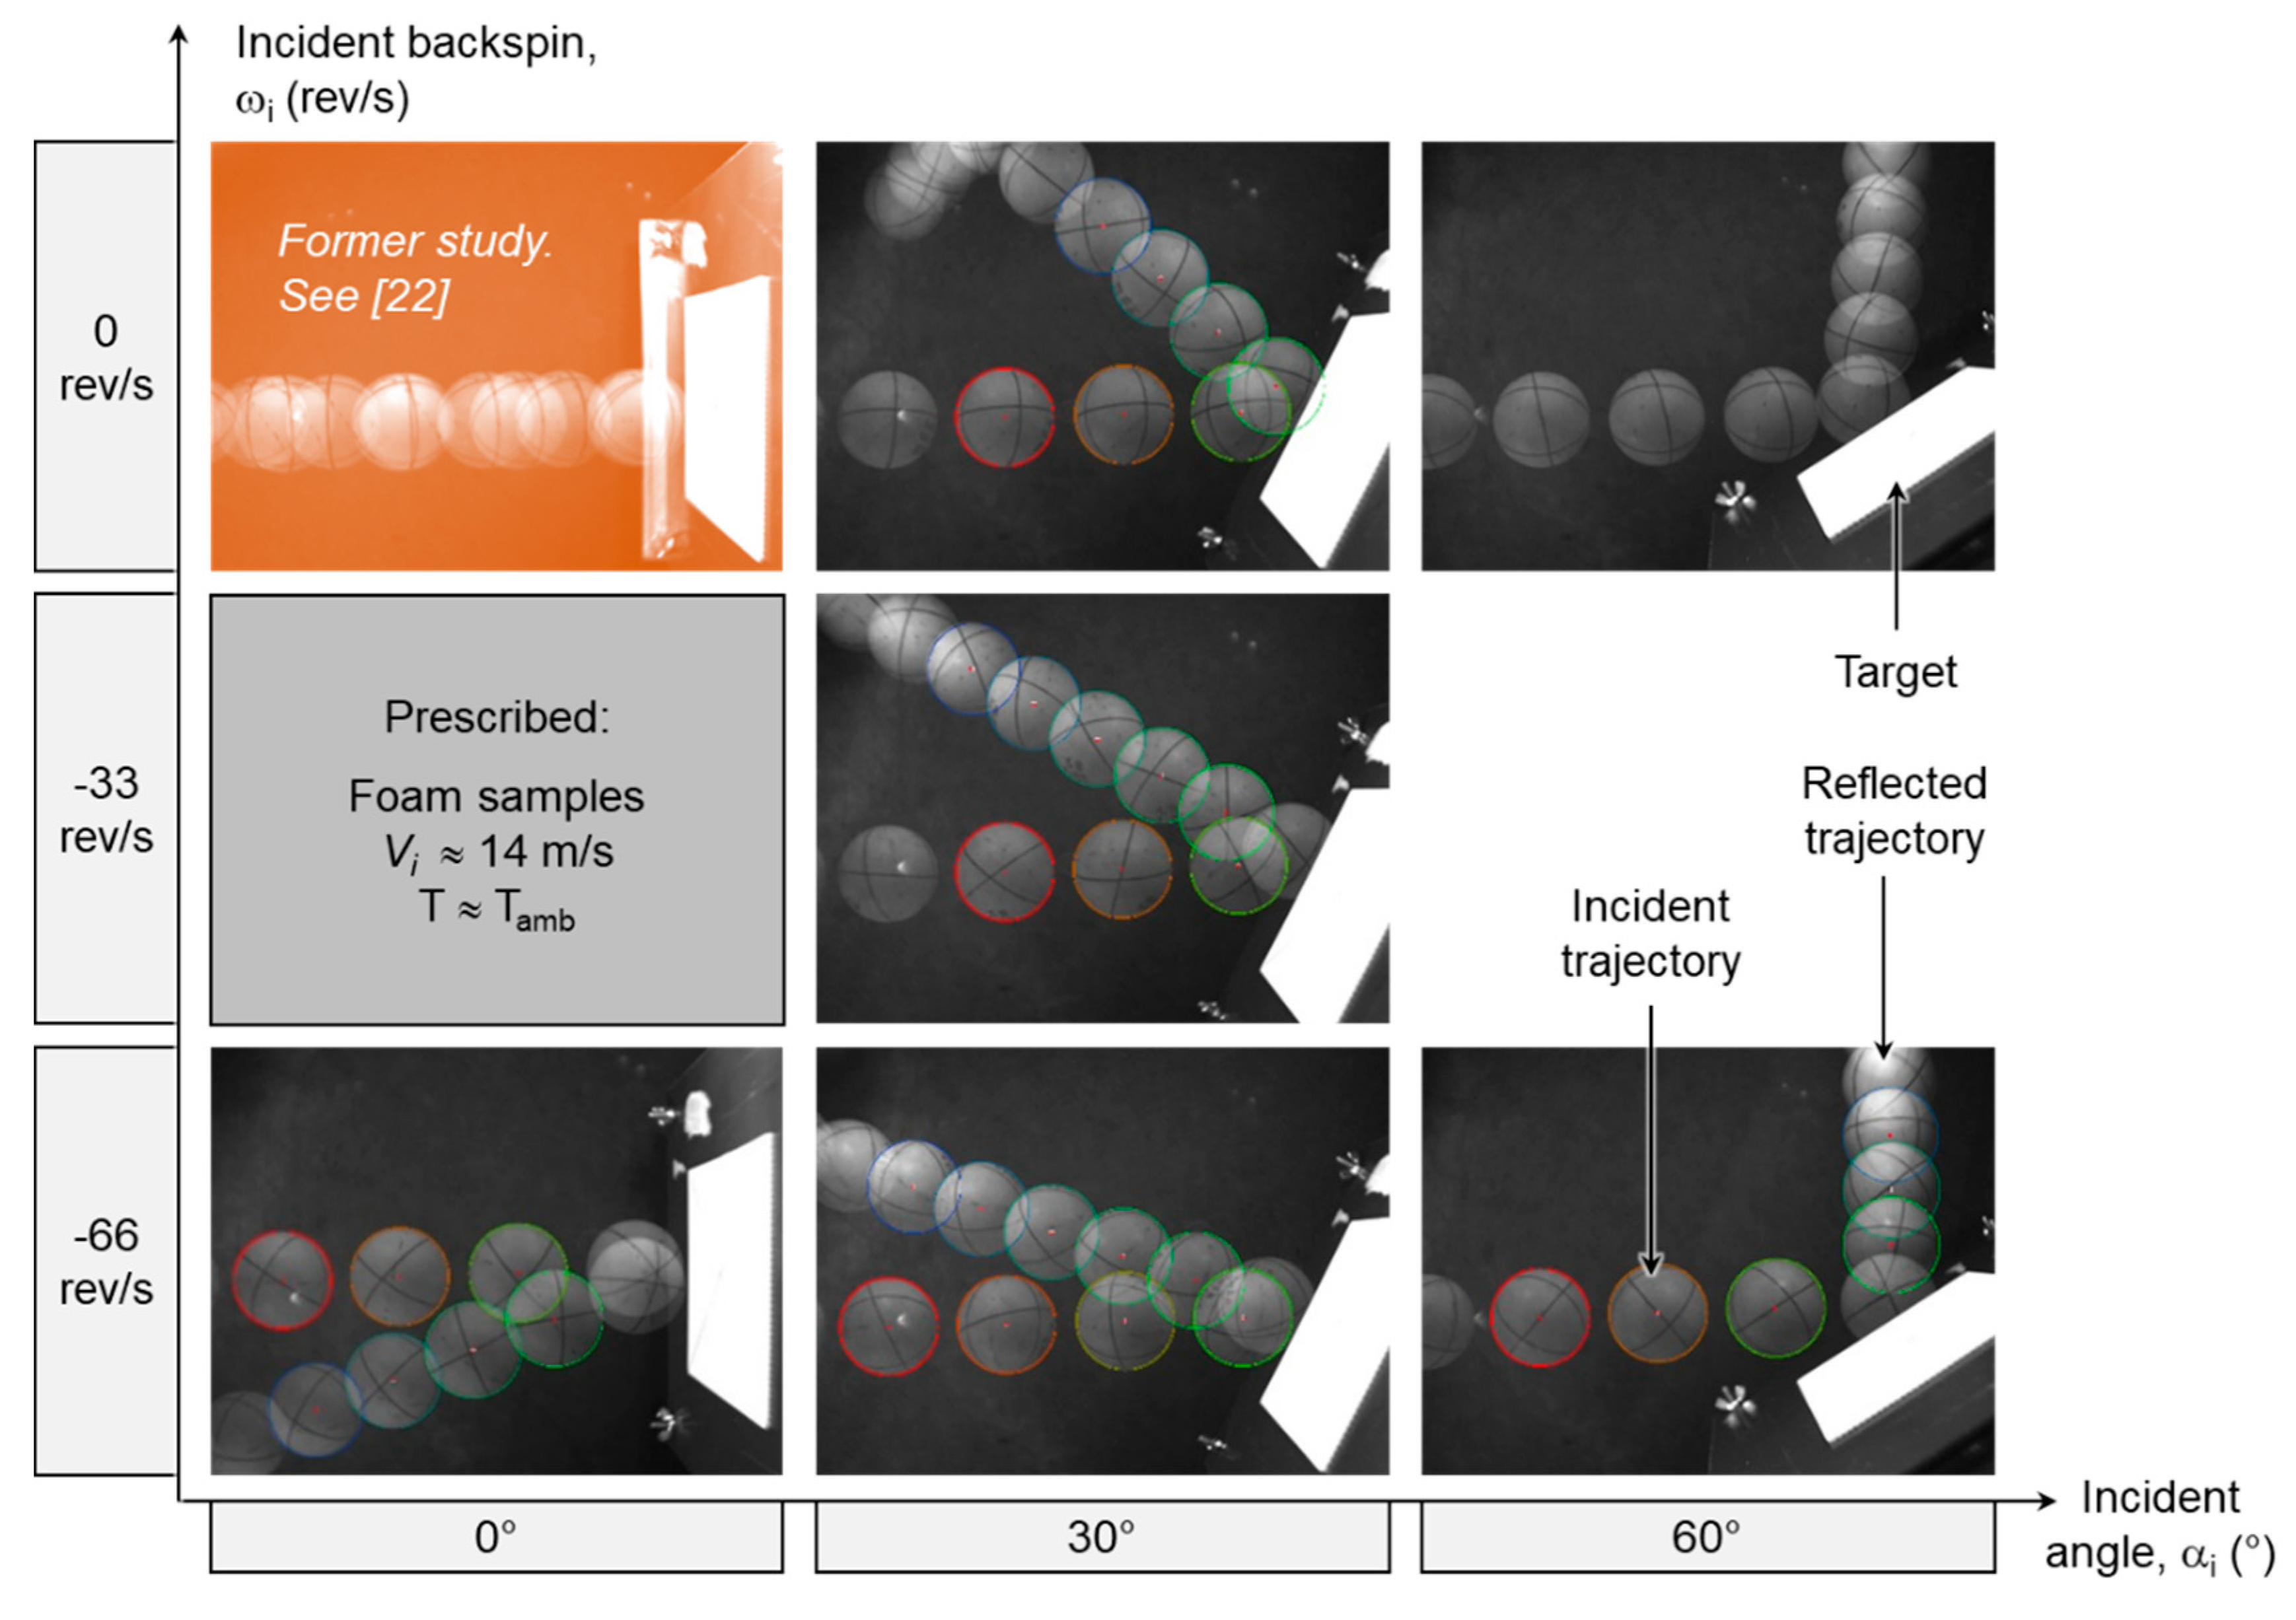
Figure 4 presents, in a double entry array form, an overview of the impact conditions tested on the foam sample. Impact tests with varying negative (anticlockwise) angular velocities and incident angles are reported in the different rows and columns respectively. All the tests were performed at a constant linear velocity of 14 m/s and ambient temperature. Three different spin (0, −33 and °66 rev/s) and three different angles (0, 30° and 60°) were considered. The top left image corresponds to a normal impact with no spin that has been studied and documented in the previous study [
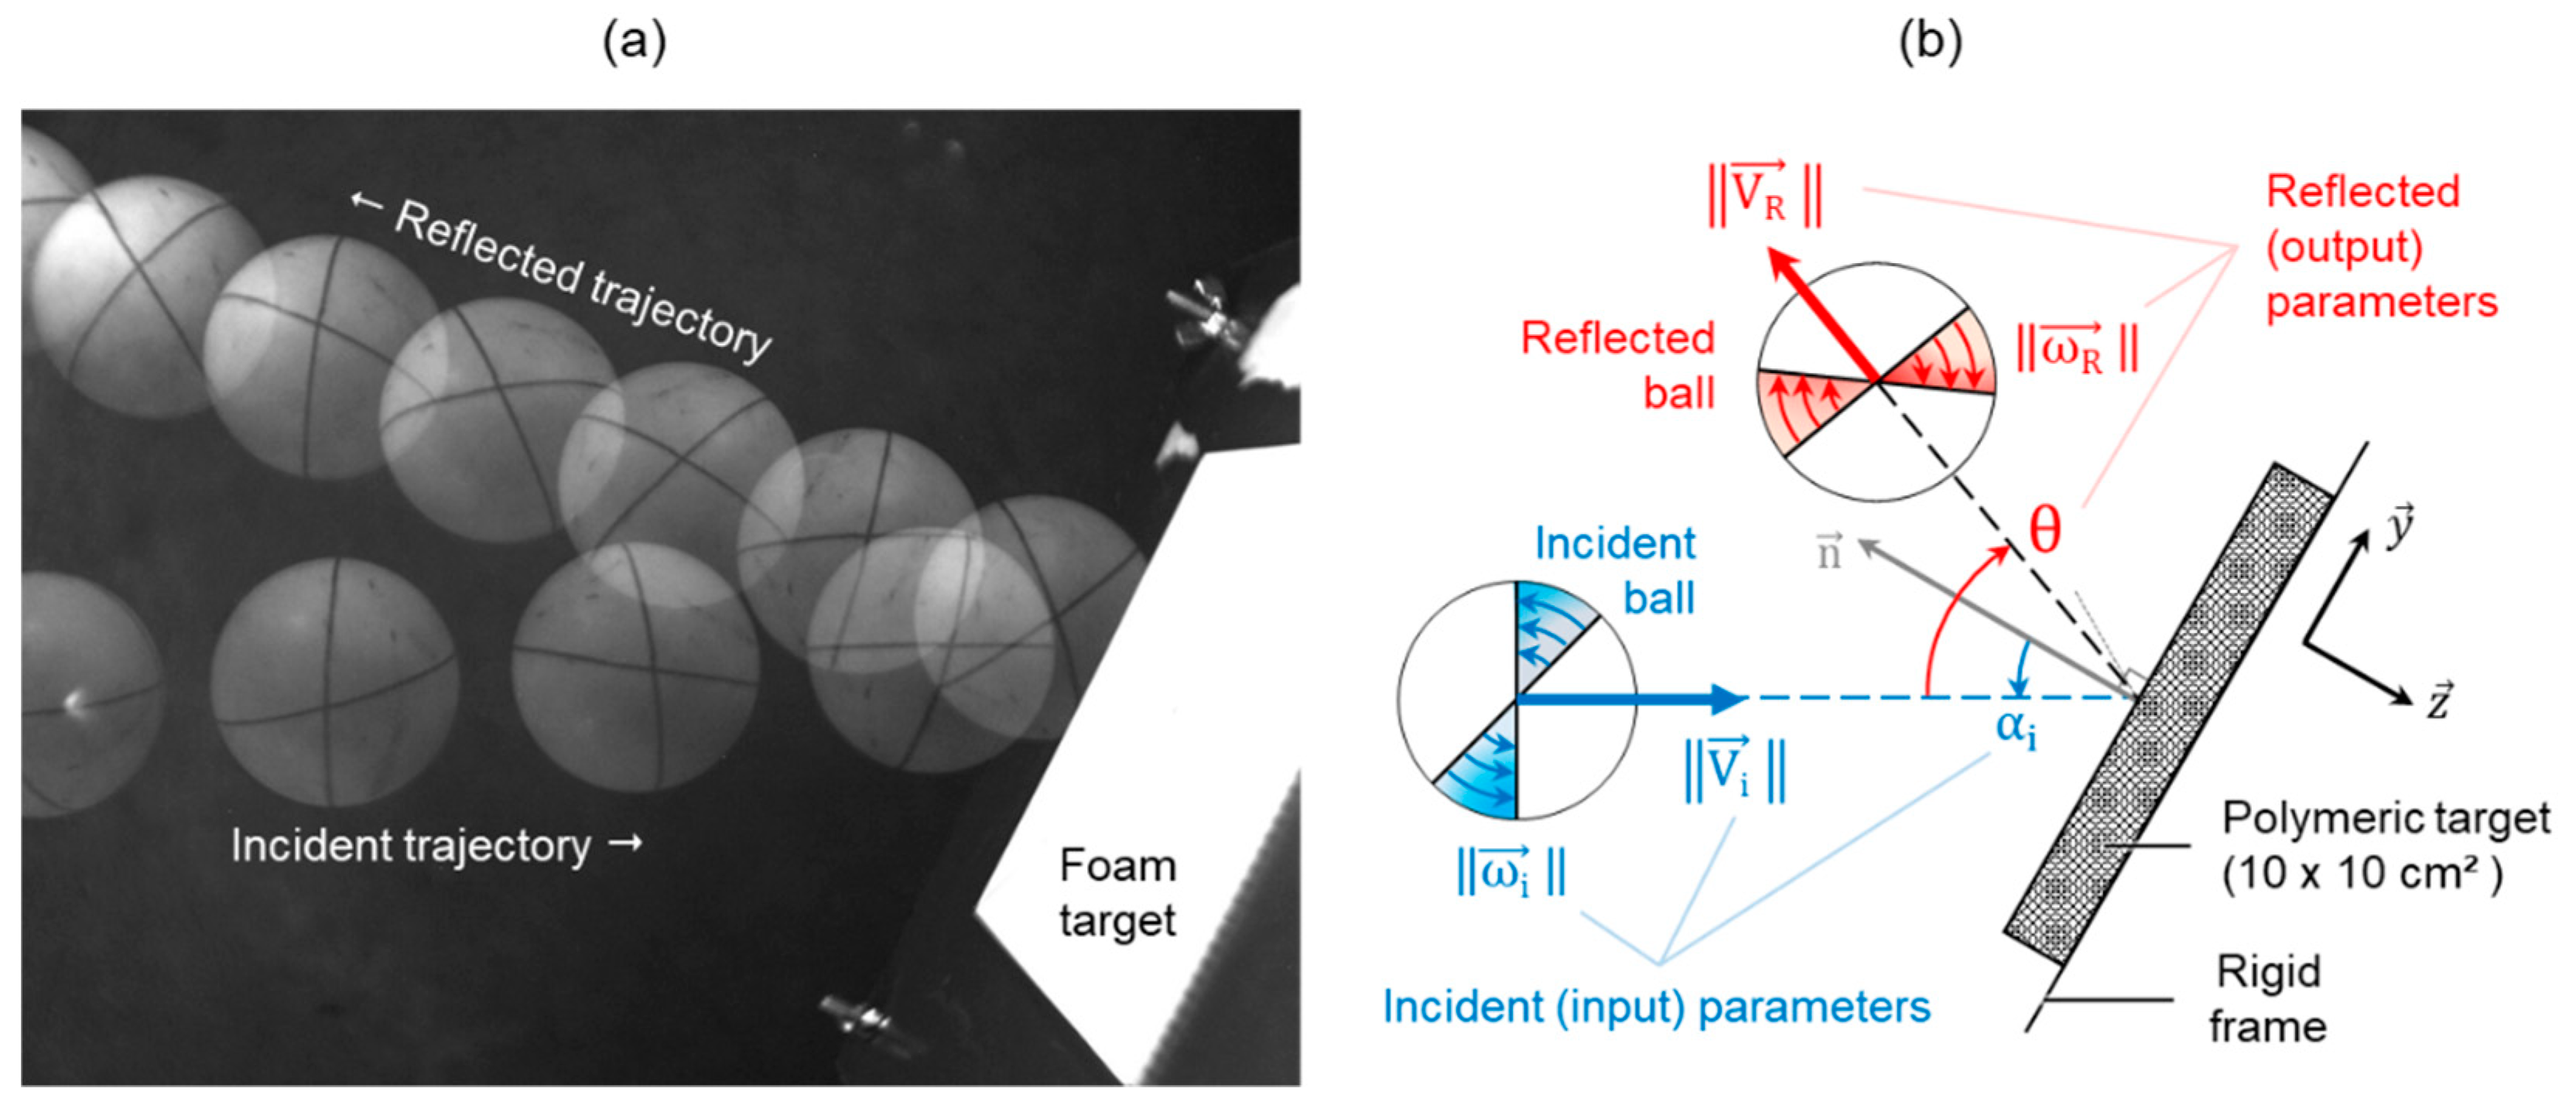
22]. Under the new tested loading conditions, incident and reflected trajectories were easily distinguished.
Studying the effect of the incident spin for a fixed angle, or the effect of the incident angle for a fixed spin was obtained by focusing on one row or column respectively. For instance, the effect of the incident angle when the ball was thrown at 14 m/s with a backspin of 66 rev/s is presented in
Figure 5.
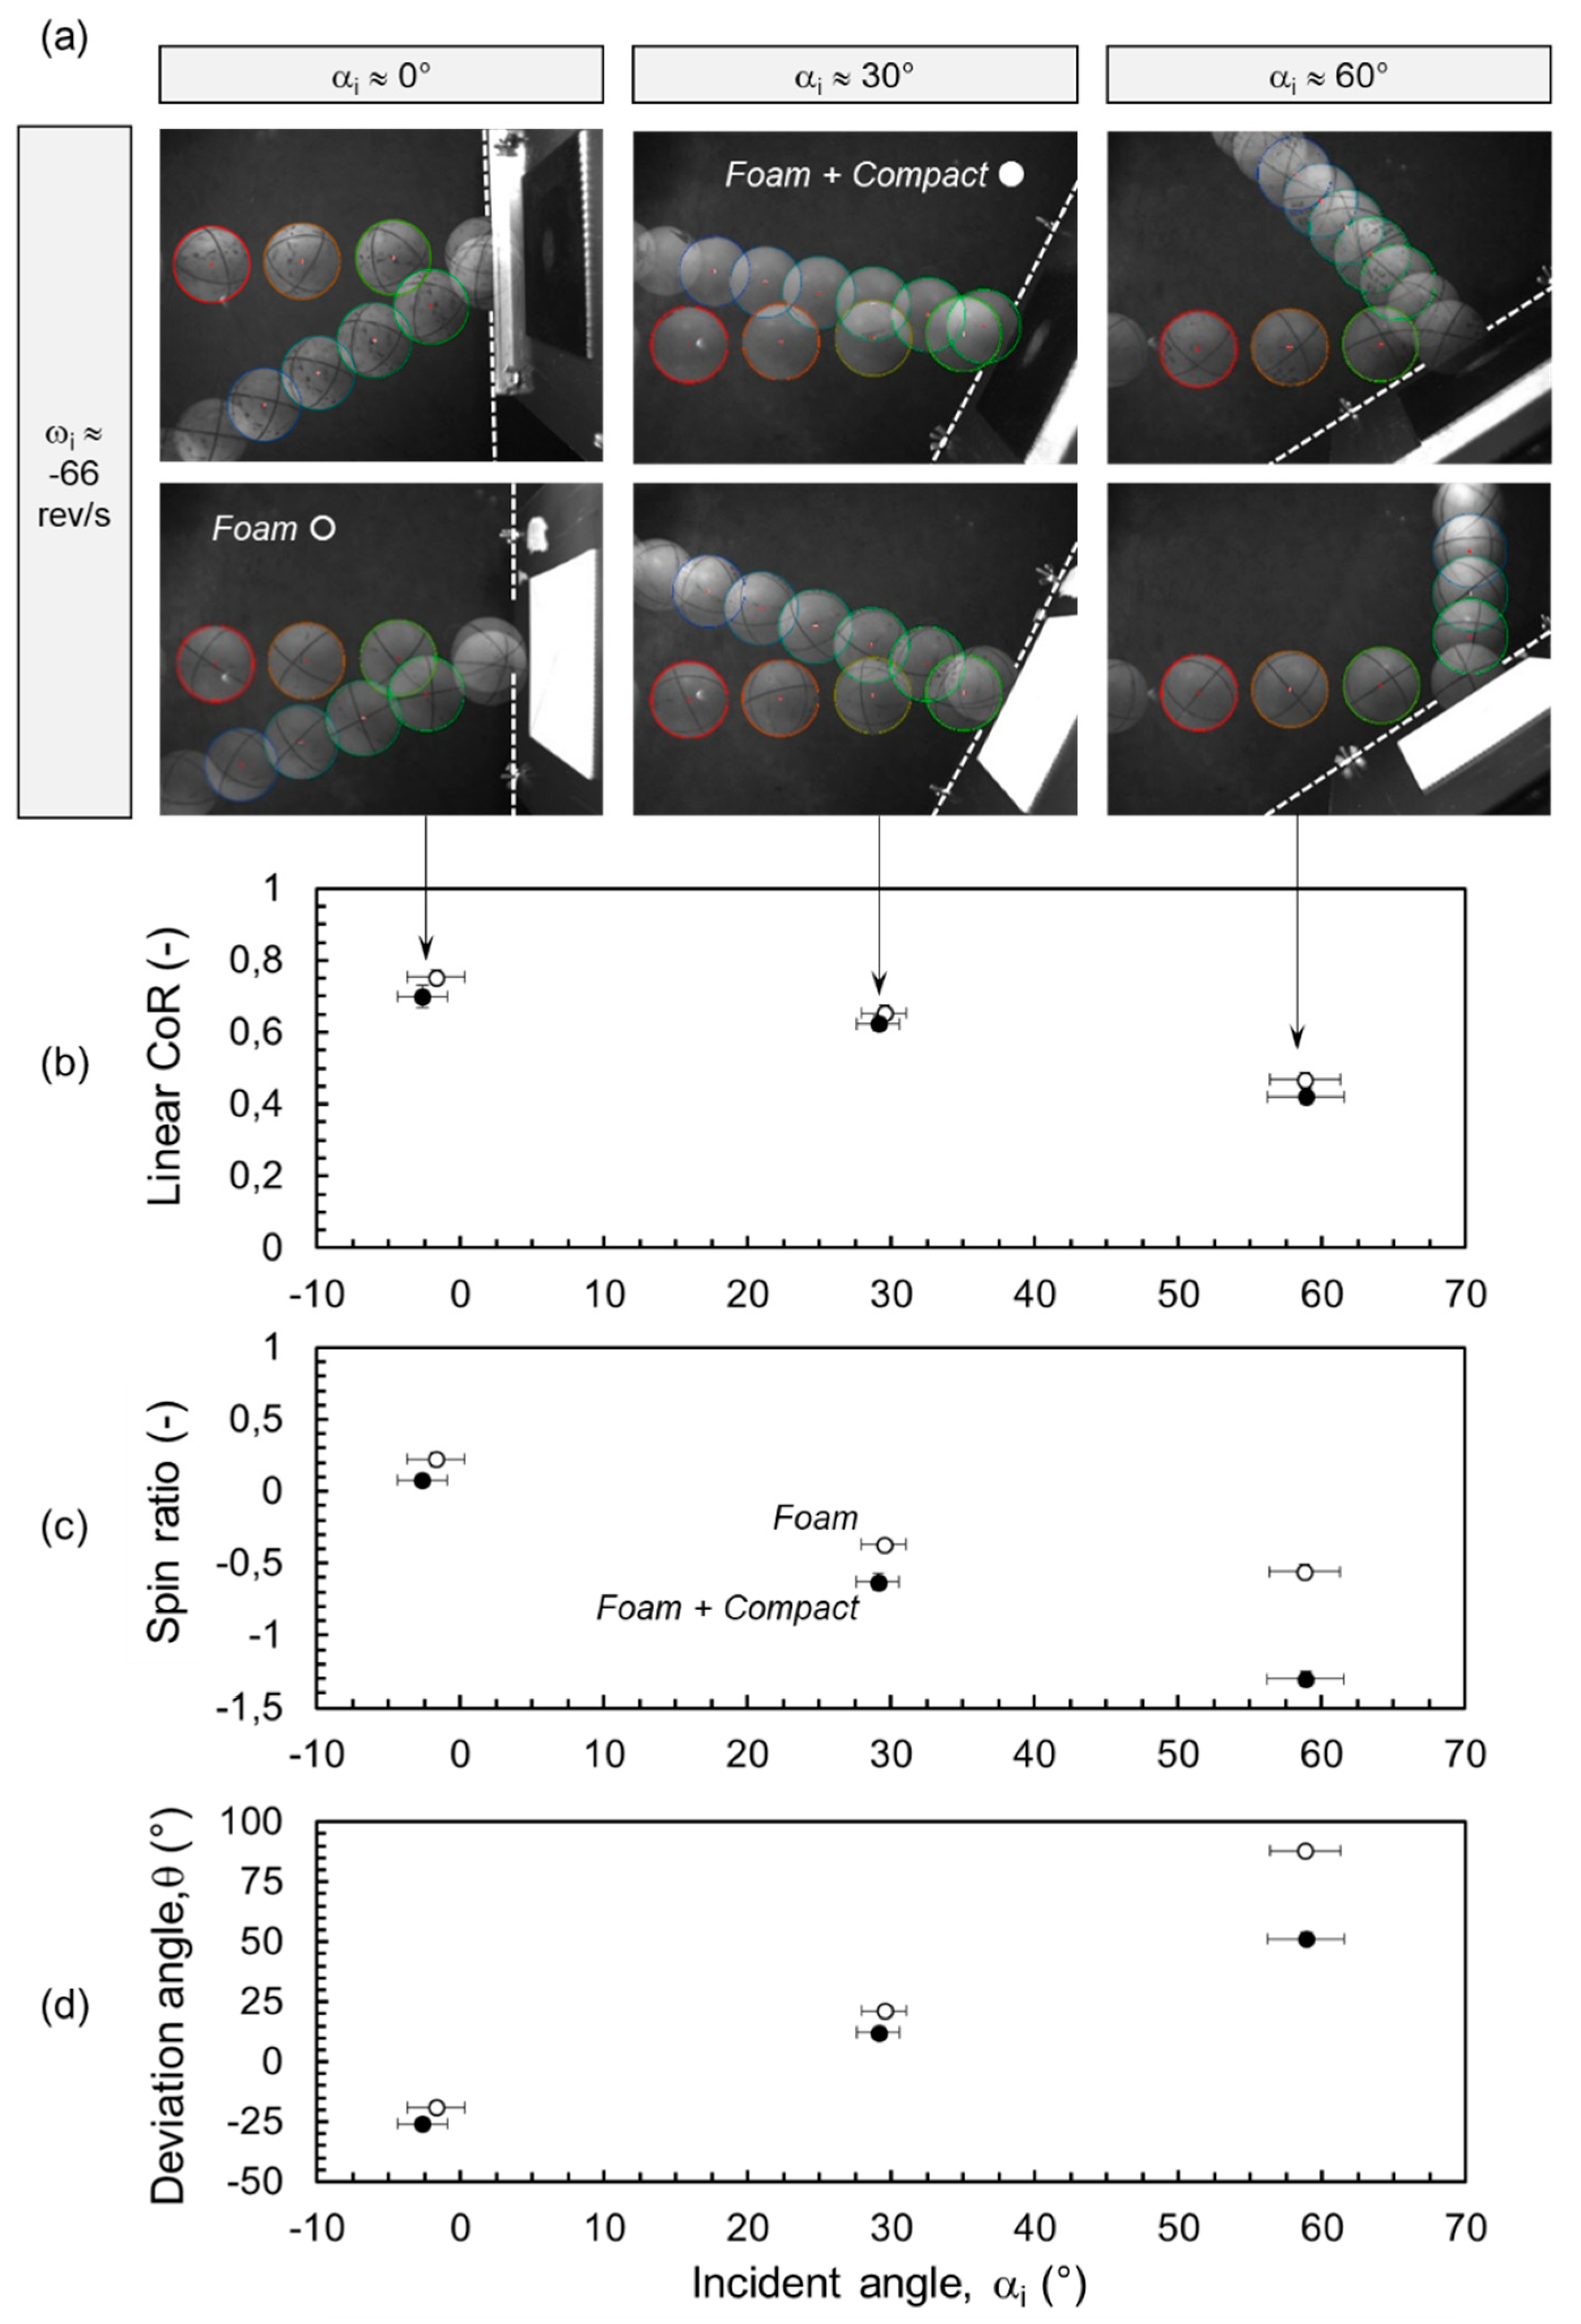
Figure 5a displays the raw images of the impact performed on the
foam + compact (row 1) and
foam (row 2) samples. At first sight, noticeable differences in the reflected trajectories was observed between the two samples for a given {
;
}.
Further quantitative analysis is presented in
Figure 5b–d where the linear coefficient of restitution, the spin ratio and the deviation angle are respectively plotted as a function of the incident angle. Increasing the incident angle led to a decrease in the linear coefficient of restitution, the values for the
foam + compact being slightly smaller than those measured on the
foam alone.
For the two other metrics, a change in the sign was observed between the normal tests ( = 0) and the tilted ones ( 0). For the normal tests, the spin did not change direction and the ball bounced back with a negative deviation angle. For tilted tests, the spin sign did change leading to negative spin ratio and positive deviation angles.
Focusing on the magnitudes, here again a clear distinction could be made between the normal and tilted tests. For normal impacts, the foam + compact sample led to a larger deviation angle and a smaller spin ratio than the foam specimen. The opposite conclusions prevailed when the incident angle was set equal to 30 or 60°. Finally, the greater the incidence, the larger the difference between the two targets.
A companion study where the incident angle was prescribed to 30° and the incident backspin varied, is presented in
Figure 6.
Figure 6a displays the raw images of the impact performed on the
foam + compact (row 1) and
foam (row 2) samples and
Figure 6b–d display respectively the evolution of the linear coefficient of restitution, the spin ratio and the deviation angle as a function of the incident backspin. The linear coefficient of restitution is seen to remain almost constant, with the foam values remaining slightly larger than the foam + compact ones. For the sake of comparisons, the values gathered in [
22] for normal impact with no spin were superimposed, evidencing that a deviation from the normal incidence led to a decrease in the
of about 10 percent. Regarding the spin ratio reported in
Figure 6b, negative values were found and its magnitudes decreased as the backspin increased, with larger values being found for the
compact + foam sample. Finally, the deviation angle decreased with increasing backspin. The foam sample exhibited the larger angles compared to the foam + compact sample and the gap increased with increasing backspin.
In summary, distinct discrepancies were experimentally found between the foam and foam + compact samples response to impact. Whatever the impact condition tested, the linear coefficient of restitution of the foam + compact was smaller than the one of the foam alone. Also, normal impact aside, impact tests performed on the foam + compact target resulted in a larger spin ratio and a smaller deviation angles.
4. Modeling Ball/Pad Impact
As outlined in the introduction, the objective of this section consisted in challenging, with this new set of data, the modelling strategy that had been implemented in [
22] to simulate normal impact with no spin. Thus, only minor adjustments were applied to the finite element model. For instance, the constitutive behavior of the constituents remained unchanged. The major modeling assumptions are recalled in the following two first subsections.
4.1. Finite Element Model Description
Explicit 3D finite elements simulations using the commercial software ABAQUS© [
26] were pursued to model the impact experiments. With this modeling strategy, the geometry/architecture, the materials intrinsic behavior and the contact properties of the mechanical problem were considered.
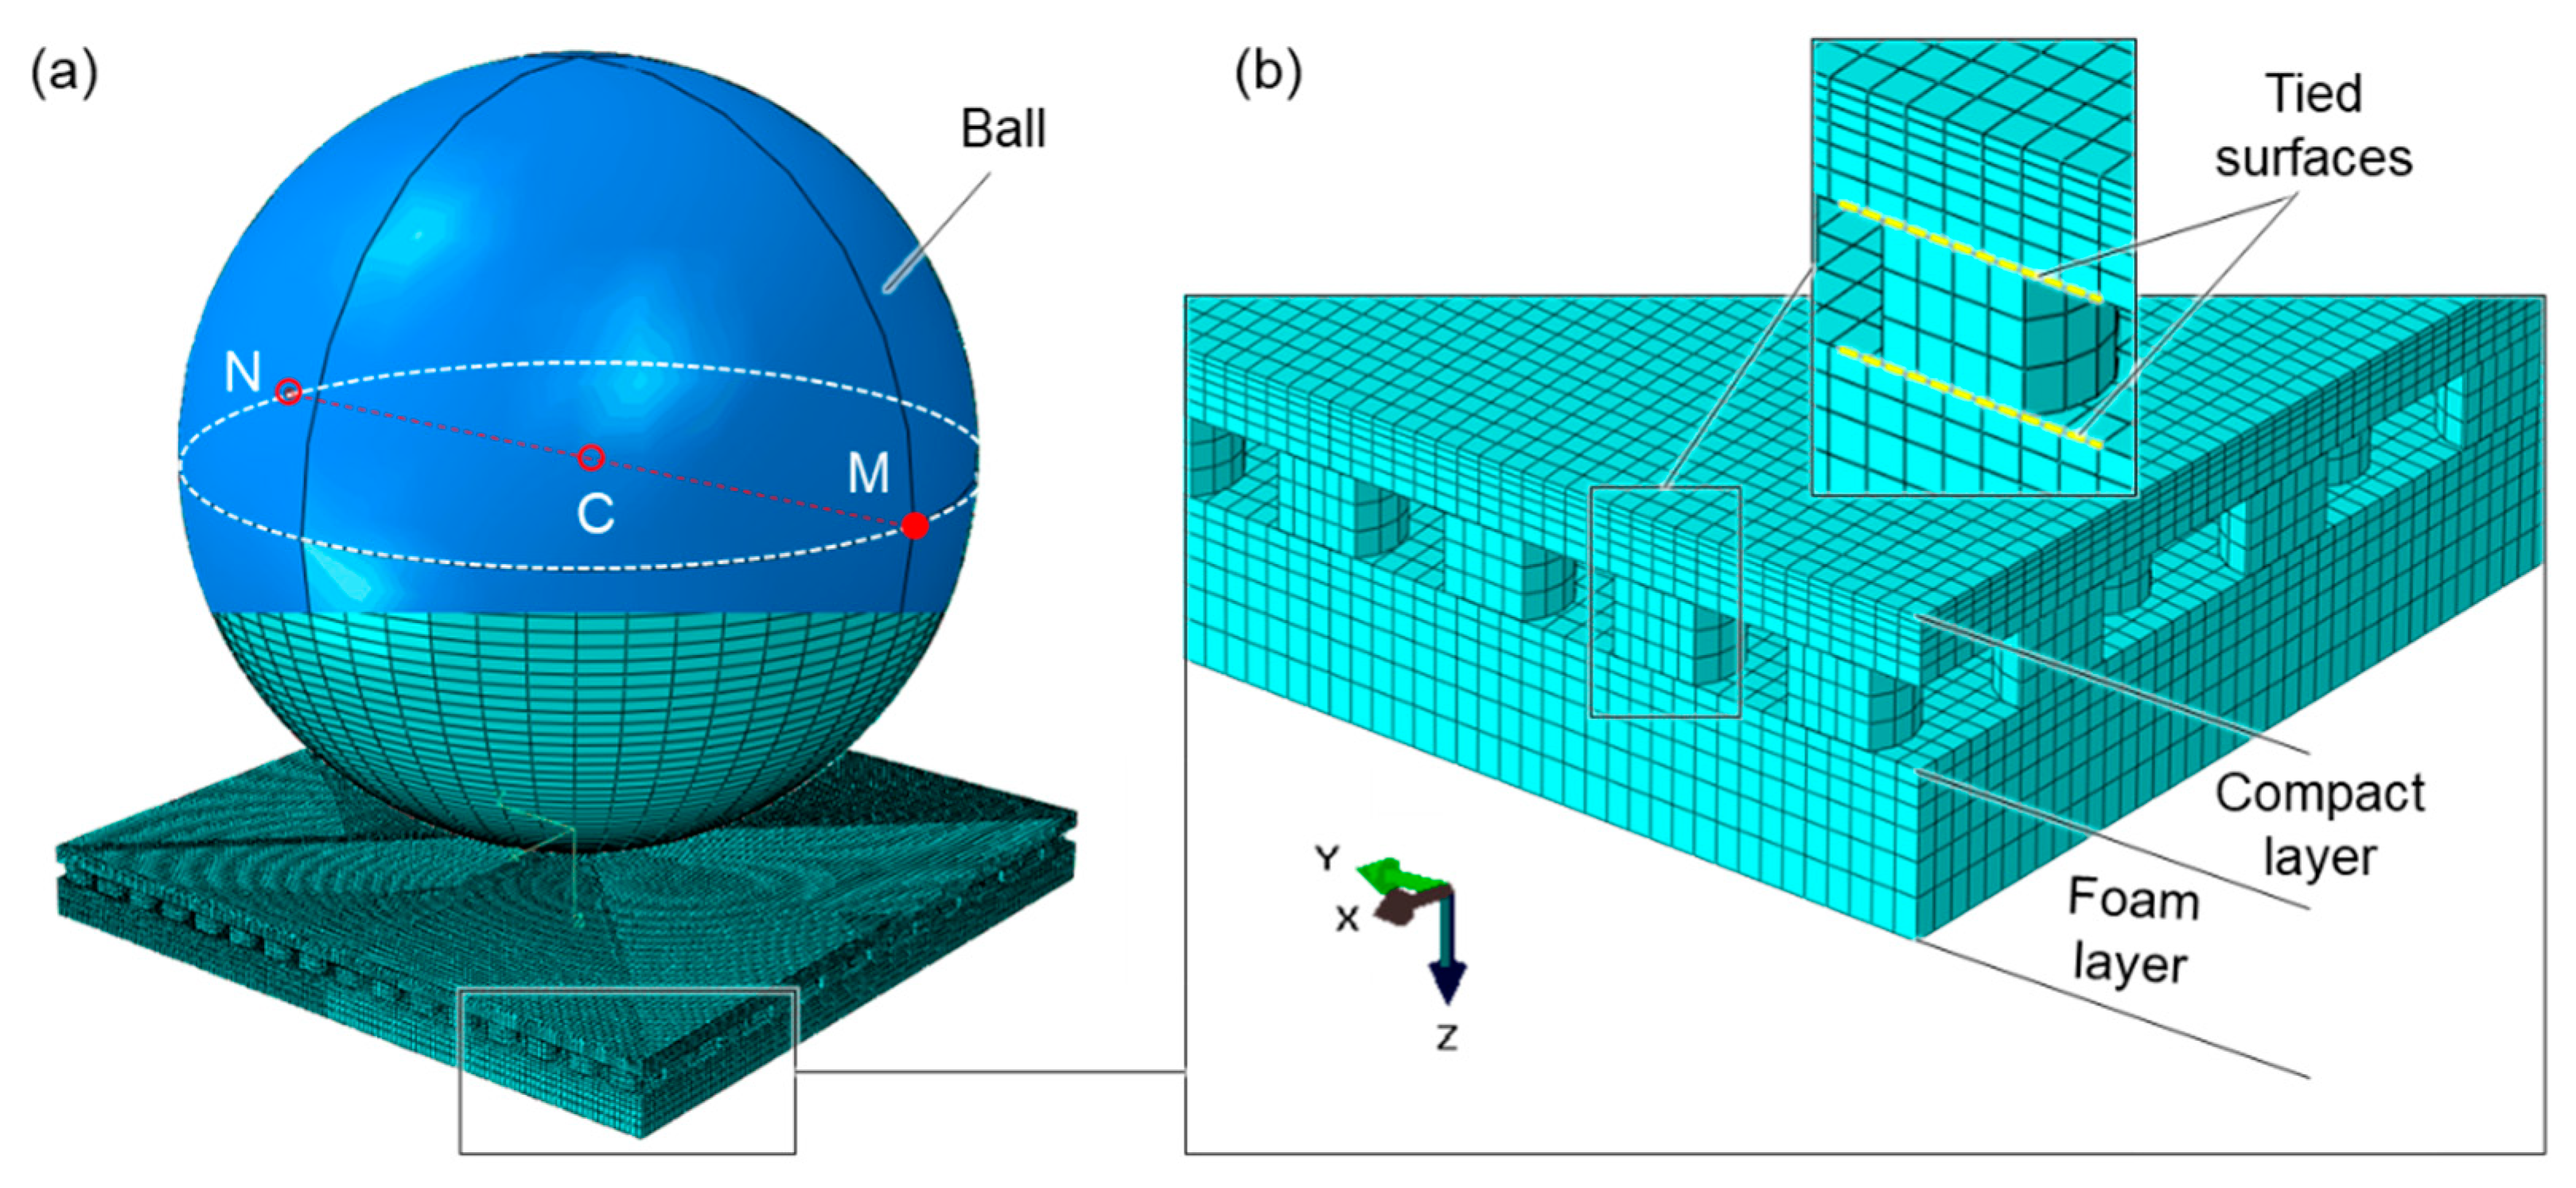
The 3D model is presented in
Figure 7a. The ball comprises 5058 S4R shell elements with five integration points through the thickness and the polymeric layers is made of 221,598 C3D8R elements: 100,314 elements for the foam layer, 26,028 for the periodic array of perfectly cylindrical pimples and 95,256 elements for the dense top layer of the compact. This distinction has been made since these three layers were modelled as different instances that were bonded together when needed, using the tie function between the shared surfaces as evidenced in the inset of
Figure 7b.
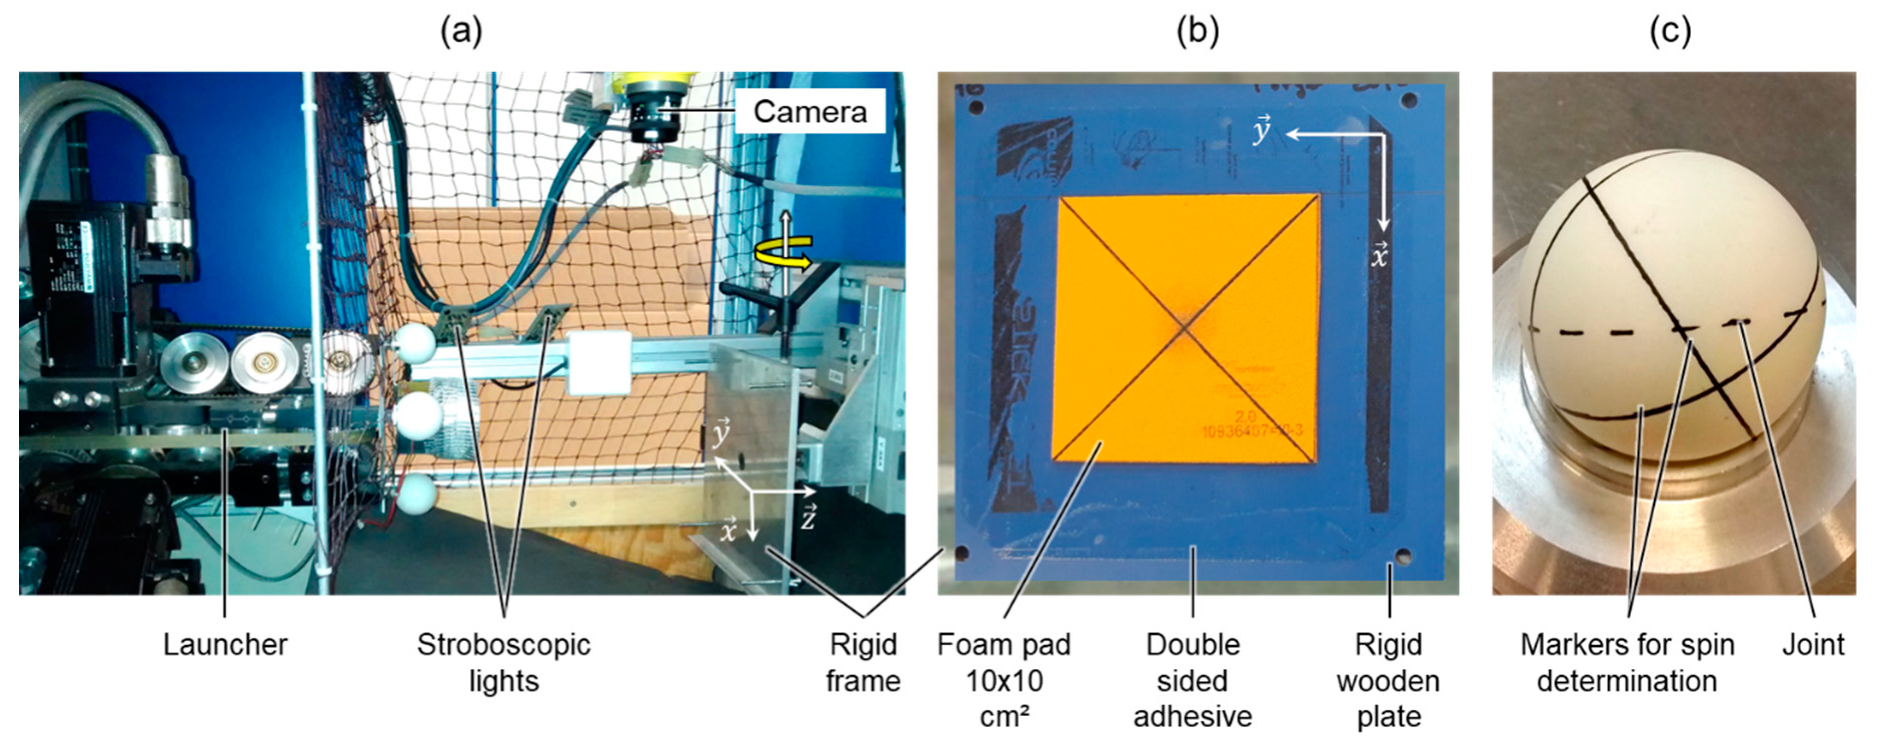
The nodes of the foam bottom free surface were fixed to replicate its gluing onto the wooden rigid frame. At time t = 0 the ball was positioned 0.3 mm away from the top surface of the target. In order to ensure its rigid motion, the initial velocity was assigned to every node M of the ball and was calculated using the following transport equation:
with
and
the linear and angular velocities of the ball center C. The velocity was applied for a short duration (10
−6 s) and the ball was then let free to move (the drag force and gravity were not implemented). Also, constant internal pressure equal to the atmospheric pressure was prescribed as justified elsewhere [
8].
The contact between the two bodies was defined
rough if not otherwise specified. More precisely, the rough condition implies an infinite coefficient of friction (total adhesion), suggesting that all relative sliding motion between two contacting surfaces is prevented [
27]. It is worth mentioning that this hypothesis was used in [
22] to successfully predict the linear coefficient of restitution of the various polymeric targets normally impacted. This hypothesis is strongly challenged and discussed with this new set of data.
4.2. Intrinsic Behavior of the Constituents
A rate-dependent dissipative elastic description was used to describe the ball parent glassy material since it did not overcome its elastic limit under the large set of impact tested. The foam and the compact were defined as rate-dependent dissipative hyperelastic materials. The same constitutive equation was used for both layers as justified in [
22].
Dynamic mechanical analysis (DMA) tests and time-temperature superposition principles were used to characterize the dissipative rate dependence elastic behavior of the different materials. Additional quasi-static compression test was performed on the foam system to characterize its large non-linear deformation behavior. An overview of the DMA response in the tensile mode of the ball parent material and the foam are displayed in
Figure 8a,b respectively, and the large strain compression response of the foam is presented in
Figure 8c. The reader should refer to [
22] for further details on the methods and testing conditions.
In ABAQUS©, Prony series fitting the experimentally based time-dependent shear modulus of visco-elastic materials G(t) were implemented. Nine discrete Maxwell elements were identified for the ball and the foam (and compact). Constant Poisson ratio were allocated to the polymeric constituents to control the volumetric behavior. Finally, table data of the experimental strain-stress response was used to fit the isotropic Ogden strain energy potential for the long-time hyperelastic behavior of the polymeric coatings layers [
27]. It is worth noting that the Mullins and Payne effects of the elastomeric layers were neglected and their potential effects minimized experimentally (by testing and characterizing fatigued samples on the one hand and controlling the recovering time between consecutive impact tests) [
28].
Also, the foam was modeled as a continuum media whereas the exact architecture of the compact layer was modeled. Consequently, their density and Poisson ratio differ. Almost incompressible Poisson ratio (Cν = 0.49) and density Cρ = 1000 kg/m3 were assigned to the compact parent material whereas effective values of Fρ = 490 kg/m3 and Fν = 0.41 (determined using video-extensometry) were measured and implemented for the foam.
4.3. Experiments/Simulations Comparisons
While the ball’s simulated incident trajectory was an input, its reflected trajectory needed to be determined in order to compute the aforementioned metrics. Thus, the position of the center of the ball led to the determination of deviation angle and the linear coefficient of restitution and was calculated from the coordinates at any time increment of two nodes, denoted M and N in
Figure 7a, located away from the contact region. The center was half way between M and N, assuming that these two nodes corresponded at any time to the ball’s diameter.
With this assumption, the rotation angle β of the ball with respect to the out of plane
x-axis was determined as follows:
with {
,
} and {
,
} the in-plane y- and z-coordinates of the N and M points respectively. The associated angular velocity (spin) was then determined from two consecutive time increments:
with
and
the angle and time increments, respectively.
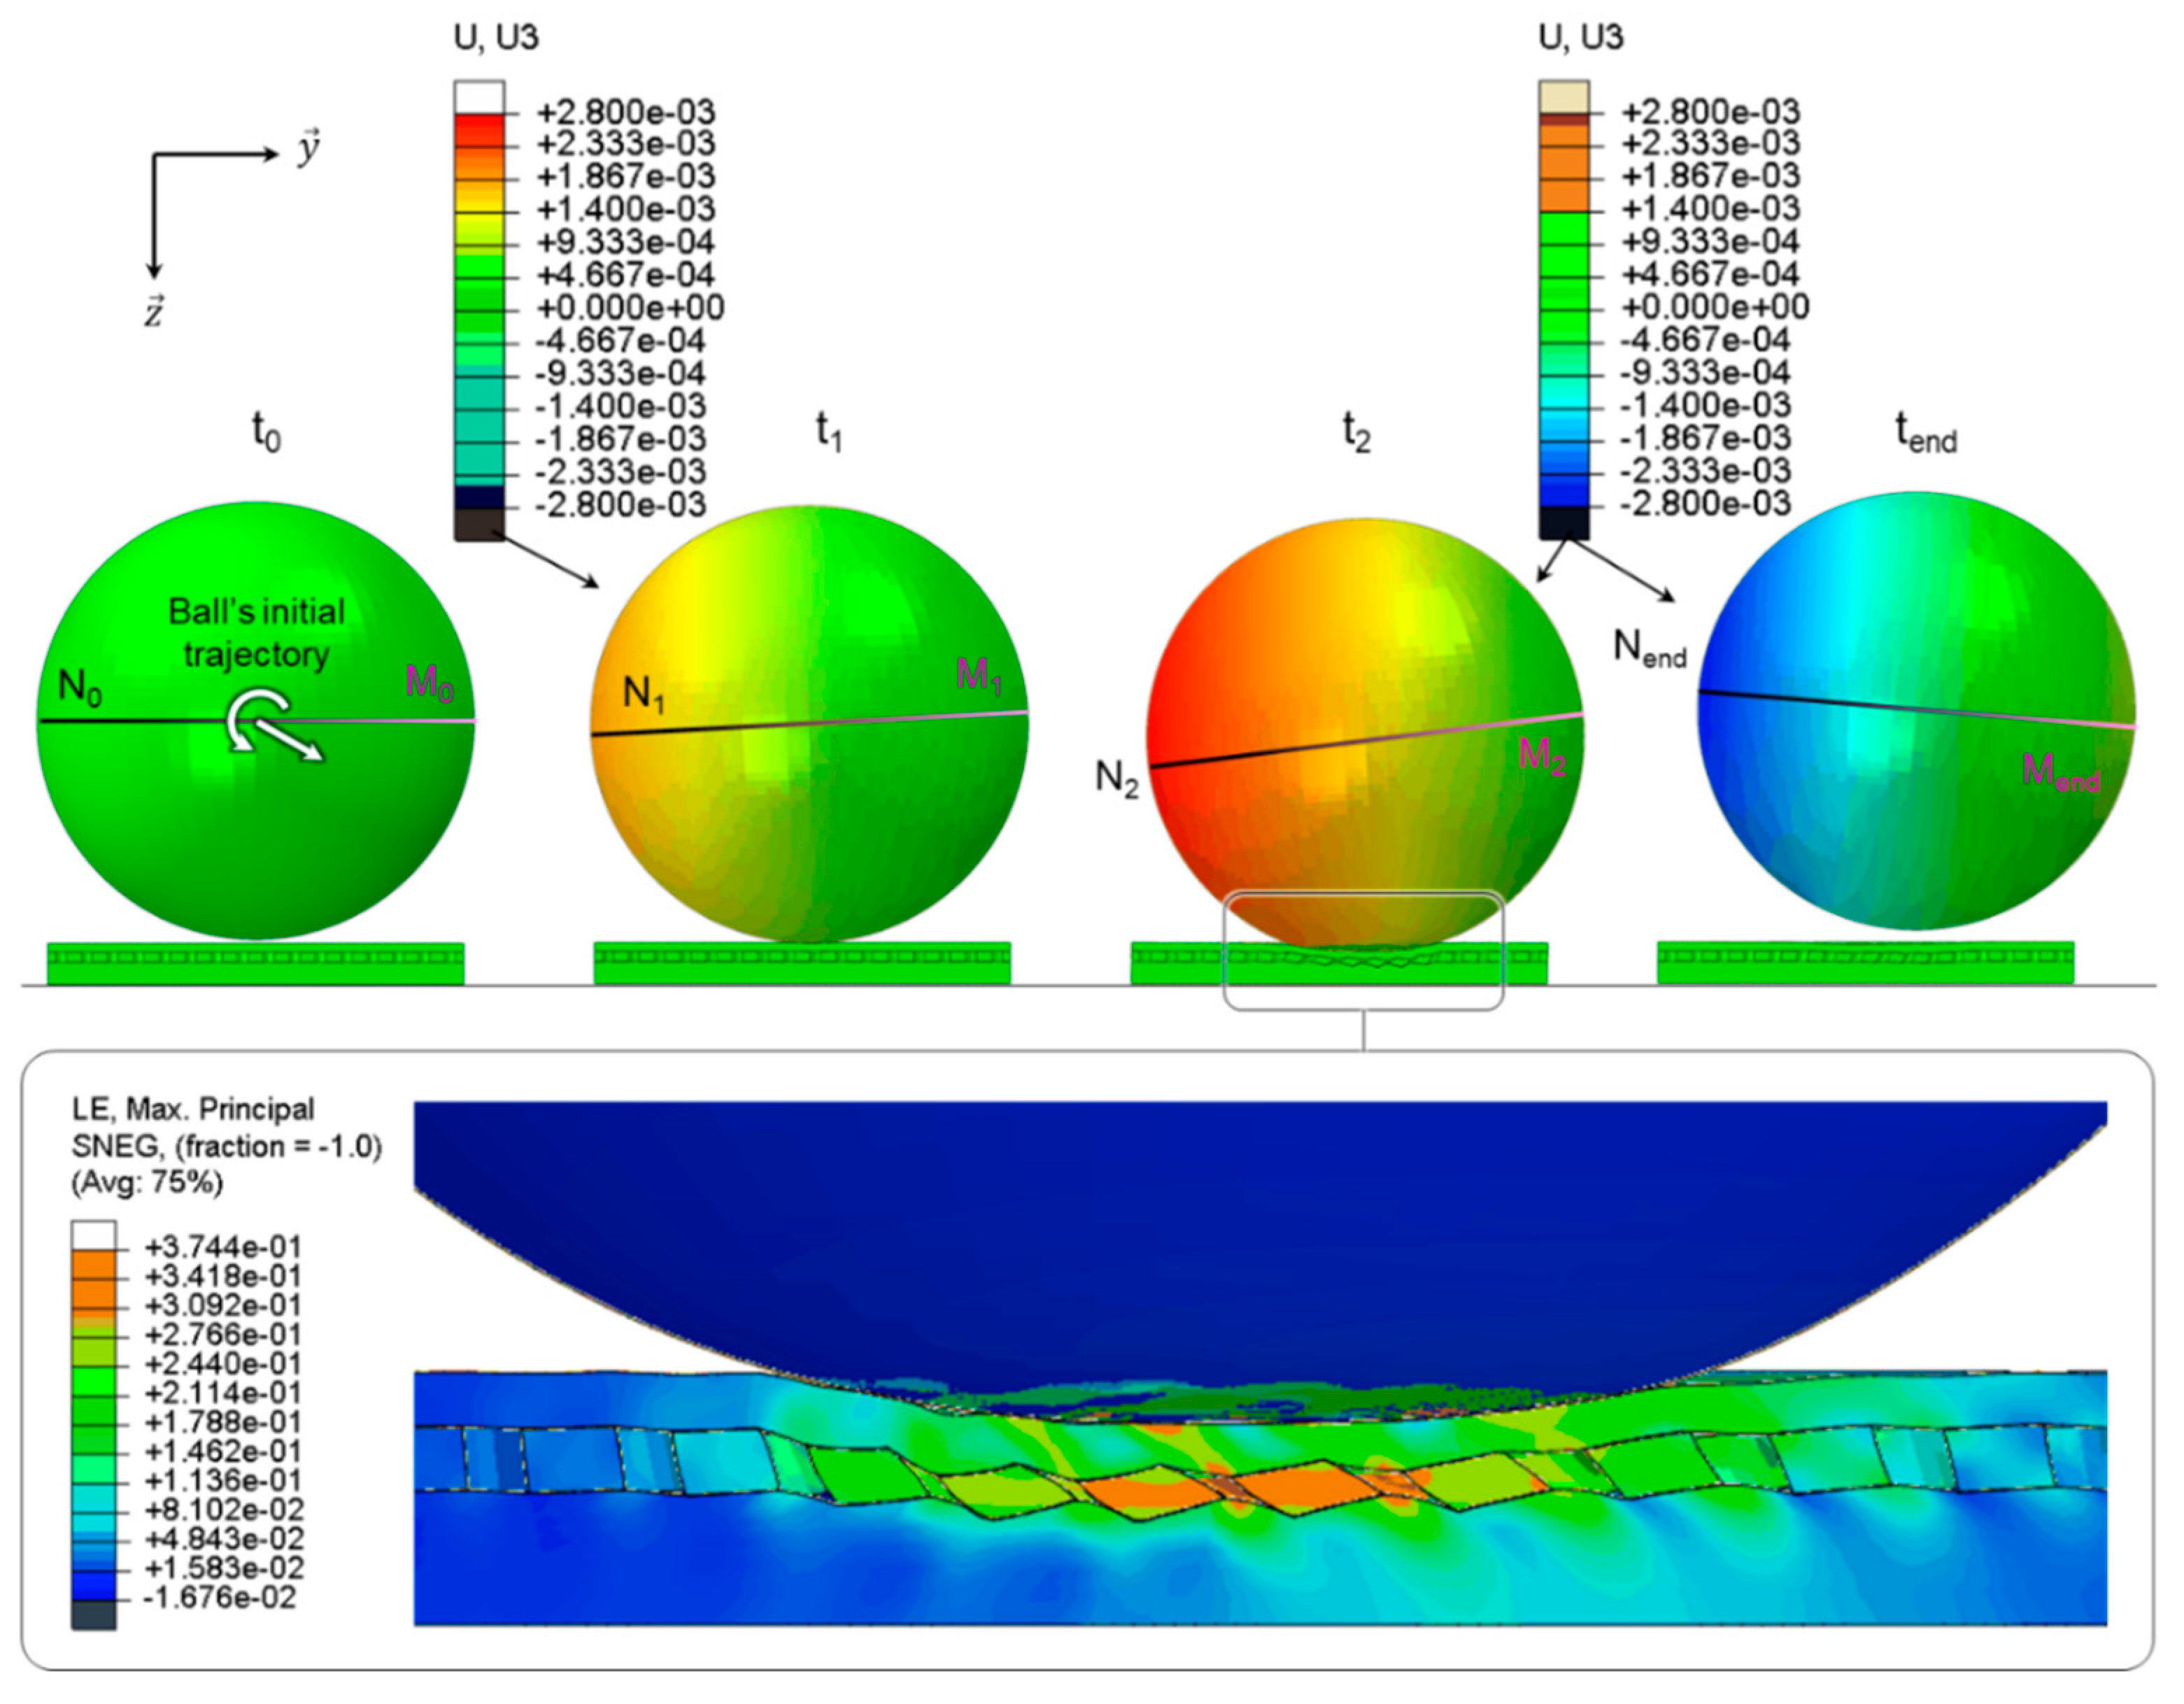
Figure 9 presents the simulated vertical displacement mapping for a ball impacting the
foam + compact target at a 60° angle, 14 m/s and −66 rev/s. Four screenshots are displayed corresponding to the initial time (t
0), first contact (t
1), contact at maximum depth (t
2) and end time (t
end). A close up view of the through-thickness deformation in the contact region at time t
2 is added to evidence the complex deformation pattern of the target layers. It is worth noting that no buckling of the ball occurred in this case and that the pimples were significantly sheared.
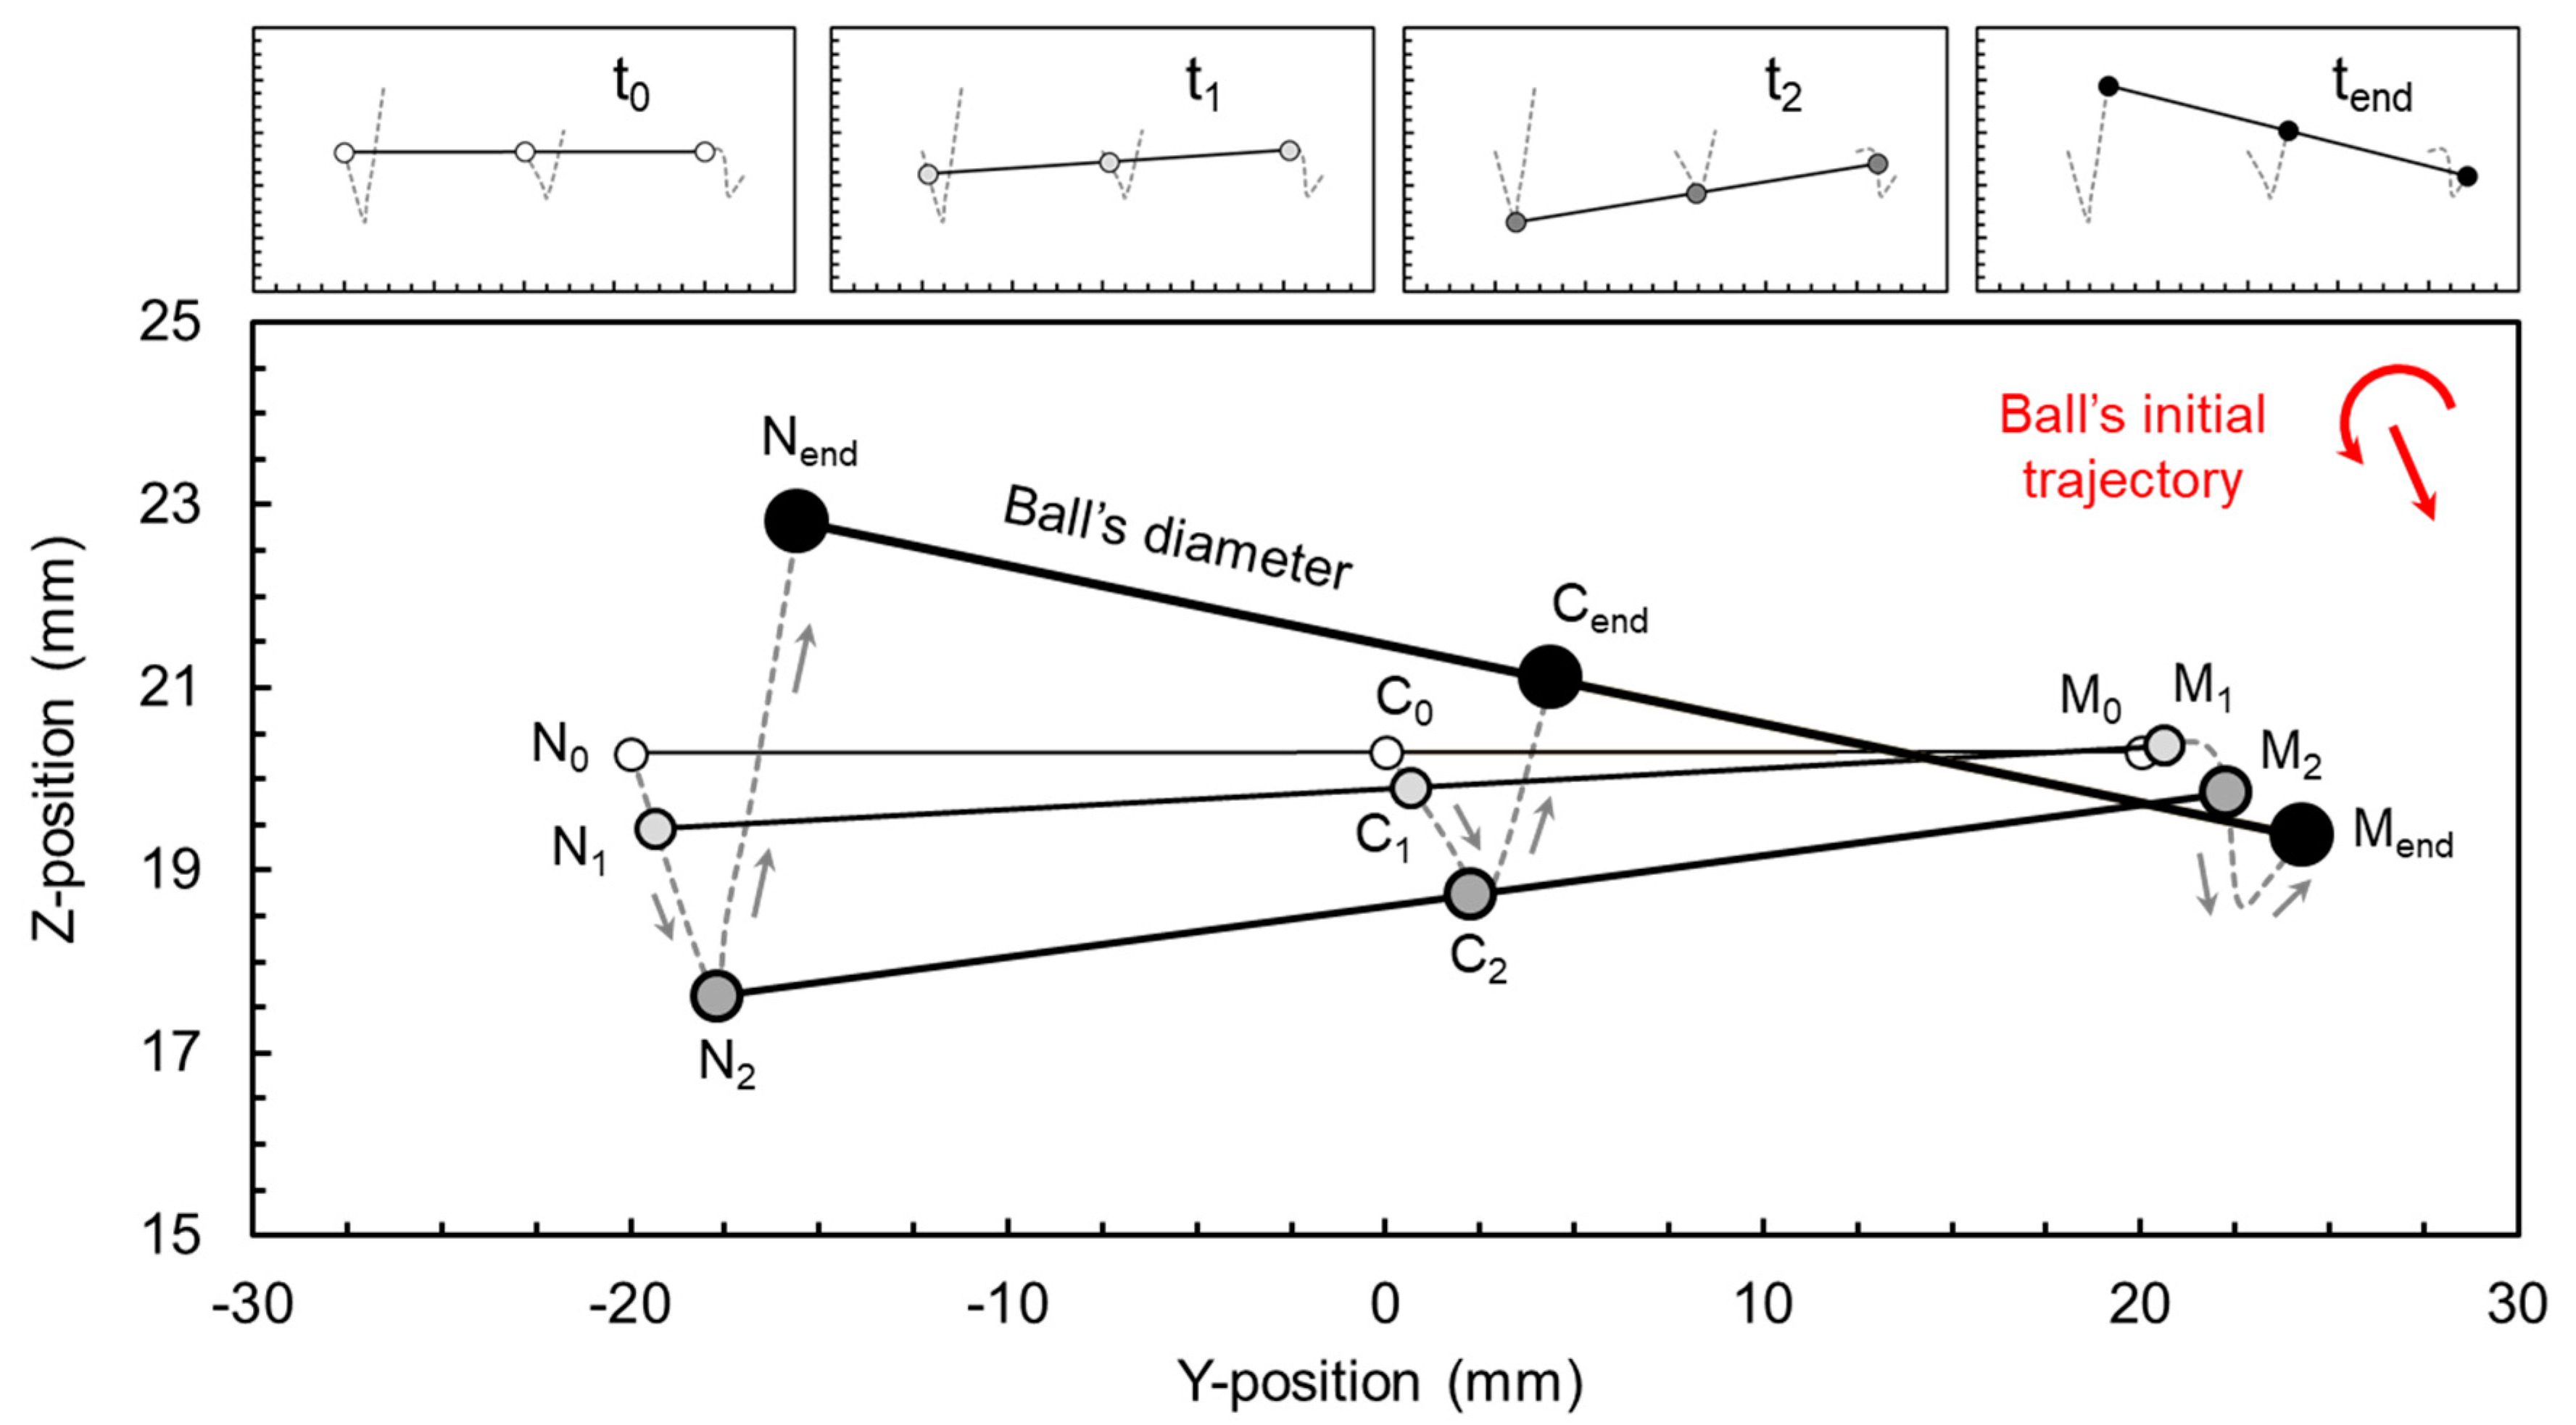
The positions of the N and M equatorial points, and a fictitious line connecting them are also displayed. As discussed above, their time positions were necessary for the metrics calculations. Also, the trajectories of the M, N and calculated C points are plotted in
Figure 10. The positions for the times selected in
Figure 9 are presented and the spin inversion is clearly evidenced.
In the previous study focusing on the normal impact with no spin, the linear coefficient of restitution was the sole relevant metric monitored. Also, finite element simulations with rough contact conditions resulted in fair predictions of the experimental data compared to simulations with frictionless ones. A similar study had been conducted in this work for the
foam sample impacted under various incidences and spins. The results are presented in
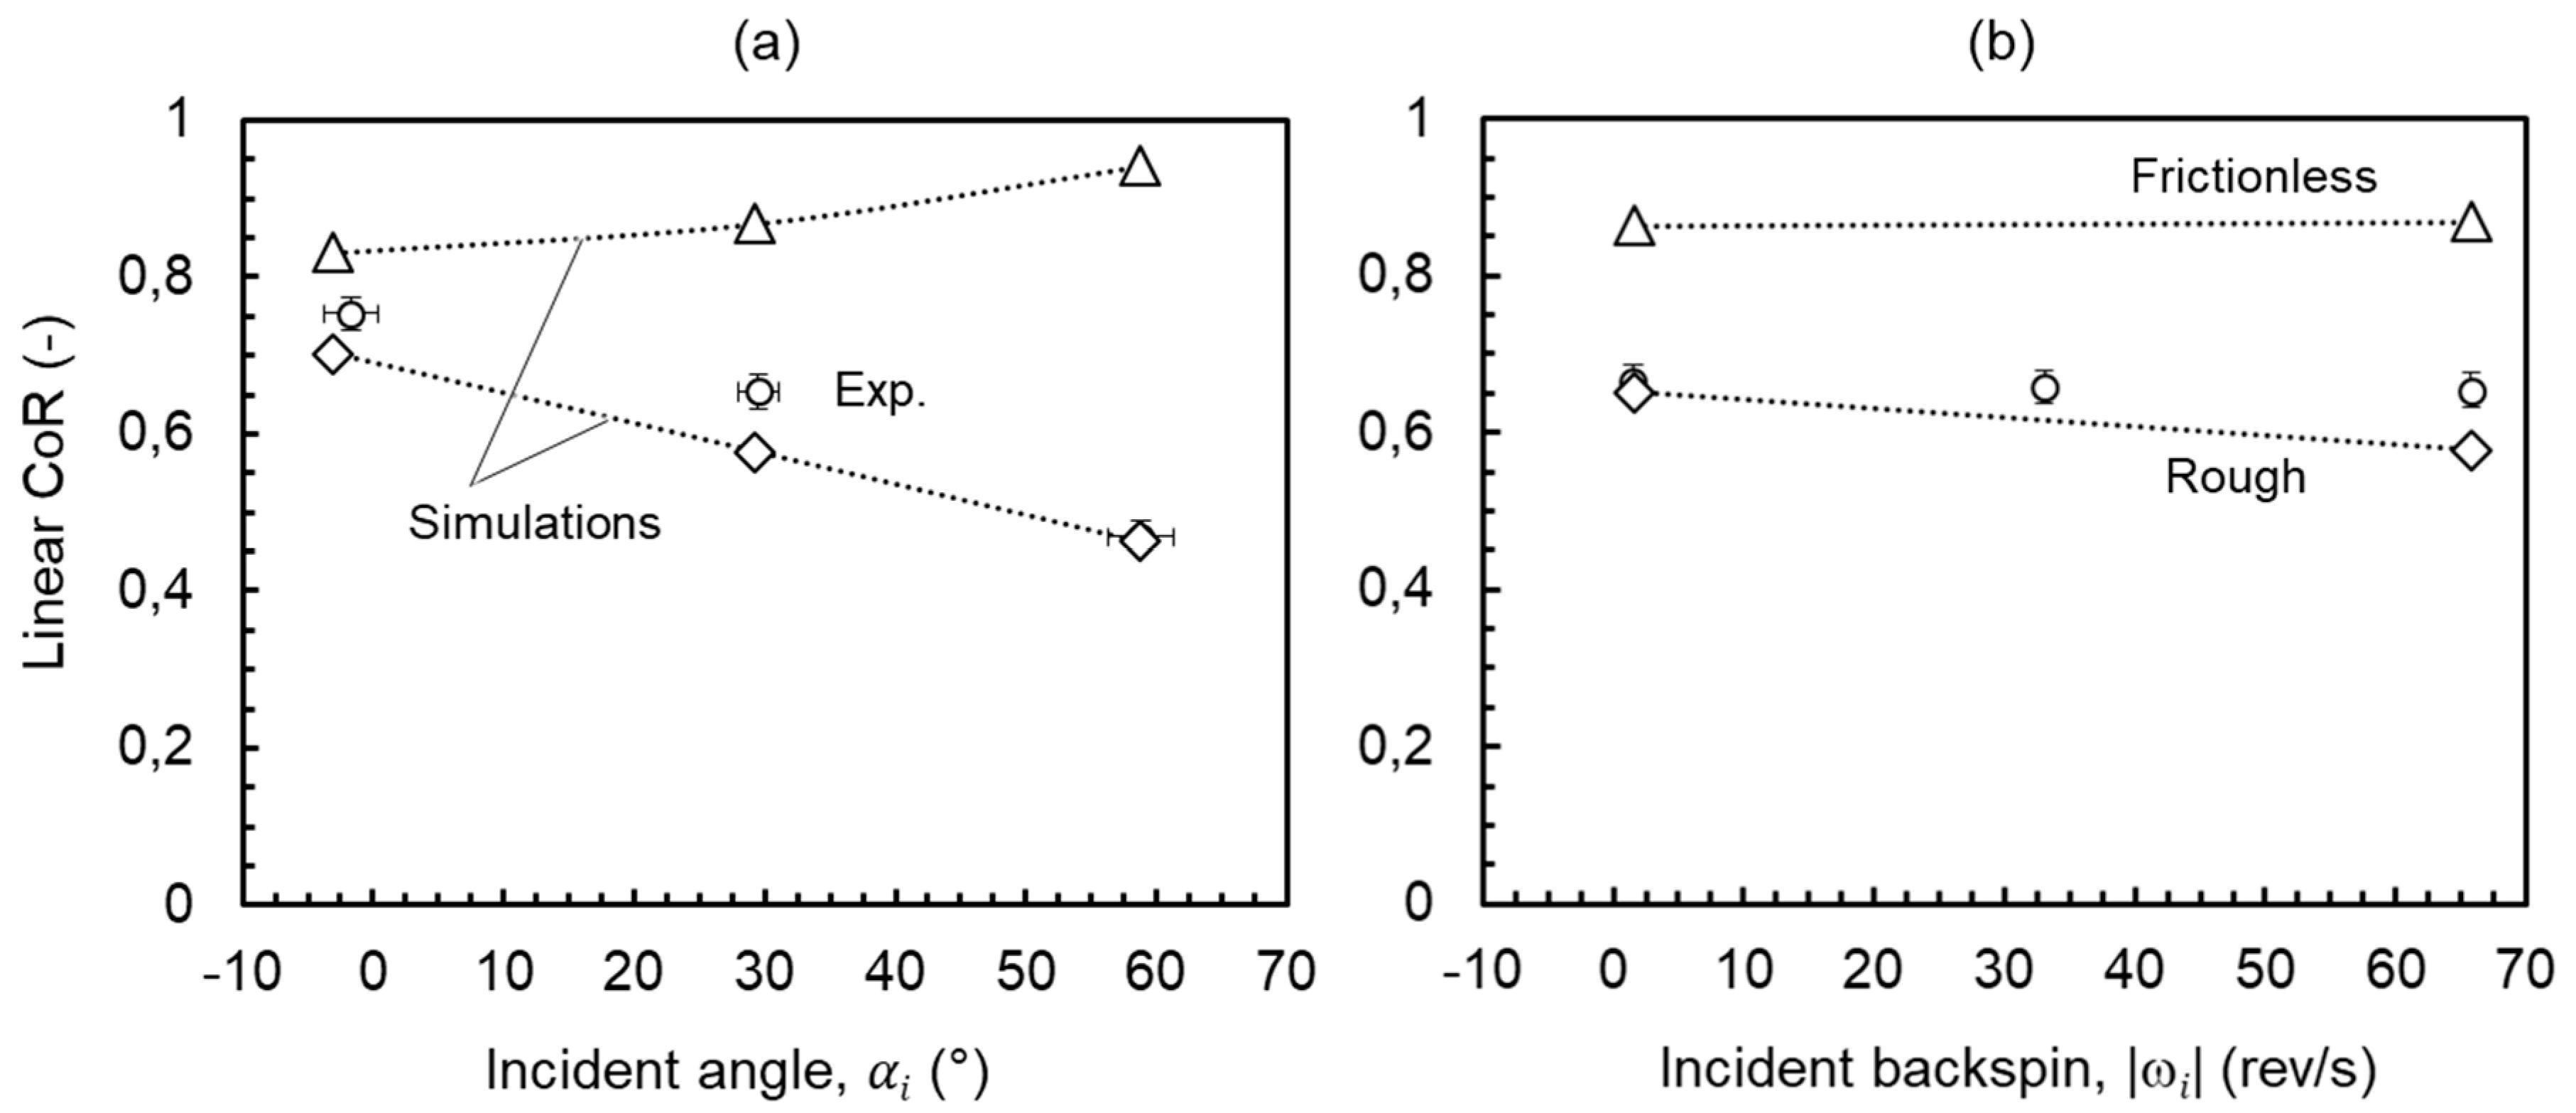
Figure 11 where the experimental and simulated linear coefficient of restitutions are compared.
Figure 11a focuses on impacts with fixed backspin (−66 rev/s) and varying incidence and
Figure 11b presents the results for impacts at constant incidence (30°) and varying backspin. Fair predictions using rough contact conditions were obtained whereas frictionless simulations clearly over predicted the experimental results. With this broad set of impact conditions, the numerical predictions capability using rough contact conditions could be further challenged when tracking the two additional metrics that had been defined.
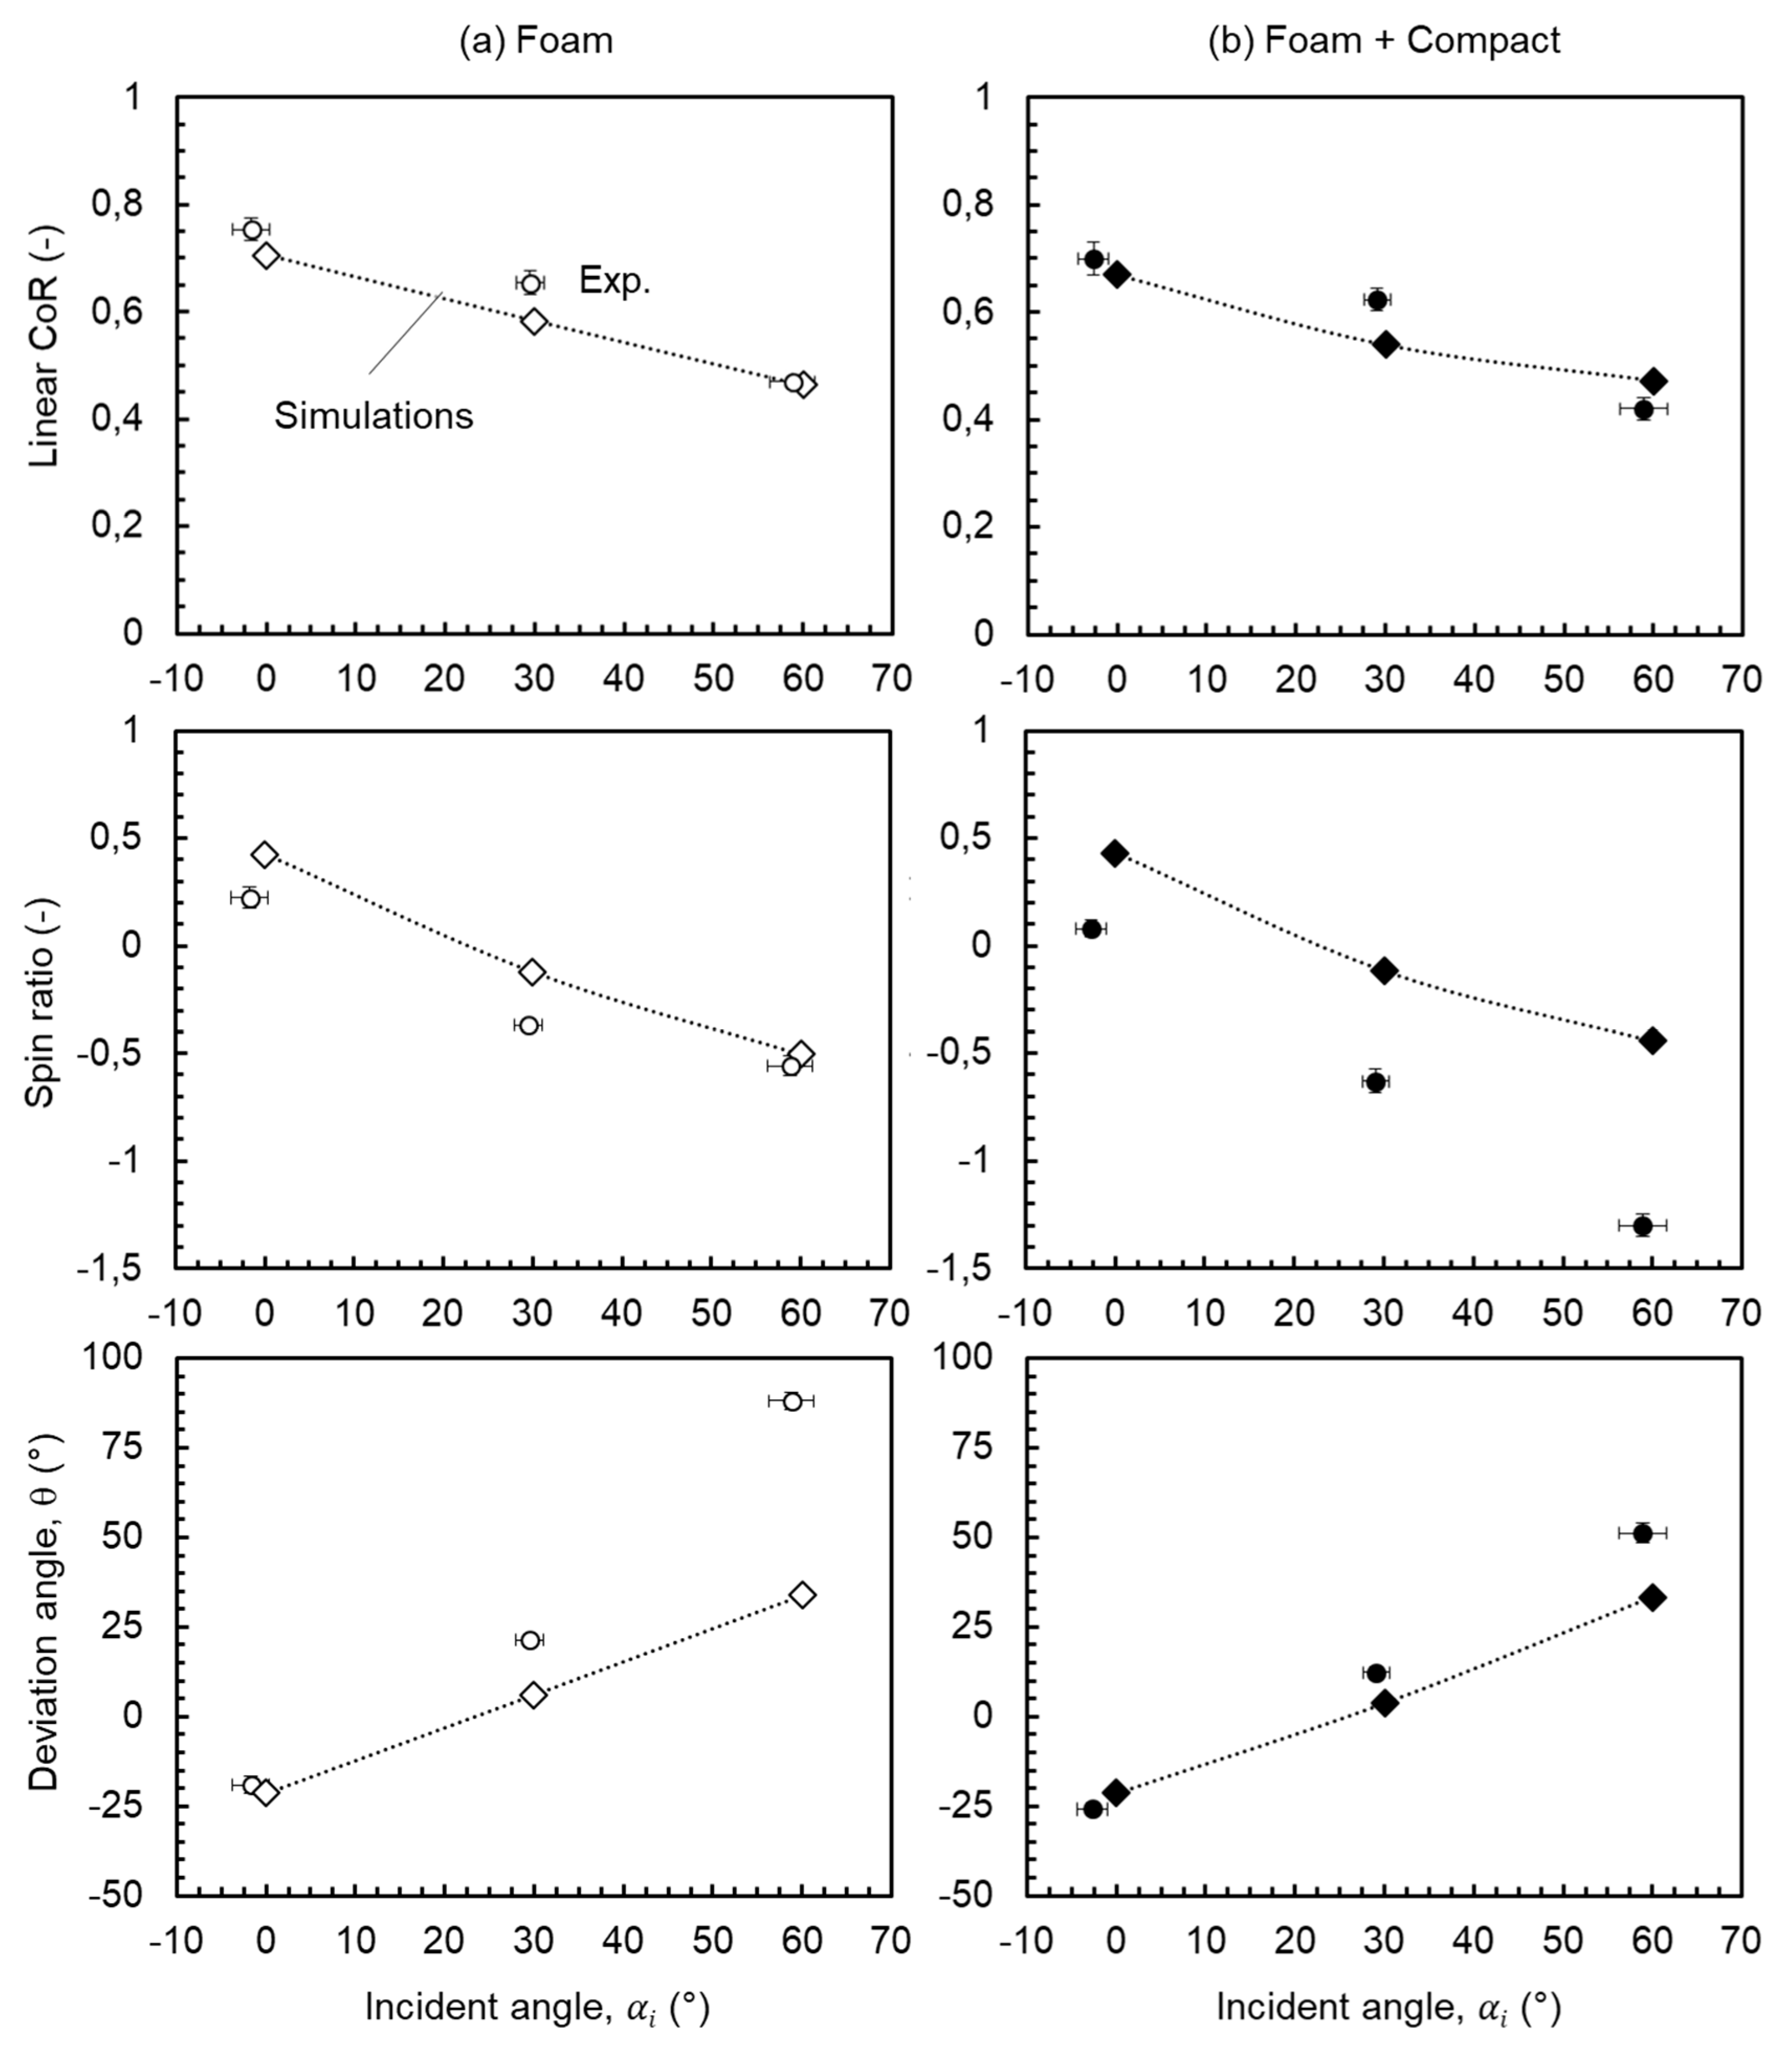
The experiment/simulation comparisons are presented in
Figure 12 for impact tests at constant velocities (V
i = 14 m/s and ω
i = −66 rev/s) and varying incidence, performed on the
foam (
Figure 12a) and
foam + compact (
Figure 12b) targets. For both the
foam and the
foam + compact targets, the magnitude of the linear coefficient of restitution and its decrease with increasing the incident angle were fairly predicted (top figures in
Figure 12).
Furthermore, the qualitative evolutions of the two other metrics, that were an inversion and then an increase of the absolute value of the spin ratio and an increase of the deviation angle, were both captured. Yet, the experimental and simulated magnitudes strongly differed. More precisely, limited differences could be observed between the simulated metrics of the two targets whereas large experimental discrepancies were already reported: normal impact aside, impacts on the foam + compact sample resulted in larger spin ratio magnitudes and smaller deviation angles θ.
These differences suggested that the ball/foam and ball/compact contacts were different. At first glance, the ball/foam friction coefficient seemed smaller than the compact/foam one. Nevertheless, the potential difference between the deforming contact geometries could not be ignored. Thus, complementary studies of the contact shape with account for the refined and potentially different contact properties between the foam and the compact layers need to be pursued. Numerically, parametric study with varying coefficient of friction (CoF) can be performed. Experimentally, its measurement can be obtained as reported in [
29,
30] for instance. These refinements are further justified since the reversible buckling of the ball (leading to very different contact areas) only occurred for certain experimental conditions tested. These investigations are currently pursued. Also, in the present study, the contact forces (normal and tangent) were not considered. Future works will consider the implementation of a force plate to measure the impact of normal and tangent forces and compare with the ones predicted by the finite element analysis, as in [
18,
19]. This will probably help in tuning the friction coefficient between the ball and the covering.
5. Conclusions
The impact of a table tennis ball onto part or the complete polymeric racket layers had been investigated for various incident angles and spins. Three metrics of performance, namely the linear coefficient of restitution CRL, the spin ratio SR and the deviation angles θ were monitored evidencing strong differences between the foam and foam + compact layers. In short, normal spin aside, the ball impacting the foam pad exhibited smaller reflected spin and larger reflected angle than the one impacting the foam + compact.
The numerical prediction of the impact had been attempted using a previously implemented 3D finite element model that happened to successfully predict the linear coefficient of restitution of the same target under normal impact with no spin. The rate dependent dissipative constitutive equations of the ball and polymeric layers were determined based on DMA and the large strain hyperelastic response was obtained from quasi-static compression tests.
While the linear coefficient of restitution was fairly predicted, the two other metrics failed to be successfully simulated, revealing the key role of the contact condition. The simplistic rough contact condition needs to be refined.
However, the numerical tool comprises all the required elements to study the impact of a table tennis ball on the racket polymeric layers. Ongoing work focuses on a better account for the contact, and detailed analysis of the simulated contact region is attempted in order to get a better sense of the role of the contact geometry. In addition, the in-depth study of the energy balance (strain, kinetic, viscous, friction components) is currently being pursued to identify the key mechanisms driving the overall performance of the polymeric layers impacted by a table tennis ball.


