Comparison of Portable Emissions Measurement Systems (PEMS) with Laboratory Grade Equipment


1
LAETA, IDMEC, Instituto Superior Técnico, University of Lisbon Av. Rovisco Pais, 1049-001 Lisboa, Portugal
2
European Commission–Joint Research Centre, Directorate for Energy, Transport and Climate, Sustainable Transport Unit, 21027 Ispra, VA, Italy
3
Center for Innovation, Technology and Policy Research (IN+/IST), University of Lisbon–Av. Rovisco Pais 1, 1049-001 Lisbon, Portugal
4
ADEM/ISEL/IPL, Instituto Superior de Engenharia de Lisboa, Rua Conselheiro Emídio Navarro 1, 1959-007 Lisbon, Portugal
*
Author to whom correspondence should be addressed.
Appl. Sci. 2018, 8(9), 1633; https://doi.org/10.3390/app8091633
Submission received: 10 August 2018
/
Revised: 7 September 2018
/
Accepted: 10 September 2018
/
Published: 12 September 2018
(This article belongs to the Section Environmental Sciences)
Abstract
:Featured Application
Determination of PEMS experimental measurement uncertainty in the laboratory.
Abstract
Real-driving emissions (RDE) testing with portable emissions measurement systems (PEMS) during the type approval and in-service conformity of light-duty vehicles was recently introduced in the European Union legislation. In this paper, three PEMS were compared with laboratory analyzers connected to the tailpipe and the dilution tunnel. The tests were conducted with two Euro 6 vehicles (one gasoline and one diesel) performing the World harmonized Light vehicles Test Cycle (WLTC) and a pre-recorded RDE cycle on a chassis dynamometer. The results showed that the differences of the PEMS gas analyzers compared to the laboratory references were typically within 2% for CO2 and 5% for NOx. The CO2 and NOx mass emissions were within 10% and 15%, respectively, with only a few exceptions. The exhaust flow rate measurements were within 10% at low speeds (urban conditions), and 5% at higher speeds. These results confirm the legislated permitted tolerances and the 2017 PEMS uncertainty estimates.
1. Introduction
Air quality control at an urban scale is one of the biggest challenges for many countries and cities worldwide. One of the main sectors contributing to air quality issues is the transport sector; in 2016, it was responsible for about 23% of the carbon dioxide (CO2) emissions in Europe [1], and light duty vehicles contributed around 44% of the transport sector emissions [2]. The road transport contributed to 39% of the NOx emissions in Europe in 2015 [3].
The European Union (EU) has set emission limits for certification tests, where all new vehicles must comply with, not only during type approval, but also during normal use [4]. The European passenger cars (M1) and vans (N1) pollutant emission standards, also called ‘Euro’ standards, are currently in stage six (Euro 6), and define the acceptable limits for the exhaust emissions of pollutants for new vehicles sold in the EU member states, namely CO, HC, and NOx, as well as the particulate matter and particle number. To verify the compliance with the targets, specific vehicle certification procedures are used, which include performing driving cycles (pre-defined speed profiles) on a chassis dynamometer under controlled laboratory conditions.
Since 2017, in EU, the new Worldwide harmonized Light vehicle Test Procedure (WLTP) has been implemented and the new test cycle is the Worldwide harmonized Light vehicle Test Cycle (WLTC) [4]. Even though the WLTC is based on the driving patterns of many countries, there are still concerns that will not close the gap (mainly of CO2) between the real driving emissions and the type approval [5]. In addition, to reduce the differences found between the laboratory and on-road pollutant emissions and to limit the use of illegal strategies, the EU incorporated a real driving emissions (RDE) test procedure for the Euro 6d standard from 2017 [4].
EC Regulation (EU) 2017-1151 [4] establishes the rules for RDE testing, stating that the vehicle must be equipped with a portable emissions measurement system (PEMS), which is, in general, a compact equipment composed of portable analyzers, an exhaust mass flow meter (EFM), a weather station, and a Global Positioning System (GPS). All of this equipment must be integrated and use an acquisition frequency of 1 Hz. The regulation also establishes the trip requirements, such as the maximum and minimum duration, covered distance, ranges of speed, and the ambient boundary conditions, such as the maximum and minimum altitude and temperature [6]. The trip must cover a wide range of real world conditions, having defined shares of urban, suburban (also called rural), and highway (also called motorway) operation.
PEMS are a useful tool for emission inventories because they provide emissions under a wide range of operating conditions, including those that would otherwise be difficult to replicate in the laboratory (e.g., large road gradients, strong accelerations, and variations in altitude). PEMS measurements have increased in the last years and will further increase, not only because they are a part of the type approval and in-service monitoring EU regulation, but because they are robust and reliable tools for the market surveillance of vehicles on the roads [7,8] and a support for vehicle manufacturers in the development of new vehicles. Member states will be able to take measures (including ordering vehicle recalls and revoking type-approval certificates) against non-compliant vehicles sold in their national markets. The new regulation for the type-approval and market surveillance of motor vehicles was voted for in 19 April 2018. and will replace Directive 2007/46/EC in September 2020.
As summarized previously, PEMS have many sub-systems synchronized to a main platform. Thus, uncertainty associated to the measurements can be propagated through the data used for emissions calculations. According to a study by the Joint Research Centre (JRC) of the EU [9] the main sources of uncertainty are the exhaust flow meter (EFM), the gas analyzers, and their drift. The extra PEMS measurement uncertainty compared to the well-established and more accurate legislated method (measurement of bags from a full dilution tunnel) is covered by a margin that determines the conformity factor. The conformity factor defines the maximum allowed emission levels of the vehicles on the road. The comparison between the PEMS and laboratory equipment over a test cycle (called validation test) is a check of the proper setup and functioning of the PEMS. The permissible differences are given in the regulation (e.g., 15% or 15 mg/km for NOx, 10% or 10 g/km for CO2, whichever is larger).
Only a few studies have addressed the differences found between the PEMS and laboratory grade equipment for the latest generation RDE compliant PEMS. Comparisons (validations) of PEMS on the chassis dynamometers with the bags (from the full dilution tunnel with Constant Volume Sampling [CVS]) using various driving cycles were in good agreement in most studies [10,11,12]; however, in some cases, the differences were high and exceeded the permissible tolerances [13]. However, none of these studies conducted a detailed analysis using two PEMS simultaneously, by comparing them with both the legislated method and laboratory grade analyzers at the tailpipe.
Based on this background, it was deemed important to further evaluate the PEMS measurement uncertainty by direct comparison with laboratory grade equipment. Three different PEMS were evaluated in this work, performing the WLTC and a predetermined RDE cycle under laboratory conditions (lab-RDE) for two different vehicles, one spark-ignition (SI) internal combustion engine powered vehicle and one compression-ignition (CI) vehicle. The results are also compared with the above-mentioned studies [10,11,12,13].
2. Materials and Methods
2.1. Vehicles
In this study, one Euro 6 gasoline SI vehicle and one Euro 6 diesel CI vehicle were tested on a chassis dynamometer laboratory with certified fuels (i.e., E10 and B7, respectively). Table 1 summarizes the vehicle characteristics.
2.2. Test Cycles
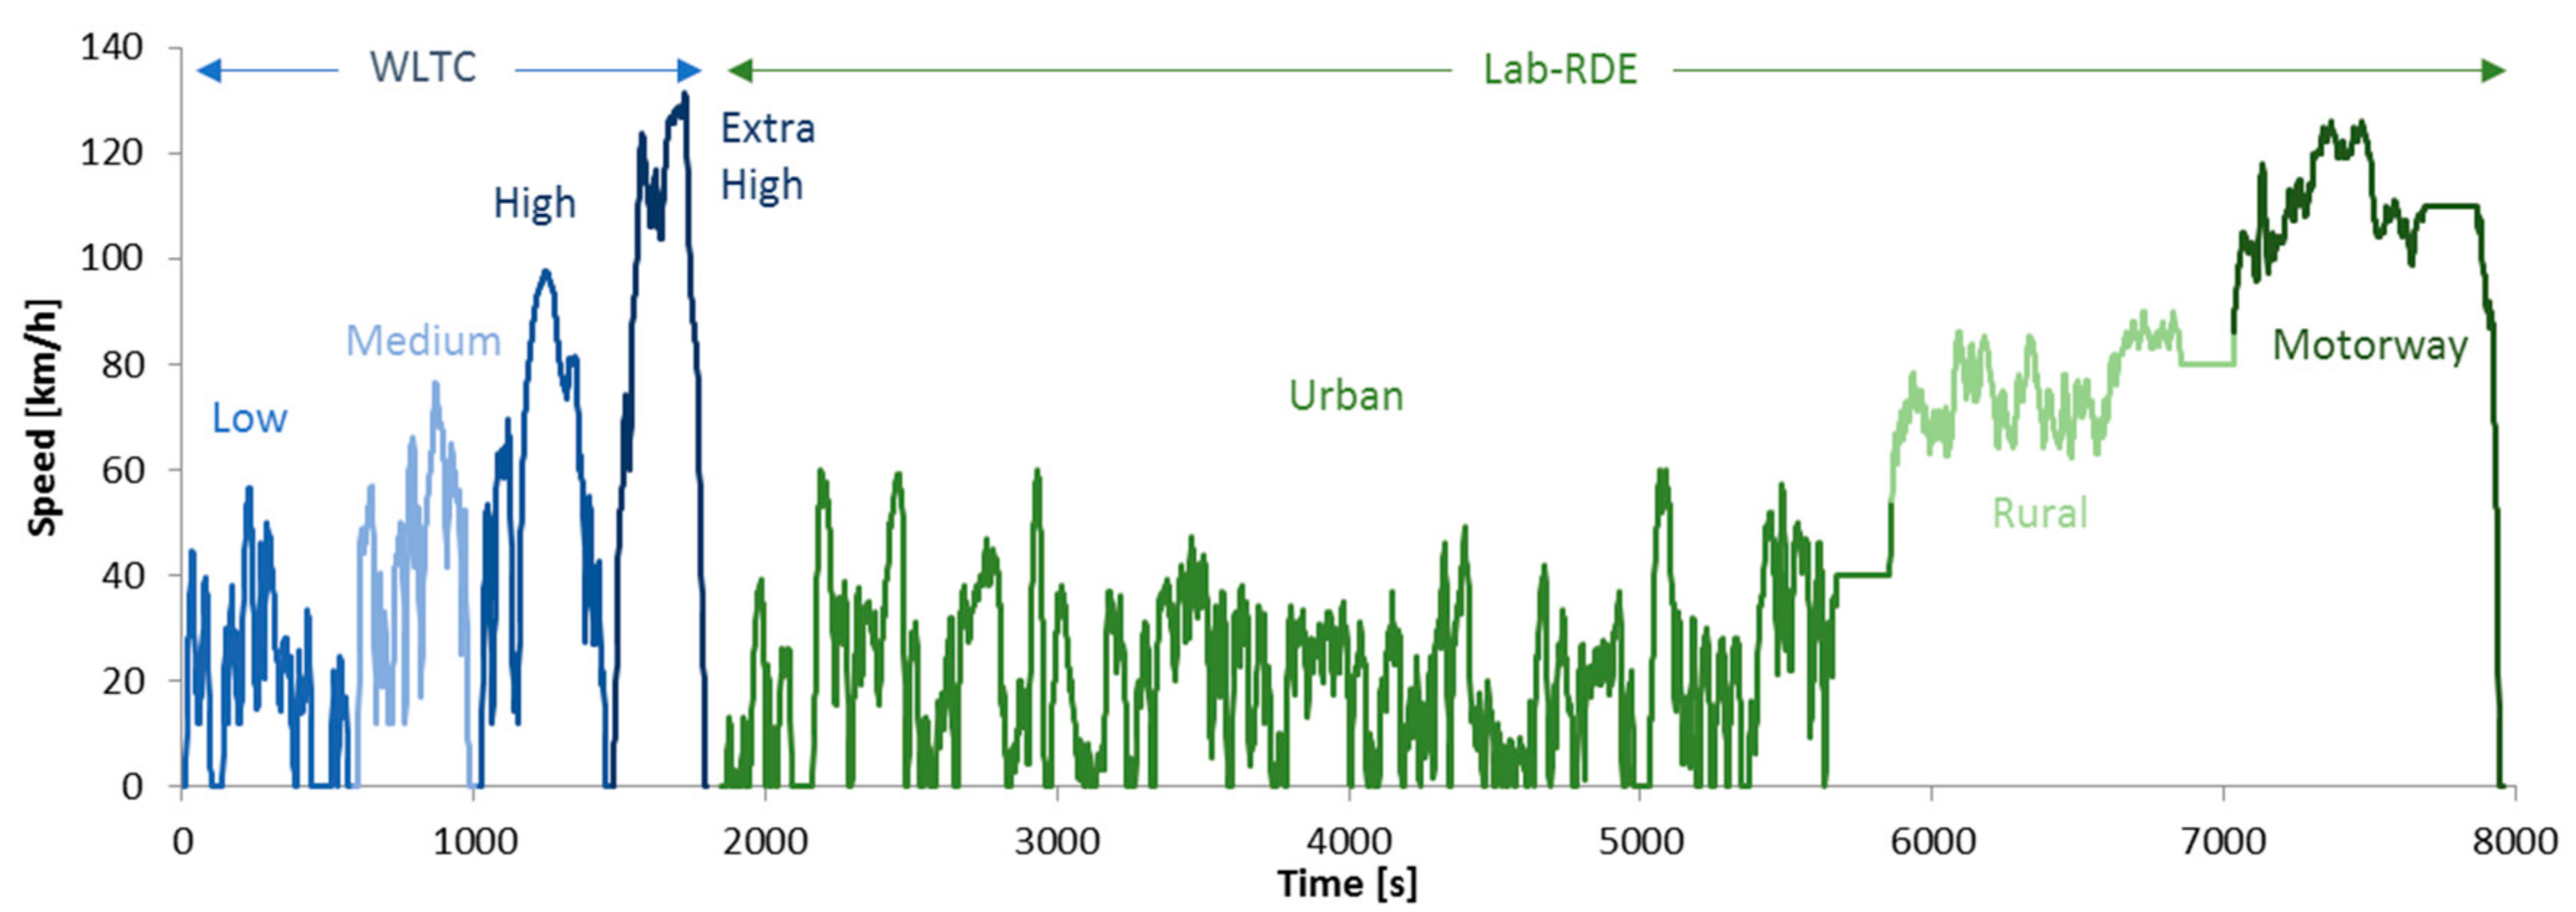
Two driving cycles were performed, the WLTC with an engine cold start, and a pre-recorded RDE cycle with an engine hot (Figure 1), which will be called the Lab-RDE cycle. Some constant speed parts were added at the end of each phase of the Lab-RDE cycle, in order to be able to detect any differences between the real time analyzers.
2.3. Measurement Equipment
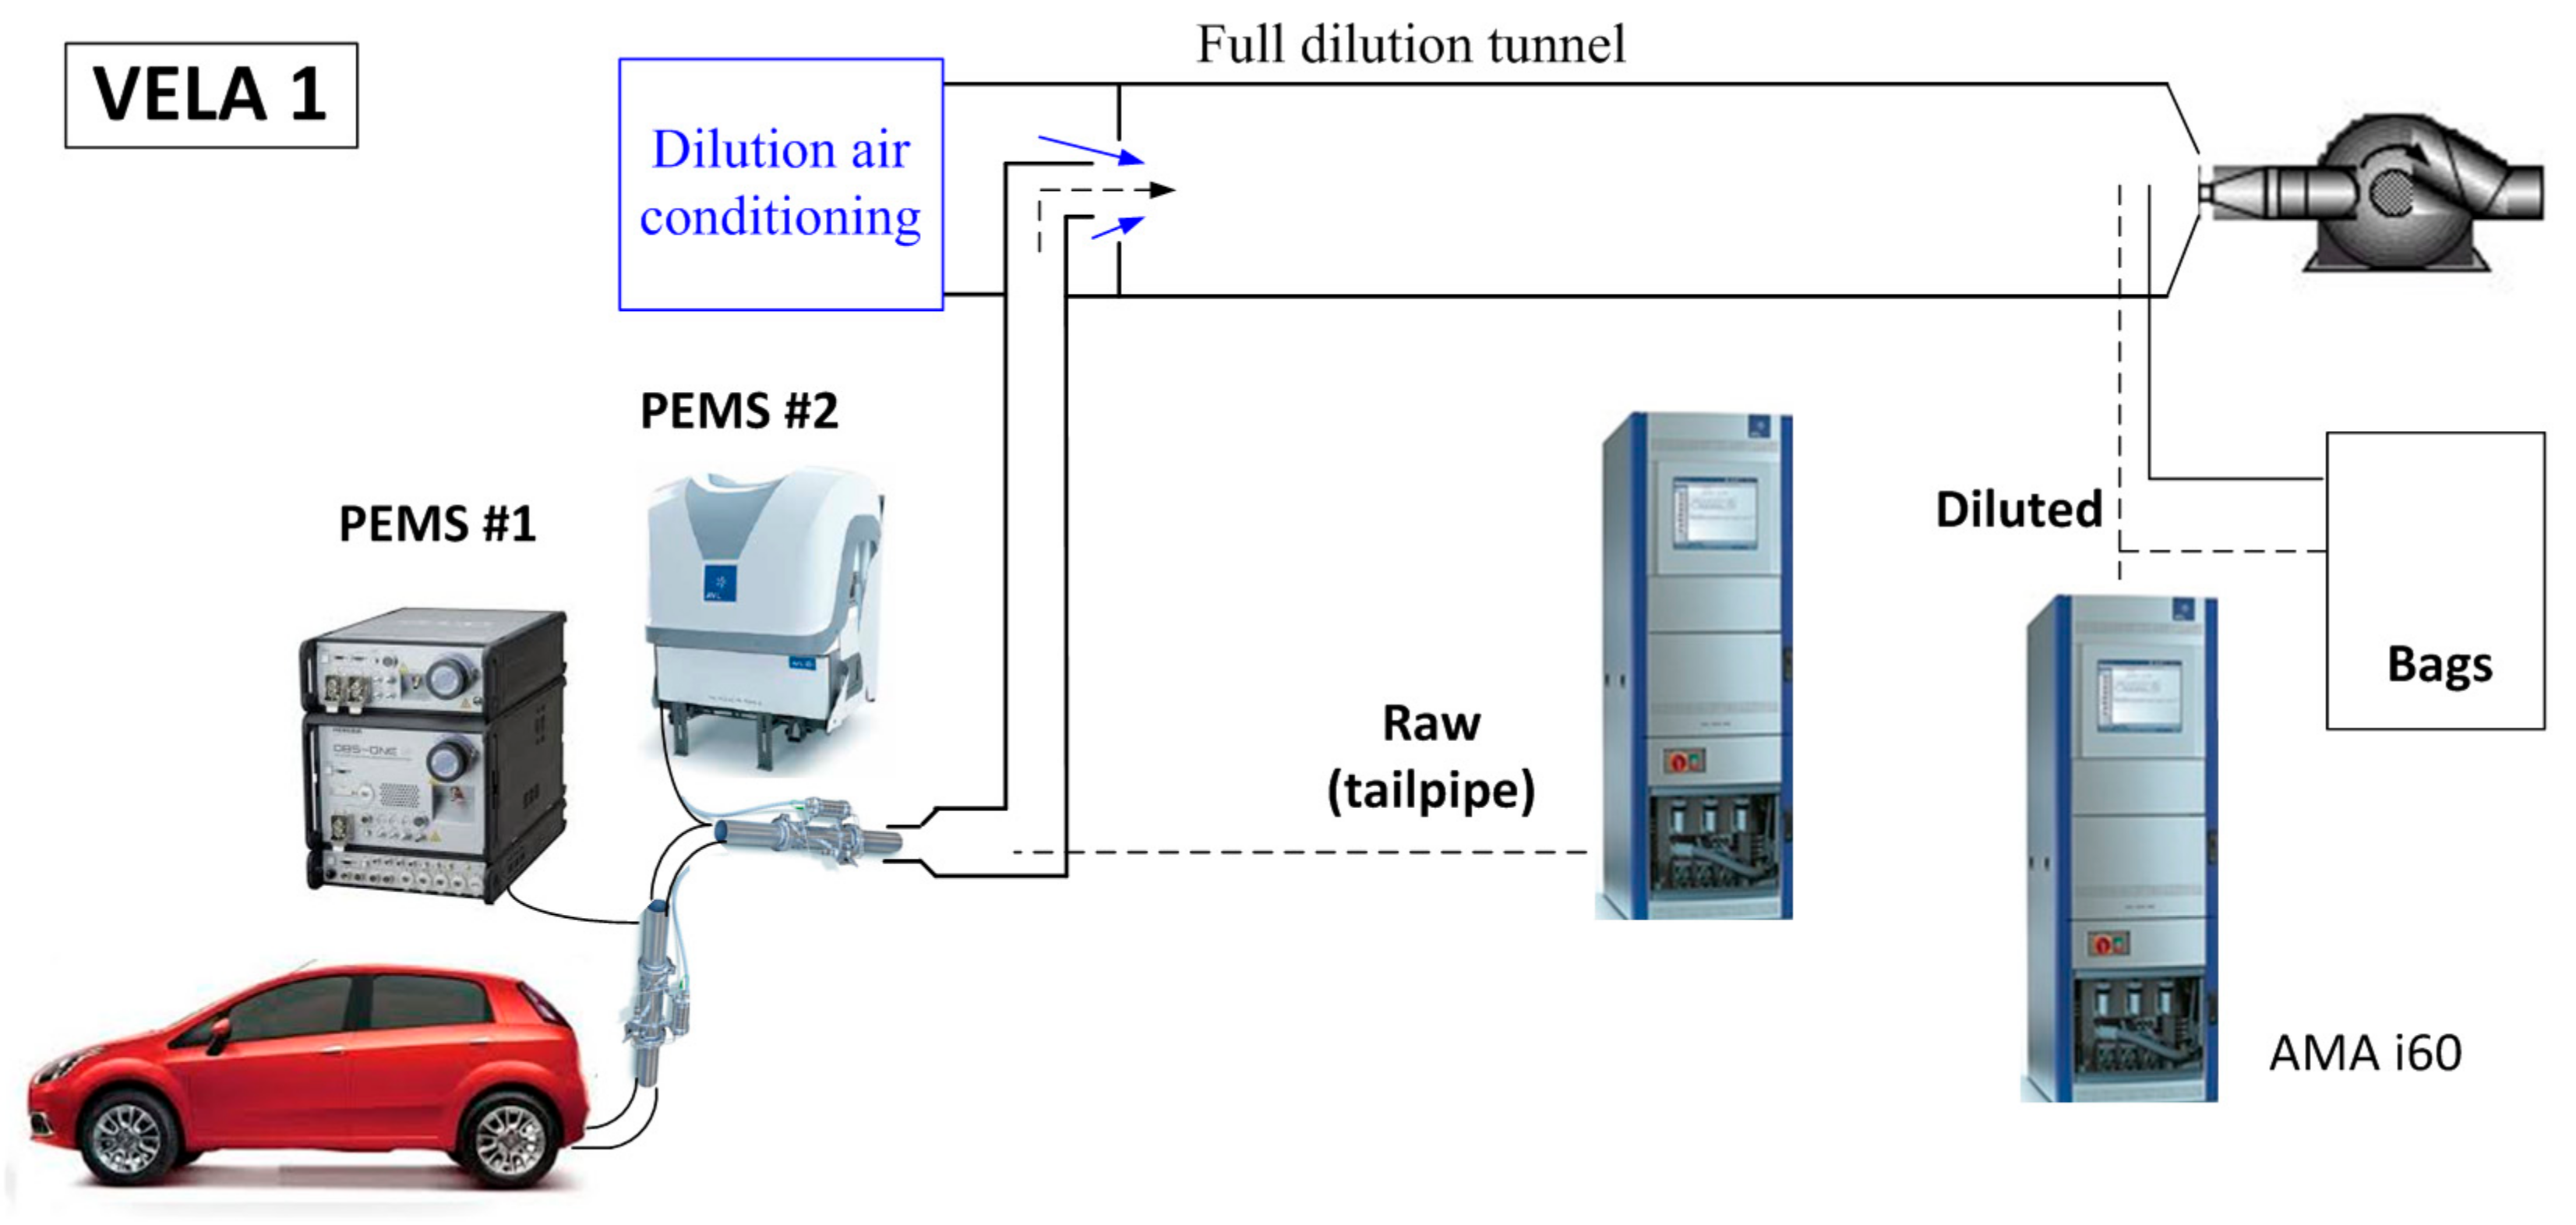
The laboratory tests were conducted at the one-axis roller dynamometer Vehicle Emissions Laboratory (VELA 1) of the JRC in Italy (Figure 2). The exhaust gas was connected to the full dilution tunnel with a <3 m tube. A flow rate of 9 m3/min was used at the full dilution tunnel, with Constant Volume Sampling (CVS).
As required by the regulation, for the WLTC, the sampling bags were filled with the diluted exhaust and were analyzed at the end of the test. As a result of the long duration of the lab-RDE cycle, no bag measurements were taken, but the emissions were calculated using the integrated real time data of the analyzer connected to the CVS (diluted gas).
One analyzer (AMA i60 from AVL) was used to measure the diluted gas in real time (lab-RDE) or the bags filled with diluted exhaust at the end of the test (WLTC). The bag and/or diluted measurements were considered as the reference values. Another analyzer (AMA i60) was used to measure the raw exhaust from the tailpipe of the vehicle, after the two PEMS (technical specifications in Table 2).
PEMS #1 (OBS-ONE, Horiba, Kyoto, Japan) and PEMS #2 (M.O.V.E., AVL, Graz, Austria) were tested with the SI gasoline vehicle, while PEMS #2 and PEMS #3 (M.O.V.E. and AVL) were tested with the CI diesel vehicle (technical specifications in Table 2). Each PEMS was connected to its own exhaust flow meter (EFM). Attention was given to leave enough tube diameters length (>four diameters) before and after the EFMs to ensure their proper operation, and additionally, not to cause any significant pressure drop by reducing the tailpipe inner diameter. For this reason, bigger flow meters were used for the CI vehicle, which has higher flow rates.
The zero and span calibration of the analyzers was conducted before each test. The zero and span drift of the PEMS was checked only after the RDE tests. All of the results were well within the regulation requirements (NOx zero drift <5 ppm, NOx span drift <2%) and there was no systematic drift (positive or negative), thus, all of the presented results include the contribution of the drift (if any).
2.4. Calculations
2.4.1. Bags/Diluted Mass
According to WLTP [4], the mass emissions of a pollutant i (CO2 or NOx), calculated from the dilution tunnel for each phase or cycle (mi,CVS) (g/km), are given by the following:
where Vmix (litre) is the volume of the diluted exhaust gas corrected to standard conditions (273.2 K and 101.3 kPa), ρi (g/litre) is the density of the pollutant i at standard temperature and pressure; kh (−) is the humidity correction factor applicable only to the mass emissions of NOx; Ci,corr (ppm) is the concentration of the pollutant i in the diluted exhaust gas, corrected by the amount of the pollutant i contained in the dilution air; and d (km) is the distance of the phase or total cycle.
mi,CVS = Vmix ρi kh Ci,corr 10−6/d,
For RDE, where no bags were used, Ci,corr was estimated from the real time data of the gas analyzer connected to the dilution tunnel.
2.4.2. Tailpipe Exhaust Mass
The tailpipe mass emissions of a pollutant i (mi,tailpipe) (g/km) were calculated summing the instantaneous emissions from a pollutant i as prescribed in the regulation [4].
where ui (−) is the ratio density of the pollutant i and the overall density of the exhaust, Ci,tailpipe (ppm) is the measured concentration of the pollutant in the exhaust, and qmew (kg/s) is the exhaust mass flow rate measured (by PEMS) or estimated (by CVS). The CVS estimated exhaust flow rate was based on the CO2 tracer method (i.e., by dividing the total CVS flow rate with the dilution ratio at the dilution tunnel) [14]. The dilution ratio was given by the ratio of the diluted and raw CO2 measurements. Some abnormal gas concentration spikes during the decelerations [14] were manually removed.
mi,tailpipe = Σ (ui Ci,tailpipe qmew)/d,
All of the data was acquired at 1 Hz and the synchronization between the different equipment was also made to enable a comparison between them.
2.4.3. Extracted Mass
Equation (3) was used by the automation system to take into account the mass of a pollutant extracted by the instruments connected to the tailpipe (two PEMS and a raw exhaust analyzer, around 20 lpm). The calculated extracted mass emissions of the pollutant i (mi,extracted) (g/km) was added to the calculated bags or diluted mass.
where qinstr. (kg/s) is the extracted flow rate from the instruments. This correction was <3% for CO2. For the tailpipe exhaust analyzer and the PEMS, no correction was applied because the exhaust flow was measured/calculated before any extraction of the sample.
mi,extracted = Σ (ui Ci qinstr.)/d,
3. Results and Discussion
Initially, the tailpipe data (concentrations—Ci,tailpipe; exhaust flow rates—qmew) obtained from each system will be compared to each other, to evaluate the uncertainty they can introduce. Then, the mass emissions of the tailpipe systems (mi,tailpipe) will be compared to the regulated method (bags form the dilution tunnel) (mi,CVS).
3.1. Tailpipe Measurements
3.1.1. Exhaust Flow Rates Comparisons
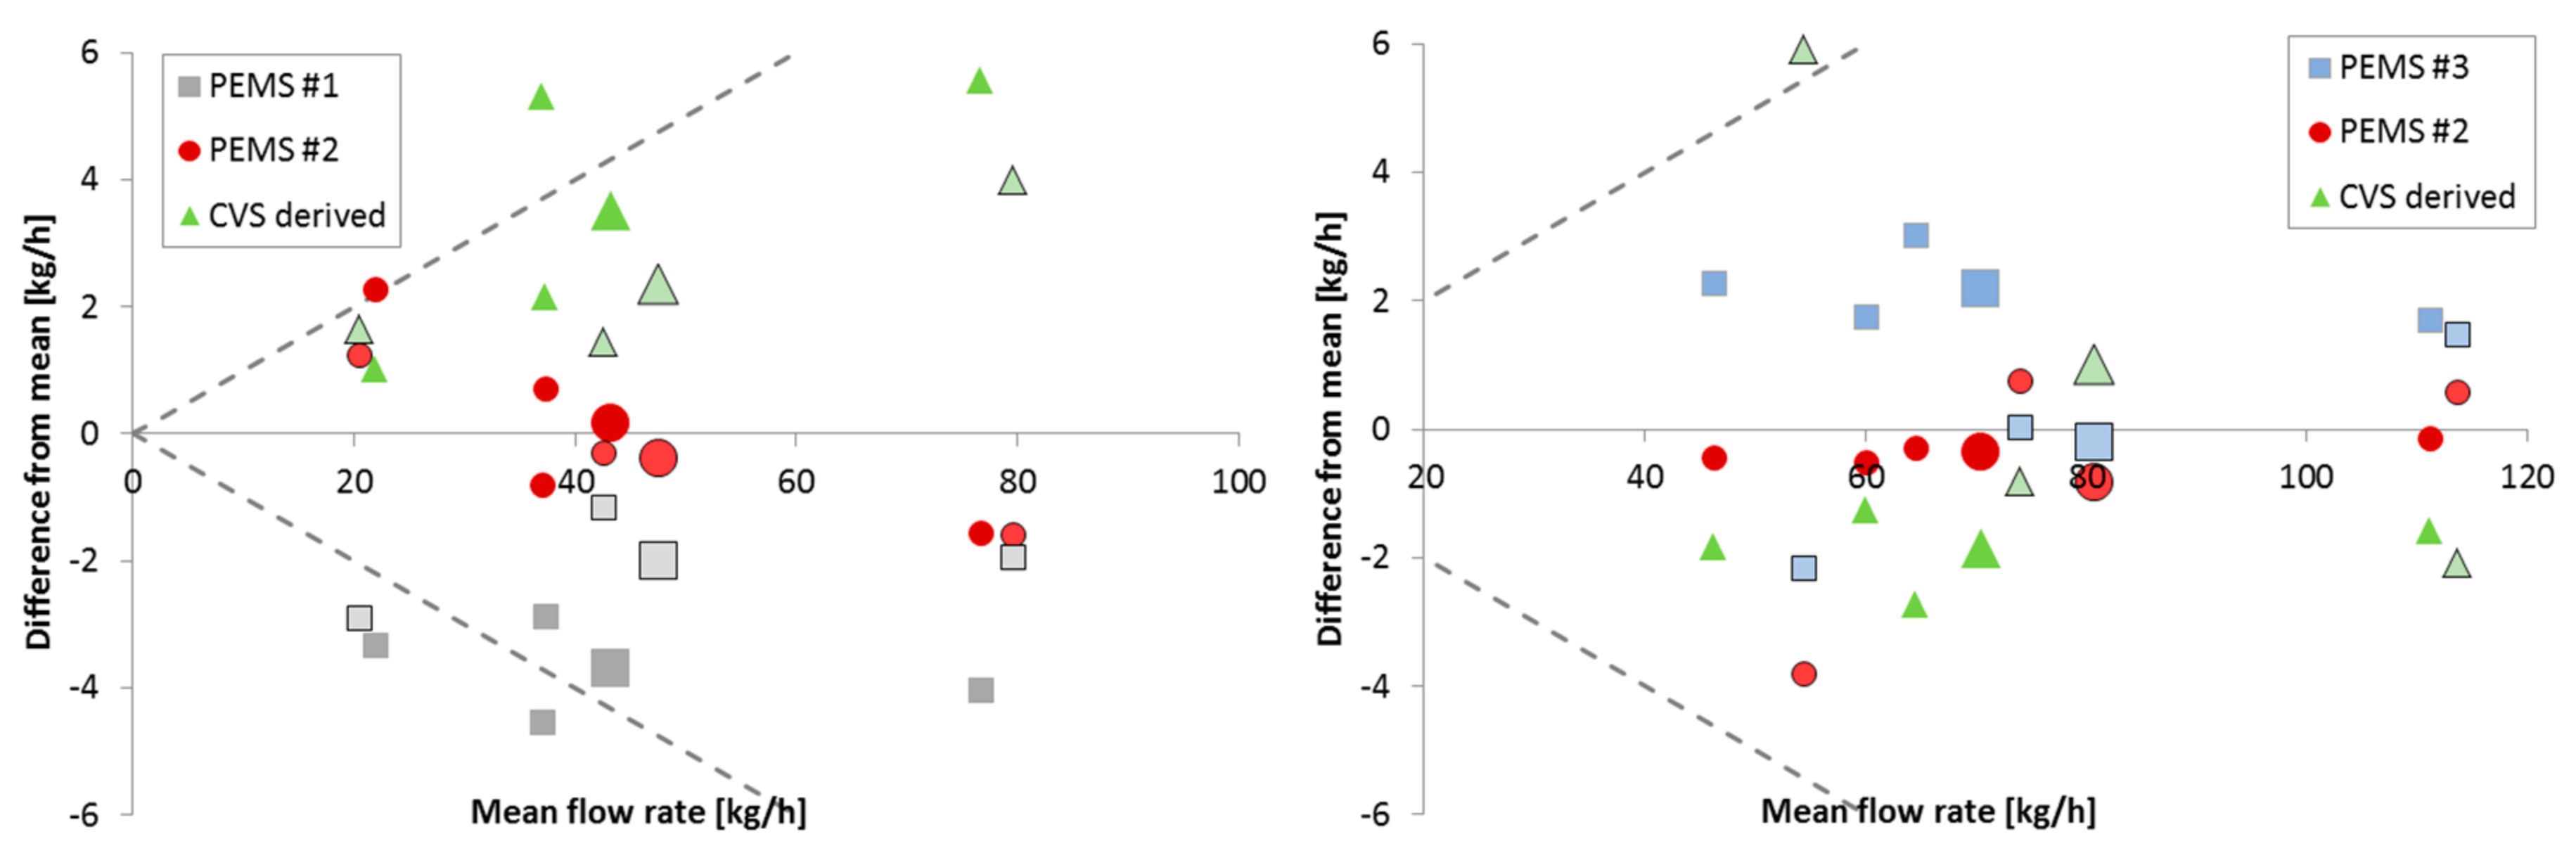
Figure 3 presents the differences of each exhaust flow measurement system (PEMS or derived from CVS flows) to their mean value for each cycle phase (smaller symbols) or the whole cycle (larger symbols). The frameless symbols refer to the WLTC phases, while the framed symbols refer to the lab-RDE phases. The dashed lines indicate a 10% difference based on the currently assumed uncertainty of the flow meters [9]. Each point is the mean value of three repetitions.
As a reference, the mean (average) of the three measurement systems (PEMS and CVS derived) was chosen because none of the methods can be considered as a reference method with low uncertainty. The differences were within ±4 kg/h (few exceptions), which translated to a deviation of around ±10% of their mean value for low mean flow rates (<40 kg/h), and a lower than ±5% deviation for higher flow rates. PEMS #2, which was used with both of the vehicles presented consistent behavior (differences were around zero), while the CVS derived flow was slightly overestimating (1–5 kg/h) for the SI vehicle and underestimating (2–3 kg/h) for the CI vehicle. The authors were not aware of any studies comparing exhaust flow measurements, other than the 2017 margins review study [9], where, in most cases, the differences were within ±10%.
For these measurements, the setup of the flowmeters was carried out according to good engineering practice (i.e., having a straight tube between the two flowmeters, and avoiding sharp curves or sudden changes of diameter); however, it cannot be excluded that some of the deviation mentioned above was due to the set of instruments installed in the series.
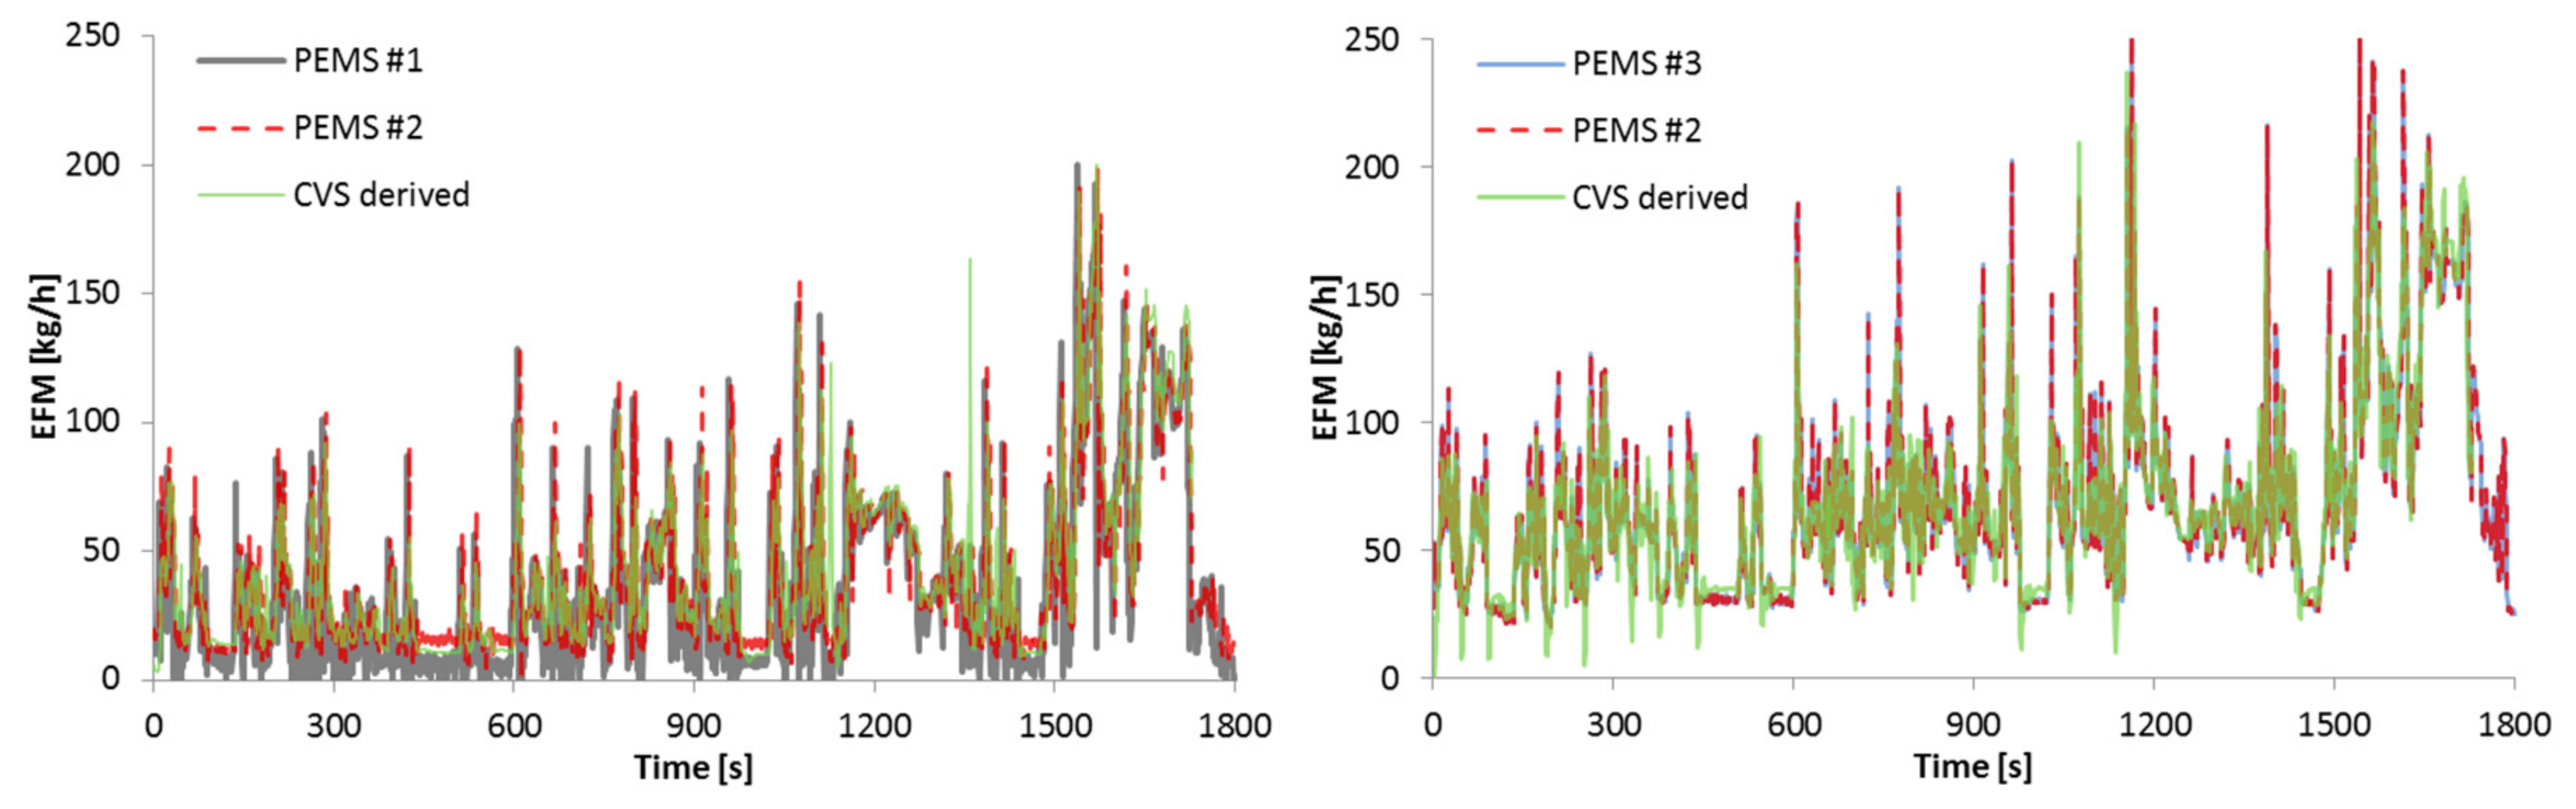
Figure 4 presents examples of the flow measurements in real time, obtained from the three systems. Although they generally agreed well, at low flowrates (PEMS #1 SI vehicle), differences of around 4 kg/h were observed. At low flow rates, the uncertainty of all of the methods was high.
3.1.2. CO2 Concentrations Comparison
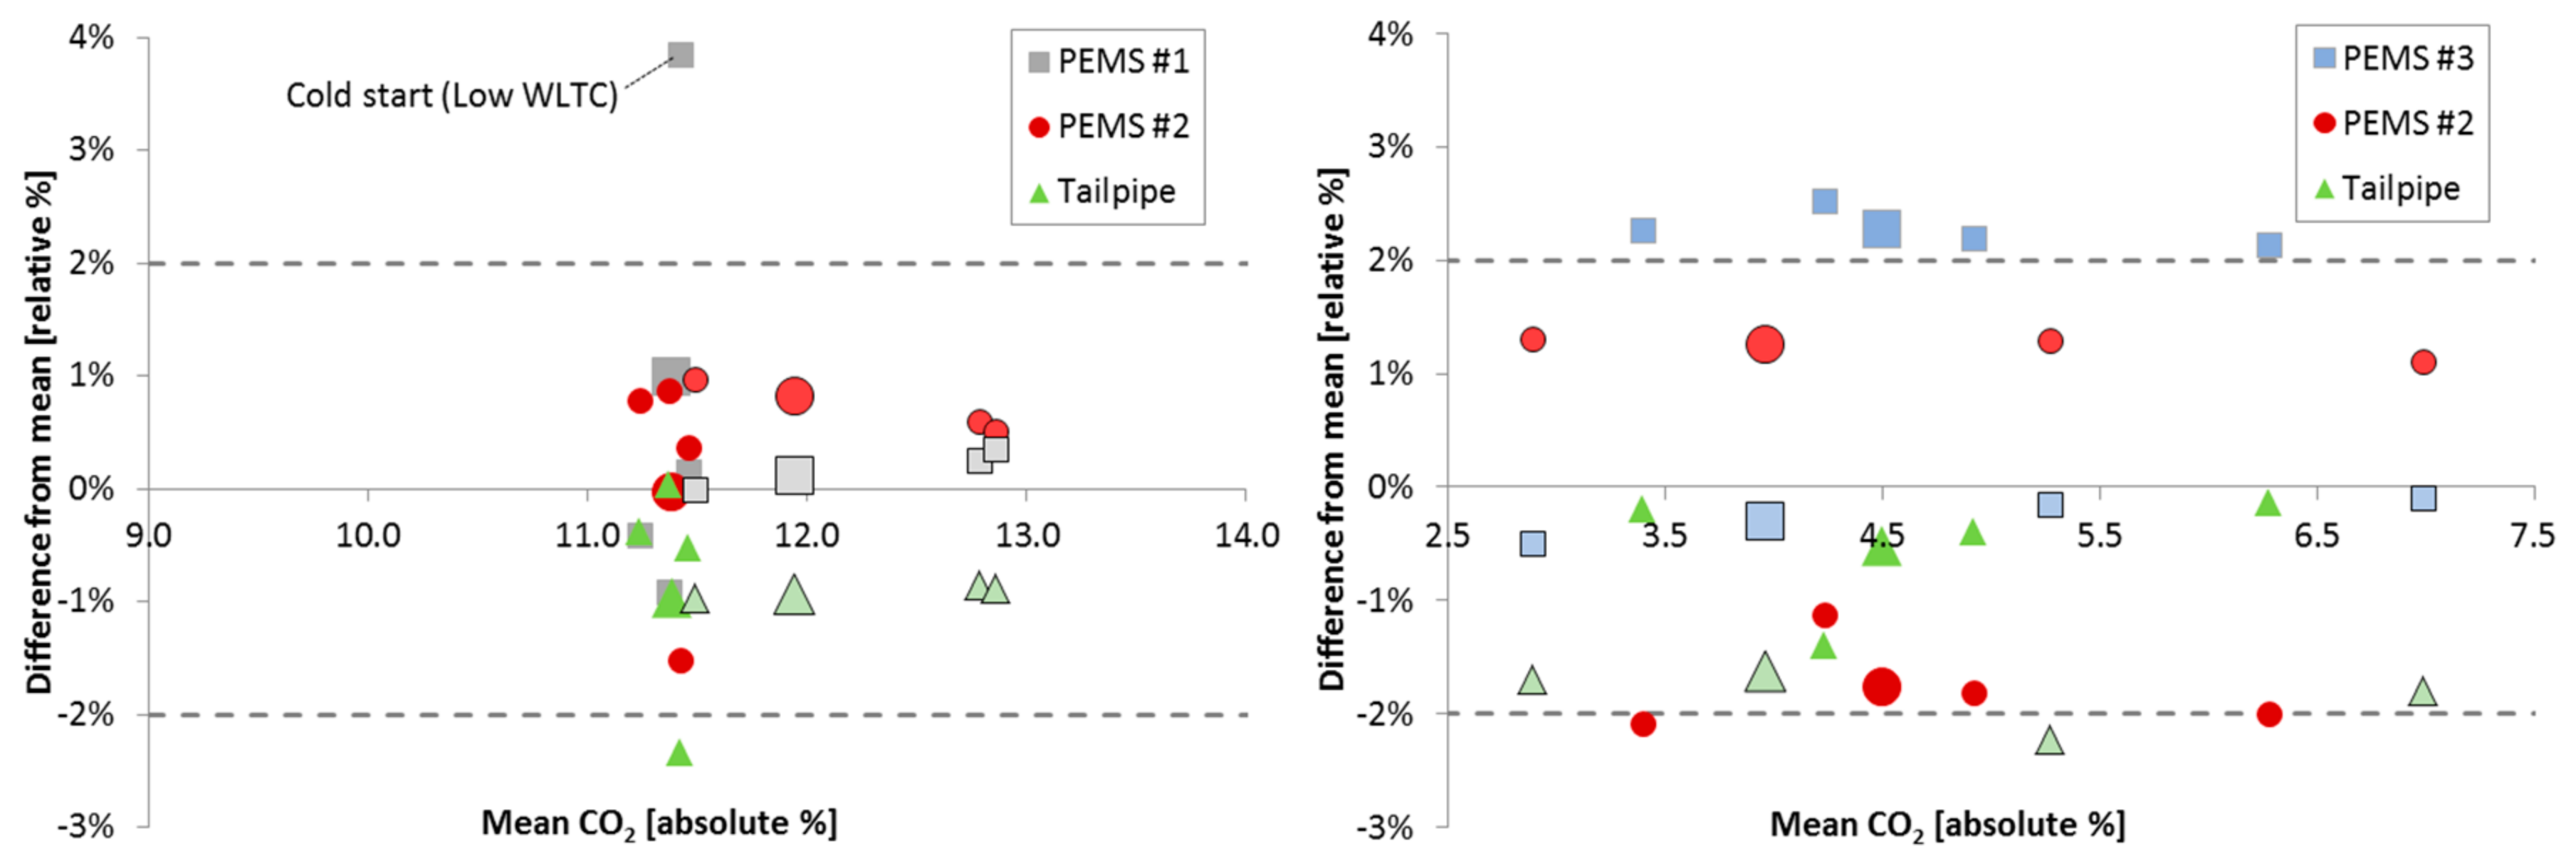
Figure 5 presents the differences between the CO2 analyzers measuring at the tailpipe of the vehicle. As all of the analyzers had similar specifications, their mean value was considered as the reference value. For the SI vehicle, the measured absolute CO2 concentrations were within 11% and 13%, while for the CI vehicle, they were between 3% and 7%. The differences between the instruments were within approximately 1% for the SI vehicle, and approximately 2% for the CI vehicle. The smaller uncertainty at the 11–13% range was probably due to the measured range, which was close to the calibrated concentration (around 14%). There was no particular trend of any of the PEMS underestimating, overestimating, or having linearity issues. There was an indication that the tailpipe laboratory analyzer was generally measuring slightly lower than the PEMS.
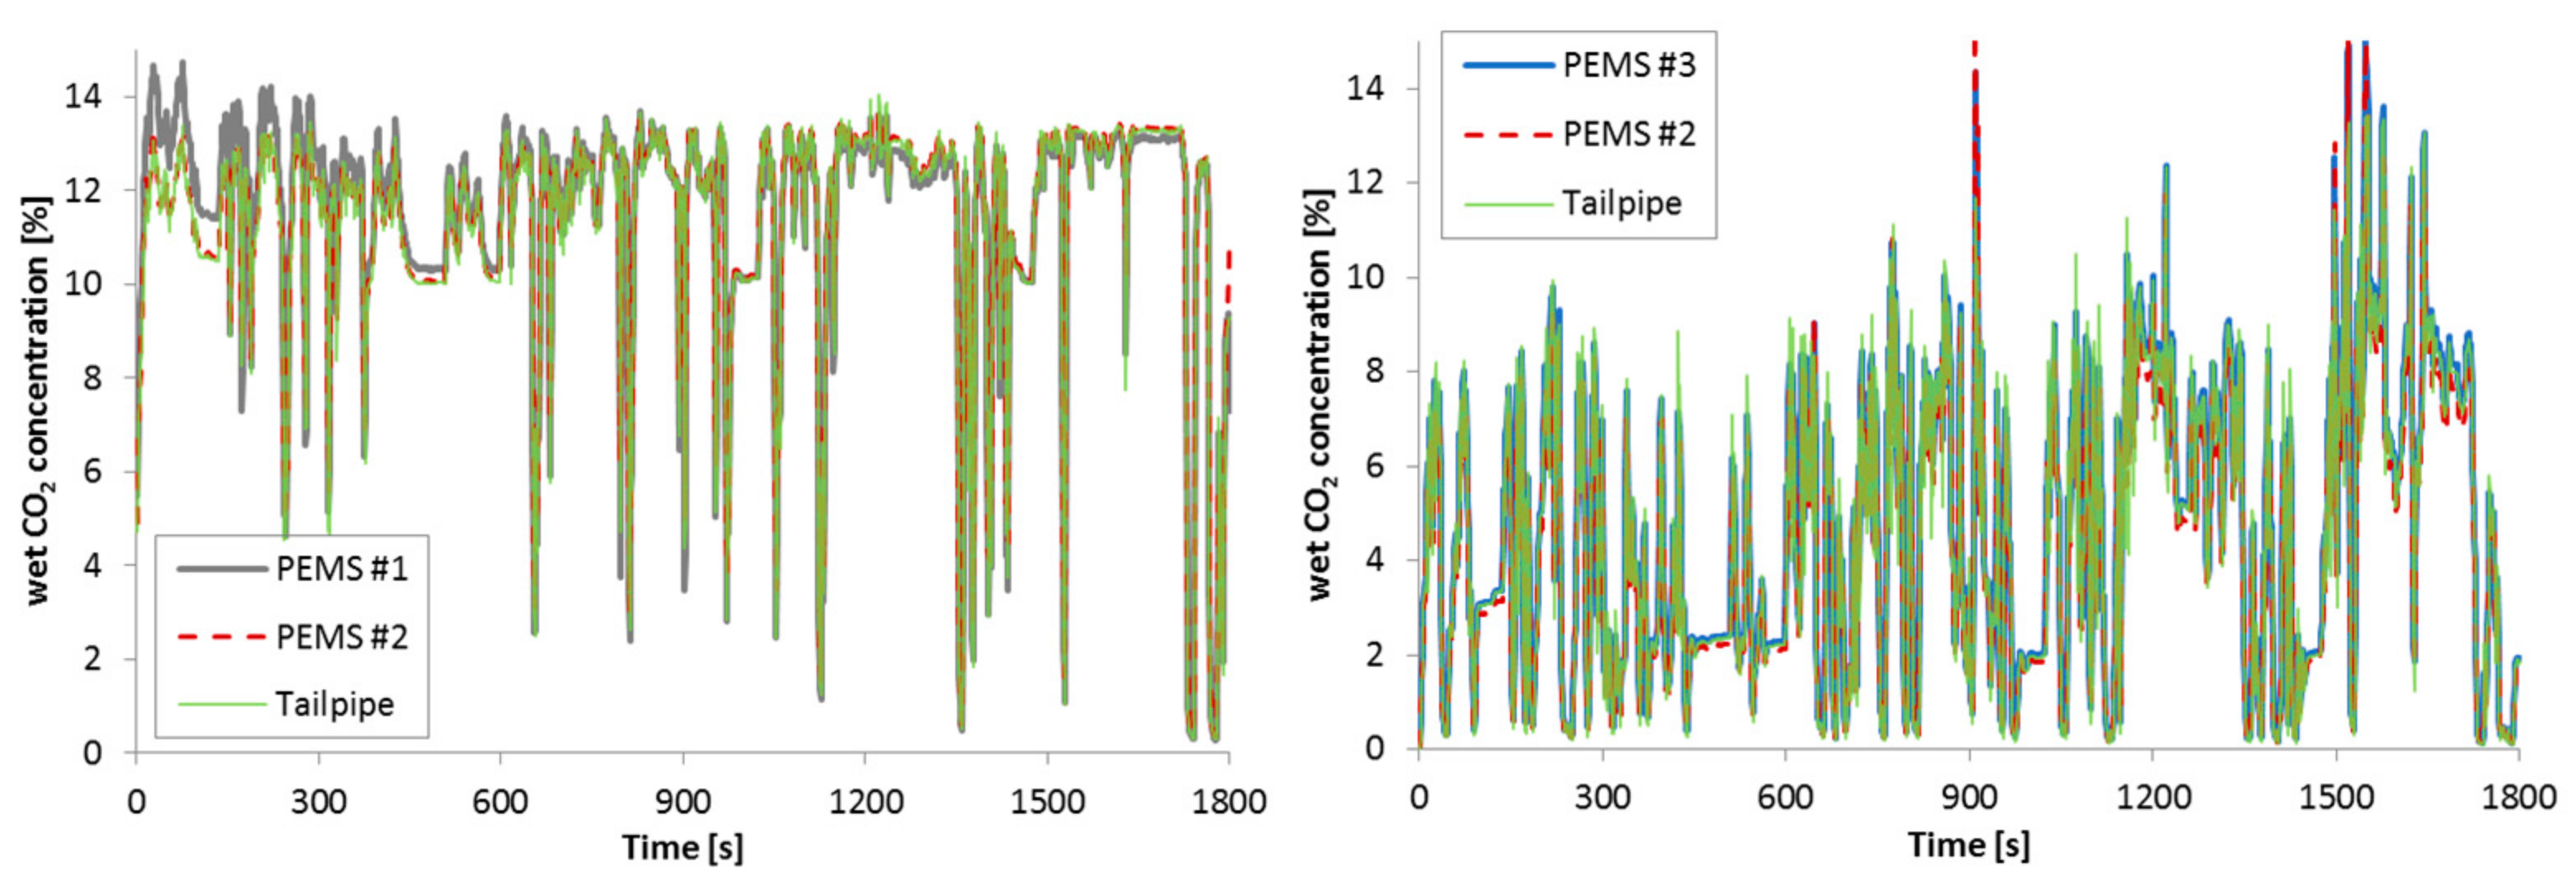
There was one point that had higher differences, the cold start with the SI vehicle (PEMS #1 measured 4% higher than the mean), as shown in Figure 6, which presents the real time data of the three analyzers for the two vehicles. The agreement was very good, with the exception of the cold start. PEMS #1 measured a ‘wet’ concentration (heated NDIR, i.e., without using a drier to remove the water content), while PEMS #2, PEMS #3, and the laboratory equipment measured on a dry basis and used a correction factor to report in the ‘wet’ basis. This correction factor was based on the RDE regulation based on the fuel composition and the measured CO and CO2 concentrations (approximately 0.89 for the SI and 0.95 for the CI vehicle). The observed cold start differences were probably due to the condensation and evaporation of water during the cold start, which the dry–wet corrections do not take into account accurately. Nevertheless, the effect of this over (or under) estimation for the whole WLTC was small (see larger symbols in Figure 5, all within 2.5%).
3.1.3. NOx Concentrations Comparison
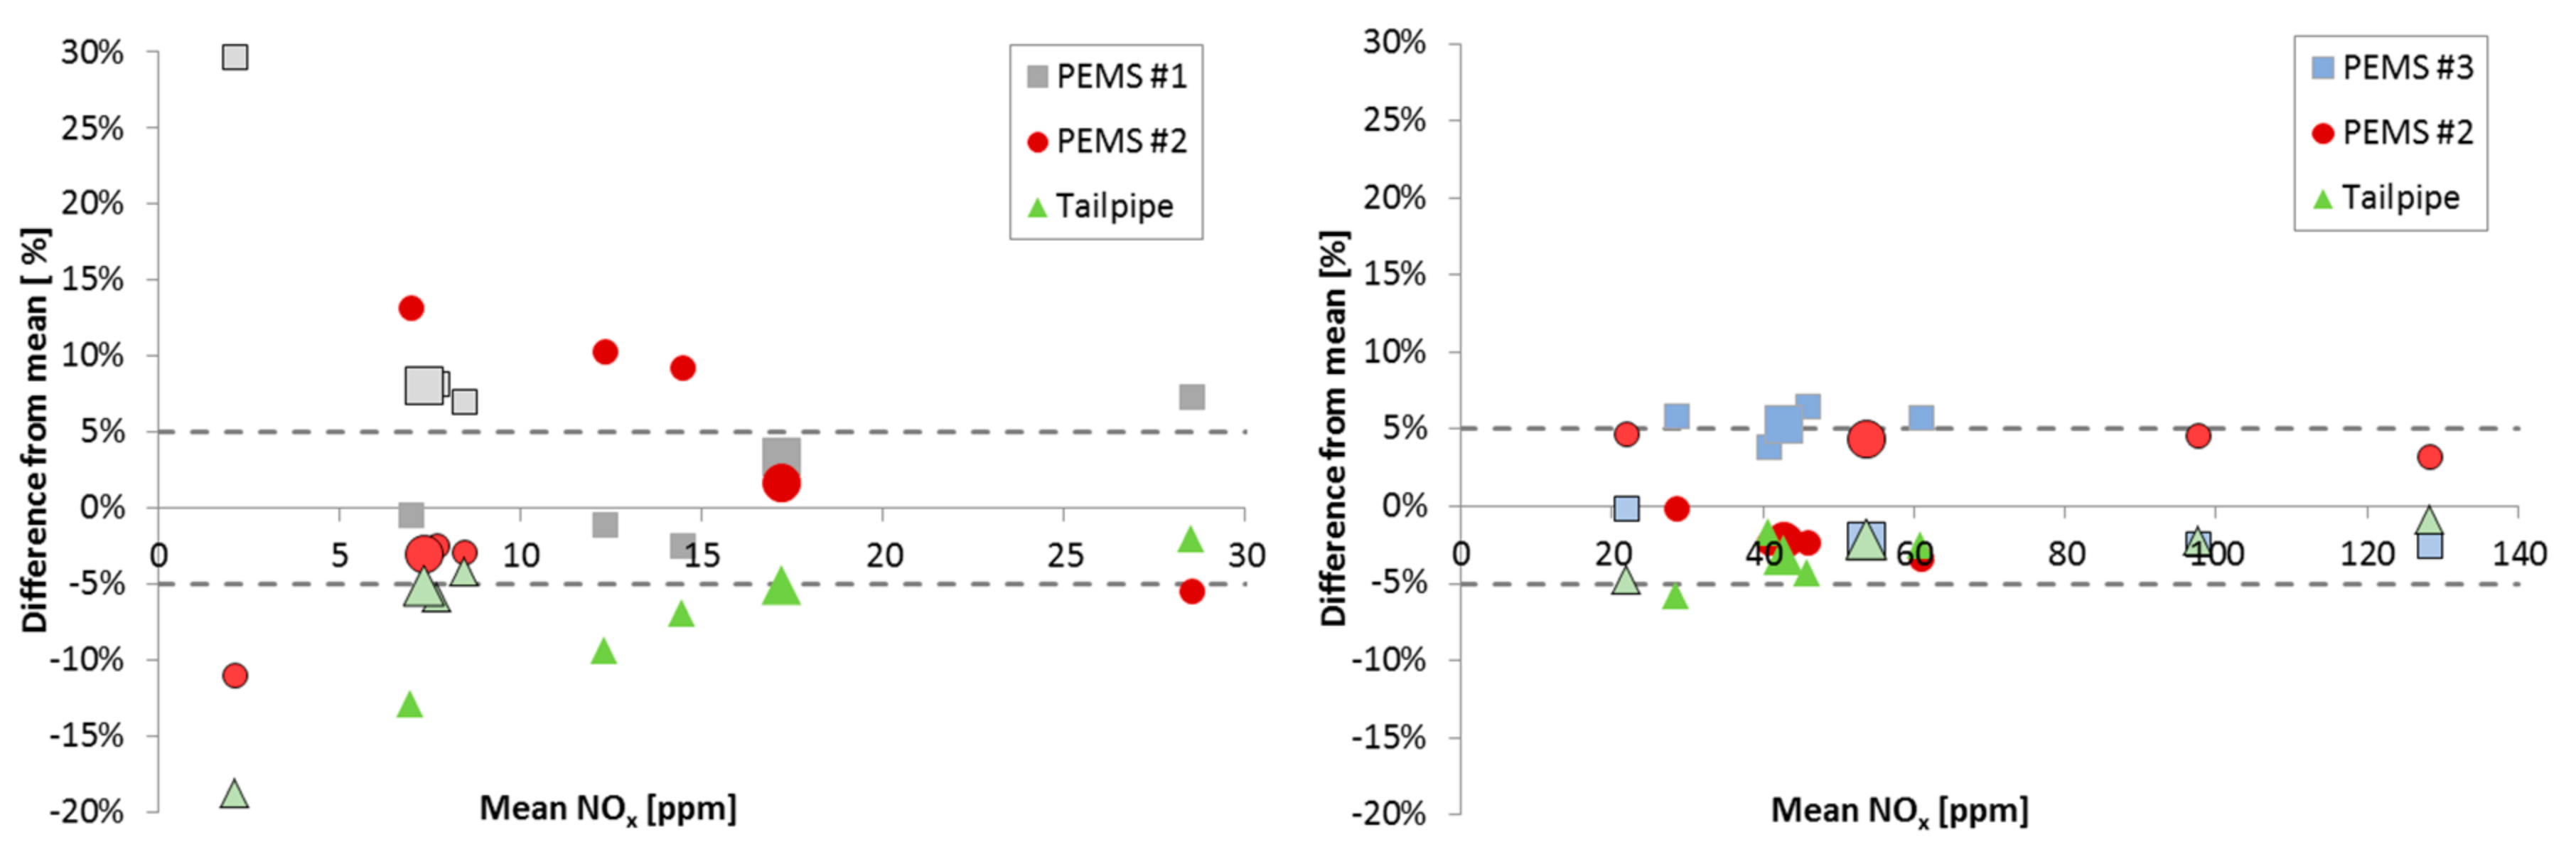
Figure 7 presents the differences between the NOx analyzers measuring at the tailpipe of the vehicle. As all of the analyzers had similar specifications, their mean value was considered as the reference. For the SI vehicle, the mean measured NOx concentrations were <30 ppm, while for the CI vehicle, they were between 20 and 140 ppm. The differences of the instruments were within 5% for the CI vehicle, but up to 30% for the SI vehicle. The 5% uncertainty is in agreement with the estimated uncertainty of the current analyzers [9]. The higher uncertainty at the low range is also in line with the higher uncertainty of the analyzers at low concentration ranges that approach their zero levels [9], and a study that compared NOx analyzers (10%) [10]. NOx analyzers are typically calibrated from 2000 ppm down to 100 ppm. A limited number of data showed that below 100 ppm, the uncertainty increases from 2% to around 5–10% at 10 ppm [9]. These results confirm that current PEMS have a high level of variation at low NOx levels; thus, for low NOx emission levels, the measurement uncertainty (margin in percentage) is higher than what is currently prescribed. Alternatively, for keeping a similar margin, PEMS need to reduce the uncertainty at low levels.
There was no particular trend of specific PEMS or of principle (e.g., chemiluminescence detection [CLD] or non-dispersive ultraviolet [NDUV]) underestimating, overestimating, or having non-linearity issues. There was an indication that the tailpipe measurements were slightly lower than the PEMS.
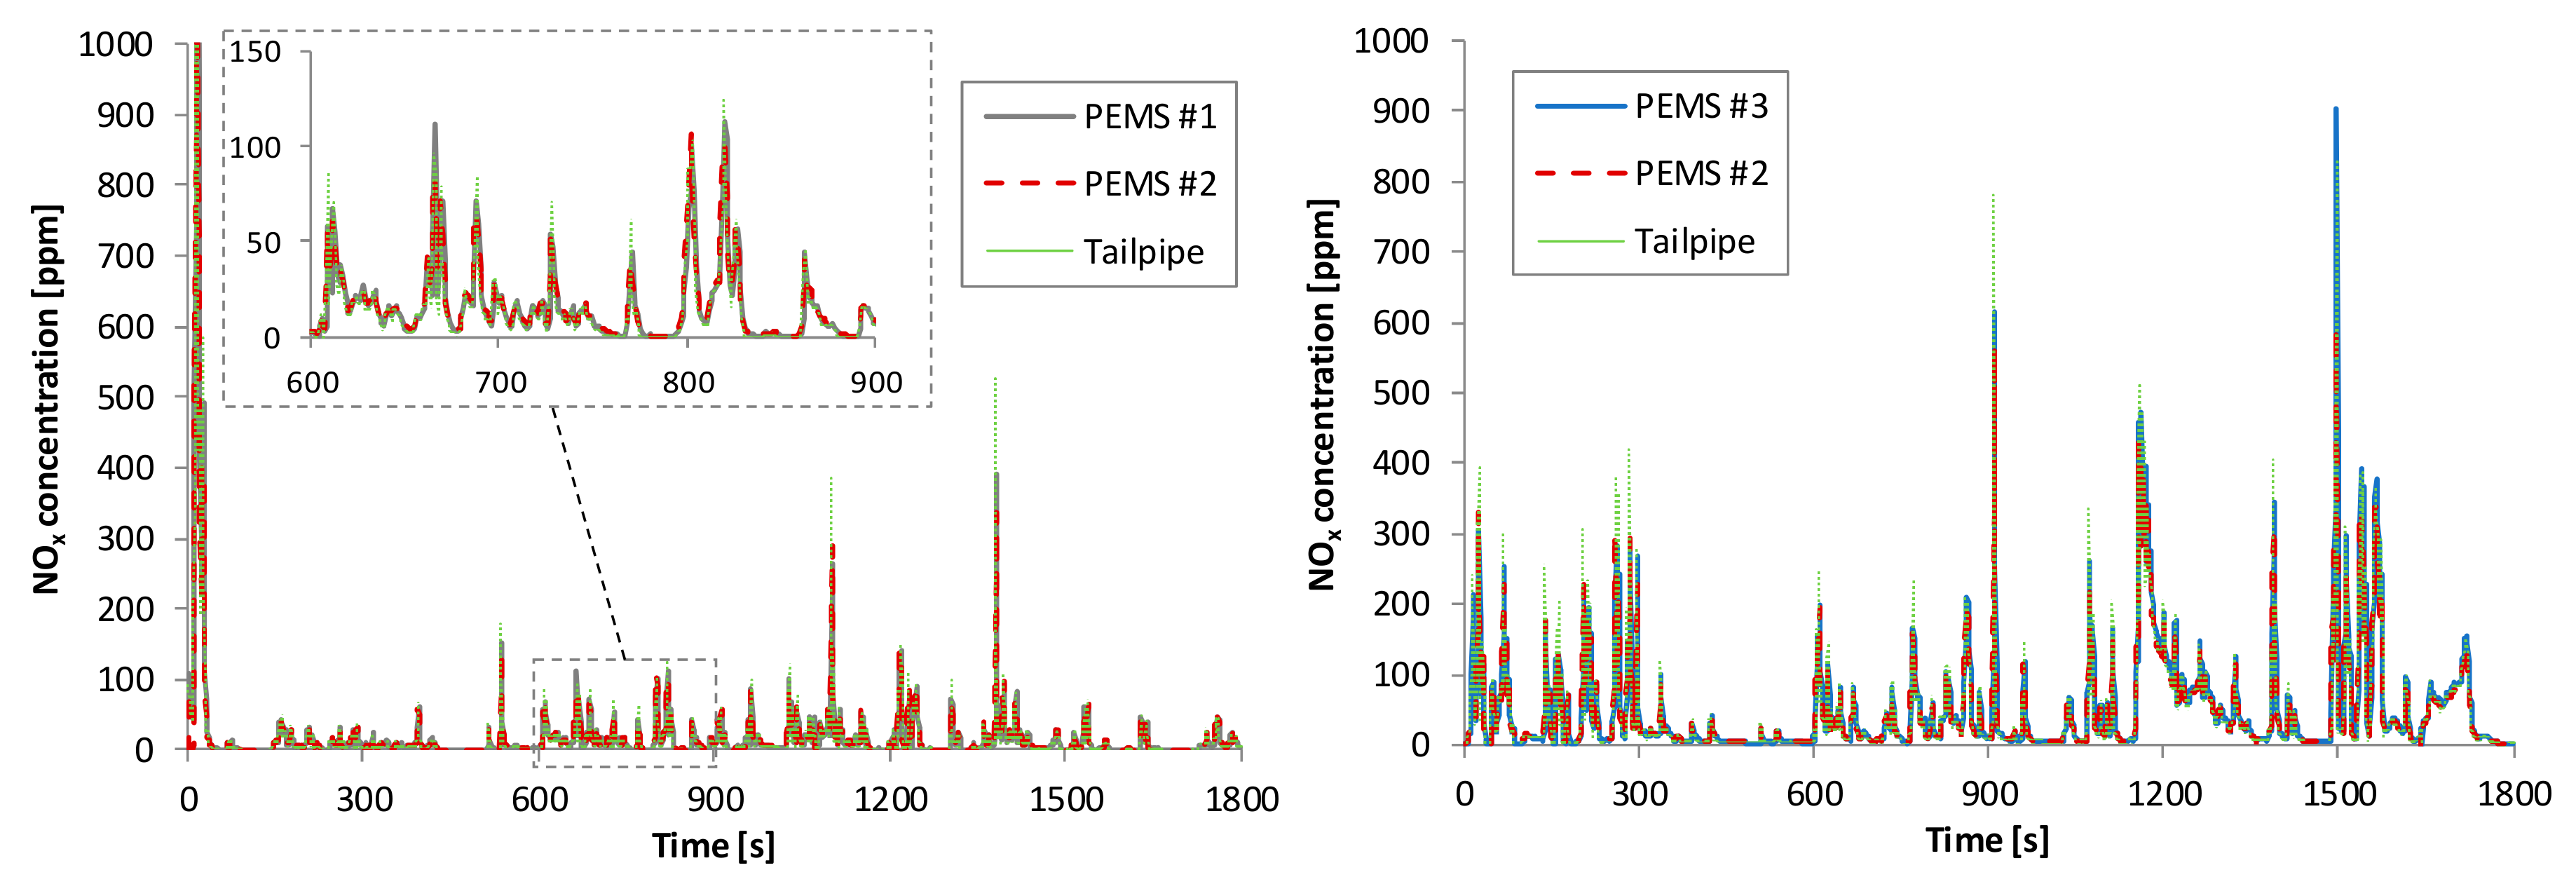
Figure 8 presents an example of the time aligned NOx data of the analyzers. The signals were almost indistinguishable from each other. Although PEMS #1 was tested with low concentrations in general, the few spikes with high concentrations (Figure 8, left panel) were at the same levels as the rest systems, indicating that the good results of Figure 7 (left panel) would also be valid at higher concentrations.
3.2. Tailpipe Versus Dilution Tunnel
3.2.1. CO2 Distance Specific Results
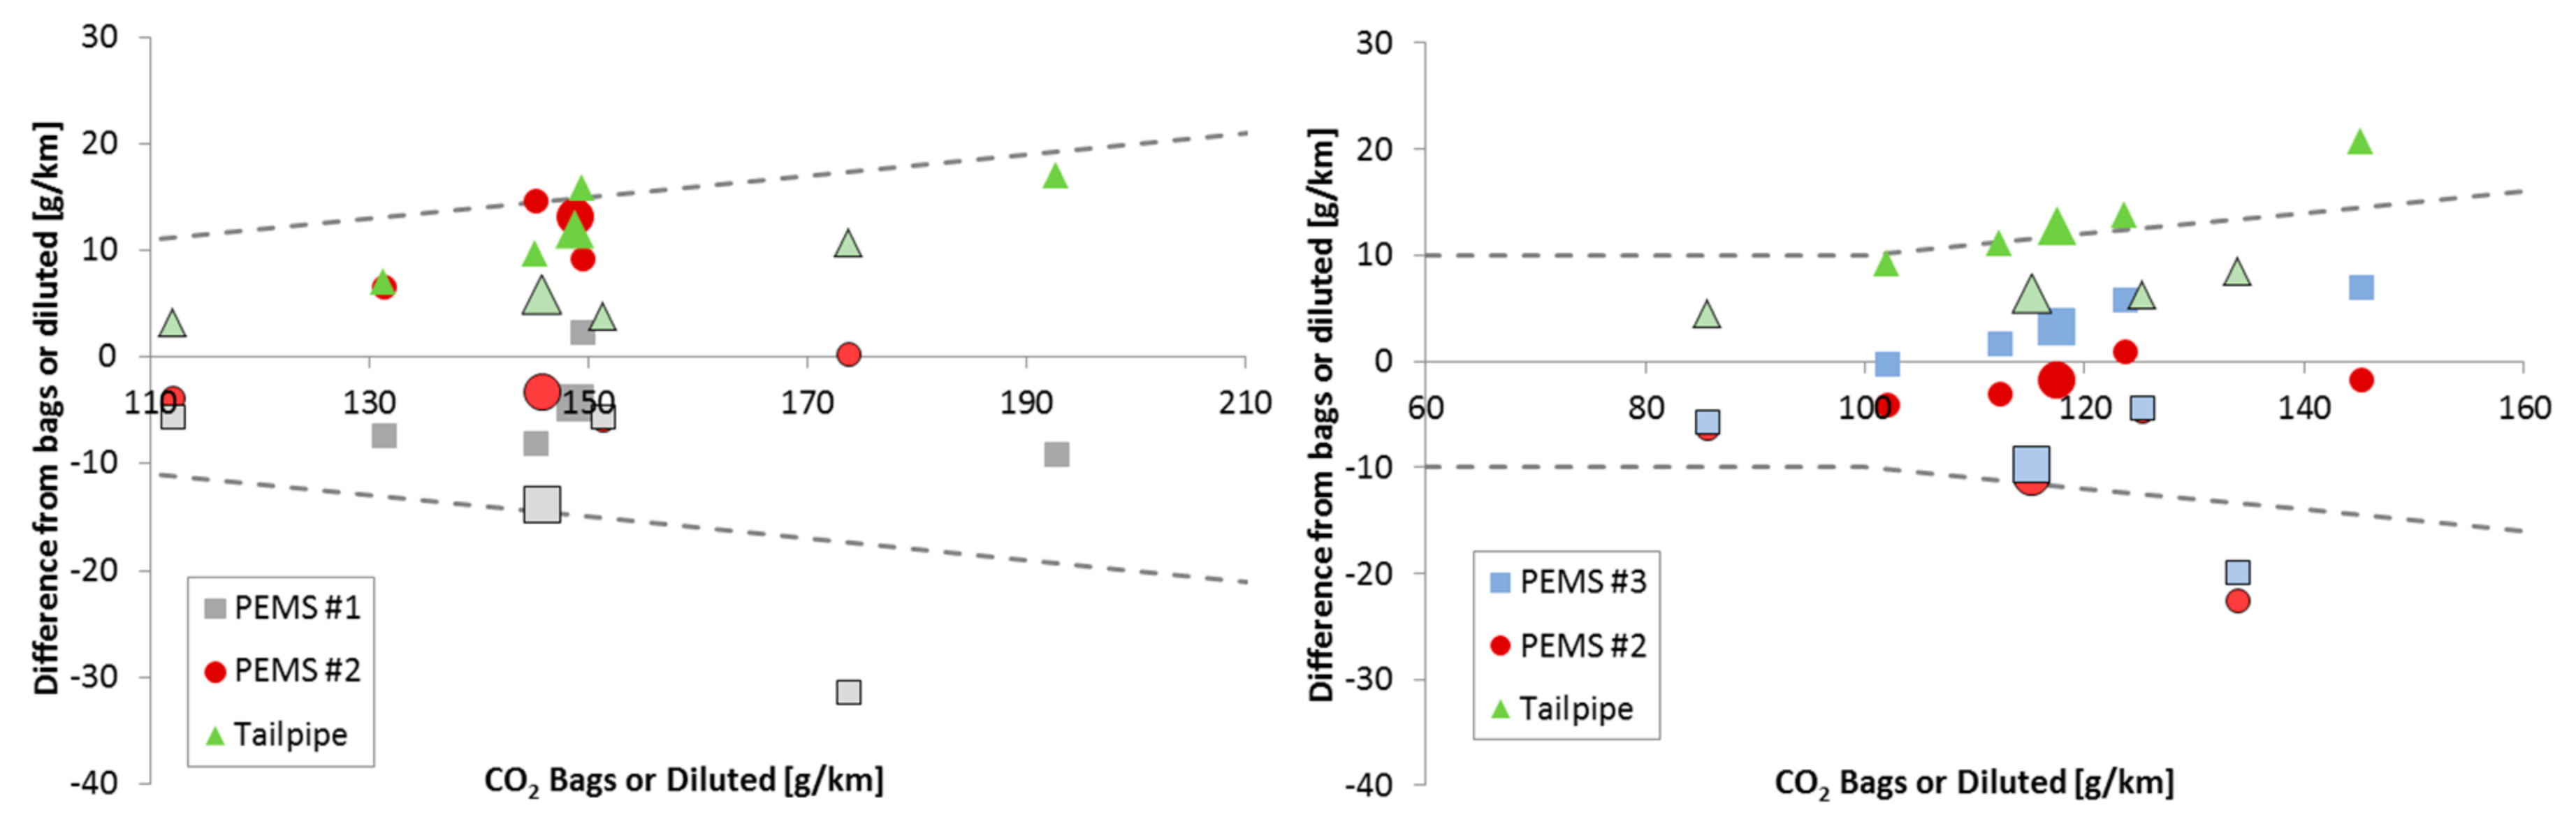
Figure 9 presents the differences of the PEMS and the tailpipe analyzers to the dilution tunnel results for each phase of the WLTC (smaller symbols without frame) or the lab-RDE cycles (smaller symbols with frame) for the two vehicles. The larger symbols are the overall cycle results. The dashed lines show permissible tolerance according to regulation [4]. Each point is the mean value of three repetitions.
The CO2 emissions were 110–200 g/km for the SI vehicle and 90–150 g/km for the CI vehicle. The differences of the PEMS and the tailpipe measurements compared to the CVS results were within the permissible range of the regulation limits (10 g/km or 10%, whichever is larger), with a few exceptions, namely: for the SI vehicle, PEMS #1 was outside the (lower) limits for the lab-RDE test (urban phase), and similarly, for the CI vehicle, PEMS #2 and PEMS #3 were outside the limits for the lab-RDE test (urban phase). The real data signals revealed that these differences were probably due to the underestimation of the mass emissions (in particular exhaust gas flow) at idle for the SI vehicle (Figure 3 or Figure 4) and the CO2 concentrations for the CI vehicle (Figure 6).
Most researchers have found differences below 3.6% [11,12,13,15,16] for CO2 mass emissions, and one study found a difference of 8% for one PEMS [13] compared with the laboratory equipment. The higher differences found in this study have to do with the higher flow rate uncertainties discussed previously (Figure 3).
3.2.2. NOx Distance Specific Results
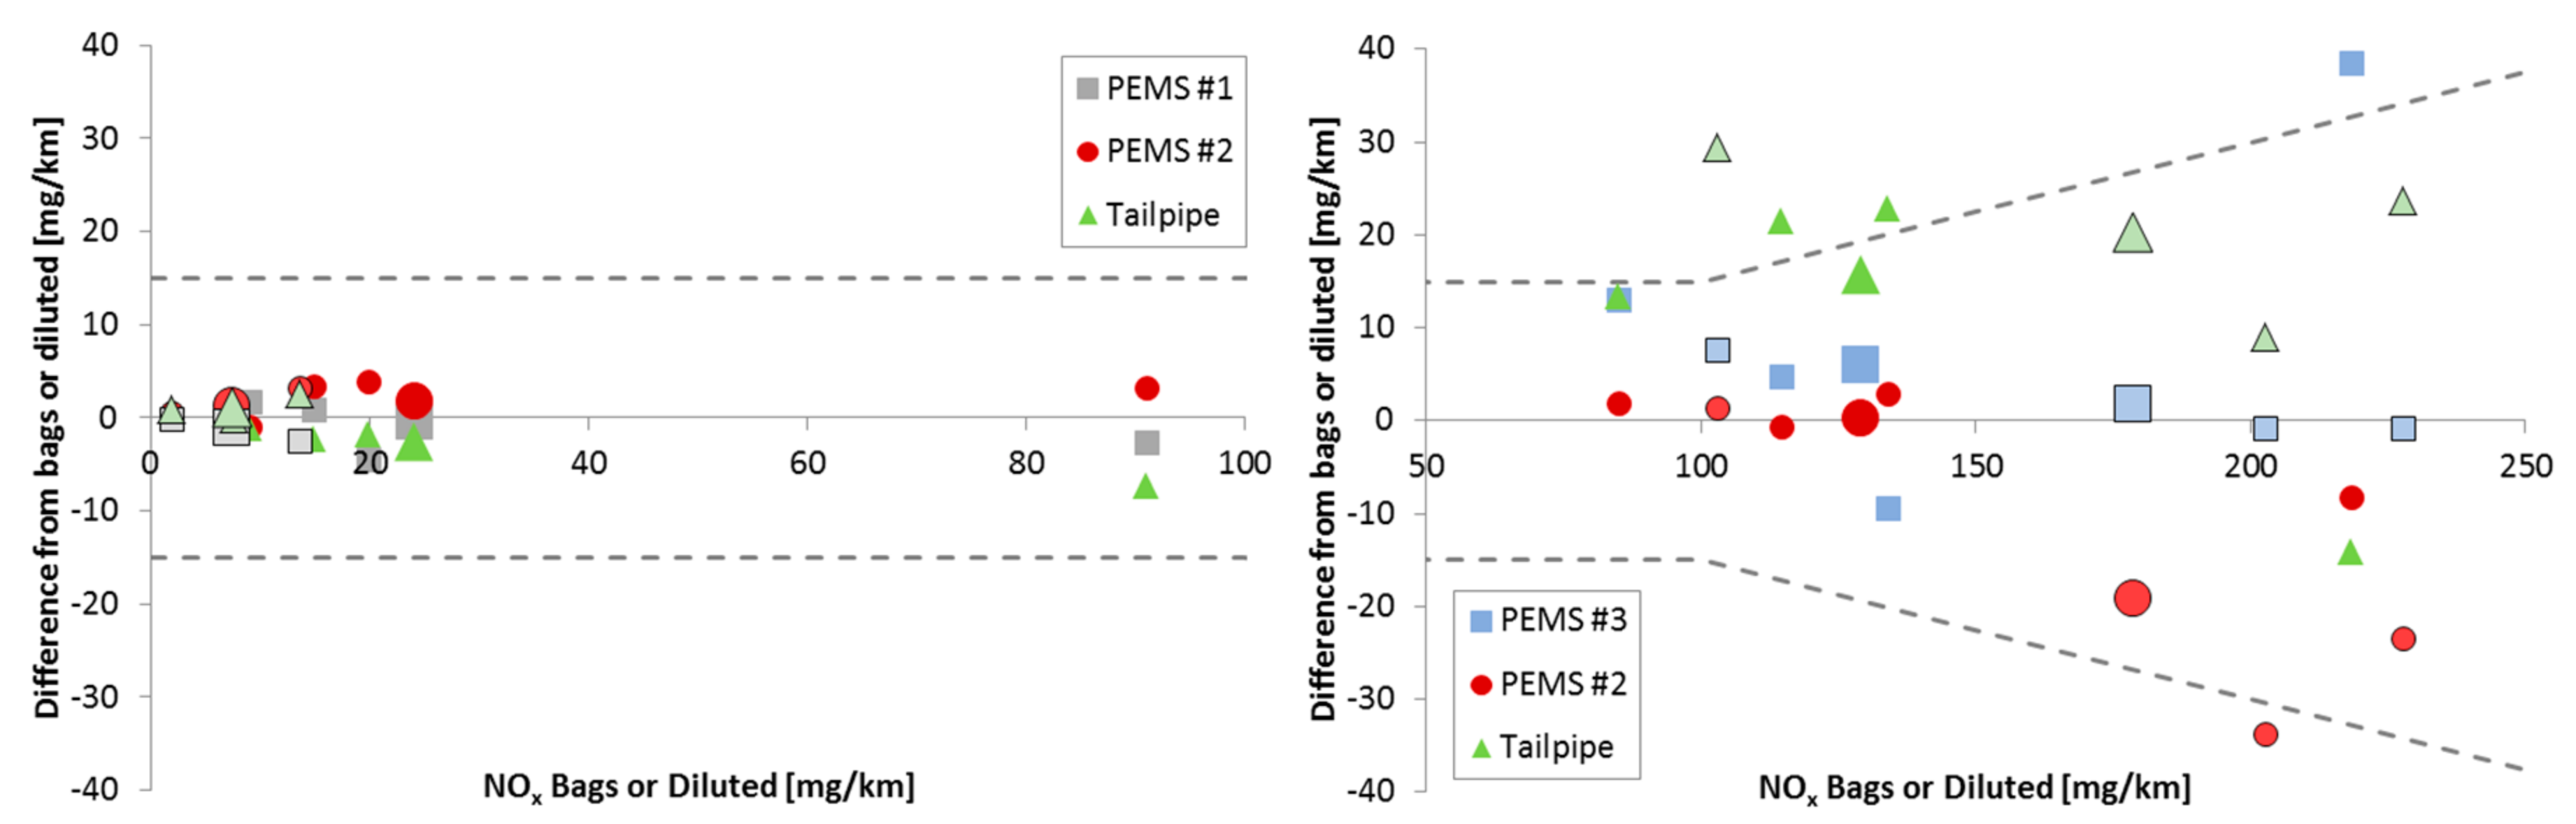
Figure 10 presents the differences of the PEMS and the tailpipe analyzers to the dilution tunnel results for each phase of the WLTC or lab-RDE cycles for the two vehicles, using the same symbols as before (Figure 9).
The NOx emissions were very low for the SI vehicle, below 30 mg/km, except during the WLTC cold start, which reached 90 mg/km. The NOx emissions of the CI vehicle ranged from 80 to 230 mg/km. The differences of the PEMS to the CVS were within the permissible by the regulation limits (15 mg/km or 15%, whichever is larger), with a few exceptions (tailpipe analyzer). The differences for the SI vehicle were within 5 mg/km, while for the CI vehicle, the scatter was up to ±40 mg/km, although most of the results were within ±20 mg/km or ±15%. Other PEMS validation studies have found differences of around 15% at the 20 mg/km NOx range (i.e., differences around 3 mg/km) [12,13] and around 10% at the 500 mg/km NOx range [11,16].
4. Conclusions
The PEMS from two manufacturers were compared with laboratory grade analyzers connected to the tailpipe, the dilution tunnel, and/or the bags, as prescribed by the regulation. Two vehicles, one spark ignition (SI, gasoline) and one compression ignition (CI, diesel), were used to evaluate the performance of the PEMS during the WLTC and a lab simulated RDE cycle.
The CO2 concentrations from the PEMS and tailpipe gas analyzers were within 2.5%. However, the PEMS that measured the ‘wet’ concentrations (heated NDIR) showed higher concentrations (+4%) at the cold start of the SI vehicle. The NOx concentration from the PEMS analyzers were within 5% for the mean levels of 20 ppm or higher, but the differences increased to 15% at 7 ppm and 30% at 1 ppm. Similar behavior was seen for both techniques (CLD and NDUV). The exhaust flow measurements had an uncertainty of around ±4 kg/h, that is, ±10% for exhaust mass rates equal or lower than 40 kg/h, but around 5% at higher flow rates.
The distance specific CO2 emissions (in g/km) of the PEMS were typically lower (but within 10%) than the bag (diluted) results, while the laboratory tailpipe emissions were higher (but within 10%). The differences were mainly attributed to the exhaust flow measurement uncertainties. The distance specific NOx emissions of PEMS were within 10% of the bag (diluted) results in most cases.
The results of this study underline that current technology PEMS provide measures with good accuracy, particularly the gas analyzers, which present results close to the levels of laboratory grade equipment. However, the biggest contribution of the differences between the PEMS and bags (diluted) measurements comes from the exhaust flow measurements. At the moment, there is no simple way to check the flow meters of PEMS, and the validation test on the chassis dynamometer remains the most valid check. Systems without exhaust flow meters that estimate the exhaust flow (however, they are not considered PEMS) will probably have a higher uncertainty. Moreover, for technologies with low NOx levels, PEMS should improve the current relative high uncertainty at low concentrations, near their zero levels.
These findings are important, because they confirm that air quality studies and emission inventories based on PEMS measurements have a low measurement uncertainty (values as reported above) for vehicles with emission levels of approximately 100 mg/km and higher. The introduction of the real driving emissions test procedure will contribute to the reduction of urban air pollution, because new vehicles will emit lower emissions; however, the PEMS relative measurement uncertainty will be higher. The results of this study can help in a better estimation of the PEMS measurement uncertainty during the annual reviews, as follows: (1) the uncertainty of NOx at lower levels was quantified and (2) the flow meter uncertainty was almost constant (and not relative).
What should be further investigated is whether there is any drift of the analyzers on the road as well as any influence of the environmental conditions (temperature and pressure) that would further increase the differences and uncertainty of the measurements. In addition, investigation on how acceleration and power can influence the PEMS measurement could be an add-on to the current research.
Author Contributions
Conceptualization, B.G.; data curation, R.A.V.; writing (original draft preparation), R.A.V. and B.G.; writing (review and editing), G.D. and L.S.
Funding
The work of R.A.V. was covered by the National Council of Scientific and Technological Development (CNPq–Brazil) for his Doctoral financial support (202097/2014-5).
Acknowledgments
The suggestions of Pierre Bonnel and Michael Clairotte on the earlier draft are appreciated. The technical support of Mauro Cadario, Philippe Le Lijour, Dominique Lesueur, Andrea Bonamin, and Mirco Sculati is highly appreciated. R.A.V. acknowledges the National Council of Scientific and Technological Development (CNPq–Brazil) for his Doctoral financial support (202097/2014-5).
Conflicts of Interest
The authors declare no conflict of interest. The funders had no role in the design of the study; in the collection, analyses, or interpretation of data; in the writing of the manuscript; and in the decision to publish the results.
Disclaimer
The opinions expressed in this manuscript are those of the authors and should in no way be considered to represent an official opinion of the European Commission. The mention of trade names or commercial products does not constitute endorsement or recommendation by the authors or the European Commission.
References
- European Commission. EU Transport in Figures; Publications Office of the European Union: Luxembourg, 2017; ISBN 978-92-79-62312-7. [Google Scholar]
- European Environmental Agency (EEA). Transitions towards a More Sustainable Mobility System; Report No. 34/2016; Publications Office of the European Union: Luxembourg, 2016; ISSN 1977-8449. [Google Scholar]
- European Environmental Agency (EEA). Air Quality in Europe; Report No. 13/2017; Publications Office of the European Union: Luxembourg, 2017; ISBN 978-92-9213-921-6. [Google Scholar]
- European Commission. Commission Regulation (EU) 2017/1151 of 1 June 2017 supplementing Regulation (EC) No. 715/2007 of the European Parliament and of the Council on type-approval of motor vehicles with respect to emissions from light passenger and commercial vehicles (Euro 5 and Euro 6) and on access to vehicle repair and maintenance information, amending Directive 2007/46/EC of the European Parliament and of the Council, Commission Regulation (EC) No. 692/2008 and Commission Regulation (EU) No. 1230/2012 and repealing Commission Regulation (EC) No. 692/2008. Off. J. Eur. Union 2017, L175, 1–643. [Google Scholar]
- Pavlovic, J.; Ciuffo, B.; Fontaras, G.; Valverde, V.; Marotta, A. How much difference in type-approval CO2 emissions from passenger cars in Europe can be expected from changing to the new test procedure (NEDC vs. WLTP)? Transp. Res. Part A 2018, 111, 136–147. [Google Scholar]
- Giechaskiel, B.; Vlachos, T.; Riccobono, F.; Forni, F.; Colombo, R.; Montigny, F.; Le-Lijour, P.; Carriero, M.; Bonnel, P.; Weiss, M. Implementation of portable emissions measurement systems (PEMS) for the real-driving emissions (RDE) regulation in Europe. J. Vis. Exp. 2016, 118. [Google Scholar] [CrossRef] [PubMed]
- Baldino, C.; Tiegte, U.; Muncrief, R.; Bernard, Y.; Mock, P. Road Tested: Comparative Overview of Real-World Versus Type-Approval NOx and CO2 Emissions from Diesel Cars in Europe; White Paper; International Council on Clean Transportation Europe (ICCT): Berlin, Germany, 2017. [Google Scholar]
- Merkisz, J.; Pielecha, J.; Bielaczyc, P.; Woodburn, J. Analysis of emission factors in RDE tests as well as in NEDC and WLTC chassis dynamometer tests. SAE Tech. Pap. 2016. [Google Scholar] [CrossRef]
- Giechaskiel, B.; Clairotte, M.; Valverde-Morales, V.; Bonnel, P.; Kregar, Z.; Franco, V.; Dilara, P. Framework for the assessment of PEMS (Portable Emissions Measuremet Systems) uncertainty. Environ. Res. 2018, 166, 251–260. [Google Scholar] [CrossRef] [PubMed]
- Andersson, J.; May, J.; Favre, C.; Bosteels, D.; de Vries, S.; Heaney, M.; Keenan, M.; Mansell, J. On-road and chassis dynamometer evaluations of emissions from two Euro 6 diesel vehicles. SAE Int. J. Fuels Lubr. 2014, 7, 919–934. [Google Scholar] [CrossRef]
- Kwon, S.; Park, Y.; Park, J.; Kim, J.; Choi, K.; Cha, J. Characteristics of on-road NOx emissions from Euro 6 light-duty diesel vehicles using a portable emissions measurement system. Sci. Total Environ. 2017, 576, 70–77. [Google Scholar] [CrossRef] [PubMed]
- Thompson, G.; Carder, D.; Besch, M.; Thiruvengadam, A.; Kappanna, H. In-Use Emissions Testing of Light-Duty Diesel Vehicles in the United States; Report; West Virginia University: Morgantown, VI, USA, 2014. [Google Scholar]
- Czerwinski, J.; Zimmerli, Y.; Comte, P.; Bütler, T. Experiences and results with different PEMS. J. Earth Sci. Geotech. Eng. 2016, 6, 91–106. [Google Scholar]
- Hawley, J.; Bannister, C.; Brace, C.; Cox, A.; Ketcher, D.; Stark, R. Vehicle modal emissions measurement—Techniques and issues. Proc. Inst. Mech. Eng. Part D J. Automob. Eng. 2004, 218, 859–873. [Google Scholar] [CrossRef]
- Verner, J.; Sejkorova, M. Comparison of CVS and PEMS measuring devices used for stating CO2 exhaust emissions of light-duty vehicles during WLTP testing procedure. Eng. Rural Dev. 2018, 2054–2059. [Google Scholar] [CrossRef]
- Giechaskiel, B.; Suarez-Bertoa, R.; Lahde, T.; Clairotte, M.; Carriero, M.; Bonnel, P.; Maggiore, M. Evaluation of NOx emissions of a retrofitted Euro 5 passenger car for the Horizon prize “Engine retrofit”. Environ. Res. 2018, 166, 298–309. [Google Scholar] [CrossRef] [PubMed]
Figure 1.
A Worldwide harmonized Light vehicle Test Cycle (WLTC) Class 3 divided in four phases (low, medium, high, and extra high), and a pre-recorded real driving emissions (RDE) cycle under laboratory conditions (lab-RDE) cycle divided in three phases (urban, rural, and motorway).
Figure 1.
A Worldwide harmonized Light vehicle Test Cycle (WLTC) Class 3 divided in four phases (low, medium, high, and extra high), and a pre-recorded real driving emissions (RDE) cycle under laboratory conditions (lab-RDE) cycle divided in three phases (urban, rural, and motorway).

Figure 2.
Vehicle Emissions Laboratory (VELA 1) experimental setup (spark-ignition [SI] vehicle). For the compression-ignition (CI) vehicle, the setup was identical with portable emissions measurement systems (PEMS) #3 and PEMS #2.
Figure 2.
Vehicle Emissions Laboratory (VELA 1) experimental setup (spark-ignition [SI] vehicle). For the compression-ignition (CI) vehicle, the setup was identical with portable emissions measurement systems (PEMS) #3 and PEMS #2.

Figure 3.
Differences of flow measurement systems from their mean value for each cycle phase. Left panel: SI vehicle. Right panel: CI vehicle. The frameless symbols are the WLTC phases, while the framed symbols indicate the Lab-RDE phases. The larger symbols represent the overall cycle results, and the smaller symbols represent each cycle phase. Each point is the mean value of three repetitions. The dashed lines indicate a 10% difference.

Figure 4.
Examples of real time comparison of systems measuring exhaust flow. Left panel: SI vehicle. Right panel: CI vehicle.
Figure 4.
Examples of real time comparison of systems measuring exhaust flow. Left panel: SI vehicle. Right panel: CI vehicle.

Figure 5.
Differences of CO2 analyzers. Left panel: SI vehicle. Right panel: CI vehicle. Each point is the mean value of three repetitions. The dashed lines show the 2% limit when compared with the calibration span gas.
Figure 5.
Differences of CO2 analyzers. Left panel: SI vehicle. Right panel: CI vehicle. Each point is the mean value of three repetitions. The dashed lines show the 2% limit when compared with the calibration span gas.

Figure 6.
Examples of CO2 concentration (%) real time profiles. Left panel: SI vehicle. Right panel: CI vehicle.
Figure 6.
Examples of CO2 concentration (%) real time profiles. Left panel: SI vehicle. Right panel: CI vehicle.

Figure 7.
Differences of NOx analyzers. Left panel: SI vehicle. Right panel: CI vehicle. Each point is the mean value of three repetitions. Dashed lines indicate the 5% assumed uncertainty [9].
Figure 7.
Differences of NOx analyzers. Left panel: SI vehicle. Right panel: CI vehicle. Each point is the mean value of three repetitions. Dashed lines indicate the 5% assumed uncertainty [9].

Figure 8.
Examples of NOx concentration [ppm] real time profiles. Left panel: SI vehicle. The first spike of 2000 ppm with the SI vehicle is not shown so as to improve the readability at the lower range. Right panel: CI vehicle.
Figure 8.
Examples of NOx concentration [ppm] real time profiles. Left panel: SI vehicle. The first spike of 2000 ppm with the SI vehicle is not shown so as to improve the readability at the lower range. Right panel: CI vehicle.

Figure 9.
CO2 emission differences of PEMS and tailpipe analyzers from bags (WLTC) or dilution tunnel (lab-RDE). Left panel: SI vehicle. Right panel: CI vehicle. The dashed lines are the permissible tolerance according to the regulation [4].
Figure 9.
CO2 emission differences of PEMS and tailpipe analyzers from bags (WLTC) or dilution tunnel (lab-RDE). Left panel: SI vehicle. Right panel: CI vehicle. The dashed lines are the permissible tolerance according to the regulation [4].

Figure 10.
NOx emission differences of PEMS and tailpipe analyzers from bags (WLTC) or dilution tunnel (lab-RDE). Left panel: SI vehicle. Right panel: CI vehicle. The dashed lines show permissible tolerance according to the regulation [4].
Figure 10.
NOx emission differences of PEMS and tailpipe analyzers from bags (WLTC) or dilution tunnel (lab-RDE). Left panel: SI vehicle. Right panel: CI vehicle. The dashed lines show permissible tolerance according to the regulation [4].


Table 1.
Characteristics of the vehicles.
| Technology | Vehicle 1 (SI) | Vehicle 2 (CI) |
|---|---|---|
| Displacement (L) | 1.4 | 1.6 |
| Power (kW) | 57 | 90 |
| Transmission/gearbox | Manual/5 | Manual/6 |
| Vehicle mass (kg) | 1130 | 1360 |
| Exhaust after treatment | TWC | DOC + DPF + NS |
| Fuel | Gasoline | Diesel |
| Fuel system | MPFI | Common rail |
| Emission standard | Euro 6 | Euro 6 |
DOC—diesel oxidation catalytic converter; DPF—diesel particulate filter; TWC—three-way catalytic converter; NS—NOx Storage system; MPFI—multi point fuel injection; SI—spark-ignition; CI—compression-ignition.
Table 2.
Characteristics of the equipment.
| Technology | PEMS #1 | PEMS #2, #3 | Tailpipe | Diluted/Bags |
|---|---|---|---|---|
| Manufacturer | Horiba | AVL | AVL | AVL |
| Model | OBS-ONE | M.O.V.E. | AMA i60 | AMA i60 |
| Principle CO2 | Heated NDIR | NDIR | NDIR | NDIR |
| Range CO2 | 20% | 20% | 1%, 20% | 1%, 6% |
| Principle NOx | Heated CLD | NDUV | CLD | CLD |
| Range NOx (ppm) | 3000 | 5000 | 100, 1000, 10,000 | 10, 100, 1000 |
| EFM | Pitot 2″ | Pitot 2&2.5″ | CO2 tracer | - |
NDIR—on-dispersive infrared detection; CLD—chemiluminescence detection, NDUV—non-dispersive ultraviolet; EFM—exhaust flow meter; PEMS—portable emissions measurement systems.
© 2018 by the authors. Licensee MDPI, Basel, Switzerland. This article is an open access article distributed under the terms and conditions of the Creative Commons Attribution (CC BY) license (http://creativecommons.org/licenses/by/4.0/).
Share and Cite
MDPI and ACS Style
Varella, R.A.; Giechaskiel, B.; Sousa, L.; Duarte, G. Comparison of Portable Emissions Measurement Systems (PEMS) with Laboratory Grade Equipment. Appl. Sci. 2018, 8, 1633. https://doi.org/10.3390/app8091633
AMA Style
Varella RA, Giechaskiel B, Sousa L, Duarte G. Comparison of Portable Emissions Measurement Systems (PEMS) with Laboratory Grade Equipment. Applied Sciences. 2018; 8(9):1633. https://doi.org/10.3390/app8091633
Chicago/Turabian StyleVarella, Roberto Aliandro, Barouch Giechaskiel, Luís Sousa, and Gonçalo Duarte. 2018. "Comparison of Portable Emissions Measurement Systems (PEMS) with Laboratory Grade Equipment" Applied Sciences 8, no. 9: 1633. https://doi.org/10.3390/app8091633
Note that from the first issue of 2016, this journal uses article numbers instead of page numbers. See further details here.