Numerical Investigations on Melting Behavior of Phase Change Material in a Rectangular Cavity at Different Inclination Angles


School of Electrical Engineering and Automation, Harbin Institute of Technology, Harbin 150001, China
*
Author to whom correspondence should be addressed.
Appl. Sci. 2018, 8(9), 1627; https://doi.org/10.3390/app8091627
Submission received: 13 August 2018
/
Revised: 6 September 2018
/
Accepted: 10 September 2018
/
Published: 12 September 2018
(This article belongs to the Section Energy Science and Technology)
Abstract
:Featured Application
This work can be used for the optimal design of temperature control unit using phase change material.
Abstract
This paper investigates the melting process of phase change material in a rectangular cavity at different inclination angles. Paraffin is used as a phase change material in this study. One side of the cavity is heated while the other sides are considered to be adiabatic. The investigated angles of inclination include 0° (bottom horizontal heating), 30°, 60°, 90° (vertical heating), 120°, 150° and 180° (top horizontal heating). Shapes of the solid liquid interface and temperature variations during the melting process were discussed for all the inclination angles. The results reveal that the inclination angles have a significant impact on the melting behavior of paraffin. As the angle increases from 0° to 180°, the complete melting time increases non-linearly.
1. Introduction
Solid liquid phase change materials (PCMs) have attracted increasingly more interest because of their large latent heat storage and nearly constant temperature during the phase change process [1]. PCMs are used in a number of practical applications, such as solar energy system [2,3], electronic thermal management system [4,5], spacecraft [6] and buildings [7]. In order to investigate the melting process of phase change materials, a great deal of studies have been carried out based on different models, including rectangular cavity [8], cylindrical container [9], tilting-wall square cavity [10] and annular cavity [11,12]. Out of all these models, the rectangular cavity is widely investigated owing to the simple structure, which can help us to understand the melting process of PCMs.
Over the past years, numerous investigations on melting PCMs have been carried out to study the melting process in a vertical or horizontal container. Hale and Viskanta [13] reported a significant effect of natural convection on heat transfer rate and phase change solid liquid interface shape during n-octadecane melting. They noticed that natural convection should be considered in order to meet good agreement between numerical results and experimental data for the solid liquid interface position. Ho and Viskanta [14] presented the melting process of n-octadecane in a rectangular cavity that had an isothermal vertical wall. During the melting process, basic heat transfer data were reported. Based on the experimental results, they found that the melting rate and melting front profile were affected by the buoyancy-driven convection. Pal and Joshi [15] studied the melting process of n-triacontane in a tall enclosure with a constant heat flux on the left vertical side wall. They discovered the influence of natural convection on heat transfer of melting. Based on this discovery, they concluded that the heat conduction played the dominant role during initial stages of melting. In later stages, the natural convection began to become the dominant role of melting. After melting, the buoyancy induced flow weakened and heat storage increased with time. Shokouhmand and Kamkari [16] presented an experiment to visualize the temperature distribution and melting interface evolution during the phase change process of lauric acid in a vertical container. They discussed the dominant heat transfer mechanisms of the melting process during different stages. In addition, they also investigated the total, latent and sensible energies in each thermal storage unit when the unit was heated at different temperatures. Wang et al. [17] studied the influence of heat source temperature on heat transfer capability of paraffin in a horizontal container. Their results showed that the complete phase transformation time of PCM decreased while the heating boundary temperature increased, and the corresponding function between the complete melting time and the heating boundary temperature of pure paraffin.
However, there were only a few investigators who studied the melting heat transfer of PCM in an inclined enclosure. Webb and Viskanta [18] presented a heat transfer process of n-octadecane melting in an inclined rectangular enclosure. They concluded that natural convective motion was intensified when the inclination angle with respect to the vertical increased. Akgun et al. [19] designed a storage unit in order to respond the melting characteristics of paraffin. They discovered that melting time of paraffin was reduced by 30% if the enclosure was tilted 5° with respect to the vertical position. Chen et al. [20] studied the heat transfer process in a solar flat-plate collector with the inclination angle of 32°. They showed the variation of temperature distribution and heat loss coefficient of paraffin-solar collector during different times of a day. Libeer et al. [21] compared temperature distribution and melting time simply with three different orientations including upward, right side and downward. However, the effect of inclination angles was not the focus of their research.
As the paraffin can be used for temperature control, the melting processes are apparently important. In order to prevent the device from being contaminated by liquid PCM, the PCM needs to be placed in the cavity. In addition, in practical applications, the temperature-controlled PCM may have a certain angle with gravity, so it is necessary to study the PCM placed in the inclined cavity. Therefore, in this paper, the melting heat transfer process of PCM in a rectangular cavity is studied for several inclination angles including 0° (bottom horizontal heating), 30°, 60°, 90° (vertical heating), 120°, 150° and 180° (top horizontal heating). A numerical model is established and verified by experimental data. Furthermore, shapes of solid liquid interface and temperature variations during melting process are discussed for all angles.
2. Experimental Setup
2.1. Thermophysical Properties of Paraffin
In this paper, paraffin of RubiTherm (RT) 60 is chosen as the PCM because of its high latent heat, chemical safety and stability. Moreover, there are almost no changes in phase change temperature and latent heat of paraffin after repeated exothermic absorption process. The paraffin is bought from an agent of the RubiTherm Company, and all the thermal properties are provided by the supplier, shown in Table 1. All thermophysical properties are obtained at 80 °C, except density and thermal conductivity of solid paraffin, which are obtained at 25 °C. In addition, the melting temperature region and latent heat are determined by differential scanning calorimetry (DSC) with the temperature scanning from 25 to 80 °C, which represents the thermophysical properties of the melting range.
2.2. Physical Model
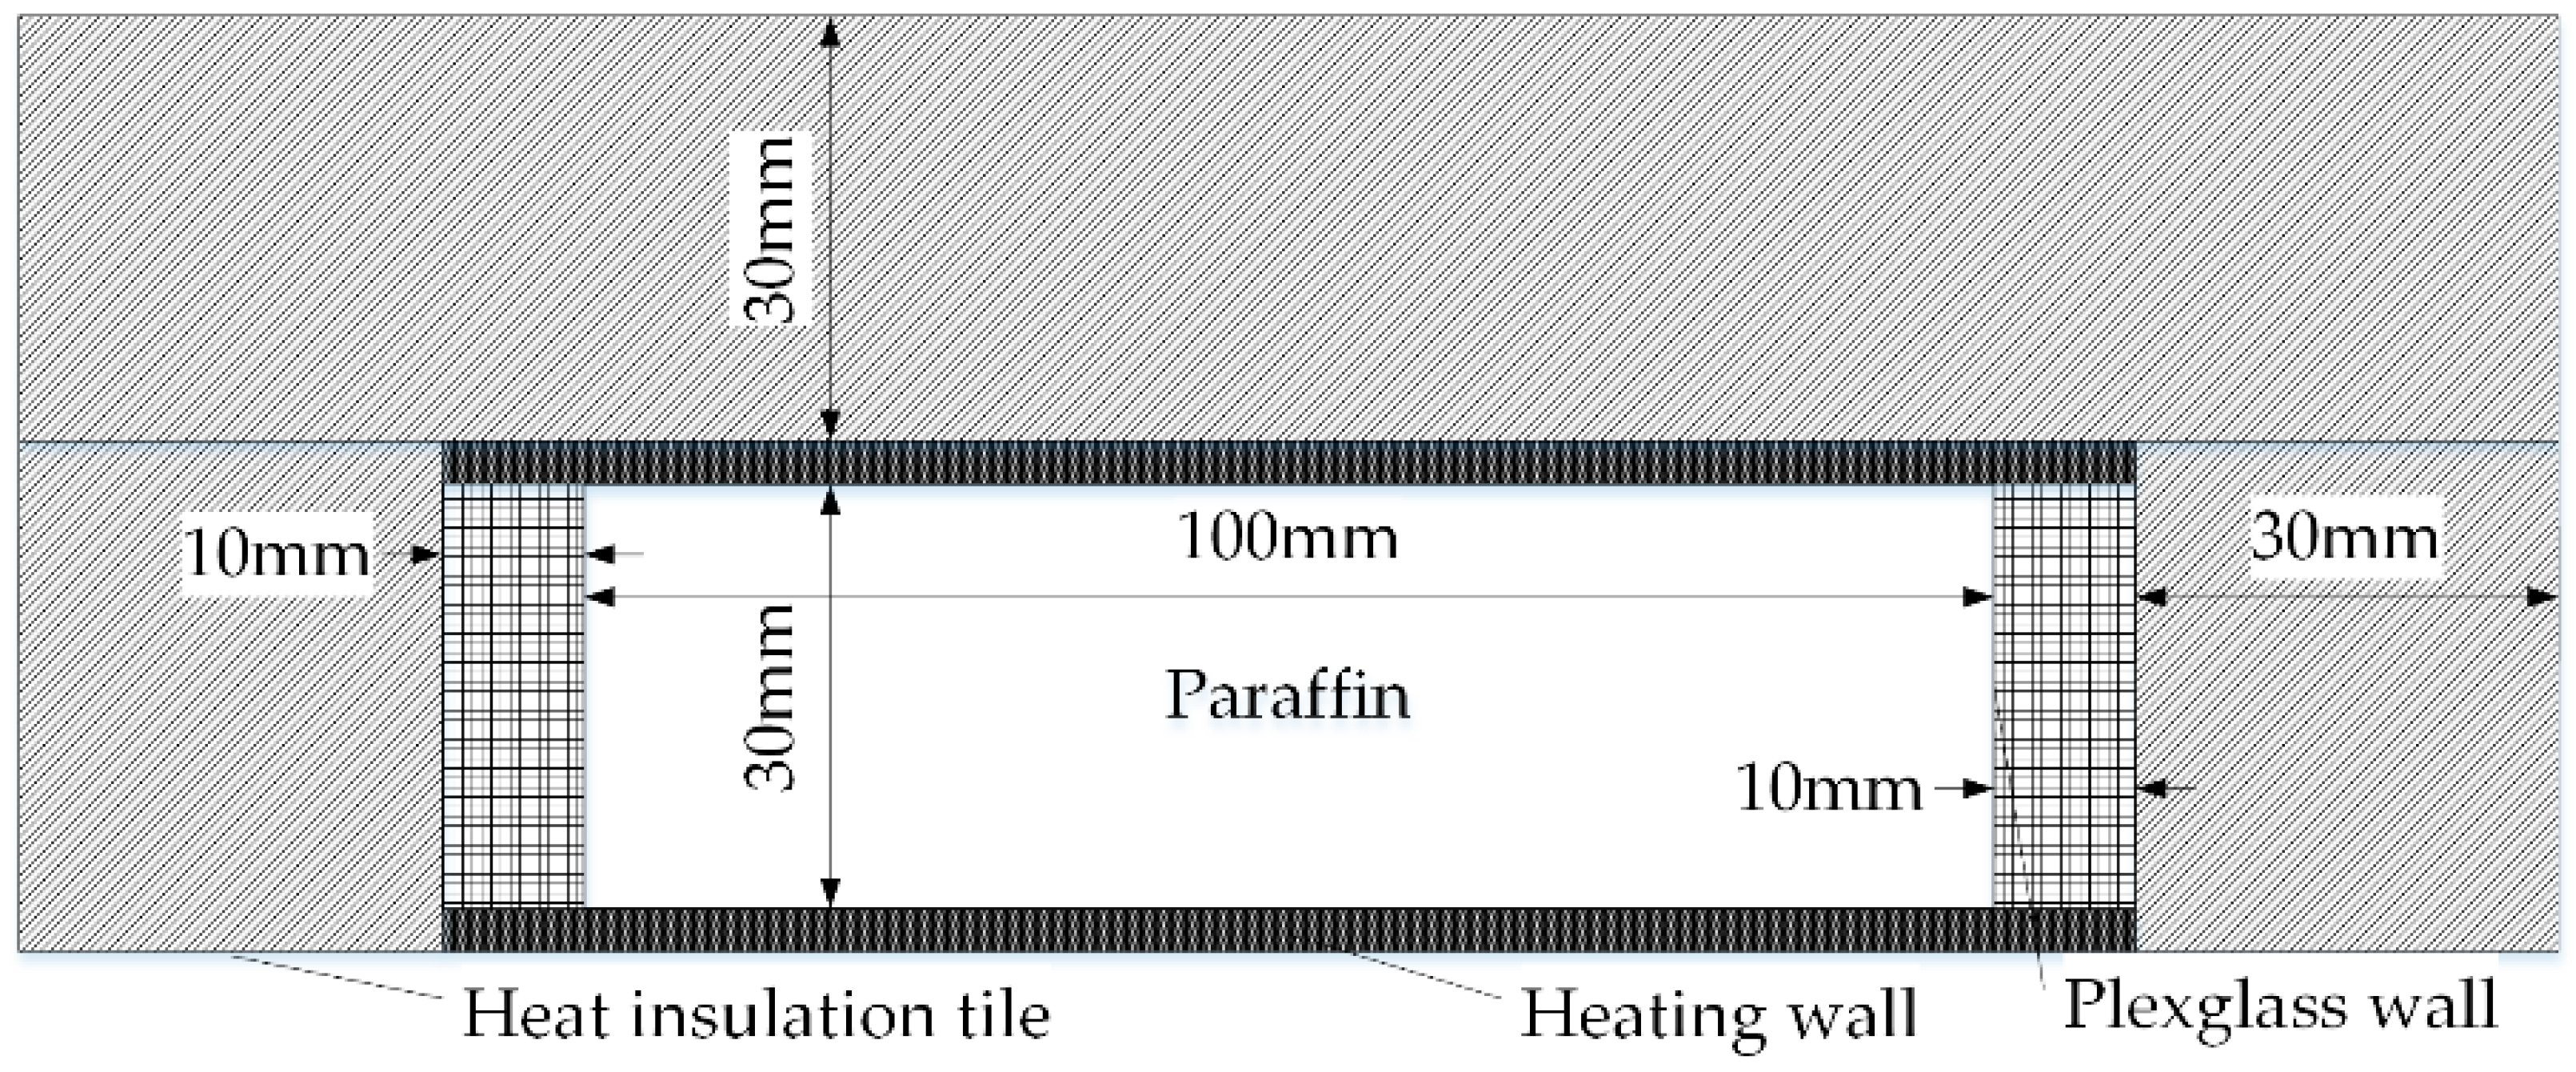
In avionics, the surface dimension of the standard electronic module (SEM) is 100 × 100 mm. The dimension of PCM needs to match the size of the SEM and has a certain thickness. In order to observe the variation of solid liquid interface and temperatures during the melting process at different inclination angles, a thickness of 30 mm is selected in the experiment. Figure 1 shows the structure of the specimen container. The heating wall is made of aluminum alloy with 3 mm in thickness. A commercial apparatus Hotdisk is used to measure the thermal conductivity of aluminum alloy, which can measure the thermal conductivity ranged from 0.005 W/mK to 500 W/mK with an uncertainty of ±3% over a wide temperature range. During the measuring process, the sensor of Hotdisk is sandwiched between two pieces of aluminum alloy with the dimension of Φ70 × 20 mm. After supplying a small constant current for a short time, the thermal conductivity is calculated by monitoring the temperature increase in the sensor. The measuring result is 153.39 W/mK, which is much larger than the thermal conductivity of paraffin. Other sides are made up of Plexiglass sheet with 10 mm in thickness to realize the visualization and photography of the solid liquid interface during the melting process of paraffin. In addition, the container is insulated by 30 mm thick heat insulation tiles with the thermal conductivity of 0.085 W/mK [22].
In order to investigate the melting behavior of the paraffin in a rectangular enclosure at different angles from 0 to 180°, the specimen is mounted on a rotatable frame together with the container and the heat insulation attachment. The physical model is shown in Figure 2. Except for heating wall, the other walls are considered adiabatic. Besides, the specimen can be rotated to any angle (α) in the XY plane.
2.3. Experimental Apparatus
The experimental apparatus consists of a specimen container with thermal insulation attachment, a heating system with Potential Induced Degradation (PID) control, and a computer system with data and image acquisition. Figure 3 shows the schematic of the experimental apparatus.
In order to monitor the variation of temperature inside the specimen, five K-type thermocouples are placed in the specimen at different locations in the same z plane (z = 15 mm), as shown in Figure 4.
Figure 5 shows the flowchart of the experimental procedure. During the experiment, the specimen is rotated to a required angle. Then, the heating wall is heated from 25 to 80 °C using a PID controller. At the same time, data acquisition (DAQ) card is used to collect temperature data of the heating wall and the specimen. When the temperature of the heating wall reaches 80 °C, the PID controller makes the temperature stable at 80 ± 0.1 °C, and the DAQ card continues collecting the temperature data until the stop signal is received. Besides, during the experiment, a camera is used to capture the solid liquid interface at 60 min after the start of heating. The choice of this time depends on the simulation results of the solid liquid interface during the melting process, which will be discussed in Section 4.
3. Mathematical Model
3.1. Governing Equations
In order to simplify the mathematic model, the following assumptions are made:
- (1)
- The liquid paraffin is regarded as an incompressible Newtonian fluid, and its density is subjected to the Boussinesq approximation.
- (2)
- The paraffin is assumed isotropic and homogeneous, and the flow of liquid paraffin is laminar flow. The volume change of paraffin during phase change is not taken into account.
- (3)
- The thermal properties of paraffin are constant in the solid or liquid region. In the phase change region, these parameters vary linearly with temperature.
- (4)
- Because the specimen is surrounded by thermal insulation tiles, the walls are regarded as adiabatic, except for the heating wall.
Based on the above assumptions, the governing equations are written in Equations (1)–(4).
Continuity equation:
Momentum equations:
in which Su and Sv are regarded as the buoyancy source term, shown in Equations (4) and (5). A is defined as a porosity function based on Kozeny’s equation, written in Equation (6).
where Amush is the mushy zone constant to control the damping amplitude, and ξ is a small constant number to avoid division by zero. In this paper, Amush and ξ are 107 and 10−3, respectively. f represents the liquid fraction, which is expressed in Equation (7).
Energy equations:
in which the source item Sh is expressed in Equation (9) and the latent enthalpy ΔH is shown in Equation (10).
3.2. Initial and Boundary Conditions
The initial temperature of paraffin is equal to the ambient temperature. The heating wall is heated from ambient temperature to 80 °C using an electric heating plate. A K-type thermocouple is used to monitor the heating plate temperature. Based on the monitor result, the variation of heating temperature can be expressed by a parabola curve before t = 360 s. After 360 s, the heating temperature is regarded as 80 °C. The equations are shown in Equation (11).
Therefore, a user defined function (UDF) is developed in order to load the heat boundary condition on the specimen. Other boundaries are adiabatic and there were no moving boundaries on all walls. The initial and boundary conditions are described in Table 2.
3.3. Numerical Procedure
In the present study, the numerical analysis is performed using a commercially available computational fluid dynamics (CFD) program, Fluent 14.5 [23]. A two-dimensional and transient model is built to simulate the melting process of paraffin in the container. The Second-Order Implicit Method for Pressure-Linked Equations (SIMPLE) is employed for the pressure-velocity coupling field. The discretization method for pressure uses the Pressure Staggering Option (PRESTO) scheme, which is advisable for calculating the natural convection.
The grids are uniformly structured with quadrilateral cells. Then, grids consisting of 3000, 6000 and 10,000 grids are all tested for the liquid fraction, and relative errors are calculated in Equation (11) [24]. Figure 6 shows the numerical results and relative errors of vertical heating.
in which fn is the liquid fraction of measurement value, which is the data at 3000 and 6000 grids. fstd is the standard value, which is the data at 10,000 grids. It is concluded that the differences of liquid fraction at 6000 and 10,000 grids are less than 2%, while the result at 3000 grids has larger relative error.
Besides, the effect of time step size is examined by considering time step sizes of 1 s, 2 s and 4 s with the grid number of 6000. Figure 7 shows the numerical results and relative errors with these time steps. It is depicted that the differences of liquid fraction between 2 s and 1 s are less than 0.1%, while relative error of 4 s is less than 0.5%. Therefore, a grid of 6000 and a time step of 2 s are appropriate for the numerical calculation to balance the accuracy of results and the computational time.
4. Results and Discussions
4.1. Model Validation
The melting processes of paraffin are investigated by experiments and numerical simulations. The rectangular enclosure is placed at different angles (0°, 30°, 60°, 90°, 120°, 150° and 180°). Firstly, the shapes of solid liquid interfaces at three selected times (30 min, 60 min and 90 min) are compared by simulation. Table 3 shows the numerical results of solid liquid interfaces with different inclination angles at these selected times.
In Table 3, it can be found that the solid liquid interfaces begin to curve at 30 min, because the natural convection starts to play a dominant role from this time. However, the bending degree is very small at each inclination angle to compare with the experimental result. At 90 min, the paraffin is almost completely melted at 0° and 30°, which cannot be well compared. In addition, at 60 min, natural convection plays the dominant role of heat transfer. At this time, the characteristics of solid liquid interface with each inclination angle can be clearly observed, so that the 60 min after the start of heating is selected to compare shapes of solid liquid interfaces between the numerical results and the experimental result.
Table 4 shows both numerical results of liquid fraction and pictures of solid liquid interface location taken by the camera at 60 min at different inclination angles. It can be found that the shapes of the solid liquid interfaces are different when the inclination angle varies. At 0° and 30°, the solid liquid interfaces are wavy, because there are several Bénard convection cells inside the specimen. At 60 to 150°, the shapes of solid liquid interfaces are similar, because there is only one natural heat flow cycle inside the specimen. However, because of the different inclination angles, the natural convection has different effects on the melting process. At 180°, the solid liquid interface is almost parallel because the paraffin melting downward needs to overcome the effect of buoyancy in the opposite direction and there is no lateral velocity inside the specimen. In Table 4, it can be found that the numerical solid liquid interface agree well with the solid liquid interface locations in experimental photos.
Furthermore, the model is validated with temperature variations at 90°. The temperature variations of all five monitoring points inside the specimen are compared with numerical and experimental results. Figure 8 shows the comparison results for the case with 90° inclination angle, in which 1–5 refer to numerical results and (1)–(5) refer to experimental data. It is obvious that each monitoring point predicted in the simulation shows a good agreement with the experiment. Besides, the experimental data have a certain delay, which is because of the influence of contact thermal resistance.
4.2. Influence of Inclination Angle on Melting Process
Figure 9a visualizes the liquid fraction of the melting process when the paraffin is heated from the bottom (α = 0°). The solid liquid interface is almost flat during the early stage of melting because the dominant mode of heat transfer is heat conduction. As time goes on, the shape of the solid liquid interface becomes wavy because of Bénard convection cells formed by the combination of buoyancy and gravity inside the liquid paraffin [25]. During the melting process, hot liquid paraffin rises away from the heating wall vertically along the central area of the cell under the action of buoyancy. After reaching the solid liquid interface, the solid paraffin is melted and fell along the cell edge under the action of gravity. It is noted that the mean diameter of the cells increases so that the number of cells per unit area decreases as the melting time increased. Figure 9b shows the temperature variations of monitoring points. Owing to the effect of the Bénard convection cells, the temperature of each monitoring point is almost the same after the paraffin is completely melted.
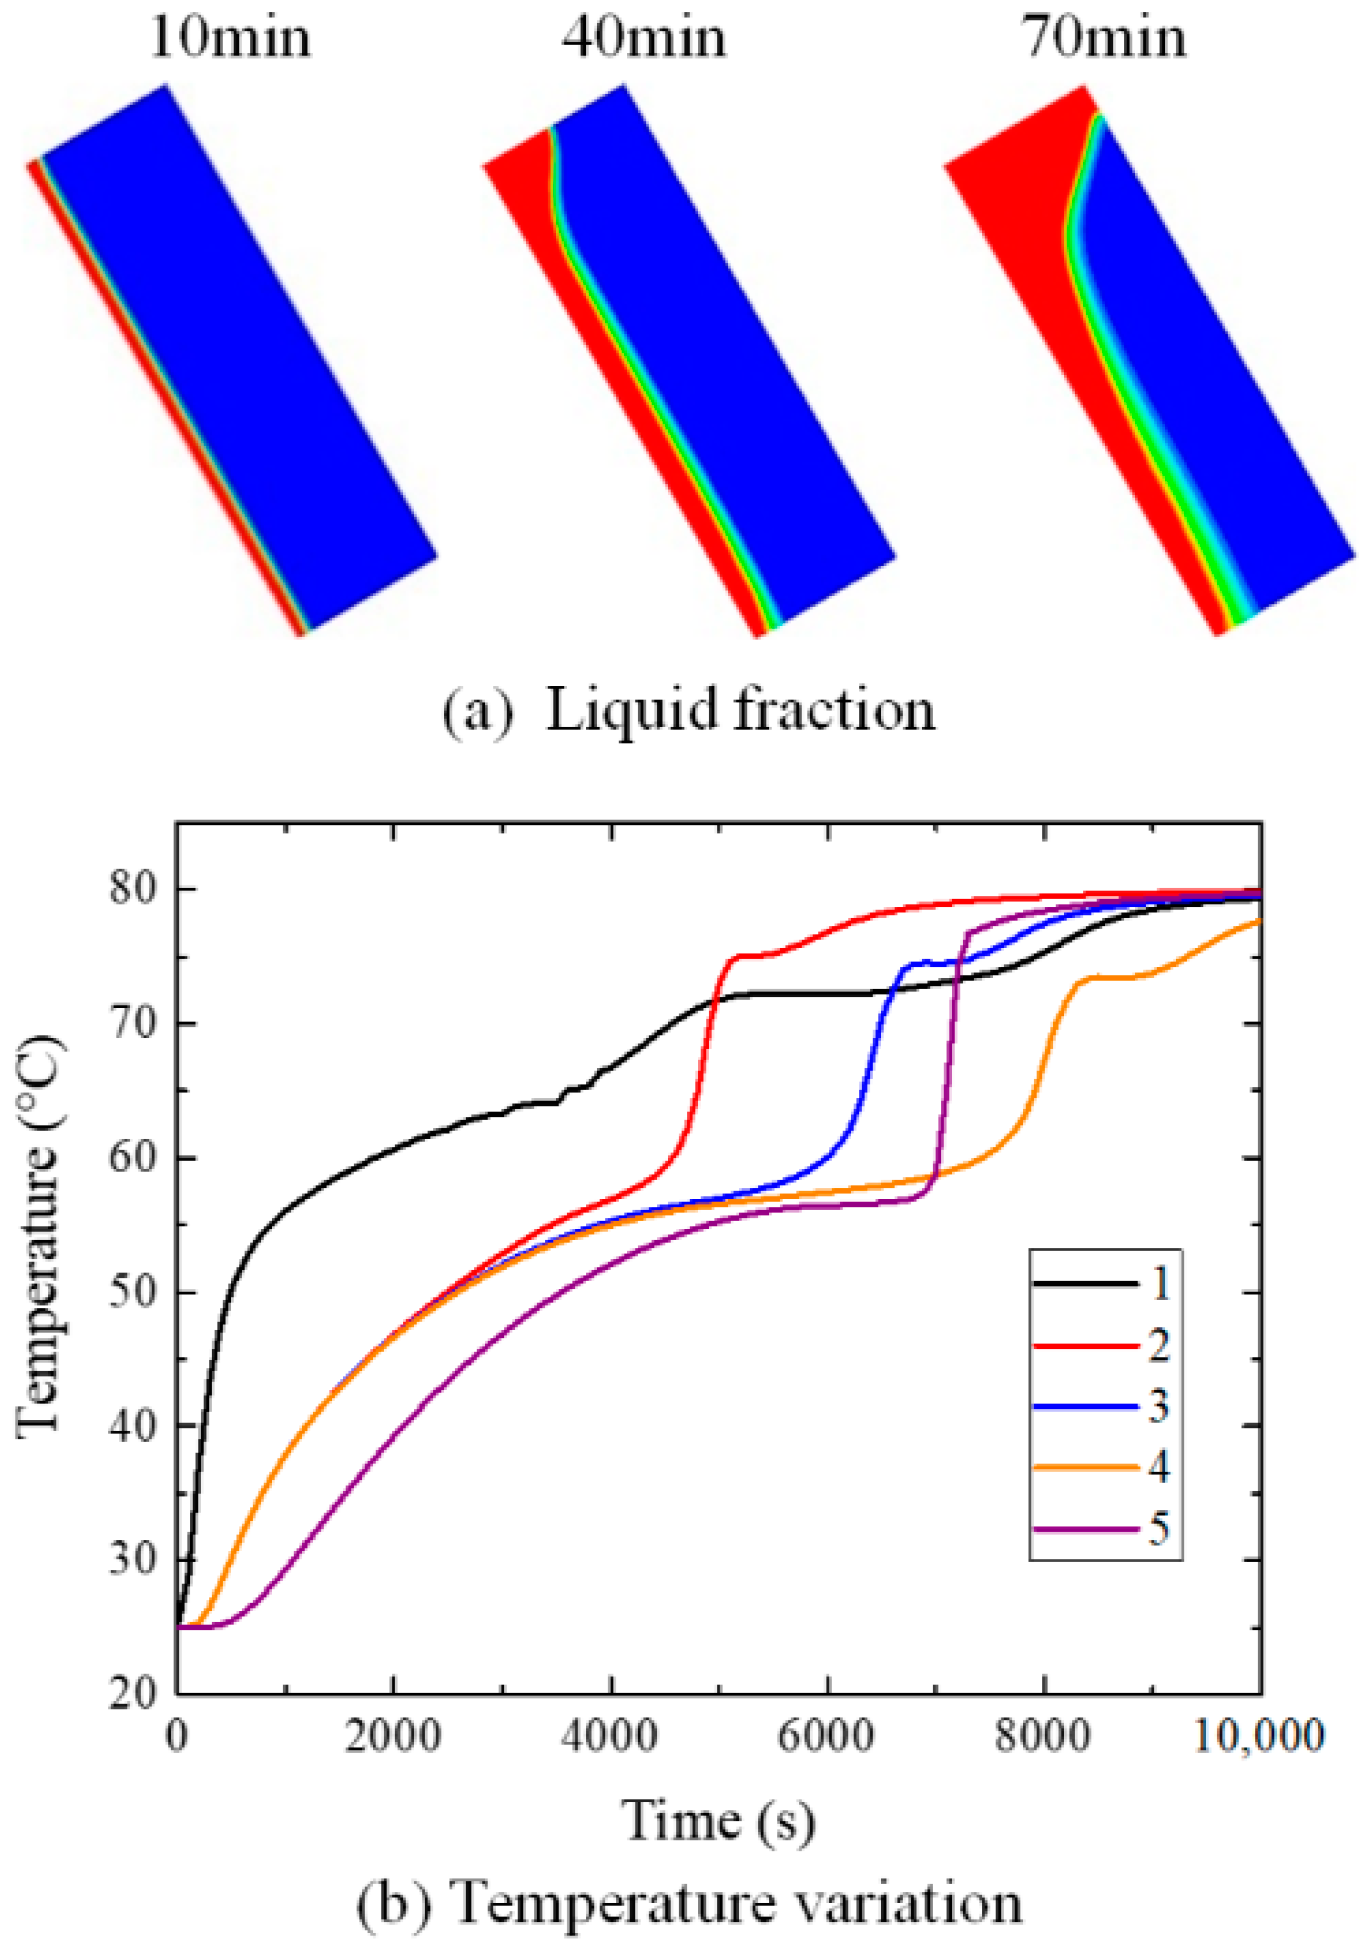
Figure 10 and Figure 11 visualize the liquid fraction of the melting process and the temperature variation of monitoring points when the inclination angles are 30° and 60°, respectively. In the initial period of melting, the temperature variations are almost the same as the inclination angle was 0° at both angles. This is because the heat conduction is the dominant mode of heat transfer in this period of time. Furthermore, in Figure 10a, the paraffin with a higher position melts faster because of the effect of natural convection. Further, there are also Bénard convection cells inside the paraffin during the melting process. Besides, Figure 10b refers to the temperature histories of monitoring points inside the specimen. During the melting procedure, T1 increases sharply after 2000 s, and the temperatures of T2, T3 and T4 are almost the same until the paraffin is completely melted in these monitoring points. This is because of the influence of the Bénard convection cells. The temperature of T5 increases slowly in the phase change region (approximately between 4000 s and 6000 s), because T5 is far away from the heating wall and is heated much slower. In Figure 11a, the solid liquid interface becomes smoother. The melting rate on the top is much faster than that on the bottom, and Bénard convection cells no longer exist in the specimen. In Figure 11b, it is found that the temperature variations of all thermocouples are hierarchical. In the phase change region, T1 has an increase because of the influence of the nature convection. Compared with T1 at 30 °C, T1 at 60 °C increases much slower. Besides, the shapes of T2, T3 and T4 curves are very similar, and T2, T3 and T4 increase to 75.0 °C, 74.5 °C and 73.5 °C after melting, respectively. At 7000 s, T5 jumps to 76.7 °C, which is only lower than T2 because of its location.
Figure 12 visualizes the melting process at 90°. In Figure 12a, the trends of temperature variation and liquid fraction are very similar to the melting process of paraffin at 60°. The hot liquid paraffin near the heating wall rises up vertically because of the force of the buoyancy with no velocity component in the x-direction. It leads to a higher temperature on the top than the temperature on the bottom. However, as the buoyancy hinders the liquid paraffin from flowing downward, the liquid paraffin flows transversely. When the liquid paraffin arrives at the solid liquid interface, it melts the solid paraffin near the solid liquid interface. Then, the liquid paraffin flows down along the solid liquid interface to the bottom. Therefore, a natural heat flow cycle is formed. In Figure 12b, the temperature variations of all motoring points are similar to that in Figure 11b. The only difference is that the temperatures of T2, T3, and T4 are approximately the same because they have the same ordinate.
Figure 13 and Figure 14 visualize the liquid fraction of the melting process and the temperature variation of monitoring points when the inclination angles are 120° and 150°, respectively. For these inclination angles, the bending degrees of the solid liquid interface are smaller than that in the vertical container, which are shown in Figure 13a and Figure 14a. There is also only one natural heat flow cycle inside the liquid paraffin. Furthermore, the melting rate of paraffin at 150° is much slower. This is because the heat flow of gravity direction component is inhibited by buoyancy. In Figure 13b, the temperature variation of T1 is the same as that in Figure 12b, because the heat conduction plays the dominate role at this monitoring point. The temperature variations of T2, T3, T4 and T5 stay longer in the phase change region in Figure 13b, and the slopes of these temperature curves are smaller than those at 90°. In Figure 14b, the range of temperature constant area is further expanded. The effect of natural convection is gradually decreasing. It can be seen that the paraffin at monitoring points 4 and 5 do not melt in 10,000 s.
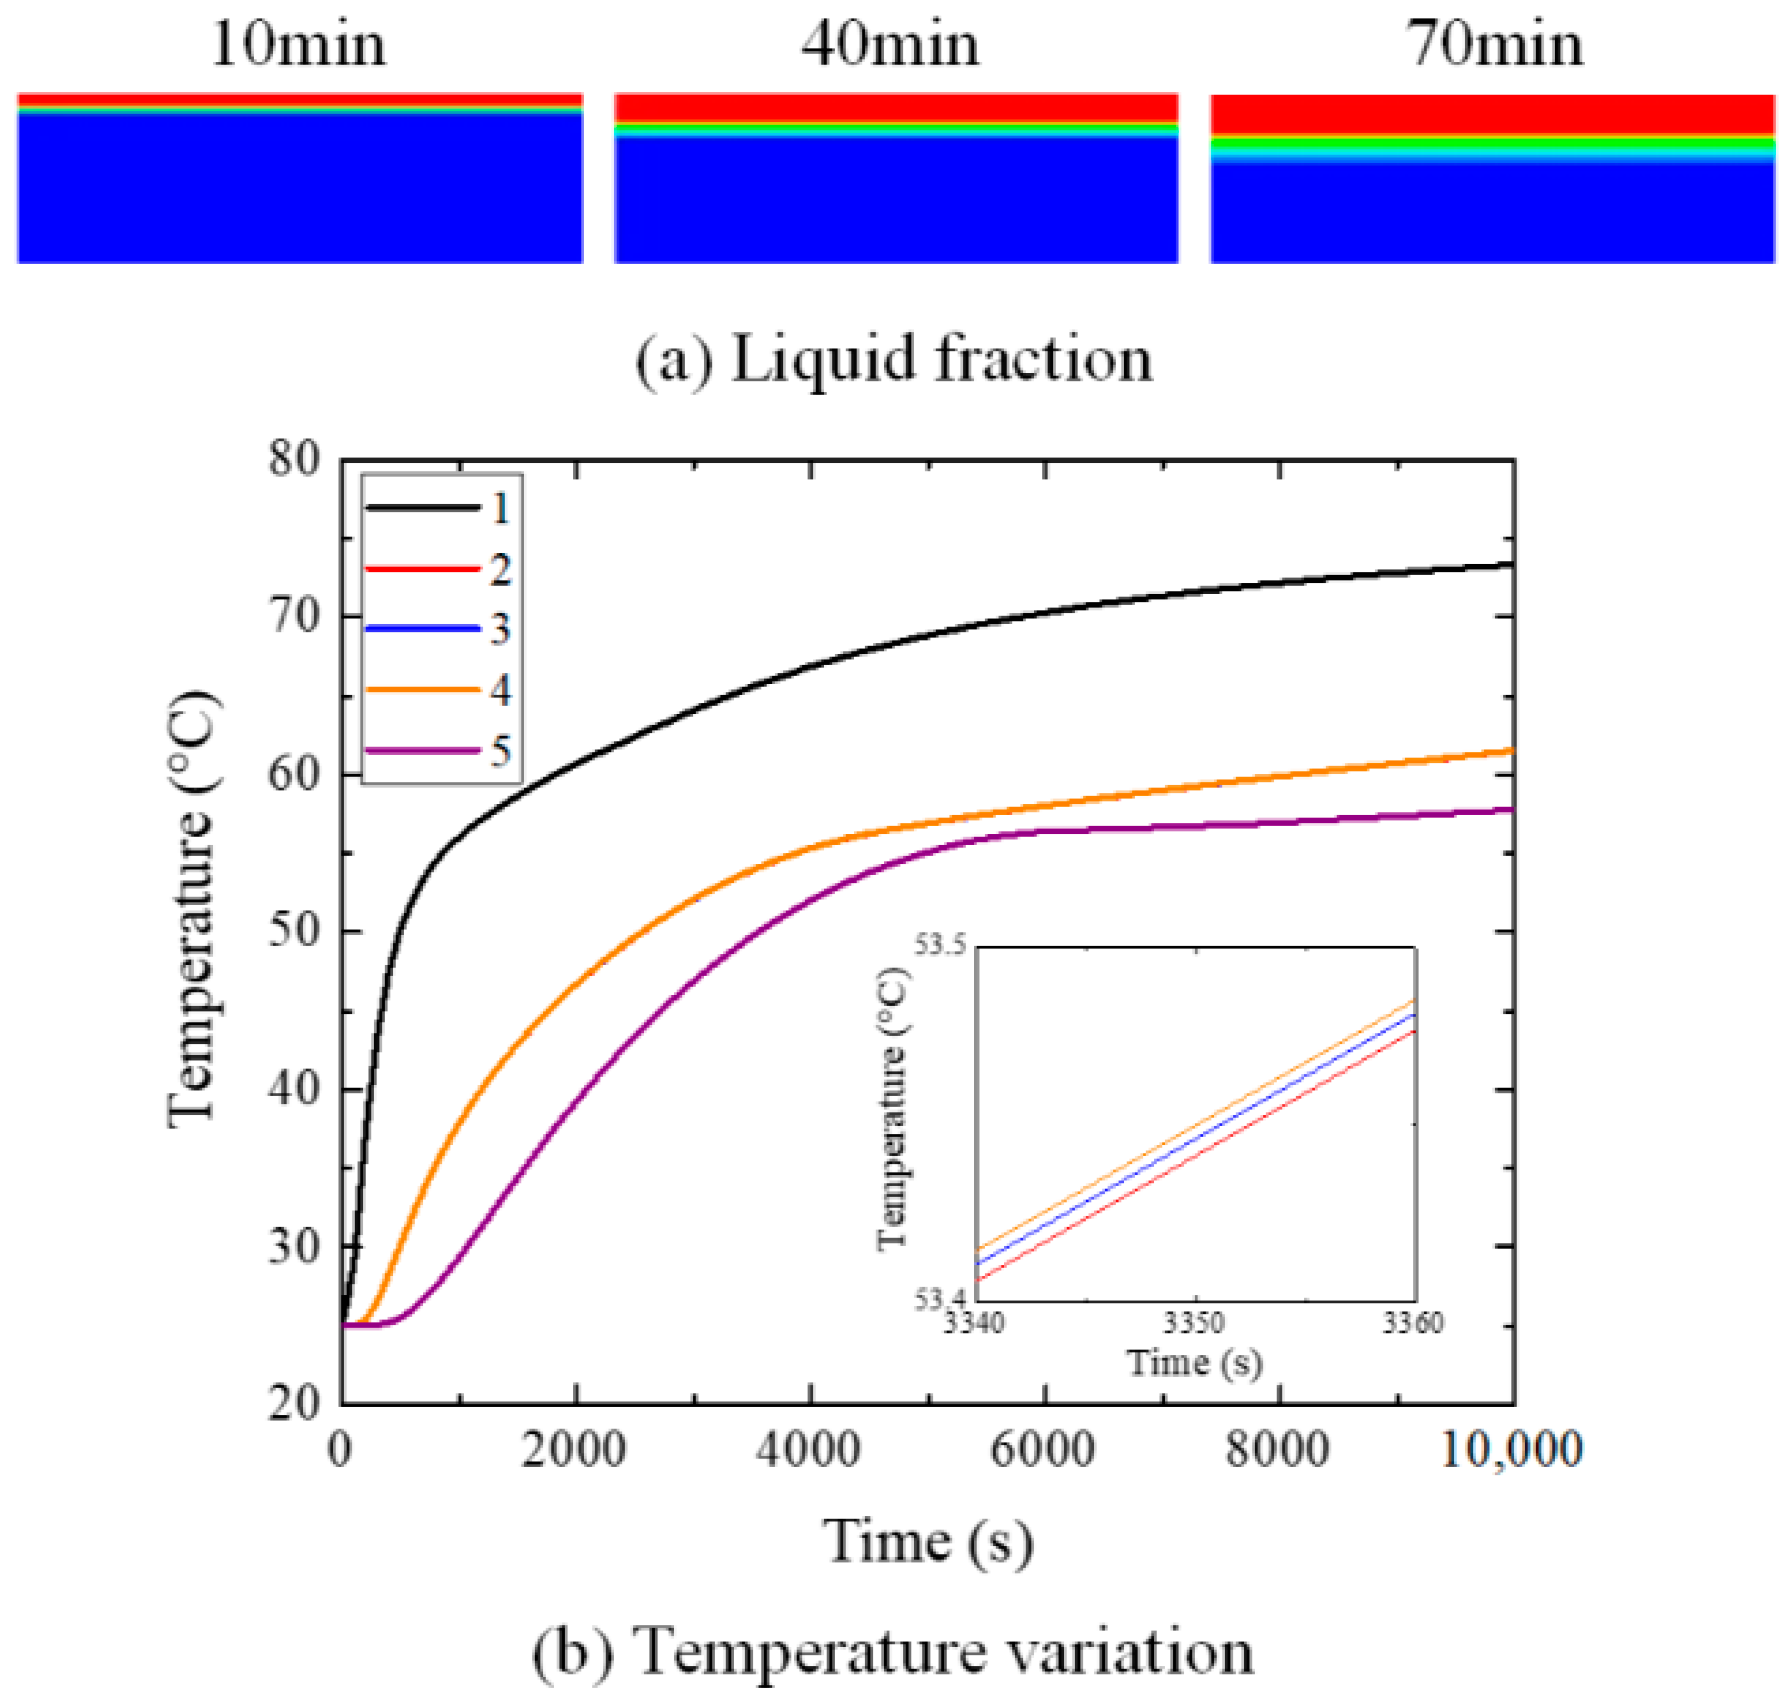
Figure 15 visualizes the melting process of paraffin with top horizontal heating (α = 180°). In Figure 15a, the part of fully melted paraffin is growing very slowly. Because buoyancy drives the hot liquid paraffin moving upward, the paraffin melting downward needs to overcome the effect of buoyancy in the opposite direction. In Figure 15b, it can be depicted that temperature on the top of the liquid paraffin is higher than that on the bottom. Besides, the temperatures of monitoring points (2, 3 and 4) are almost the same. Therefore, in the design of steady-state method, the heat source is always at the top of the specimen to overcome the effect of buoyancy.
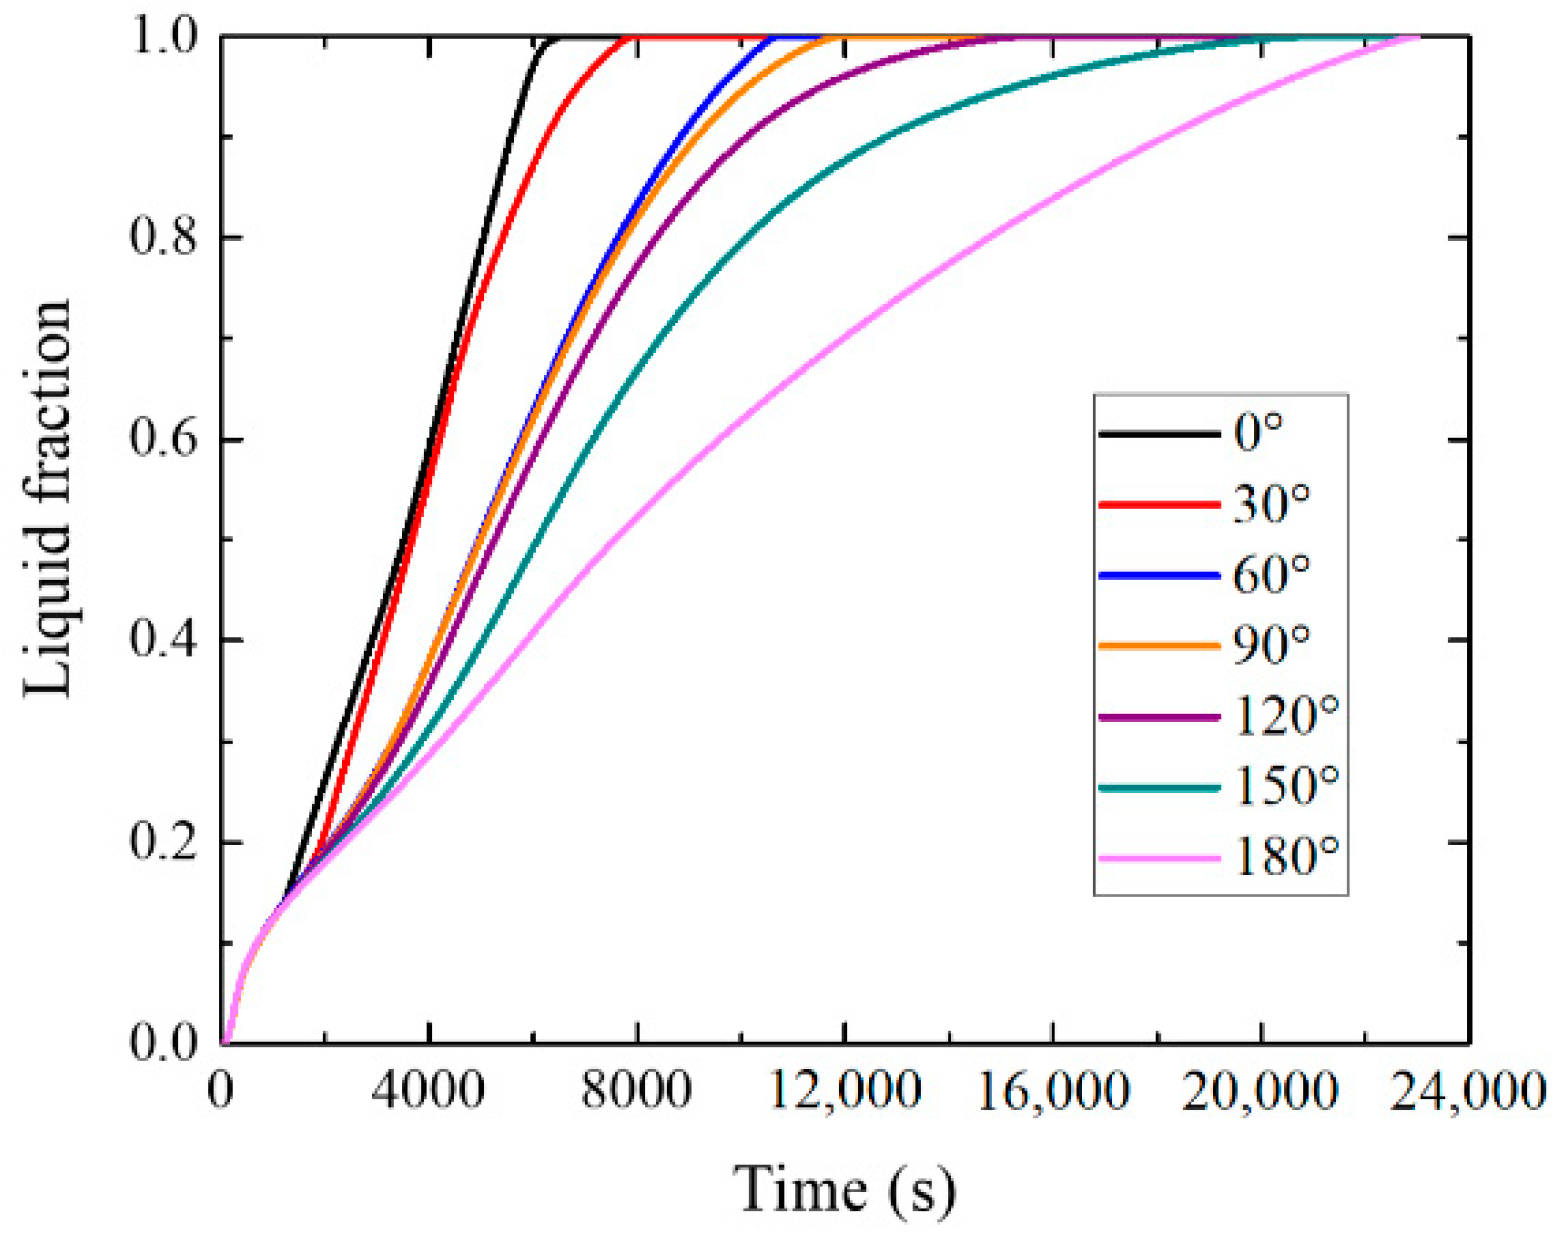
Figure 16 depicts the curves of liquid fraction varying with time at different angles. In the initial heating stage (about 2000 s), the liquid fractions of all inclination angles are approximately the same. This is because the heat conduction is the domain heat transfer mode during this period. After that, the convective heat transfer begins to dominate the melting process. Compared with the melting process of other inclination angles, the melting rate at 0° is the fastest and the speed of melting at 180° is the lowest.
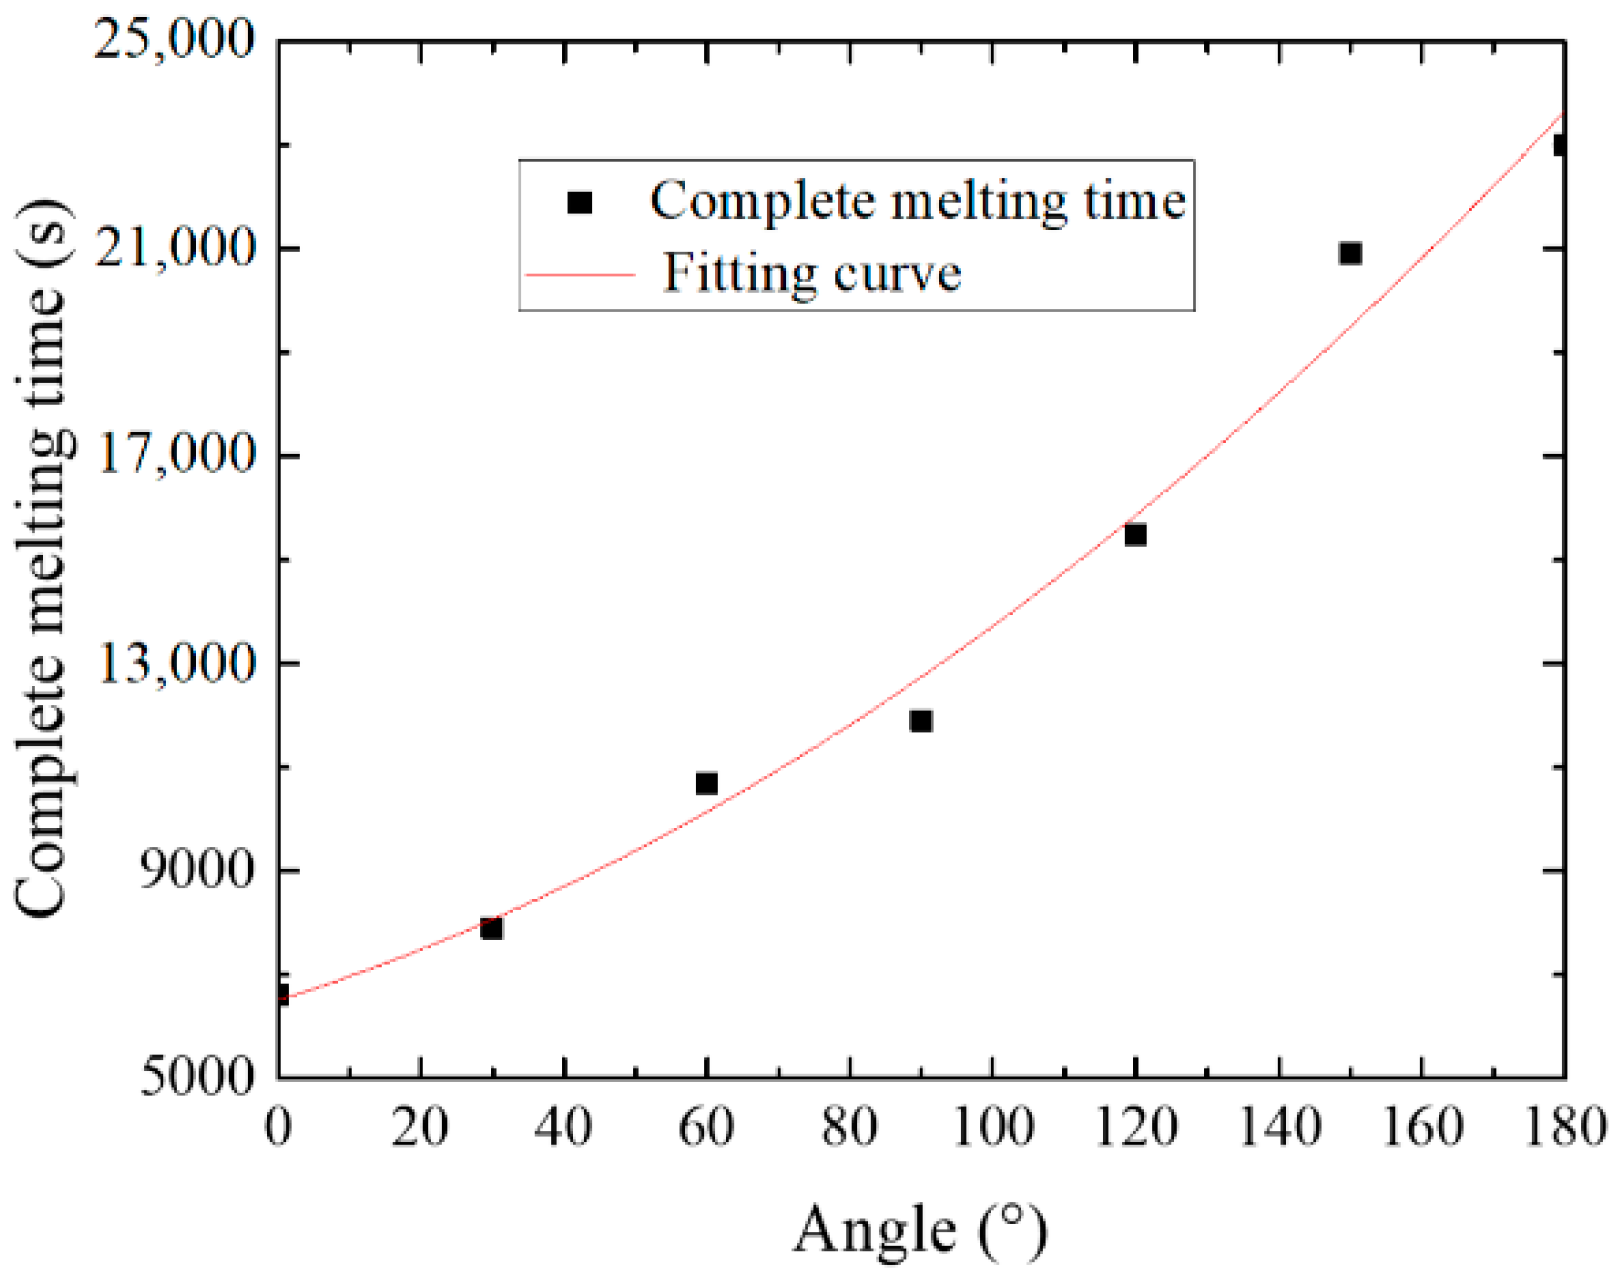
Figure 17 shows the relationship between the complete melting time and the inclination angles. By means of observing the liquid fraction curves at different inclination angles, it can be concluded that the melting rates of paraffin are non-linearly decreased with the increase of angle, which is expressed in Equation (13). Based on this relationship, the inclination angle can be selected according to the actual technical requirements of temperature control system.
In addition, in the practical situation, the inclination angles have a significant effect on the heat dissipation produced by the SEM, and also affect the temperature control effect. Based on the analysis before, the inclination angles of 0° and 30° are more suitable for absorbing the heat generated from the SEM. At the same time, these two inclination angles can make the SEM maintain stable operation for a period of time even if there is a high temperature outside, which is dependent on the numerical results of 150° and 180°. However, the inclination angles of 60°, 90° and 120° may make a non-uniform temperature distribution on the surface of the SEM after a period of time. If the SEM needs to be mounted at these inclination angles, the geometry of the container needs to be improved to avoid this non-uniformity.
5. Conclusions
In practical applications, the PCMs are widely used in the field of temperature control. Because the device, which needs temperature control, may have a certain angle with gravity, it is necessary to study the melting process of PCMs at different inclination angles. In this study, numerical investigations are conducted to discuss the melting heat transfer characteristics of paraffin at different inclination angles. The angles include 0°, 30°, 60°, 90°, 120°, 150° and 180°. Experiments are carried out to verify the simulation. During the melting process for all angles, the heat conduction is the dominant heat transfer method at the initial stage of melting, then natural convection is taken into consideration. At 0° and 30°, there are several Bénard convective cells that make the heat transfer rate in the specimen faster. At 60°, 90°, 120° and 150°, the Bénard convective cells disappear so the solid liquid interface of each inclination angle becomes smooth. At 180°, the melting rate is the slowest. However, the temperature distribution is almost horizontal, so this angle is widely used in the design of steady-state methods. In addition, the non-linear relationship between the complete melting time and the inclination angles is concluded as f = 0.29α2 + 43.33α + 6511.90. Based on this relationship, the melting time of each inclination angle can be predicted in the practical application, then a suitable inclination angle can be selected in order to meet the requirements of the temperature control system. Moreover, this paper also mentions that the geometry of the container needs to be improved to avoid the non-uniform temperature distribution on the surface of the SEM if the inclination angles are from 60 to 120°.
Author Contributions
Conceptualization and Methodology, Y.W. and J.D.; Project Administration and Funding Acquisition, J.D.; Investigation, D.A.; Software, Validation, Formal Analysis, and Writing-Original Draft Preparation, Y.W.; Writing-Review & Editing, Y.W. and J.D.
Funding
This research was funded by National Technical Basic Research Program of China (Grant No. JSZL2015603B002).
Conflicts of Interest
The authors declare no conflict of interest.
References
- Sharma, A.; Tyagi, V.V.; Chen, C.R.; Buddhi, D. Review on thermal energy storage with phase change materials and applications. Renew. Sustain. Energy Rev. 2009, 13, 318–345. [Google Scholar] [CrossRef]
- Zheng, L.; Zhang, W.; Liang, F.; Lin, S.; Jin, X.Y. Experimental studies of phase change and microencapsulated phase change materials in a cold storage/transportation system with solar driven cooling cycle. Energies 2017, 10, 1867. [Google Scholar] [CrossRef]
- Mahavar, S.; Sengar, N.; Rajawat, P.; Verma, M.; Dashora, P. Design development and performance studies of a novel single family solar cooker. Renew. Energy 2012, 47, 67–76. [Google Scholar] [CrossRef]
- Yin, H.; Gao, X.; Ding, J. Thermal management of electronic components with thermal adaptation composite material. Appl. Energy 2010, 87, 3784–3791. [Google Scholar] [CrossRef]
- Hasan, A.; Hejase, H.; Abdelbaqi, S.; Assi, A.; Hamdan, M.O. Comparative effectiveness of different phase change materials to improve cooling performance of heat sinks for electronic devices. Appl. Sci. 2016, 6, 226. [Google Scholar] [CrossRef]
- Sqanson, T.D.; Birur, G.C. NASA thermal control technologies for robotic spacecraft. Appl. Therm. Eng. 2003, 23, 1055–1065. [Google Scholar] [CrossRef] [Green Version]
- Bamonte, P.; Caverzan, A.; Kalaba, N.; Lamperti Tornaghi, M. Lightweight concrete containing phase change materials (PCMs): A numerical investigation on the thermal behavior of cladding panels. Buildings 2017, 7, 35. [Google Scholar] [CrossRef]
- Zhang, Q.N.; Huo, Y.T.; Rao, Z.H. Numerical study on solid-liquid phase change in paraffin as phase change material for battery thermal management. Sci. Bull. 2016, 61, 391–400. [Google Scholar] [CrossRef]
- Sankar, M.; Do, Y. Numerical simulation of free convection heat transfer in a vertical annular cavity with discrete heating. Int. Commun. Heat Mass. 2010, 37, 600–606. [Google Scholar] [CrossRef]
- Bohoosh, R.; Mohamadi, F.; Karimi, M. Numerical investigation of natural convection in a square cavity with tilting walls. J. Thermophys. Heat Transf. 2015, 29, 725–731. [Google Scholar] [CrossRef]
- Akgun, M.; Aydm, O.; Kaygusuz, K. Thermal energy storage performance of paraffin in a novel tube-in-shell system. Appl. Therm. Eng. 2008, 28, 405–413. [Google Scholar] [CrossRef]
- Li, S.W.; Chen, Y.; Sun, Z.Q. Numerical simulation and optimization of melting process of phase change material inside horizontal annulus. Energies 2017, 10, 1249. [Google Scholar]
- Hale, N.W.; Viskanta, R. Solid liquid phase change heat transfer and interface motion in materials cooled or heated form above or below. Int. J. Heat Mass Transf. 1980, 23, 283–292. [Google Scholar] [CrossRef]
- Ho, C.J.; Viskanta, R. Heat Transfer During Melting from an Isothermal Vertical Wall. J. Heat Mass Transf. 1984, 106, 12–19. [Google Scholar] [CrossRef]
- Pal, D.; Joshi, Y.K. Melting in a side heated tall enclosure by a uniformly dissipating heat source. Int. J. Heat Mass Transf. 2001, 44, 375–387. [Google Scholar] [CrossRef]
- Shokouhand, H.; Kamkari, B. Experimental investigation on melting heat transfer characteristics of lauric acid in a rectangular thermal storage unit. Exp. Therm. Fluid Sci. 2013, 50, 201–212. [Google Scholar] [CrossRef]
- Wang, C.H.; Lin, T.; Li, N.; Zheng, H.P. Heat transfer enhancement of phase change composite material: Copper foam/paraffin. Renew. Energy 2016, 96, 960–965. [Google Scholar] [CrossRef]
- Webb, B.W.; Viskanta, R. Natural convection dominated melting heat transfer in an inclined rectangular enclosure. Int. J. Heat Mass Transf. 1986, 29, 183–192. [Google Scholar] [CrossRef]
- Akgun, M.; Kaygusuz, K. Experimental study on melting/solidification characteristics of a paraffin as PCM. Energy Convers. Manag. 2007, 48, 669–678. [Google Scholar] [CrossRef]
- Chen, Z.Q.; Gu, M.W.; Peng, D.H. Heat transfer performance analysis of a solar flat-plate collector with an integrated metal foam porous structure filled with paraffin. Appl. Therm. Eng. 2010, 30, 1967–1973. [Google Scholar] [CrossRef]
- Libeer, W.; Romos, F.; Newton, C.; Alipanahrostami, M.; Depcik, C.; Li, X.L. Two-phase heat and mass transfer of phase change materials in thermal management systems. Int. J. Heat Mass Transf. 2016, 100, 215–223. [Google Scholar] [CrossRef]
- Wang, Y.; Xiao, P.; Dai, J.M. Design and construction of a new steady-state apparatus for medium thermal conductivity measurement at high temperature. Rev. Sci. Instrum. 2017, 88, 104903. [Google Scholar] [CrossRef] [PubMed]
- Zhang, P.; Meng, Z.N.; Zhu, H.; Wang, Y.L.; Peng, S.P. Melting heat transfer characteristics of a composite phase change material fabricated by paraffin and metal foam. Appl. Energy 2017, 185, 1971–1983. [Google Scholar] [CrossRef]
- Diaz, L.A.; Viskanta, R. Visualization of the solid-liquid interface morphology formed by natural convection during melting of a solid from below. Int. Commun. Heat Mass. 1984, 11, 35–43. [Google Scholar] [CrossRef]
- Yang, J.L.; Yang, L.J.; Xu, C.; Du, X.Z. Numerical analysis on thermal behavior of solid-liquid phase change within copper foam with varying porosity. Int J. Heat Mass Transf. 2015, 84, 1008–1018. [Google Scholar] [CrossRef]
Figure 1.
The structure of the specimen container.

Figure 2.
Physical model.
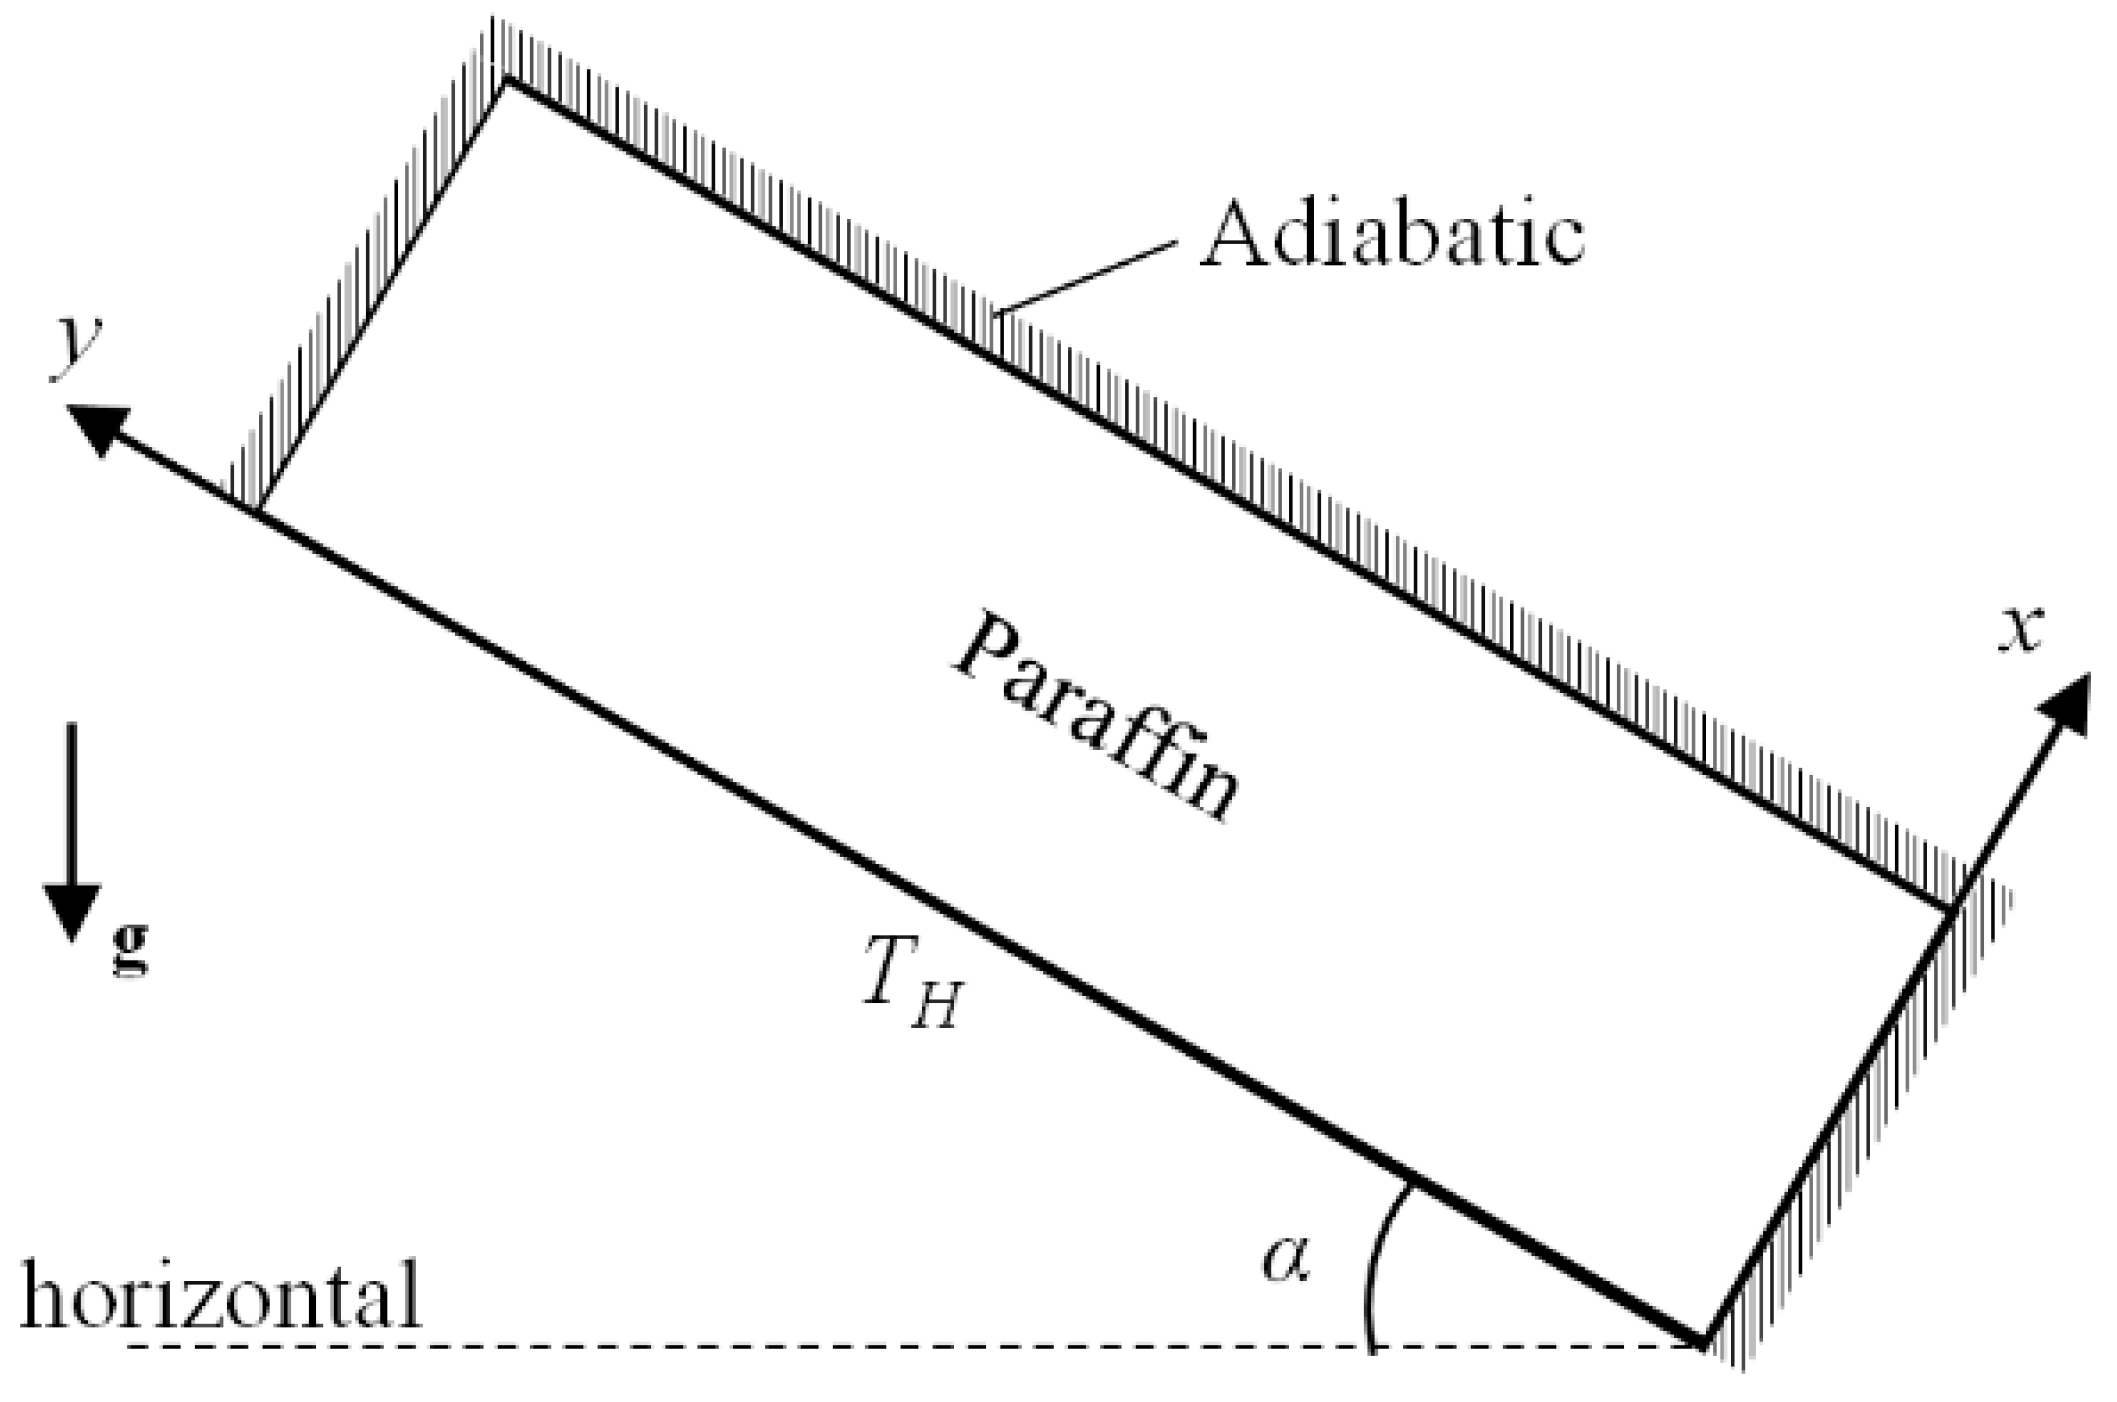
Figure 3.
The schematic of the experimental apparatus.
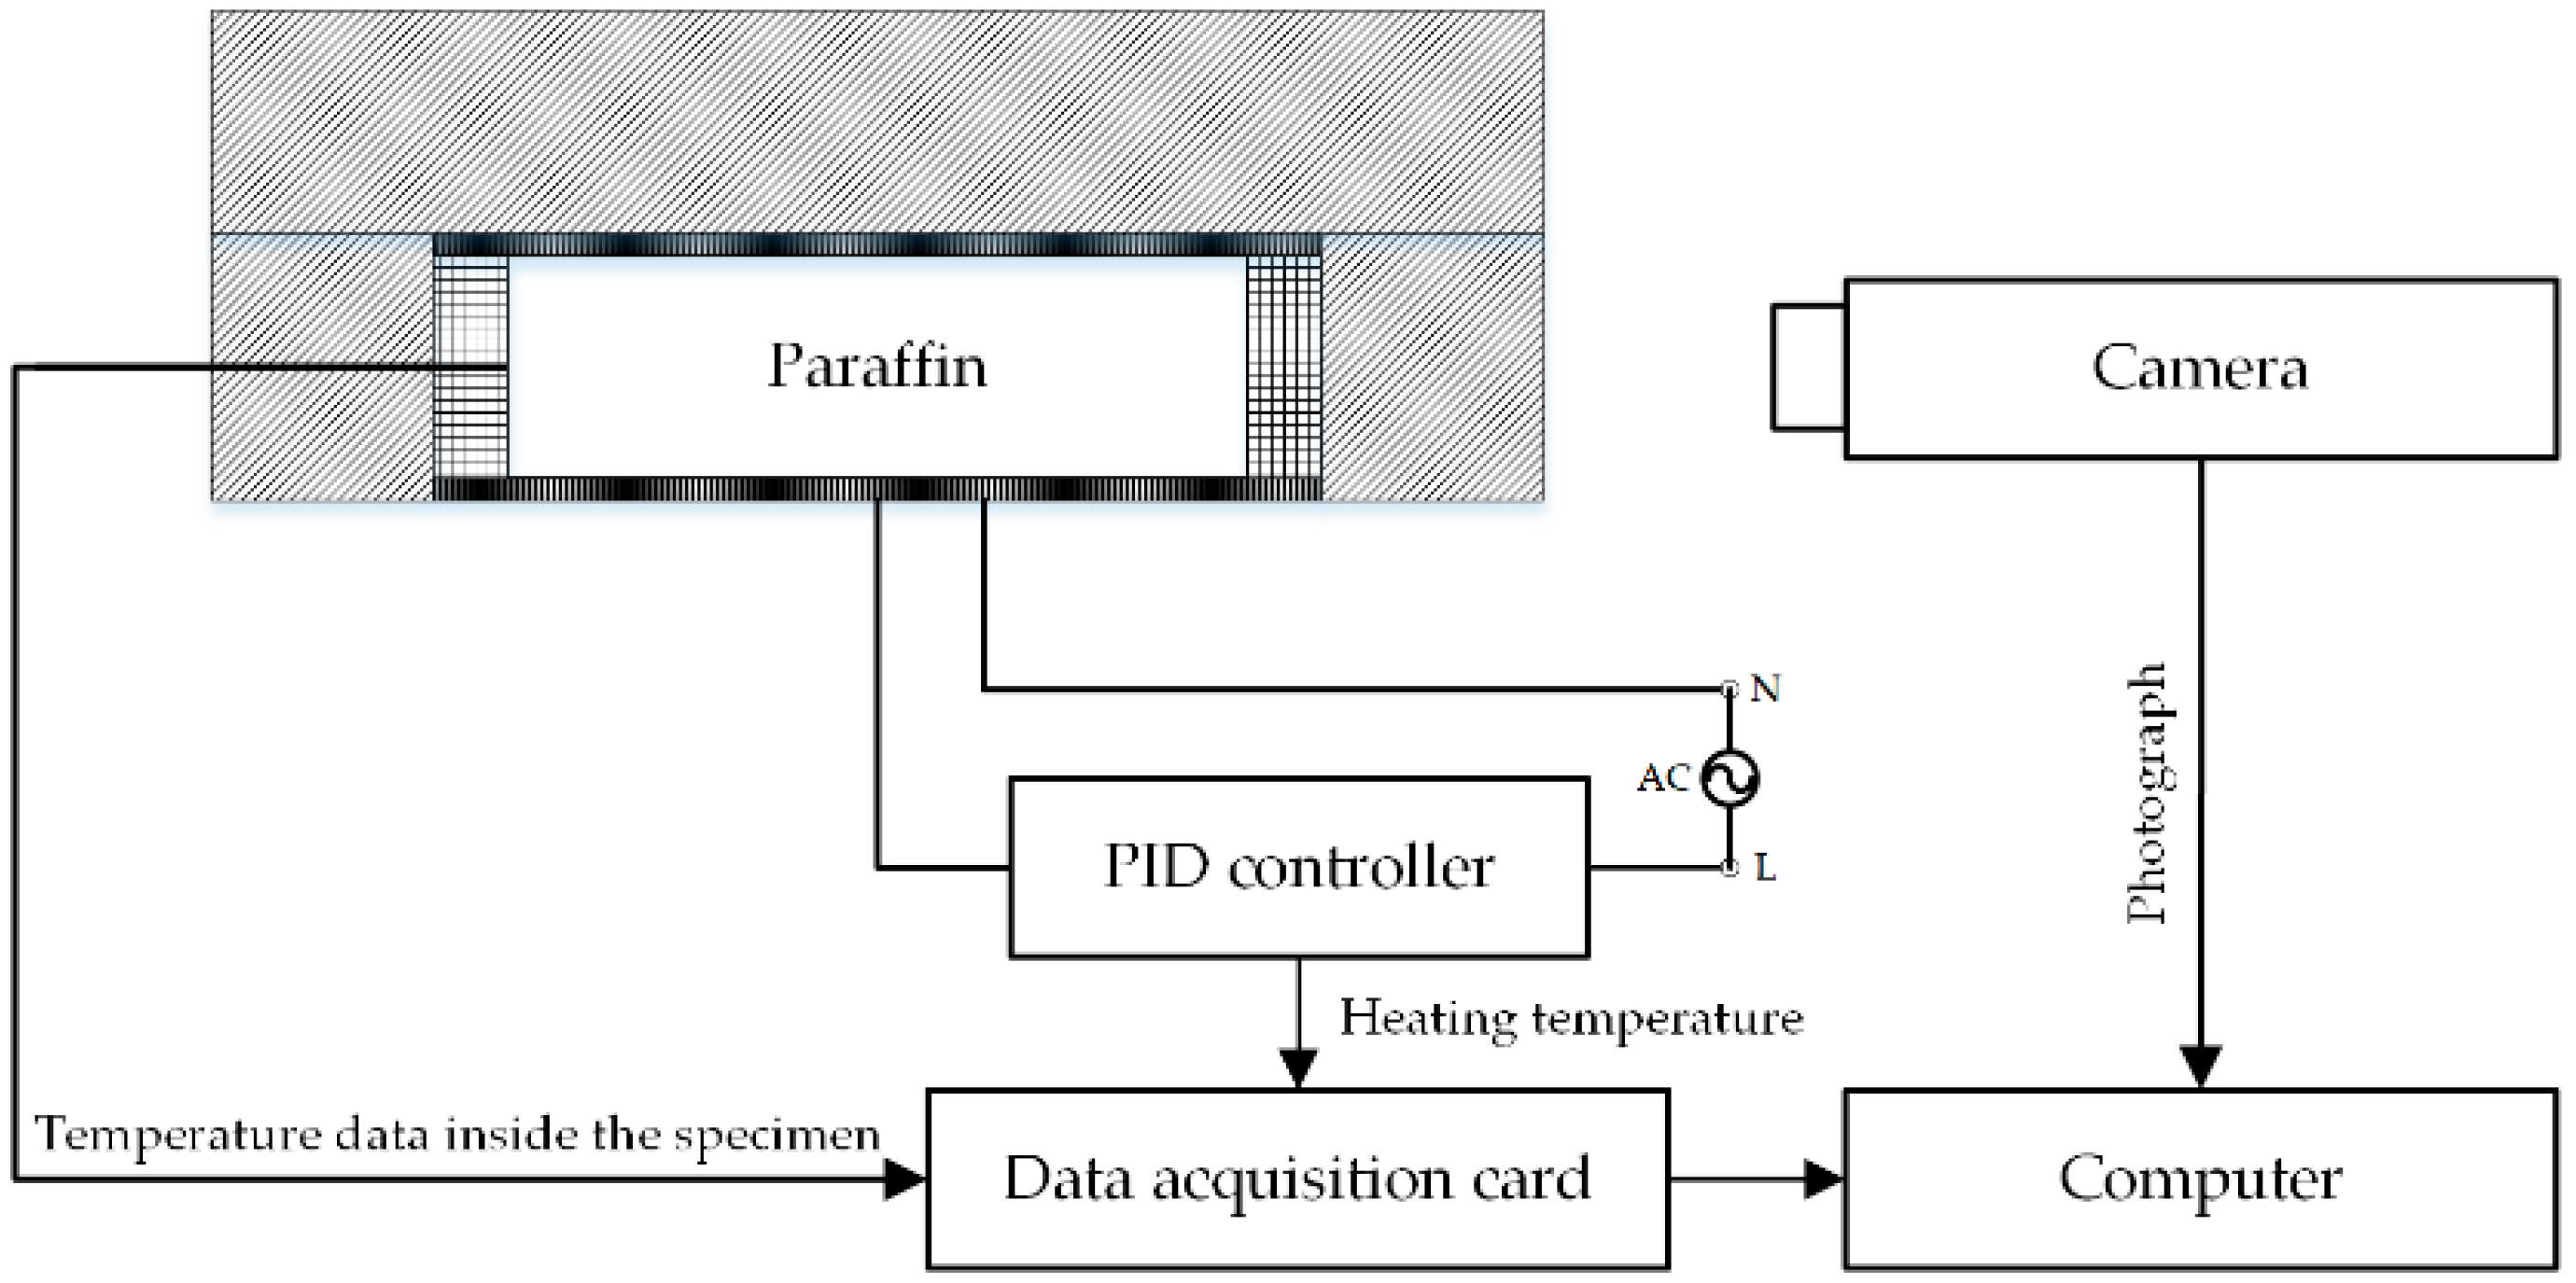
Figure 4.
The location of thermocouples inside the specimen.
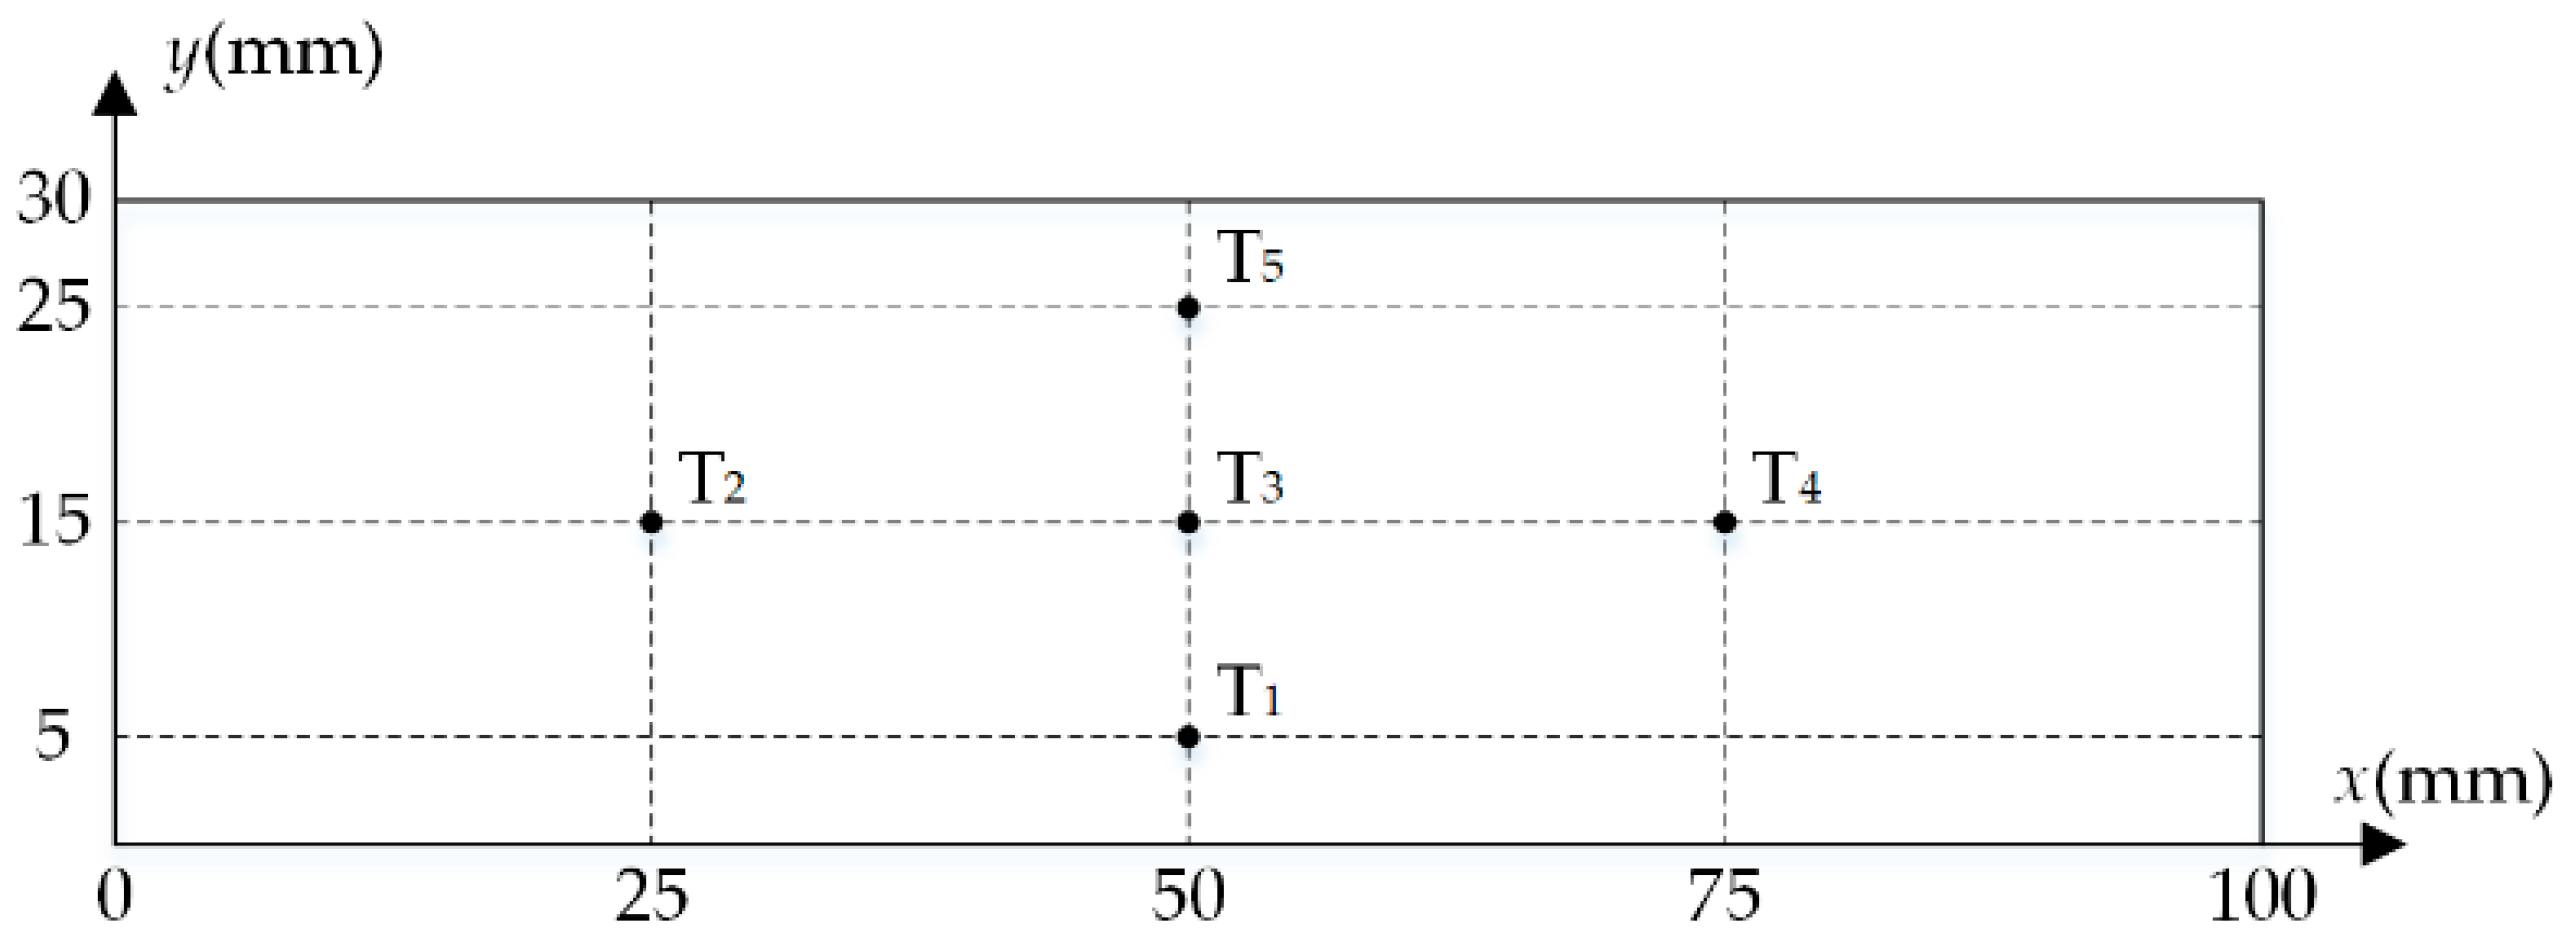
Figure 5.
The flowchart of experimental procedure.

Figure 6.
Results of grid-independent analysis.

Figure 7.
Results of time step independent analysis.
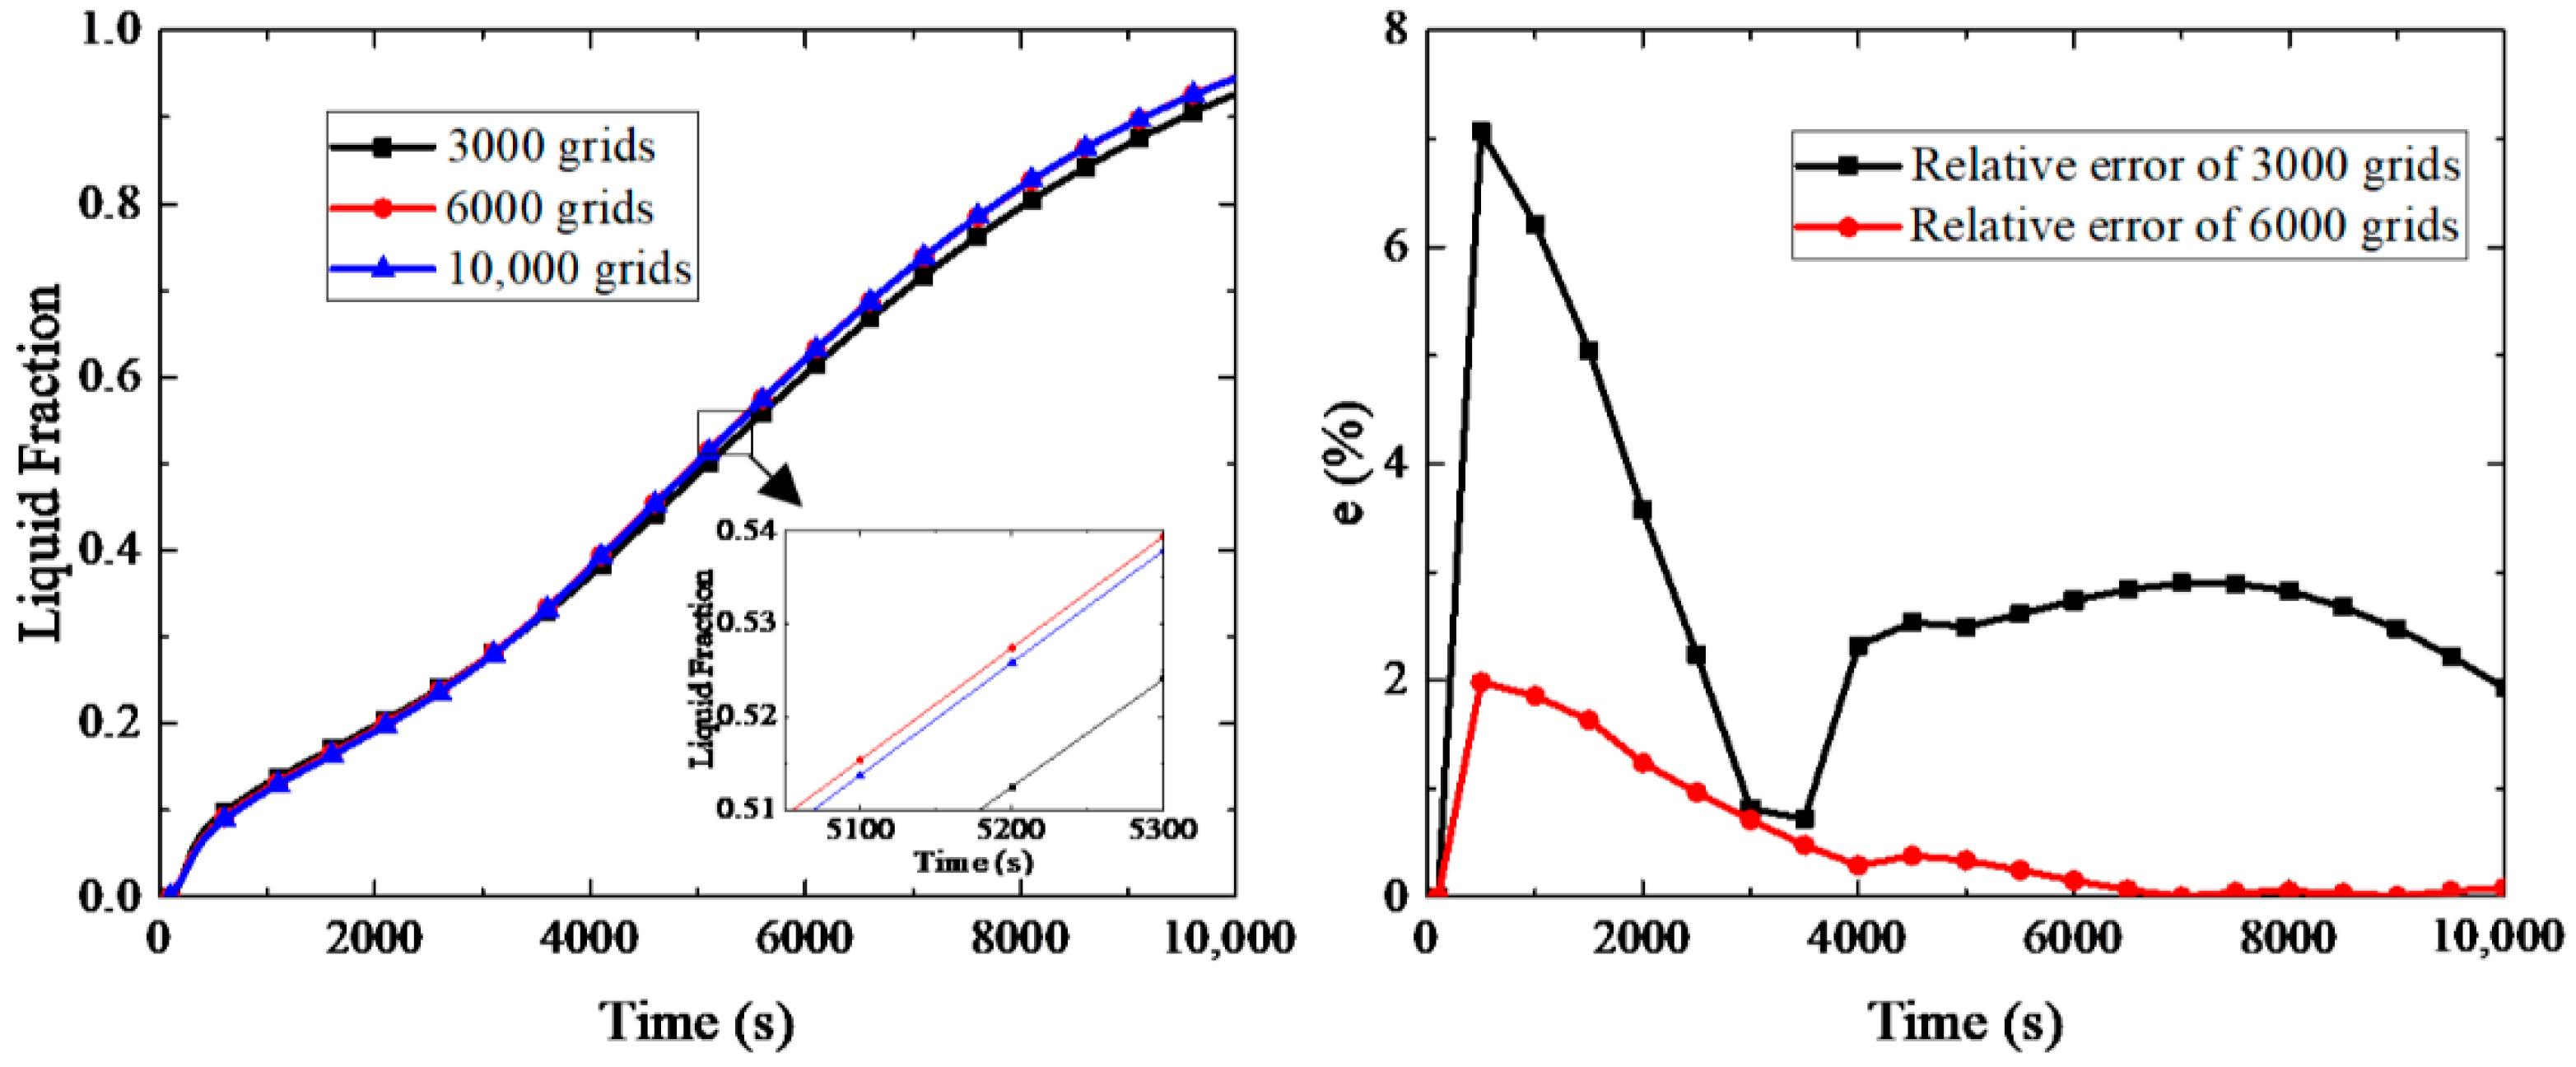
Figure 8.
Comparison results for the case with 90° inclination angle between the numerical results (1–5) and the experimental data ((1)–(5)).
Figure 8.
Comparison results for the case with 90° inclination angle between the numerical results (1–5) and the experimental data ((1)–(5)).

Figure 9.
The melting process of paraffin at 0°. (a) Liquid fraction; (b) temperature variation.

Figure 10.
The melting process of paraffin at 30°. (a) Liquid fraction; (b) temperature variation.
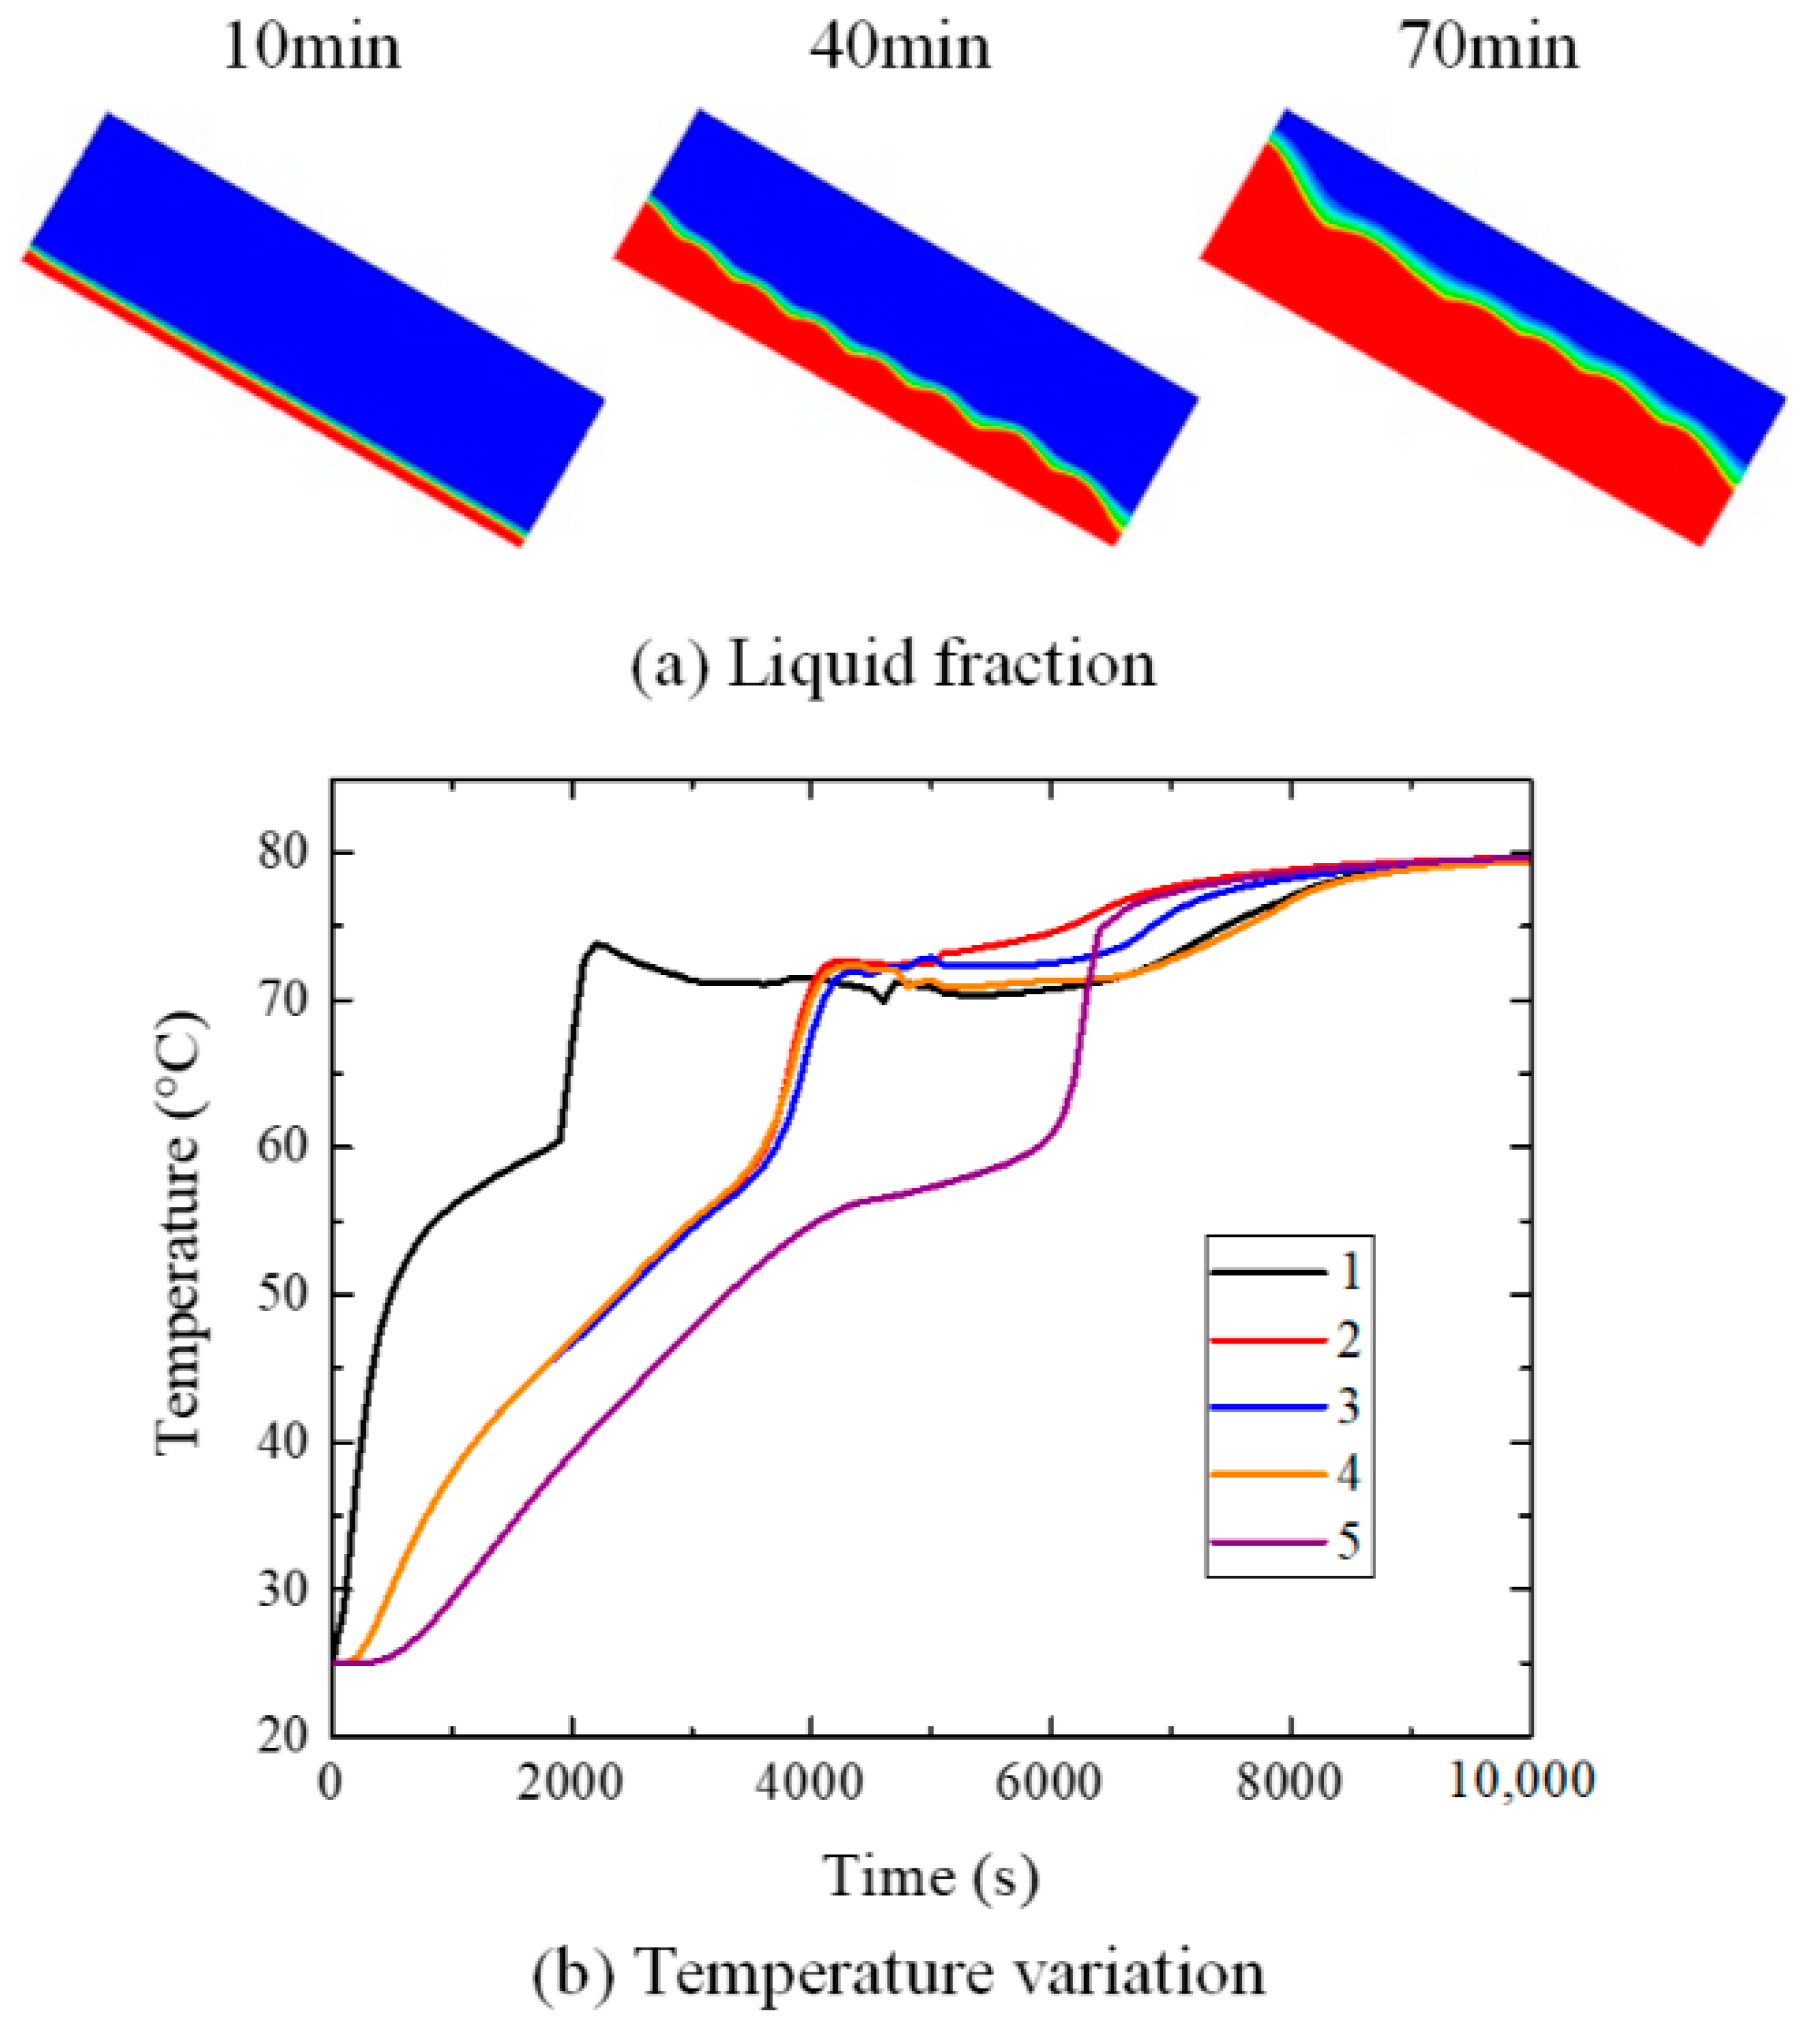
Figure 11.
The melting process of paraffin at 60°. (a) Liquid fraction; (b) temperature variation.

Figure 12.
The melting process of paraffin at 90°. (a) Liquid fraction; (b) temperature variation.
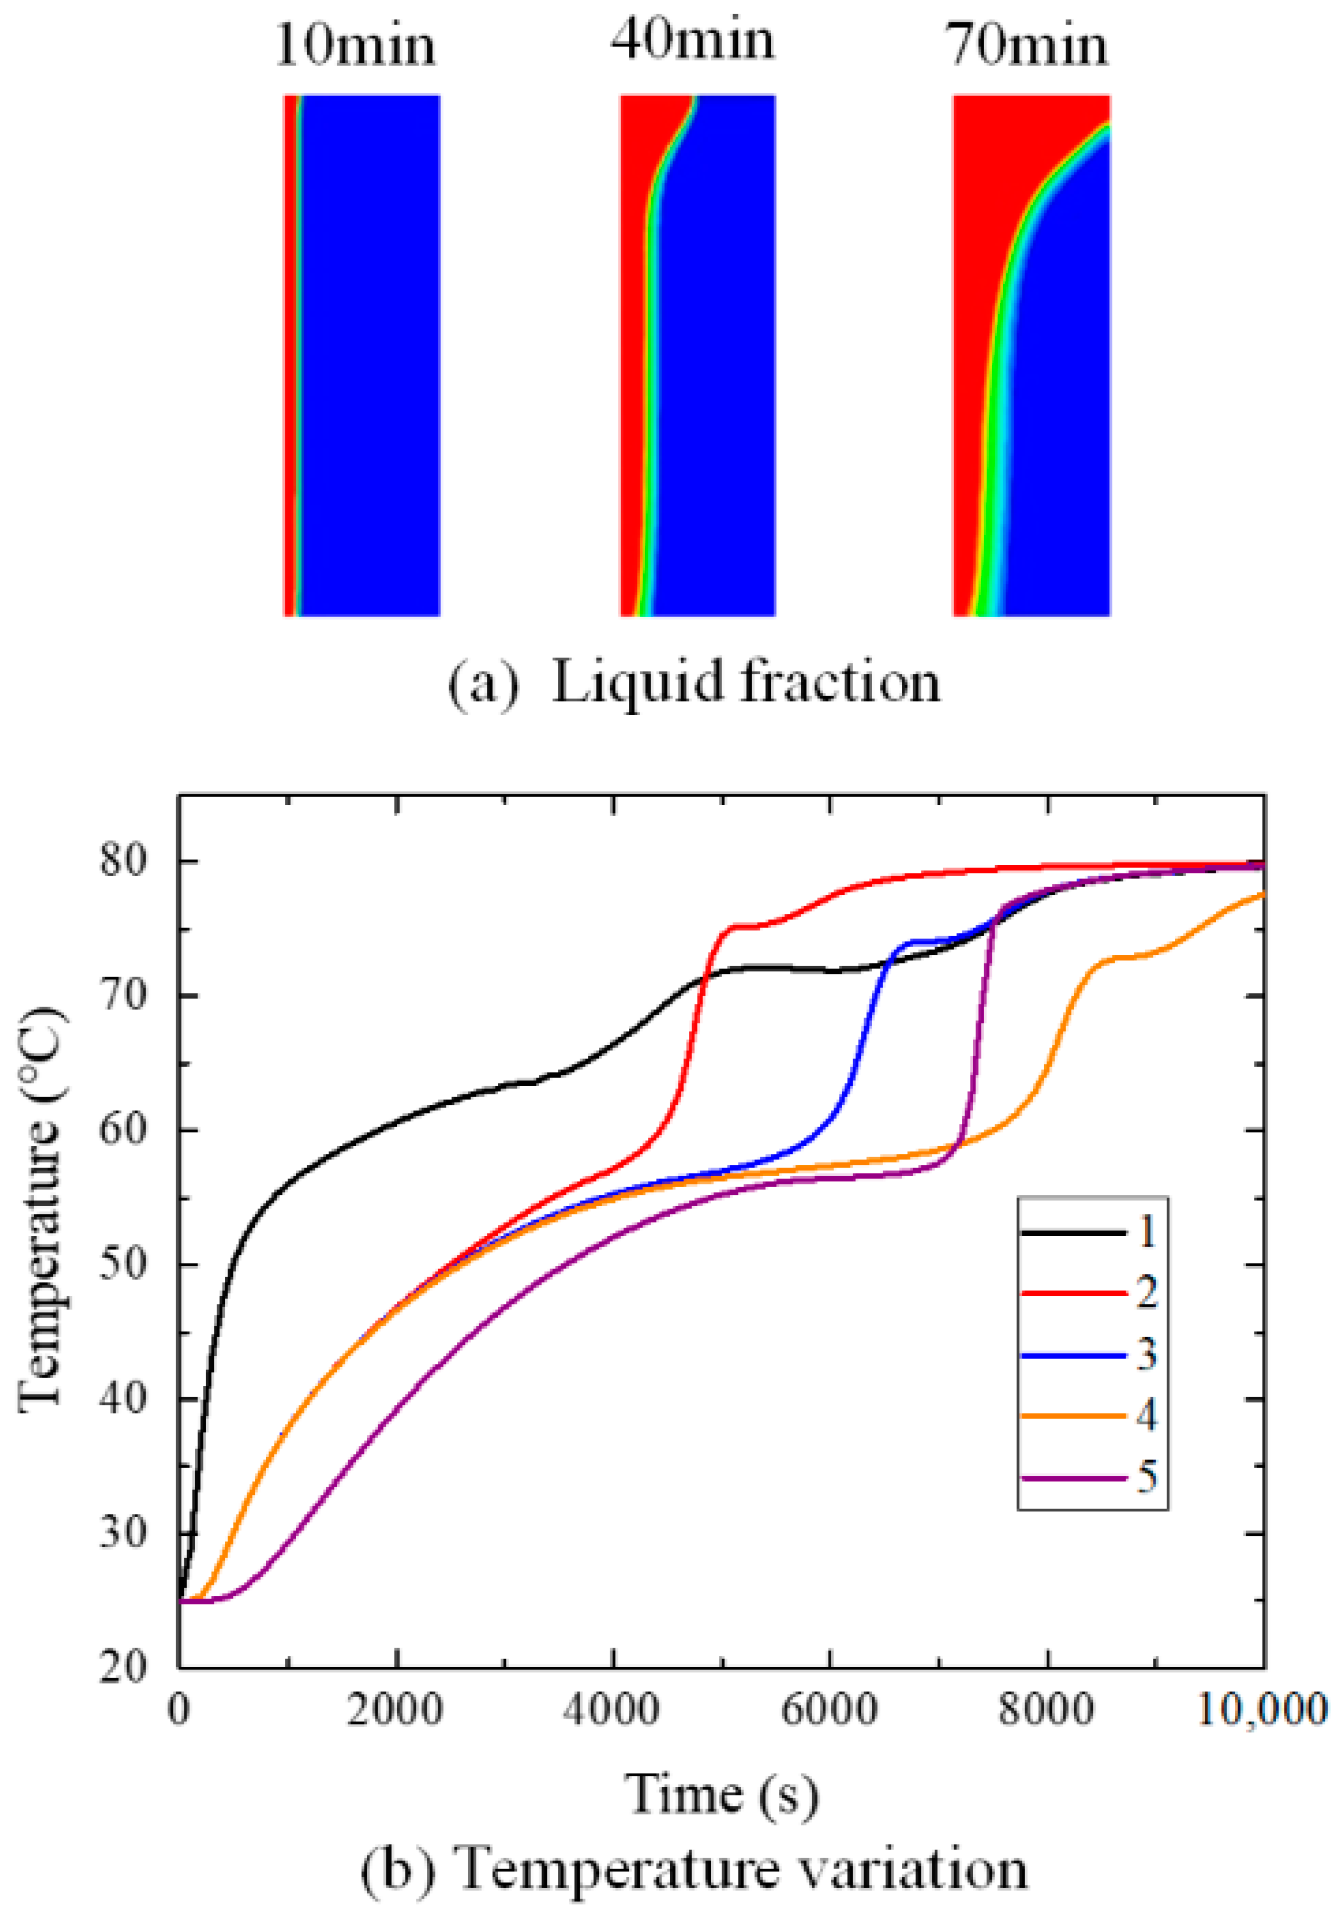
Figure 13.
The melting process of paraffin at 120°. (a) Liquid fraction; (b) temperature variation.

Figure 14.
The melting process of paraffin at 150°. (a) Liquid fraction; (b) temperature variation.
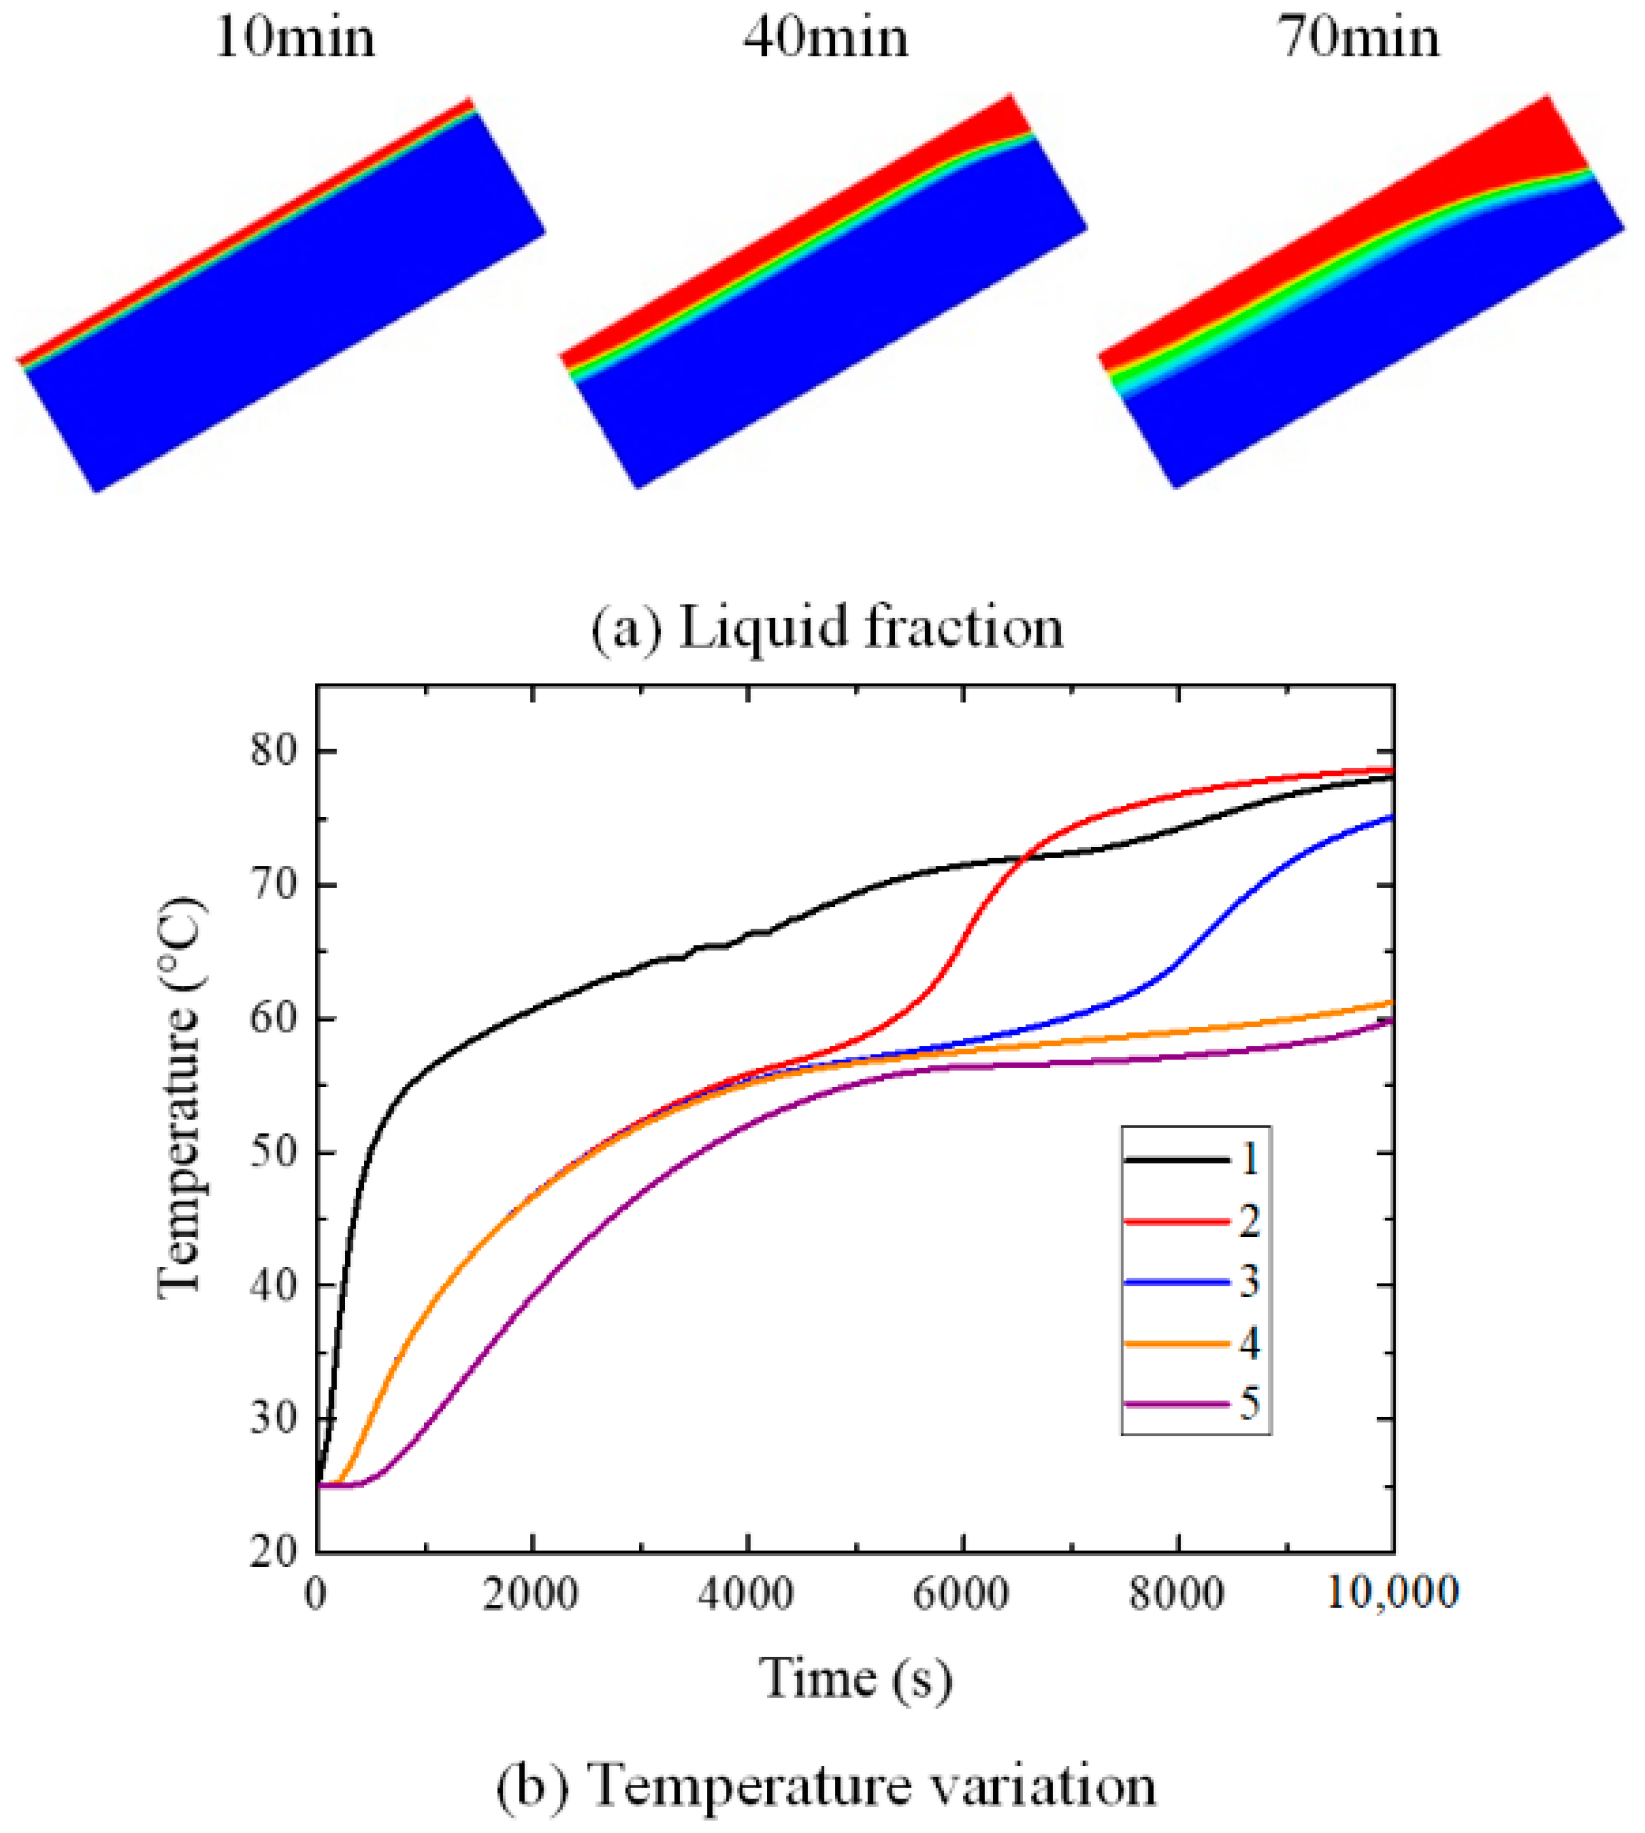
Figure 15.
The melting process of paraffin with top horizontal heating (180°). (a) Liquid fraction; (b) temperature variation.
Figure 15.
The melting process of paraffin with top horizontal heating (180°). (a) Liquid fraction; (b) temperature variation.

Figure 16.
The variation of liquid fraction at different inclination angles.

Figure 17.
The relationship between the complete melting time and the inclination angles.

Table 1.
Thermophysical properties of paraffin RT 60.
| Parameters | Value |
|---|---|
| Density of solid (kg·m−3) | 805.90 |
| Latent heat (J·g−1) | 110.28 |
| Melting temperature (K) | 56.4–64.3 °C |
| Thermal conductivity (W·m−1·K−1) | 0.20 (solid); 0.11 (liquid) |
| Specific heat (J·kg−1·K−1) | 2.10 × 10³ |
| Kinematic viscosity (m2·s−1) | 4.464 × 10⁻⁶ |
| Thermal expansion coefficient (K−1) | 1.10 × 10⁻⁴ |
Table 2.
The initial and boundary conditions. UDF—user defined function.
| Definite Conditions | Locations | Velocity | Conditions |
|---|---|---|---|
| Initial condition | 0 ≤ x ≤ 100, 0 ≤ y ≤ 30 | U = v = 0 | T = Tinit = 25 °C |
| Boundary conditions | 0 ≤ x ≤ 100, y = 0 | U = v = 0 | UDF from 25 to 80 °C |
| 0 ≤ x ≤ 100, y = 30 | U = v = 0 | ||
| x = 0, 0 ≤ y ≤ 30 | U = v = 0 | ||
| x = 100, 0 ≤ y ≤ 30 | U = v = 0 |
Table 3.
Comparison of the numerical results of solid-liquid interfaces with different inclination angles at three selected times.
Table 3.
Comparison of the numerical results of solid-liquid interfaces with different inclination angles at three selected times.
| Angle | 30 min | 60 min | 90 min |
|---|---|---|---|
| 0° |  |  |  |
| 30° |  |  |  |
| 60° |  |  |  |
| 90° |  |  |  |
| 120° |  |  |  |
| 150° |  |  |  |
| 180° |  |  |  |
| Legend |  | ||
Table 4.
Comparison of the locations of solid liquid interface between the numerical results and experimental photos.
Table 4.
Comparison of the locations of solid liquid interface between the numerical results and experimental photos.
| Angle | 0° | 30° | 60° | 90° |
| Numerical results |  |  |  |  |
| Experimental photos |  |  |  |  |
| Angle | 120° | 150° | 180° | numerical legend |
| Numerical results |  |  |  |  |
| Experimental photos |  |  |  |
© 2018 by the authors. Licensee MDPI, Basel, Switzerland. This article is an open access article distributed under the terms and conditions of the Creative Commons Attribution (CC BY) license (http://creativecommons.org/licenses/by/4.0/).
Share and Cite
MDPI and ACS Style
Wang, Y.; Dai, J.; An, D. Numerical Investigations on Melting Behavior of Phase Change Material in a Rectangular Cavity at Different Inclination Angles. Appl. Sci. 2018, 8, 1627. https://doi.org/10.3390/app8091627
AMA Style
Wang Y, Dai J, An D. Numerical Investigations on Melting Behavior of Phase Change Material in a Rectangular Cavity at Different Inclination Angles. Applied Sciences. 2018; 8(9):1627. https://doi.org/10.3390/app8091627
Chicago/Turabian StyleWang, Yong, Jingmin Dai, and Dongyang An. 2018. "Numerical Investigations on Melting Behavior of Phase Change Material in a Rectangular Cavity at Different Inclination Angles" Applied Sciences 8, no. 9: 1627. https://doi.org/10.3390/app8091627
Note that from the first issue of 2016, this journal uses article numbers instead of page numbers. See further details here.