Article

Reduction of Moving Target Time-of-Flight Measurement Uncertainty in Femtosecond Laser Ranging by Singular Spectrum Analysis Based Filtering

Ultrafast Laser Laboratory, Key Laboratory of Opto-Electronic Information Technology, Ministry of Education, School of Precision Instruments and Opto-Electronics Engineering, Tianjin University, Tianjin 300072, China
*
Author to whom correspondence should be addressed.
Appl. Sci. 2018, 8(9), 1625; https://doi.org/10.3390/app8091625
Submission received: 11 August 2018 / Revised: 2 September 2018 / Accepted: 10 September 2018 / Published: 12 September 2018
(This article belongs to the Special Issue Laser Frequency Combs for Absolute Distance Measurements)

Abstract

:
Femtosecond laser ranging has drawn great interest in recent years, particularly based on an asynchronous optical sampling implementation where a pair of femtosecond lasers are used. High precision absolute ranging either relies on tightly-phase-locked optical frequency combs (a dual-comb setup) or multiple averaging of the measurements from two free-running femtosecond lasers. The former technique is too complicated for practical applications, while the latter technique does not apply to moving targets. In this report, we propose a new route to utilizing a powerful singular spectrum analysis (SSA) filtering method to improve femtosecond laser ranging precision for moving targets with acceleration. The SSA method is capable of separating complex patterns in signals without a priori knowledge of the dynamical model. Here, we utilize the basic SSA filter to extract the target trajectory in the presence of measurement noise both in numerical simulation and in the absolute ranging experiment based on a pair of free-running femtosecond lasers. The experimentally-achieved absolute ranging uncertainty of a moving target is well below 110 nm at a 200-Hz update rate by applying the basic SSA filter. This method paves the way to the practical applications of femtosecond absolute ranging for dynamic objects.

1. Introduction

Optical frequency combs (OFCs), a high precision metrological technology based on femtosecond lasers, have been widely applied in absolute distance measurement [1]. The OFCs can simply provide optical frequency calibration for continuous-wave lasers in multi-wavelength interferometric ranging [2,3,4,5]. Otherwise, they have been directly used for time-of-flight (TOF) ranging based on the ultrashort pulse trains or multi-wavelength ranging based on the equally-spaced come-lines [6,7,8,9,10]. In particular, a dual-comb configuration [11,12,13,14] emerges as a competitive absolute ranging method due to the sub-micrometer precision, high update rate (kHz-level) and dead-zone free operation, showing potential applications in large-scale manufacturing, aerospace engineering, as well as remote sensing.
A dual-comb ranging system implements a pair of femtosecond lasers with an offset repetition rate and utilizes asynchronous optical sampling (ASOPS) for absolute ranging. The two lasers are always tightly phase-locked to a common narrow linewidth continuous-wave laser, enabling the transition from micrometer precision TOF measurement to nanometer precision interferometric measurement [11]. However, the unprecedented measurement precision is at the expense of increased complexity of the system setup. For the sake of industrial applications, absolute ranging with a pair of free running femtosecond lasers provides a significantly simplified setup, thus attracting much attention in recent years [15,16,17]. Nevertheless, the technical noise, as well as the quantum noises inevitably degrade the distance measurement precision [16,17].
Several methods have been developed to increase the measurement precision of absolute range finders based on free-running femtosecond lasers. A dual-wavelength mode-locked laser allows two pulse trains with an offset repetition rate to oscillate in a single laser cavity, and the shared cavity effectively avoids the technical noises that are the common mode to the two pulse trains [18]. Quantum-limited timing jitter is another major contribution to measurement uncertainty. Its effect can be significantly reduced by proper engineering of the mode-locking regime of the femtosecond laser sources [16,19]. Besides the above experimental approaches, measurement precision can also be improved by post-processing. The most straightforward approach is multiple averaging (MA). Sub-micrometer ranging precision is allowed with hundreds times of averaging [15]. However, MA causes a loss of the update rate since it integrates several distance data points into their arithmetic mean. Moreover, MA will be limited when the measurement target is moving. A good remedy is to extract the acquired distance information by using a digital filter instead of MA. Nevertheless, most digital filters need to know certain priori knowledge of input signals, such as the mathematical models of varying signals, the noise intensity of the data acquiring system, as well as the signal bandwidth.
Basic singular spectrum analysis (SSA), a data-driven analysis, established in 1986 [20], synthesizing the ingredients of classical time series analysis, multivariate geometry, multivariate statistics, dynamical systems and signal processing [21], was designed for making an extraction of qualitative information from a noisy signal. A relatively short and noisy signal can be decomposed by basic SSA into a sum of components, each having a certain interpretation, e.g., signal or noise. The basic SSA method has been extending its application to multiple fields such as hyperspectral remote sensing [22,23], GPS data processing [24] and absolute distance measurement of stationary targets [25]. As an analytical method, the basic SSA method needs to be manually analyzed by analysts after the result is obtained, which leads to an experience-oriented category of signals and noises. However, when the system only bears a Gaussian variable or pure Brownian noise, the Hurst exponent [26] can be applied as the analytical standard for distinguishing the Gaussian variable, white Gaussian noise and long-range dependence automatically [27]. To this end, the application fields of the SSA method have been significantly expanded. In this paper, we apply a filter based on the basic SSA method and the Hurst exponent to reduce the femtosecond laser absolute distance measurement uncertainty automatically in the case of a wide range of absolute distance changes with a series of speeds. Both numerical simulation and an absolute ranging experiment based on a pair of free-running femtosecond lasers show that the basic SSA filter is capable of retrieving a moving target trajectory from the measurement data that is degraded by noise. The distance measurement uncertainty after filtering reaches 110 nm at a 200-Hz update rate. This method shows great potential to extend the femtosecond laser ranging technique to a wide range of LiDAR and dynamic measurement applications.

2. Methods

2.1. Singular Spectrum Analysis

The strategy of basic SSA is to decompose the observed time series into a sum of independent components. The procedure of basic SSA is in two isolated steps: decomposition and reconstruction. Each consists of another two steps separately. The decomposition step is composed of time lagged embedding and singular value decomposition (SVD), while the reconstruction step is composed of diagonal averaging and grouping. A flowchart of basic SSA, consisting of the sub-steps of decomposition and reconstruction, is shown in Figure 1.
In the first step, an initial dataset Y N ,
Y N = y 0 y 1 y N 1 ,
consisting of N samples with an equal time interval is projected in a vector space via delayed coordinate mapping over a lagged window length L, which is an integer satisfying 2 L N / 2 . The variable L is called the embedding dimension of the lagged vector space and should be adequately large. Through delayed coordinate mapping, we take L consecutive samples to create a time delay vector, x i ,
x i = y i y i + 1 y i + L 1 T .
Considering the relationship between the number of samples N and the lagging window length L, we get N L + 1 lagged vectors. Next, we get the trajectory matrix X by connecting all the lagged vectors. Obviously, since the elements on the vice diagonal lines are equal, X is a Hankel matrix,
X = y 0 y 1 y 2 y N L y 1 y 2 y 3 y N L + 1 y L 1 y L y L + 1 y N 1 .
In the second step, SVD is applied to decompose the trajectory matrix X into the form as follows:
X = U Σ V T ,
where U and V are unitary matrices. Their corresponding column vectors u i and v i are the left-singular vectors and right-singular vectors of X , which are orthogonal eigenvectors of matrices X X T and X T X , respectively. The vectors u i and v i are defined as the factor empirical orthogonal functions (EOFs) and principal components (PCs) of X , respectively [28]. Σ is a rectangular diagonal matrix whose elements on the diagonal line are in descending order. The elements on the diagonal line σ are singular values of X , which are the positive square roots of the eigenvalues of matrix X X T . Due to the dimension of decomposition d being equal to the rank of the matrix X , X can be written as:
X = i = 1 d X i = i = 1 d u i σ i v i T ,
where X i is one of the decomposition matrices of X . For every decomposition X i , the corresponding pairs u i , σ i , v i are sorted by descending order of singular values. Note that the square of each singular value can describe the contribution of the corresponding component to the initial signal; thus, the ratio σ k 2 / i = 1 d σ i 2 can be considered as the contribution ratio of the k-th component X k .
After SVD operation of X in the diagonal average step, the decomposition matrices X i of the trajectory matrix X should be converted back to a set of reconstructed time series Y ( i ) by the diagonal average, an inverse operation of time lagged embedding. In order to obtain k-th element y k ( i ) of the reconstructed time series Y ( i ) from the decomposition matrix X i , we need to take an average value of the elements on the k-th vice diagonal line. Then, any element of a reconstructed signal y k ( i ) can be described by the following formula:
y k ( i ) = 1 n + 1 j = 0 n a j , n j , 0 n L 1 1 L j = 0 L 1 a j , n j , L 1 < n < N L 1 N n j = n N + L L 1 a j , n j , N L n N 1
where L represents the embedding dimension, N is the length of the original signal and a i , j is the element of the decomposition matrix X i on the i-th row, j-th column.
Finally, in the grouping step, reconstructed time series Y ( i ) are divided into several classes and summed according to the category. In general, the SSA method can be classified as trend, oscillation and noise. In practice, it is very common that the leading component corresponds to the trend. In our application, the distance signal can be grouped into the classes of signal or noise. Hurst exponent H can be used as the grouping basis of basic SSA, allowing signal extraction from white noise automatically. The case of H > 0.5 indicates that the reconstructed time series is a long-term memory series, a part of the reconstructed signal; while the case of H 0.5 implies that the reconstructed time series is white noise that needs to be eliminated. In the calculation, we used the aggregated variance method to calculate the Hurst exponent [29].

2.2. Absolute Ranging Based on a Pair of Femtosecond Lasers

The principle of absolute distance measurement based on a pair of femtosecond lasers is shown in Figure 2. Two femtosecond lasers with similar repetition frequencies ( f r and f r Δ f r ) are used as the signal laser and the local oscillator (LO), respectively. The signal laser is directed at the reference and the target so that the target TOF is simply determined by the temporal separation of the retroreflected laser pulses from the reference and the target. LO is used to sample the retroreflected signal laser pulse envelopes nonlinearly via sum-frequency generation. Owning to the slightly different repetition rate, the sampling pulses will walk through the signal pulses and equivalently “stretch” the time frame by N = f r / Δ f r -times. The so-called nonlinear ASOPS process [12] makes the timing of ultrafast signal laser pulses accessible to standard electronics. In order to retrieve the target distance, we only need to measure the TOF of the target and the reference in the “stretched” time scale, as well as f r and Δ f r . In practice, we do not measure the difference of repetition frequencies Δ f r directly; rather, we use the following equation,
Δ f r = 1 t r e f 2 t r e f 1 ,
where t r e f 1 , t r e f 2 are the measured timing of two successive temporally-broadened reference pulses. As a result, one can calculate the absolute distance L by:
L = c 2 n g t T O F = c 2 n g 1 N t b r o a d e n = c 2 n g 1 f r t t a r t r e f 1 t r e f 2 t r e f 1 ,
where c is light velocity in a vacuum, n g is the group refractive index in air, t T O F is the real TOF of the femtosecond laser, while t b r o a d e n and t t a r represent the target-reference TOF and the timing of target pulse in the “stretched” time scale, respectively.

3. Simulation

A numerical simulation is conducted in the first place in order to testify the effectiveness of basic the SSA filter on the ASOPS-based femtosecond laser ranging system. To this end, we constructed an arbitrary target trajectory consisting of a motionless state, an accelerated motion and a uniform motion by computer. The motion parameters have been listed in Table 1. Here, a positive velocity is defined as an increase of the distance, while a negative velocity indicates a decrease of distance. The initial distance value of the simulation is set to 200,000 µm. Suppose the femtosecond laser ranging ideally reproduces the target trajectory; the retrieved target trajectory is shown as the red dashed line in Figure 3a. Here, the time span is 1.495 s, and the measurement sampling rate is 200 Hz (typical for ASOPS-based femtosecond laser ranging), containing 300 distance data points. The inset in Figure 3a shows the enlarged view for State ii, i.e., the transit from State i to State iii. In order to simulate the distance measurement uncertainty, a sequence of 300 Gaussian distributed random numbers with a standard deviation of 9.98 µm have been added to the ideal distance array. The simulated target trajectory considering measurement uncertainty is shown as the black curve in Figure 3a.
In the following, the basic SSA filter has been applied to the distance sequence with noise so as to retrieve the real target trajectory. As described in the Methods Section, only the lagged window length matters for effective implementation of an SSA filter. In order to choose an appropriate window length, we process the simulated distance signal under nine different window lengths, which ranges from 10 to 100 pts, corresponding to a time span from 0.05 to 0.5 s. The filtered distance sequence in each simulation is compared with the ideal target trajectory, and the effect of the SSA filter is evaluated by their correlation coefficient and the RMS residual that is simply the standard deviation of the errors obtained by subtracting the filtered distance sequence from the ideal one. The obtained correlation coefficient, as well as the RMS residual at different SSA filter window lengths are shown in Figure 3b. Obviously, the window length of 50 pts (0.25 s) provides the highest correlation coefficient, as well as the minimum RMS residual of 1.1 µm. The retrieved target distance sequence obtained by SSA filtering at a 50-pts window length is plotted as the blue dotted line in Figure 3a. The result explicitly demonstrates the effectiveness of the basic SSA filter for retrieving the target trajectory from Gaussian white noise. Note that a priori knowledge on the target kinetic behavior is not required.

4. Experiment

4.1. Experimental Setup

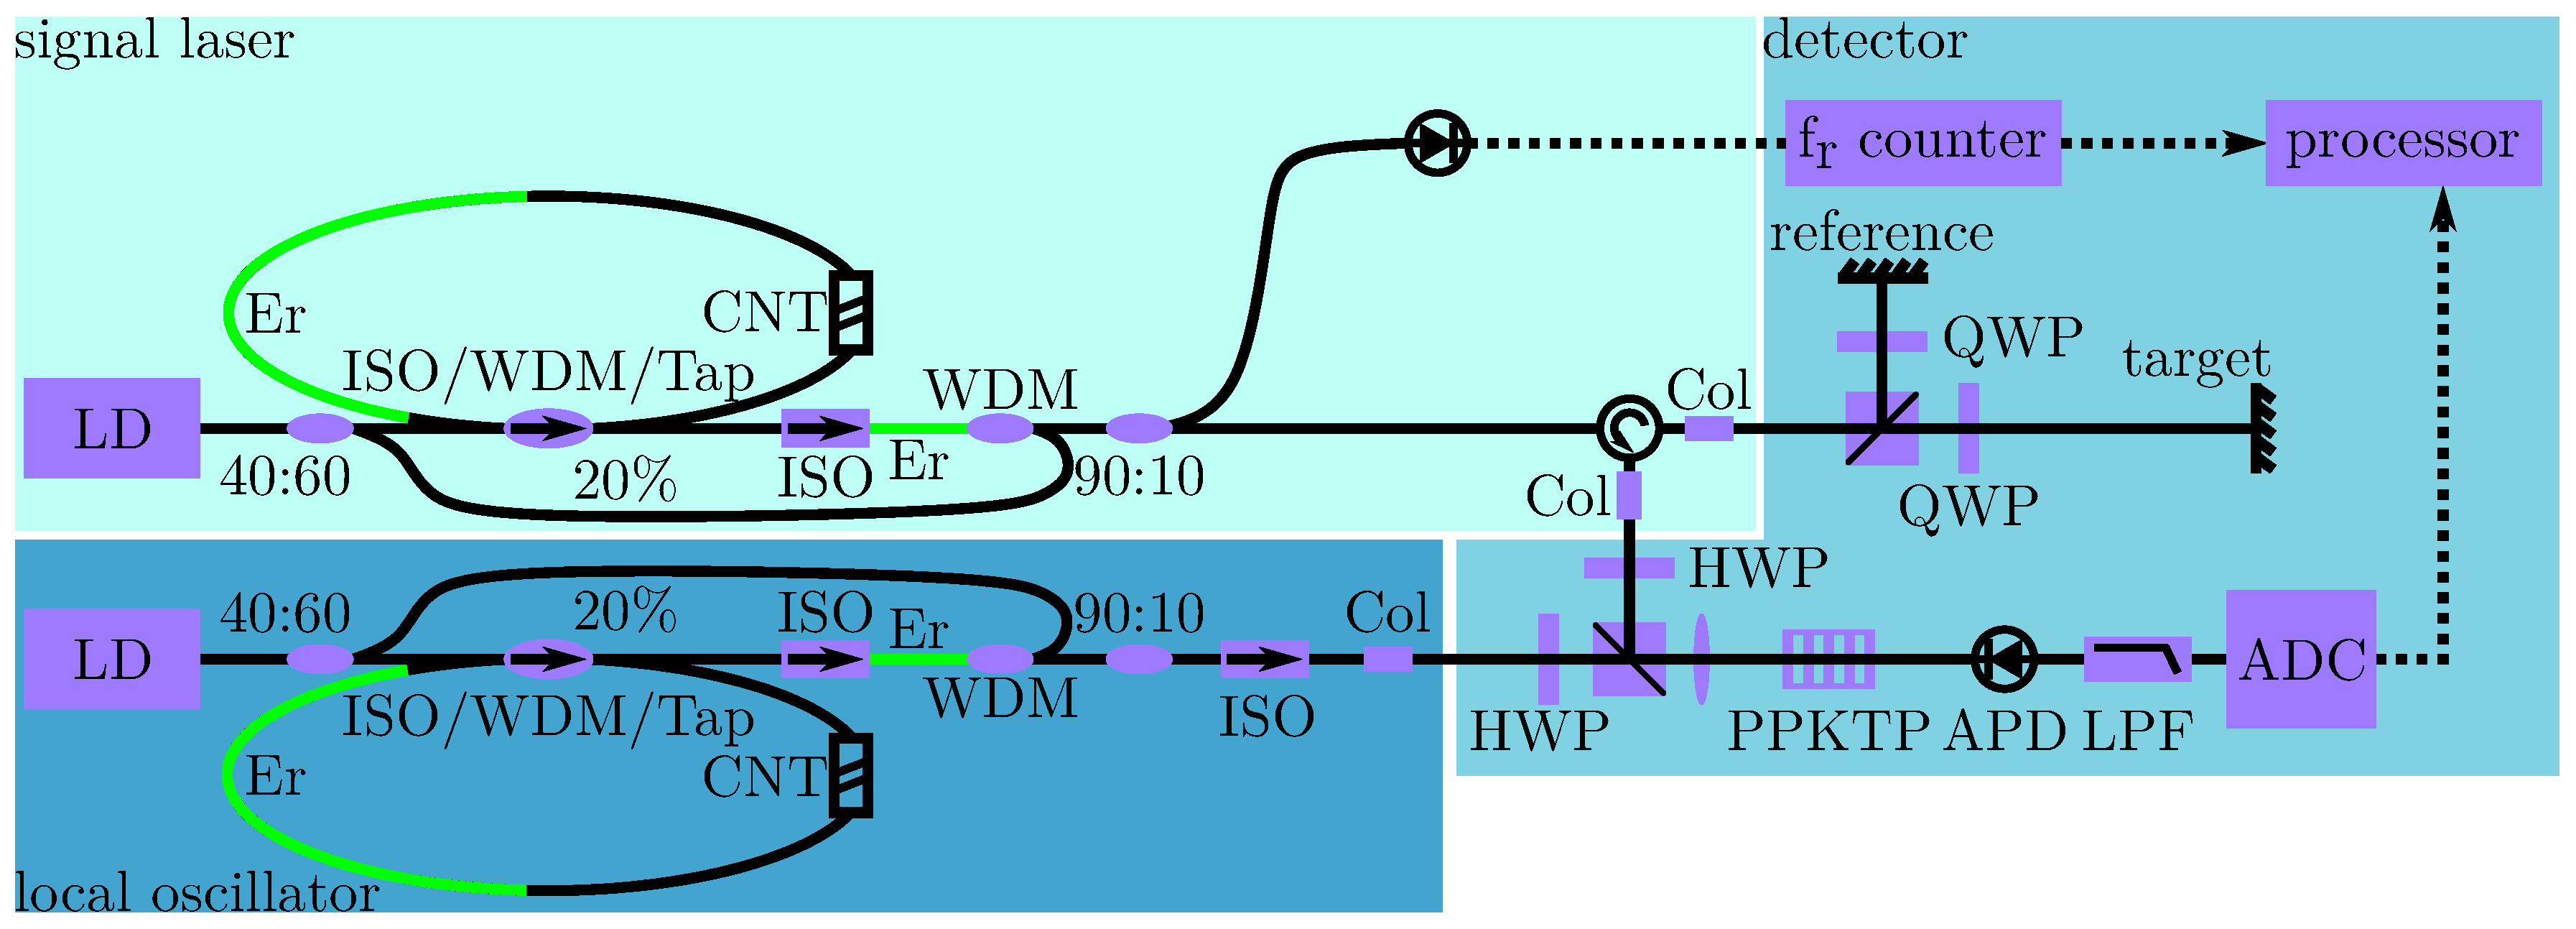
An absolute ranging experiment based on a pair of free-running femtosecond lasers is conducted by using the basic SSA filter for ranging precision improvement in practice. The experimental setup is shown in Figure 4. The ranging system uses a pair of free running carbon nanotube (CNT) mode-locked Er-fiber lasers working at 1550 nm, serving as the signal laser and LO, respectively. The average output powers after the Er-doped fiber amplifier (EDFA) are 10 mW and 13 mW, respectively. Their repetition rates are ~74 MHz, having a differential repetition rate of ~2 kHz. The laser pulses emitted by the signal laser are separated by a polarization beam splitter (PBS) and are sent to the reference mirror and target retro-reflector, respectively. The target is a retro-reflector mounted on a motorized linear translator that allows one-dimensional movement at various speed. The retro-reflected pulses from the target and the reference are beam-combined and are nonlinearly sampled by the local oscillator with an ~2-kHz repetition rate offset in a periodically-poled potassium titanyl phosphate (PPKTP)-based optical cross-correlator, thus accomplishing nonlinear ASOPS. The cross-correlation traces are detected by a high speed avalanche photo-detector, and the output voltage signals are digitized and stored by a 14-bit 100-MHz digitizer (PXIe-5122, National Instrument, Austin, TX, USA). The repetition rate of the signal laser is measured by a commercial frequency counter (53220A, Agilent, Santa Clara, CA, USA) referenced to a rubidium atomic clock. Detailed laser ranger design, as well as data gathering and processing can be found in our recent publications [16,18].

4.2. Experimental Data Processing

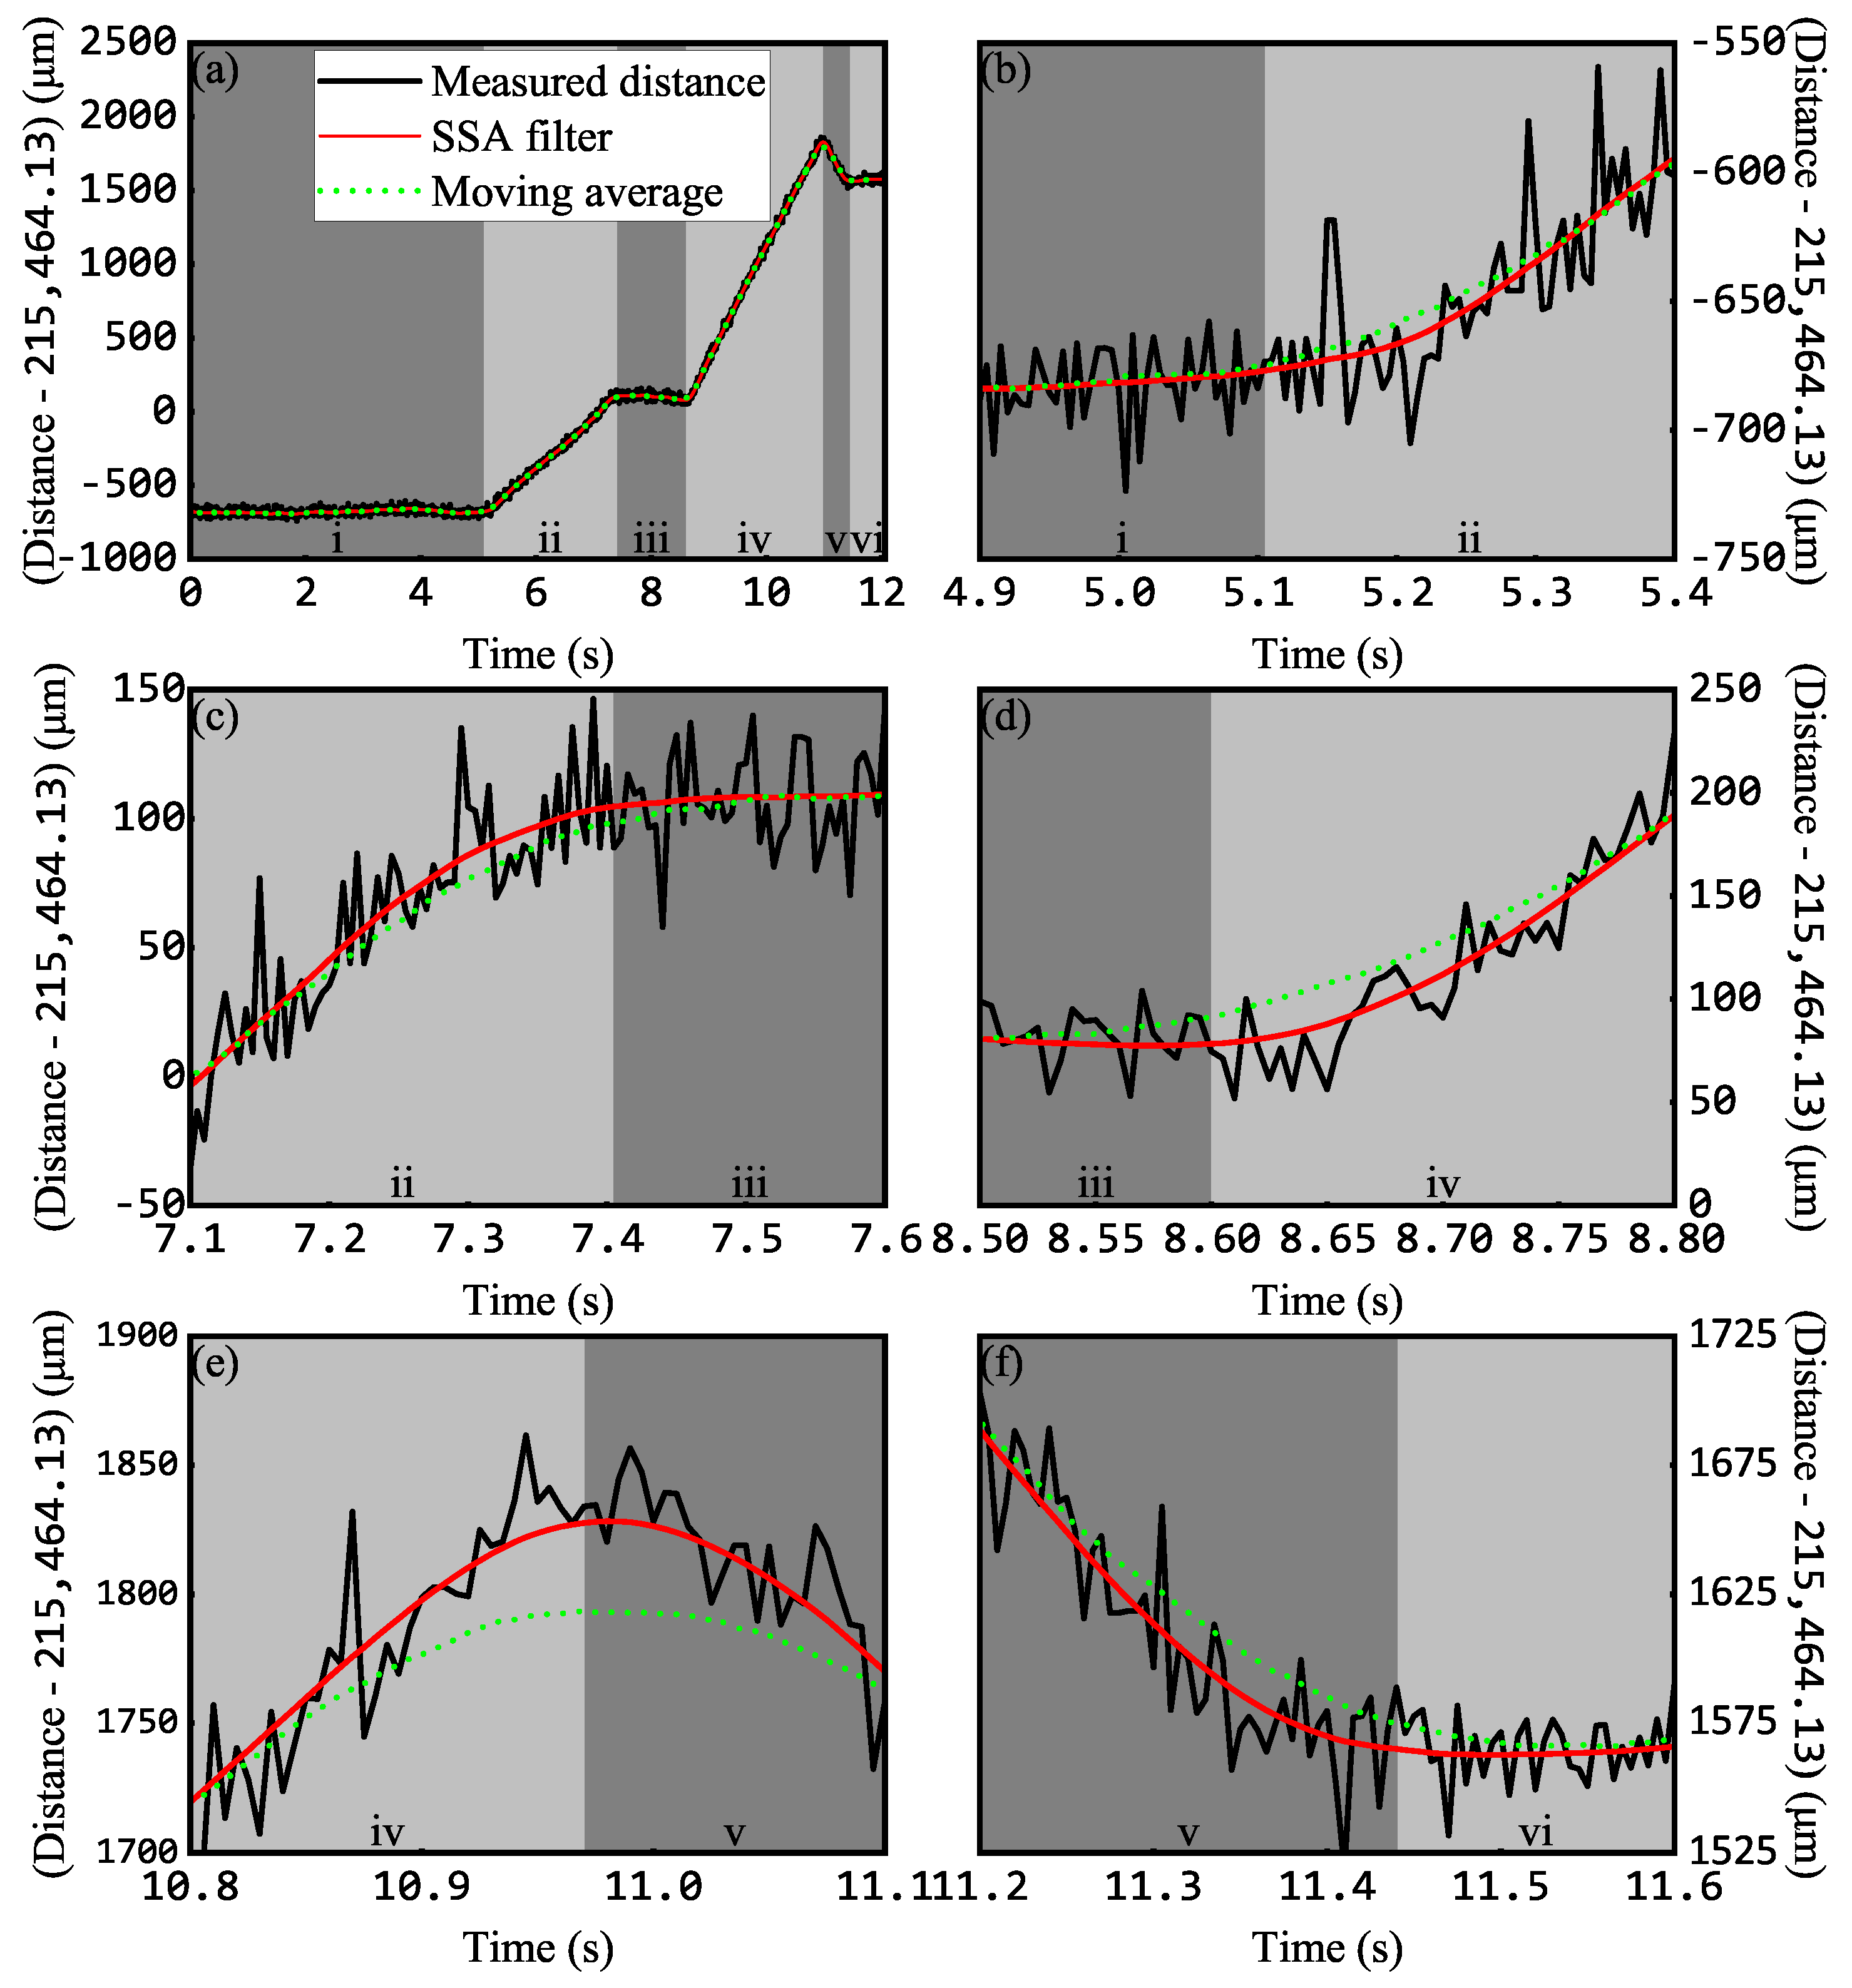
An arbitrary target movement is generated by programming of the motorized translator. Specifically, the target maintains its initial position at about 214,777.80 µm in 5.1 s. In the following, the target moves away from the range finder at a speed of 0.34 mm/s in 2.3 s. After a 1.2-s pause, the target moves towards the same direction at a speed of 0.75 mm/s in 2.37 s. Then, the target moves towards the opposite direction at a speed of 0.5 mm/s for 0.47 s. The target remains stationary at the last 0.615 s, thus completing the movement. The detailed movements of the target are listed in Table 2. The measured target movement trajectory by the absolute range finder is shown in the black lines of Figure 5. The update rate of the absolute distance measurement is 200 Hz. Note that the ASOPS-based absolute range finder used here has an inherent measurement update rate of 2 kHz determined by the offset repetition rate. However, we intentionally lower the update rate to 200 Hz by taking only one datum out of every 10 successive measurements considering the limited storage depth of the digitizer (PXIe-5122), which only allows storage of 1-s data at a 2-kHz update rate.
The basic SSA filter is used to process the experimental data, and the procedure is identical to that in the simulation. The result after the basic SSA filter with a 0.25-s window length is shown in red lines in Figure 5a. The choice of a 0.25-s window length is on the basis that the motion behavior is similar to the simulation in the above section. The enlarged view of the transits are shown in Figure 5b–f. It can be seen that the basic SSA filter effectively improves the measurement signal-to-noise ratio and retrieved the trajectory of the moving target. In comparison, we also process data by moving averaging with a 64-pts sliding box, shown as green dots in Figure 5. Despite the same level of curve smoothness, the retrieved trace by moving average apparently deviates from the real trajectory, particularly at non-uniform motion stages.
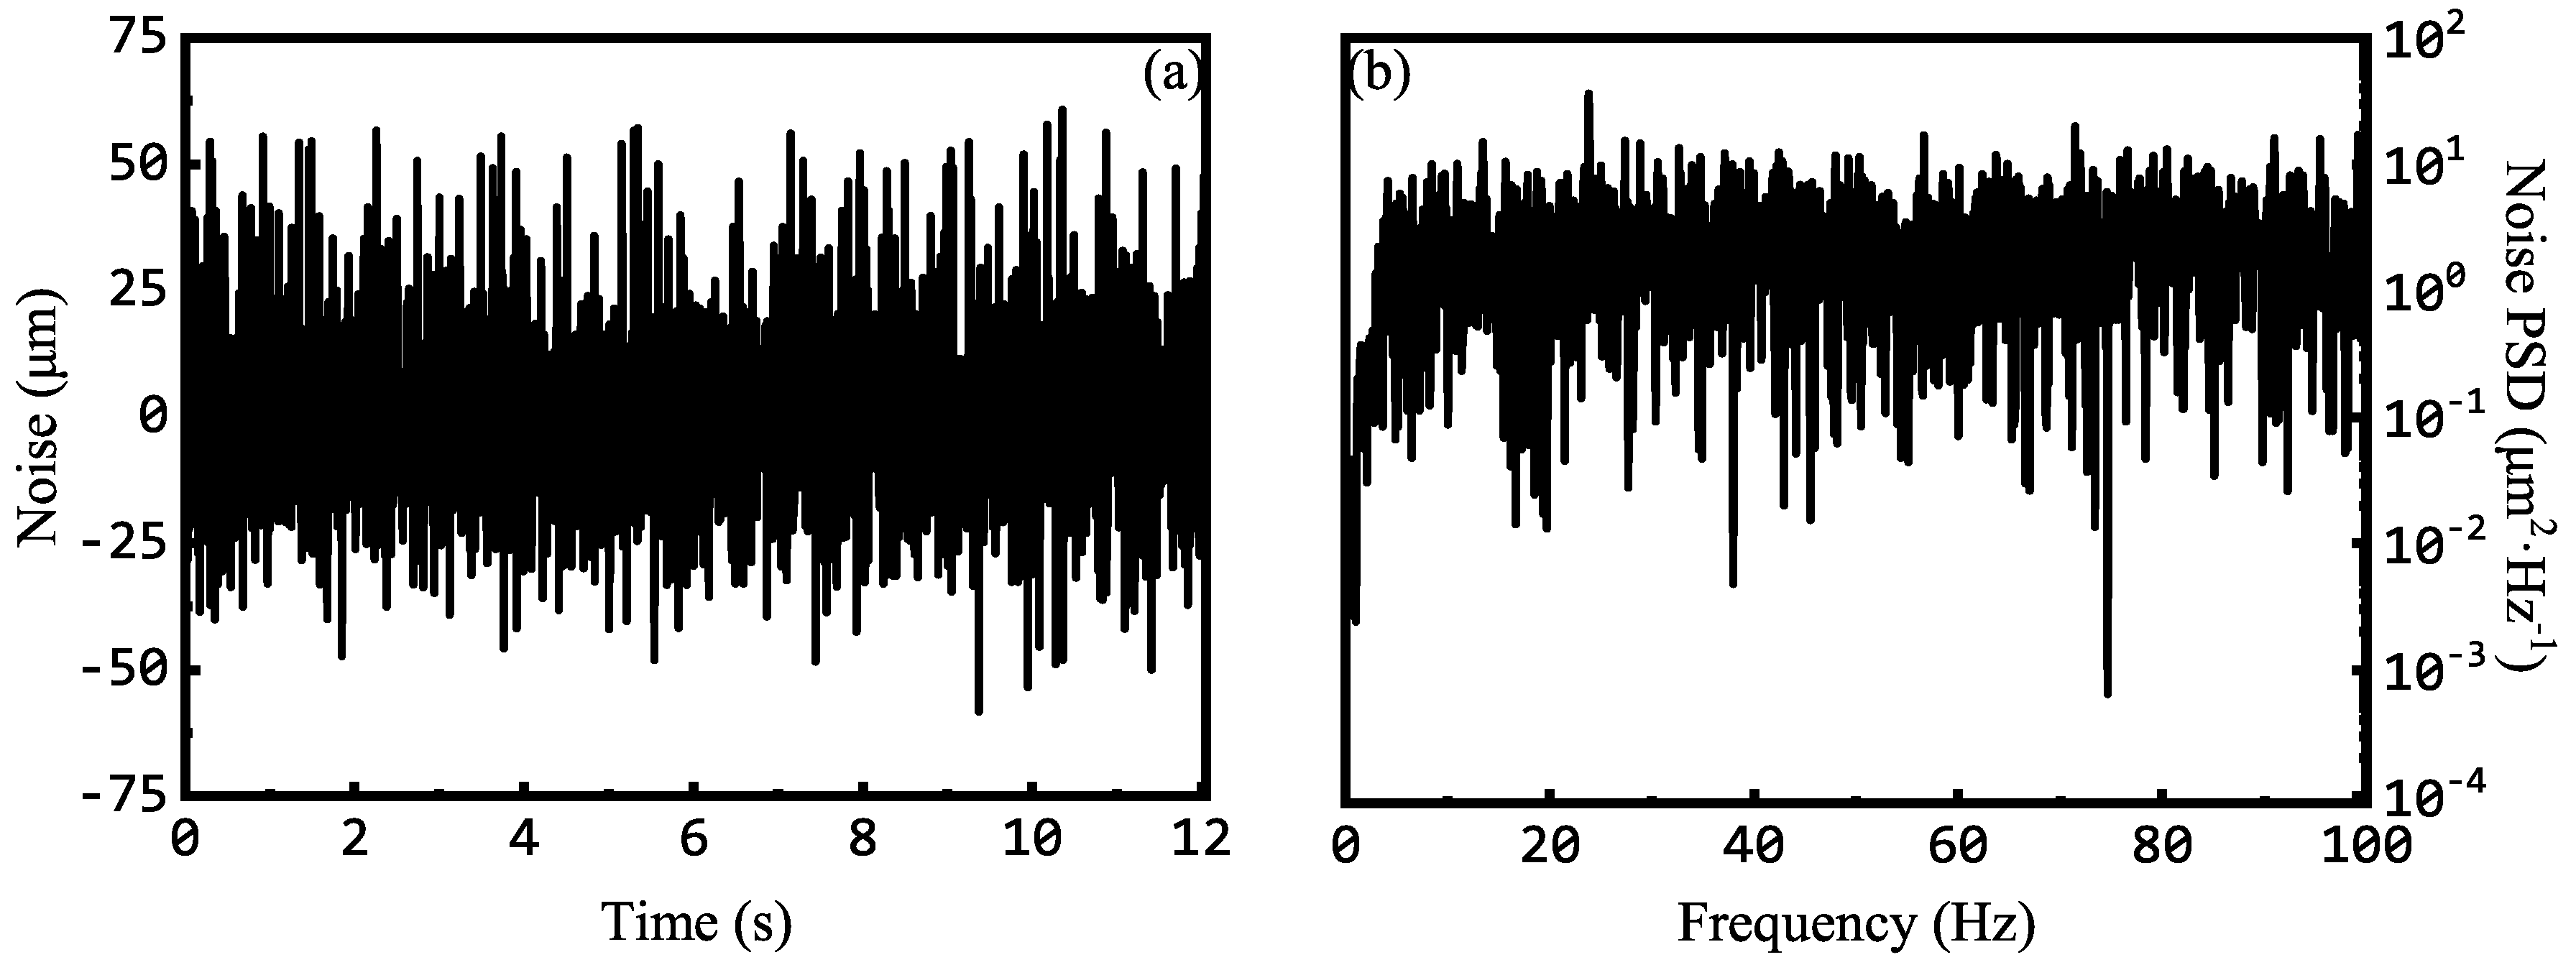
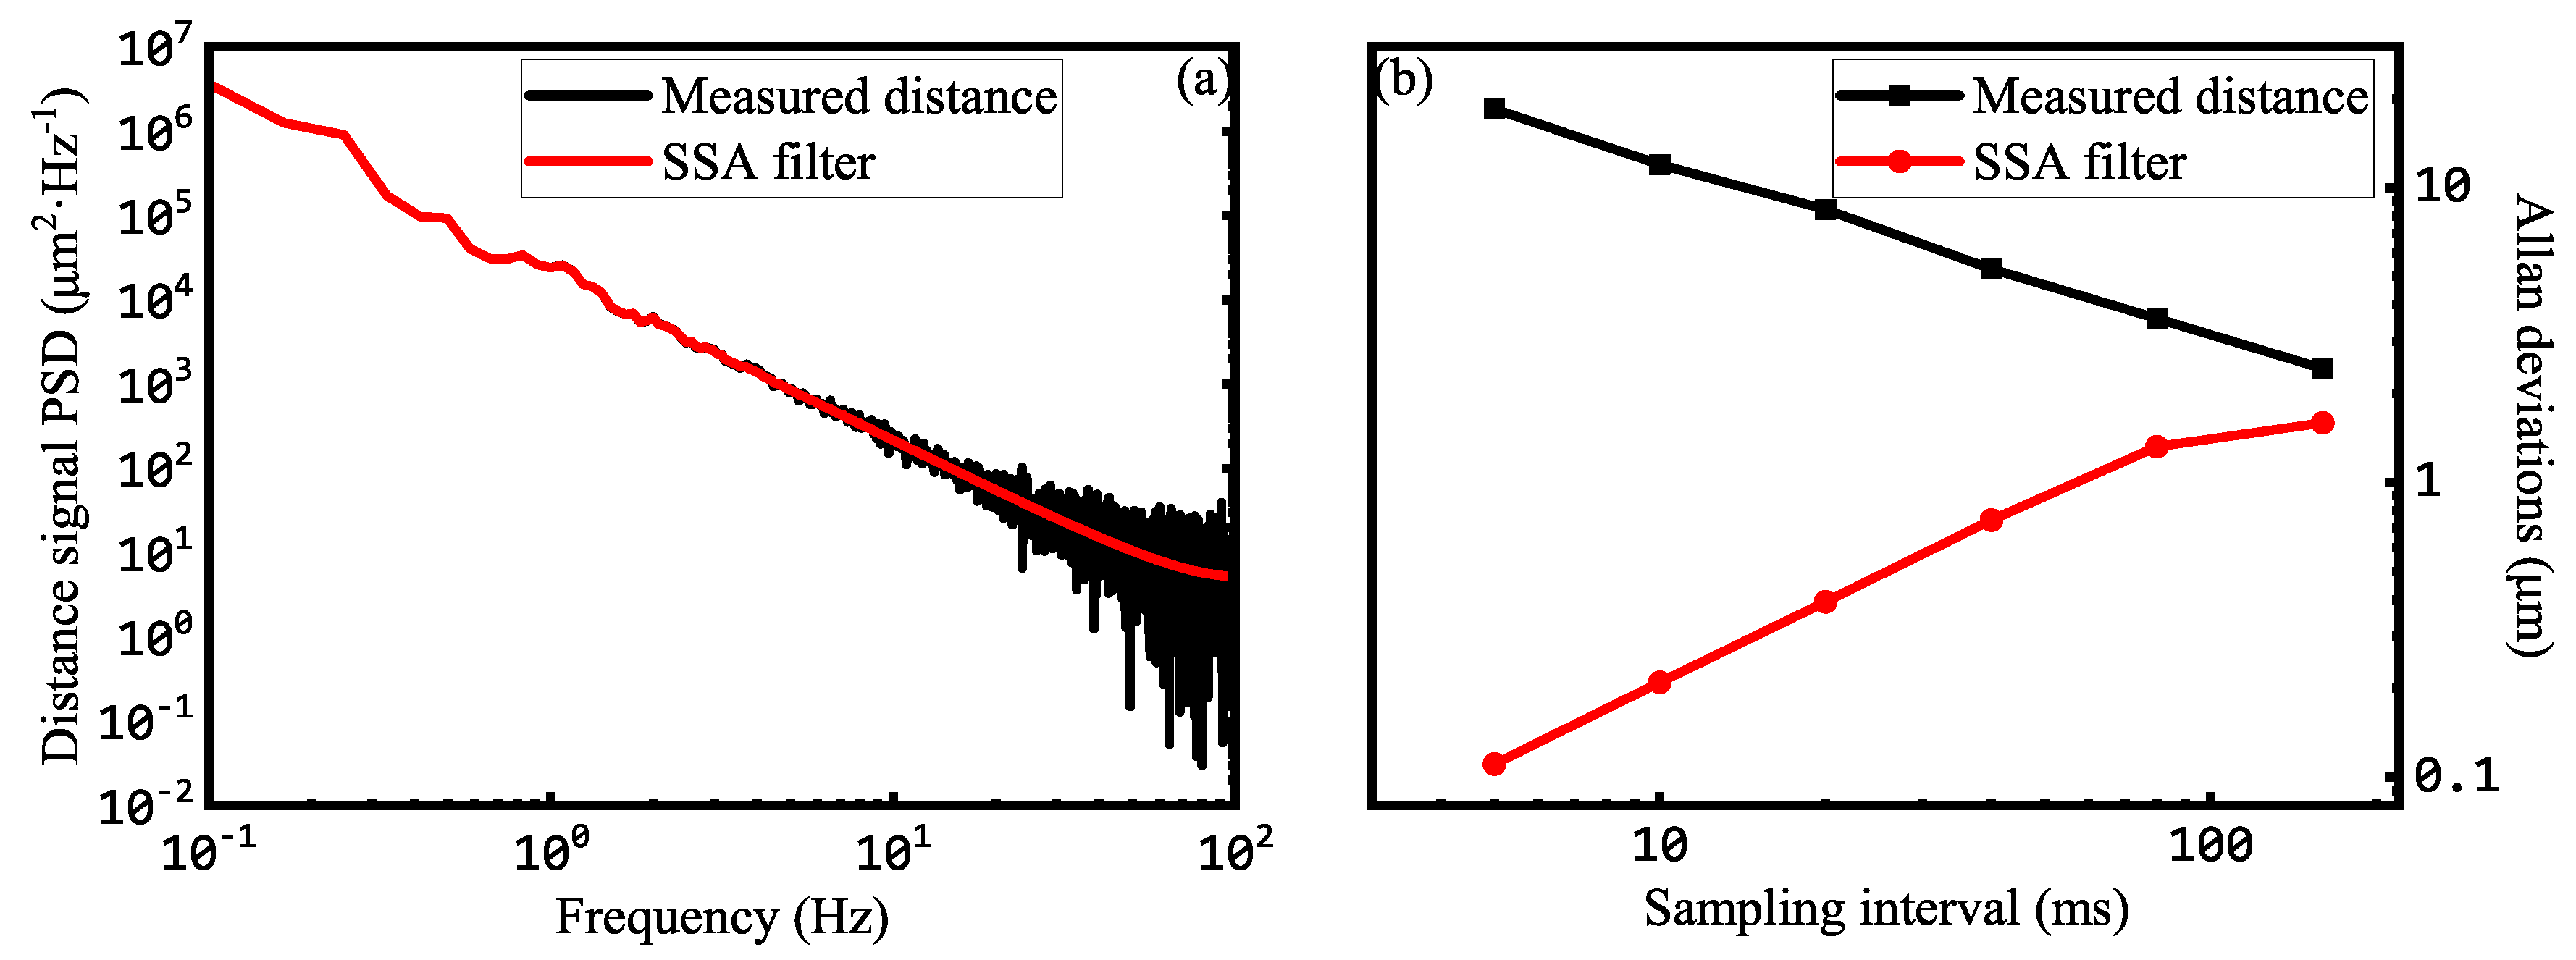
It is worth mentioning that the basic SSA filter is able to extract the noise sources while filtering a distance signal. Figure 6 illustrates the noise sequence separated by the basic SSA filter and the corresponding power spectral density (PSD). The PSD indicates that the Gaussian white noise process dominates during ASOPS-based absolute laser ranging. The noise STD is 16.75 µm RMS. In addition, the PSD of the measured distance signal and reconstructed signal by the basic SSA filter are shown in Figure 7a, showing that the noises in the distance signal are well filtered out, while the spectral characteristics of the target movement at baseband are well preserved.
Allan deviation analysis is utilized to evaluate the effect of the basic SSA filter on the improvement of measurement uncertainty. To this end, we calculated the Allan deviation of a section of measured distance signal (from 0 to 1.25 s in Figure 5a when the target is stationary) after basic SSA filtering, and the result is shown in the red curve in Figure 7b. The minimum absolute measurement uncertainty after basic SSA filtering is 110 nm, obtained at the fundamental 200-Hz update rate (5-ms observation time). In comparison, the Allan deviation of the same section of measured distance signal without basic SSA filtering in shown as the black curve in Figure 7b. At the fundamental 200-Hz update rate (5-ms observation time), the measurement uncertainty is 18 µm, which is 163-times higher than the number obtained after basic SSA filtering. The measurement uncertainty deceases with observation time (multiple averaging) and reaches 2.4 µm at a 160-ms observation time. This number is still 21-times larger than the 110-nm measurement uncertainty, which was obtained without any loss of update rate based on basic SSA filtering. With even more times of averaging, the measurement uncertainty may approach that obtained by basic SSA filtering. At an expense, the significantly lowered update rate will not be suitable for capturing the motions of the moving targets.

5. Conclusions

To summarize, we introduce a data-based filter, namely the basic SSA filter, to femtosecond laser absolute range finders for significant reduction of measurement uncertainty in the conditions of irregular moving targets. We verify the effectiveness of the basic SSA filter both in numerical simulation and in an absolute ranging experiment based on a pair of free-running femtosecond lasers. The simulation shows that the basic SSA filter is capable of reproducing a target trajectory that is significantly degraded by a white Gaussian noise. The priori knowledge on the dynamic behavior and the noise characteristics is not required. In the experiment, we successfully separate the signal and noise components by applying the basic SSA filter. We show that Gaussian white noise is the dominant noise process in an absolute range finder based on two free-running femtosecond lasers. By eliminating the noise components, the range finder shows 110-nm measurement uncertainty at a 200-Hz update rate for an irregularly-moving state. This method can be potentially used in a number of ASOPS-based high precision measurement fields. Firstly, the capability of separating various noise and signal components allows basic research on the noise characters in the femtosecond laser ranging system and shines light on the improved femtosecond laser range finder design. Secondly, this method enables a variety of industrial dynamic and vibrational measurements based on femtosecond laser range finders. Finally, this method can also be used for LiDAR and remote sensing applications, where the basic SSA filter can be used for target identification from point clouds obtained by scanning femtosecond LiDAR.

Author Contributions

Conceptualization, Y.S. and H.C.; Methodology, Y.S. and H.C.; Software, H.C.; Validation, R.L., Y.L., H.S. and J.Y.; Writing—Original Draft Preparation, Y.S. and H.C.; Writing—Review & Editing, Y.S. and H.C; Supervision, Y.S. and C.W.; Funding Acquisition, Y.S. and M.H.

Funding

This research was funded by Tianjin Natural Science Foundation, Grant Number 18JCYBJC16900; the National Natural Science Foundation of China (NSFC), Grant Numbers 61475162, 61675150, 61535009; the Tianjin Research Program of Application Foundation and Advanced Technology, Grant Number 17JCJQJC43500.

Conflicts of Interest

The authors declare no conflict of interest.

References

  1. Kim, S.W. Metrology: Combs rule. Nat. Photonics 2009, 3, 313–314. [Google Scholar] [CrossRef]
  2. Schuhler, N.; Salvadé, Y.; Lévêque, S.; Dändliker, R.; Holzwarth, R. Frequency-comb-referenced two-wavelength source for absolute distance measurement. Opt. Lett. 2006, 31, 3101–3103. [Google Scholar] [CrossRef] [PubMed]
  3. Cui, M.; Schouten, R.N.; Bhattacharya, N.; Berg, S.A. Experimental demonstration of distance measurement with a femtosecond frequen cy comb laser. J. Eur. Opt. Soc. Rapid Publ. 2008, 3, 08003. [Google Scholar] [CrossRef] [Green Version]
  4. Baumann, E.; Giorgetta, F.R.; Coddington, I.; Sinclair, L.C.; Knabe, K.; Swann, W.C.; Newbury, N.R. Comb-calibrated frequency-modulated continuous-wave ladar for absolute distance measurements. Opt. Lett. 2013, 38, 2026–2028. [Google Scholar] [CrossRef]
  5. Wang, G.; Jang, Y.S.; Hyun, S.; Chun, B.J.; Kang, H.J.; Yan, S.; Kim, S.W.; Kim, Y.J. Absolute positioning by multi-wavelength interferometry referenced to the frequency comb of a femtosecond laser. Opt. Express 2015, 23, 9121–9129. [Google Scholar] [CrossRef] [PubMed]
  6. Minoshima, K.; Matsumoto, H. High-accuracy measurement of 240-m distance in an optical tunnel by use of a compact femtosecond laser. Appl. Opt. 2000, 39, 5512–5517. [Google Scholar] [CrossRef] [PubMed]
  7. Ye, J. Absolute measurement of a long, arbitrary distance to less than an optical fringe. Opt. Lett. 2004, 29, 1153–1155. [Google Scholar] [CrossRef] [PubMed]
  8. Lee, J.; Kim, Y.J.; Lee, K.; Lee, S.; Kim, S.W. Time-of-flight measurement with femtosecond light pulses. Nat. Photonics 2010, 4, 716–720. [Google Scholar] [CrossRef]
  9. Lu, X.; Zhang, S.; Jeon, C.G.; Kang, C.S.; Kim, J.; Shi, K. Time-of-flight detection of femtosecond laser pulses for precise measurement of large microelectronic step height. Opt. Lett. 2018, 43, 1447–1450. [Google Scholar] [CrossRef] [PubMed]
  10. Wu, G.; Takahashi, M.; Inaba, H.; Minoshima, K. Pulse-to-pulse alignment technique based on synthetic-wavelength interferometry of optical frequency combs for distance measurement. Opt. Lett. 2013, 38, 2140–2143. [Google Scholar] [CrossRef] [PubMed]
  11. Coddington, I.; Swann, W.C.; Nenadovic, L.; Newbury, N.R. Rapid and precise absolute distance measurements at long range. Nat. Photonics 2009, 3, 351–356. [Google Scholar] [CrossRef]
  12. Zhang, H.; Wei, H.; Wu, X.; Yang, H.; Li, Y. Absolute distance measurement by dual-comb nonlinear asynchronous optical sampling. Opt. Express 2014, 22, 6597–6604. [Google Scholar] [CrossRef] [PubMed]
  13. Joohyung, L.; Seongheum, H.; Keunwoo, L.; Eundeok, B.; Seungman, K.; Sanghyun, L.; Seung-Woo, K.; Young-Jin, K. Absolute distance measurement by dual-comb interferometry with adjustable synthetic wavelength. Meas. Sci. Technol. 2013, 24, 045201. [Google Scholar] [CrossRef]
  14. Zhu, Z.; Xu, G.; Ni, K.; Zhou, Q.; Wu, G. Synthetic-wavelength-based dual-comb interferometry for fast and precise absolute distance measurement. Opt. Express 2018, 26, 5747–5757. [Google Scholar] [CrossRef] [PubMed]
  15. Liu, T.A.; Newbury, N.R.; Coddington, I. Sub-micron absolute distance measurements in sub-millisecond times with dual free-running femtosecond er fiber-lasers. Opt. Express 2011, 19, 18501–18509. [Google Scholar] [CrossRef] [PubMed]
  16. Shi, H.; Song, Y.; Liang, F.; Xu, L.; Hu, M.; Wang, C. Effect of timing jitter on time-of-flight distance measurements using dual femtosecond lasers. Opt. Express 2015, 23, 14057–14069. [Google Scholar] [CrossRef] [PubMed]
  17. Wu, G.; Zhou, Q.; Shen, L.; Ni, K.; Zeng, X.; Li, Y. Experimental optimization of the repetition rate difference in dual-comb ranging system. Appl. Phys. Express 2014, 7, 106602. [Google Scholar] [CrossRef]
  18. Shi, H.; Song, Y.; Li, T.; Wang, C.; Zhao, X.; Zheng, Z.; Hu, M. Timing jitter of the dual-comb mode-locked laser: A quantum origin and the ultimate effect on high-speed time- and frequency-domain metrology. IEEE J. Sel. Top. Quantum Electron. 2018, 24, 1–10. [Google Scholar] [CrossRef]
  19. Kim, J.; Song, Y. Ultralow-noise mode-locked fiber lasers and frequency combs: Principles, status, and applications. Adv. Opt. Photonics 2016, 8, 465–540. [Google Scholar] [CrossRef]
  20. Broomhead, D.S.; King, G.P. Extracting qualitative dynamics from experimental data. Phys. D Nonlinear Phenom. 1986, 20, 217–236. [Google Scholar] [CrossRef]
  21. Vautard, R.; Ghil, M. Singular spectrum analysis in nonlinear dynamics, with applications to paleoclimatic time series. Phys. D Nonlinear Phenom. 1989, 35, 395–424. [Google Scholar] [CrossRef]
  22. Zabalza, J.; Ren, J.; Wang, Z.; Zhao, H.; Wang, J.; Marshall, S. Fast implementation of singular spectrum analysis for effective feature extraction in hyperspectral imaging. IEEE J Sel. Top. Appl. Remote Sci. 2015, 8, 2845–2853. [Google Scholar] [CrossRef]
  23. Rafert, J.B.; Zabalza, J.; Marshall, S.; Ren, J. Singular spectrum analysis: A note on data processing for fourier transform hyperspectral imagers. Appl. Spectrosc. 2016, 70, 1582–1588. [Google Scholar] [CrossRef] [PubMed]
  24. Chen, Q.; van Dam, T.; Sneeuw, N.; Collilieux, X.; Weigelt, M.; Rebischung, P. Singular spectrum analysis for modeling seasonal signals from gps time series. J. Geodyn. 2013, 72, 25–35. [Google Scholar] [CrossRef]
  25. Cao, H.; Song, Y.; Yu, J.; Shi, H.; Hu, M.; Wang, Q. Singular spectrum analysis for precision improvement in dual-comb laser ranging. Acta Phys. Sin. 2018, 67, 10601. [Google Scholar] [CrossRef]
  26. Hurst, H.E. Long-term storage capacity of reservoirs. Trans. Am. Soc. Civ. Eng. 1951, 116, 770–808. [Google Scholar]
  27. Montillet, J.P.; Tregoning, P.; McClusky, S.; Yu, K. Extracting white noise statistics in gps coordinate time series. IEEE Geosci. Remote Sens. Lett. 2013, 10, 563–567. [Google Scholar] [CrossRef]
  28. Hassani, H.; Zhigljavsky, A. Singular spectrum analysis: Methodology and application to economics data. J. Syst. Sci. Complex 2009, 22, 372–394. [Google Scholar] [CrossRef]
  29. Tomsett, A.C.; Toumi, R. Annual persistence in observed and modelled uk precipitation. Geophys. Res. Lett. 2001, 28, 3891–3894. [Google Scholar] [CrossRef]
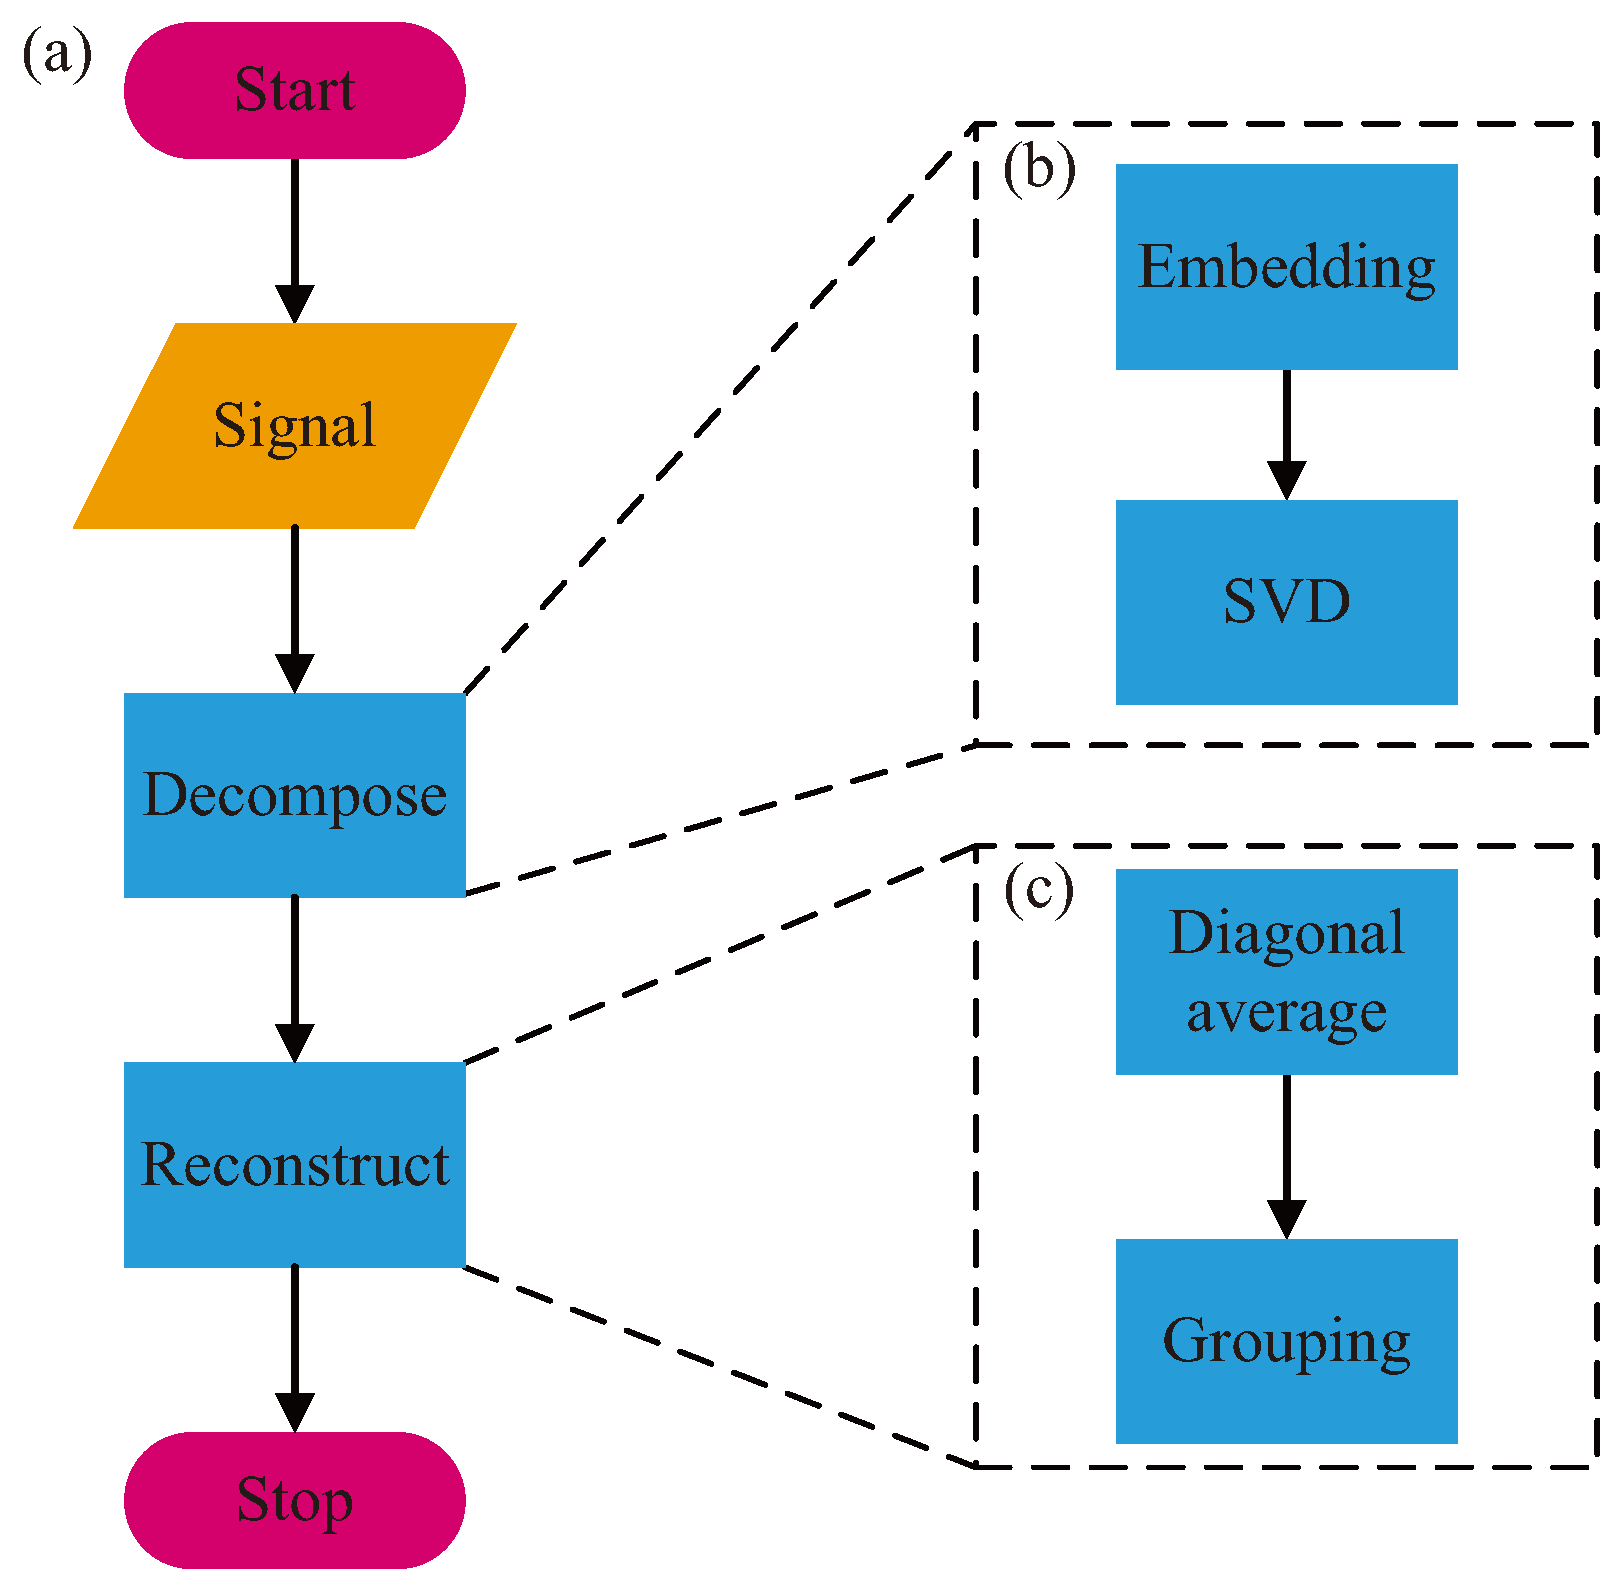
Figure 1. Flowchart of basic singular spectrum analysis (SSA). (a) Procedure of basic SSA; (b) sub-procedure: decomposition; (c) sub-procedure: reconstruction.
Applsci 08 01625 g001
Figure 2. Principle of femtosecond laser ranging based on asynchronous optical sampling.
Applsci 08 01625 g002
Figure 3. Simulated distance signal generated by Table 1. (a) Simulated distance in time-domain. Black line: noisy simulated distance, red dashed line: real value; blue dotted line: filtered result. State i: stationary; State ii: uniformly-accelerated motion; State iii: uniform motion. (b) Correlation coefficient (black line) and RMS of residual (red line) between real value and filtered result.
Applsci 08 01625 g003
Figure 4. Absolute ranging system based on a pair of free running femtosecond lasers. LD (laser diode); ISO (isolator); WDM (wavelength division multiplexing); ISO/WDM/Tap (integrated ISO, WDM and tap with 20% transmittance); CNT (carbon nanotube); Er (Er fiber); Col (collimator); HWP (half wave plate); QWP (quarter wave plate); PPKTP (periodically-poled potassium titanyl phosphate); APD (avalanche photo diode); LPF (low pass filter); ADC (analog-to-digital converter).
Applsci 08 01625 g004
Figure 5. Measured distance signal (black) and reconstruction by the basic SSA filter (red) and the moving averaging (green dot). (a) Entire measured distance signal; (bf) partial views of the measured distance at motion state boundaries.
Applsci 08 01625 g005
Figure 6. Experimental noise extracted by the basic SSA filter (a) and its PSD (power spectral density) (b).
Applsci 08 01625 g006
Figure 7. Spectral power density (a) and Allan deviation (b) of the distance data.
Applsci 08 01625 g007
Table 1. Simulated distance signal states of motion, corresponding to Figure 3.
Stateiiiiii
Velocity (mm·s 1 )00 (initial velocity)0.5
Acceleration (mm·s 2 )020
Duration (s)0.3740.250.871
Table 2. Measured distance signal states of motion, corresponding to Figure 5.
Stateiiiiiiivvvi
Velocity (mm·s 1 )00.3400.75−0.50
Duration (s)5.12.31.22.370.470.615