Notch Effect on the Fatigue Behavior of a TC21 Titanium Alloy in Very High Cycle Regime


1
School of Materials Science and Energy Engineering, Foshan University, Foshan 528000, China
2
School of Materials Science and Engineering, Beihang University, Beijing 100191, China
*
Author to whom correspondence should be addressed.
Appl. Sci. 2018, 8(9), 1614; https://doi.org/10.3390/app8091614
Submission received: 6 August 2018
/
Revised: 21 August 2018
/
Accepted: 9 September 2018
/
Published: 11 September 2018
(This article belongs to the Section Materials Science and Engineering)
Abstract
:The very high cycle fatigue (VHCF) property of TC21 titanium alloy blunt-notched specimens were investigated by using an ultrasonic fatigue test machine with a frequency of 20 kHz. S–N of blunt-notched specimens illustrated a continuous decrease characteristic with a horizontal line over the 105–109 cycle regimes. However, the fatigue life showed a large scatter for blunt-notched specimens. Blunt-notch significantly reduced the fatigue property in the high cycle and very high cycle regimes compared with that of smooth specimens. The crack initiation modes for blunt-notched specimens in the very high cycle regime can be divided into three types: (i) surface initiation, (ii) subsurface with flat facet, and (iii) subsurface with “facet + fine granular area”. The crack initiation mechanism of blunt-notched specimens is discussed in view of the interaction of notch stress gradient distribution and heterogeneous microstructure. Furthermore, the fatigue limit model based on the theory of critical distance (TCD) was modified for the very high cycle regime, and the scatter of the fatigue property of the blunt-notched specimens were well predicted by using this model.
1. Introduction
Titanium alloys are widely used for aeronautical structures because of their high specific strength, toughness, and damage tolerance [1]. Due to the very high vibration frequency of aeronautical structures, their fatigue failure occurs in the very high cycle fatigue (VHCF, i.e., more than 107 cycles) regime, and fatigue cracks are inclined to initiate at the subsurface of high strength titanium alloys [2,3]. In practice, notches in aeronautical structures are a common problem resulting from the sharp change of a complex geometry, such as a screw thread, groove, scratch, and foreign object damage (FOD). A notch in a component can produce a local stress concentration at the notch root, consequently leading to the crack initiation from the notch root [4]. Therefore, it is a great concern to investigate the VHCF crack initiation mechanism due to the interaction between the notch stress gradient and microstructure for aeronautical structures applications.
Recently, the notch effect on very high cycle fatigue has attracted much attention. Qian [5] and Schwerdt [6] reported that the crack initiation sites of the notched specimens were always at the root of the notch independent of the number of cycles, and the notches remarkably decreased the VHCF property. However, the investigation by Akiniwa [7] and Yang [8] showed that VHCF crack can initiate from the subsurface for some high-strength steel and titanium alloy specimens where a fine granular area was observed at the crack initiation site. However, the fatigue crack initiation mechanism of notched titanium alloys is not well understood in the very high cycle regime.
In sharp notches (with high stress concentration factor Kt), the stress concentration is the determining factor, and VHCF cracks initiate from the notch root due to its experiencing high enough stress [5,6]. However, a blunt notch (small Kt) exhibits microstructurally short non-propagating cracks (crack length on the order of the microstructural dimensions). As for high cycle fatigue, the fatigue crack that initiated from the blunt notch can overcome the strongest microstructural barrier and is sufficient to cause continuous propagation; thus, the fatigue strength of a blunt-notched specimen is determined by a ∆σ criterion [9]. It was reported that the stress amplitude in the very high cycle regime was lower than that in the high cycle regime for high strength titanium alloys [8], which indicated that very high cycle fatigue cracks may not initiate from the notch root due to the inadequate stress drive force. Thus, fatigue crack initiation under a low stress amplitude depended on the interaction between the stress gradient and the microstructure around the notch root, especially for high strength titanium alloys. On the other hand, theory of critical distance (TCD) methods [10] had been proposed to evaluate the high cycle fatigue limit of notched components, and TCD methods that are modified for very high cycle fatigue are investigated in this paper.
The blunt-notched effect on very high cycle fatigue behavior of a TC21 titanium alloy is investigated in this paper. The VHCF initiation mechanism of blunt-notched specimen is discussed based on the interaction between the stress gradient effect and the microstructure. Fatigue limits of blunt-notched specimens are also evaluated based on TCD methods.
2. Experimental Procedures
2.1. Materials
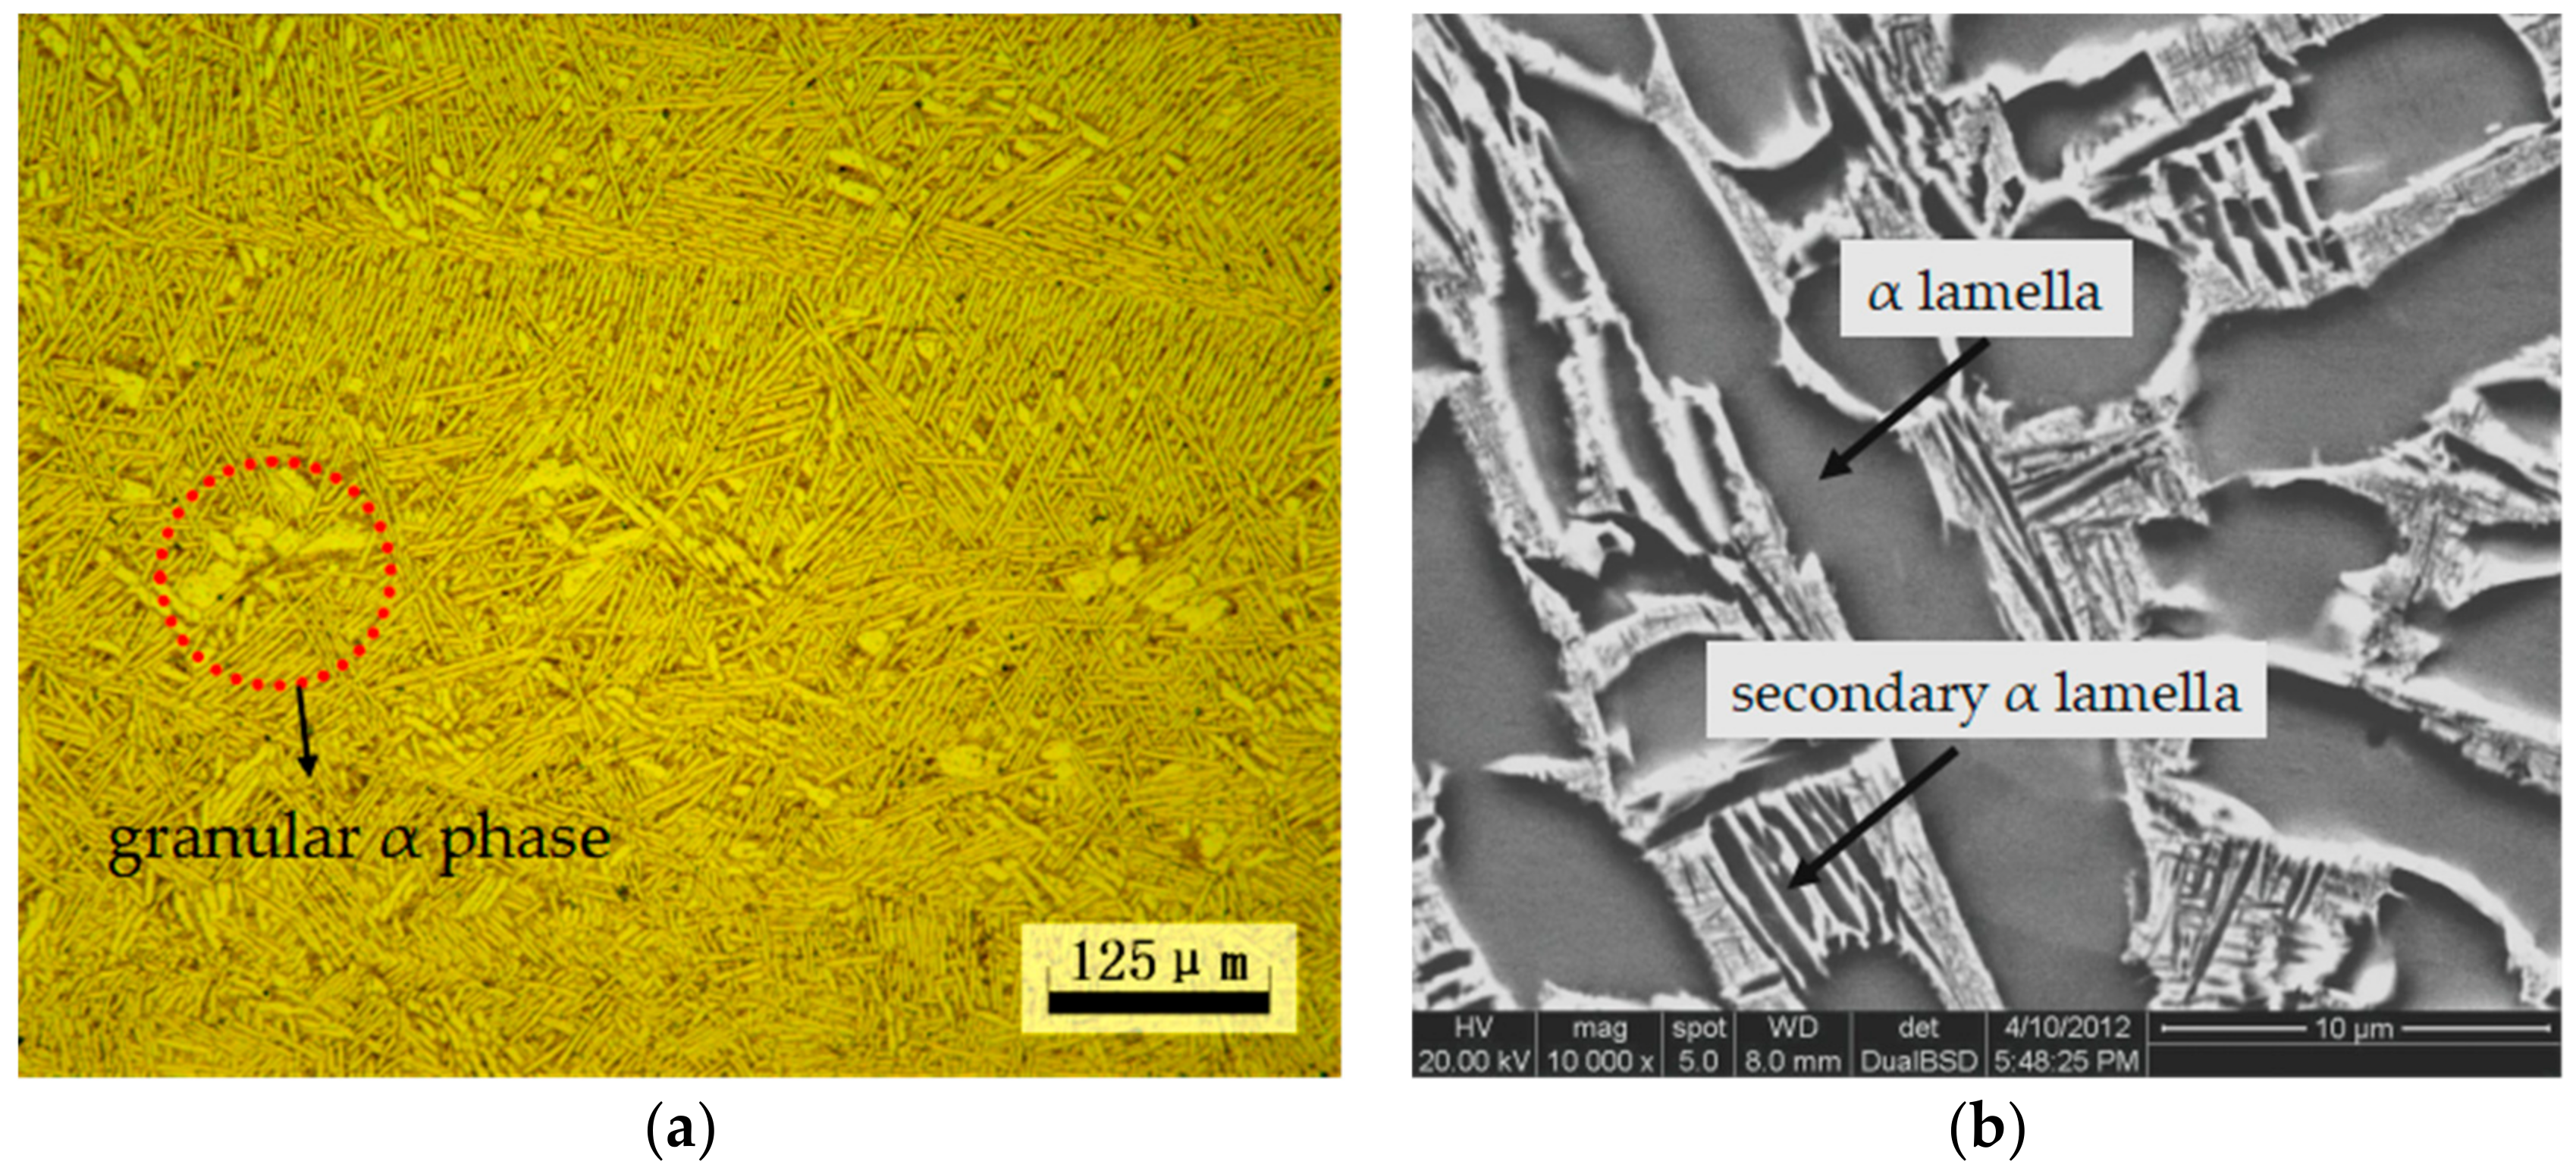
The TC21 titanium alloy that was investigated in this paper had a nominal chemical composition of Ti-6Al-2Sn-2Zr-3Mo-1Cr-2Nb. The specimens were subjected to a double annealing treatment of 900 °C for 2 h, air quenching, then 600 °C for 4 h, and further air quenching. The alloy obtained a double lamellar basketweave microstrucrture with mean sizes of 60 μm, and the granular α phase was observed in the alloy (Figure 1).
2.2. Surface Treatment
Electropolishing was applied for the specimens to remove the effect of the machining layers, and the specimens underwent a 59% methanol, 35% n-butanol, and 6% perchloric acid treatment under a −20 °C temperature and 20–25 V voltage in the electropolishing process.
2.3. Ultrasonic Fatigue Test
An ultrasonic fatigue machine (20 kHz, SHIMADZU, Kyoto, Japan) was used to carry out the very high cycle fatigue at R = −1. Detailed description of the ultrasonic fatigue machine is shown in Reference [11]. Considering the very high test frequency, the frequency effect should be not ignored; however, Yang [12] indicated that the frequency effect was small in the ultrasonic fatigue test due to its small elastic deformation. In addition, a compressed air cooling gun and was used to control the increase in temperature that was generated by the high test frequency.
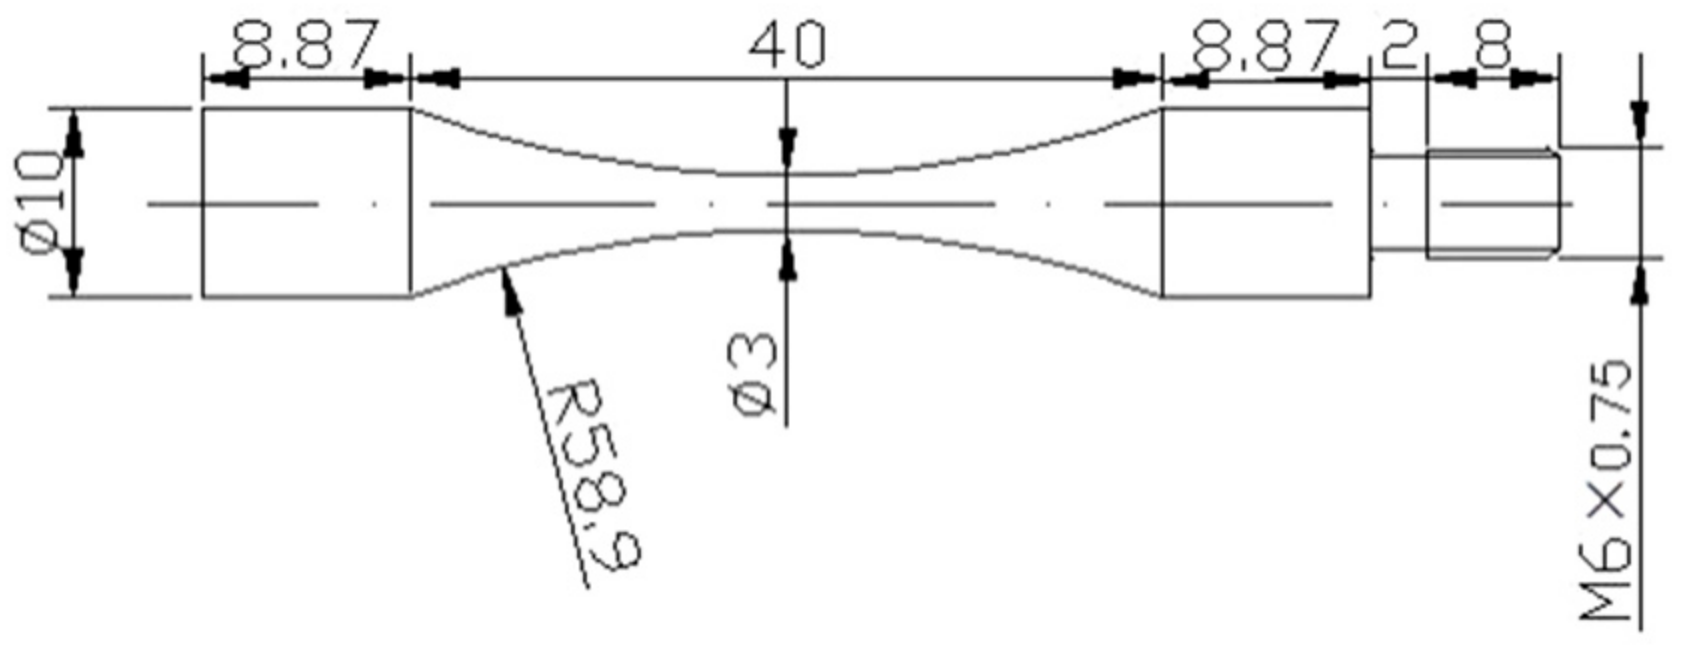
Considering that the amplifier and the specimen must work at resonance, the specimen geometry was designed using the elastic wave theory. Figure 2 and Figure 3 showed the geometries of the smooth and notch fatigue specimens and its dimensions, respectively. According to Peterson’s stress concentration factors [13], the stress concentration factor Kt of the notched specimen was equal to 2.67. Furthermore, finite element analysis (FEA) is a very useful tool to evaluate the effectiveness of the notch root stress, and the elastic stress concentration factor can be obtained. In the following stress analysis, ANSYS R18 software (Beijing, China) was used to calculate the elastic stress around the notch. The mesh was refined to a node spacing of 0.05 mm, as shown in Figure 4. The FEA showed that the stress concentration factor Kt was about 2.85, which was similar to that of Peterson’s solution.
3. Results
3.1. S–N Curves
The S–N curves for smooth and blunt-notched specimens are shown in Figure 5. The smooth and notched specimens still fail beyond 107 cycles, which corresponds to the cycle life of the conventional fatigue limit. It is indicated that there is no tradition fatigue limit for a TC21 titanium alloy, and it is dangerous to estimate fatigue limits using conventional fatigue strength data. As for smooth specimens, a step-wise characteristic can be observed in S–N curves over the wide range of the 105–109 cycle regimes. Surface cracks were initiated from the specimen surface in the regime of less than 106 cycles, while internal crack initiation occurred in the above-106 cycle regime. The transition of the crack initiation site existed in the plateau around 106 cycles. However, a continuous decrease in the S–N curve with a horizontal line shape was observed for blunt-notched specimens. The fatigue crack initiation site shifted from the specimen surface in the high cycle regime to the specimen subsurface in the very high cycle regime. At the same stress amplitude, fatigue life for the subsurface initiation was far higher than that for the surface initiation. It is clear that the fatigue life shows a large scatter for notched specimens. However, Qian [5] indicated that the notched specimens of high strength steel displays a continuous decrease in the S–N characteristic, which is owed to the crack initiation at the surface of notch root. Furthermore, the notch significantly decreased the fatigue property in the high cycle and very high cycle regimes, and the fatigue limit of the smooth specimen decreased from 430 MPa to 270 MPa for the notched specimen, respectively.
Considering that the smooth specimens with the diameter of 3 mm was smaller than that of notched specimens, the specimen size effect on the decrease of fatigue strength was not neglected in this experiment. The risk volumes of notched specimens, estimated as the region subjected to >90% of maximal stress, was larger than that of the smooth ones. Fatigue strength decreased in proportion to the increased risk volume [14]. On the other hand, the risk volume could be restricted at the notch root for the notched specimens, which have a smaller risk volume than that of smooth specimens with the same diameter. The investigation of the notch effect by using the same diameter specimens will carry to eliminate the specimen size effect in the future.
For a given fatigue life, the fatigue notch factor Kf is expressed by the following equation:
The Kf values are summarized in Table 1. The fatigue notch factor tends to be almost constant regardless of the number of cycles between the high cycle and very high cycle regime, which can be attributed to the fact that the fatigue strength of the smooth and notched specimens continuously decreased with the number of cycles and obtained VHCF limits above 2 × 10⁷ cycles. However, as for high strength steels, the very high cycle fatigue notch factor Kf can be lower than high cycle fatigue because the VHCF strength of high steels continuously decreases with the number of cycles, while the notched specimens obtained the VHCF limit [7].
3.2. SEM Observation of the Fracture Surface
Two different types of fatigue fracture of smooth specimens were observed. In Figure 6, the fatigue crack initiation occurs at the sample surface in the less than 106 cycles region, whereas subsurface crack initiation was exhibited in more than 106 cycles. The fine granular area (FGA) along the α lamellar was at the crack initiation site (Figure 7). The similar morphology of the TC21 titanium alloy was observed in other high-strength titanium alloys [11].
The typical fatigue crack initiation models of the notched specimens are shown in Figure 8, Figure 9, Figure 10 and Figure 11. Figure 8 shows that fatigue crack initiated from the specimen surface at a stress amplitude of 400 MPa, and multiple crack origins were displayed on specimen surface due to the high stress concentration at the notch root.
A flat facets characteristics was observed at the crack initiation site as the stress amplitude decreased to 350 MPa (Figure 9). Zuo et al. [15] indicated the flat facets resulted from the dislocation arrays pile-up at the α/β interfaces for titanium alloys with a lamellar microstructure.
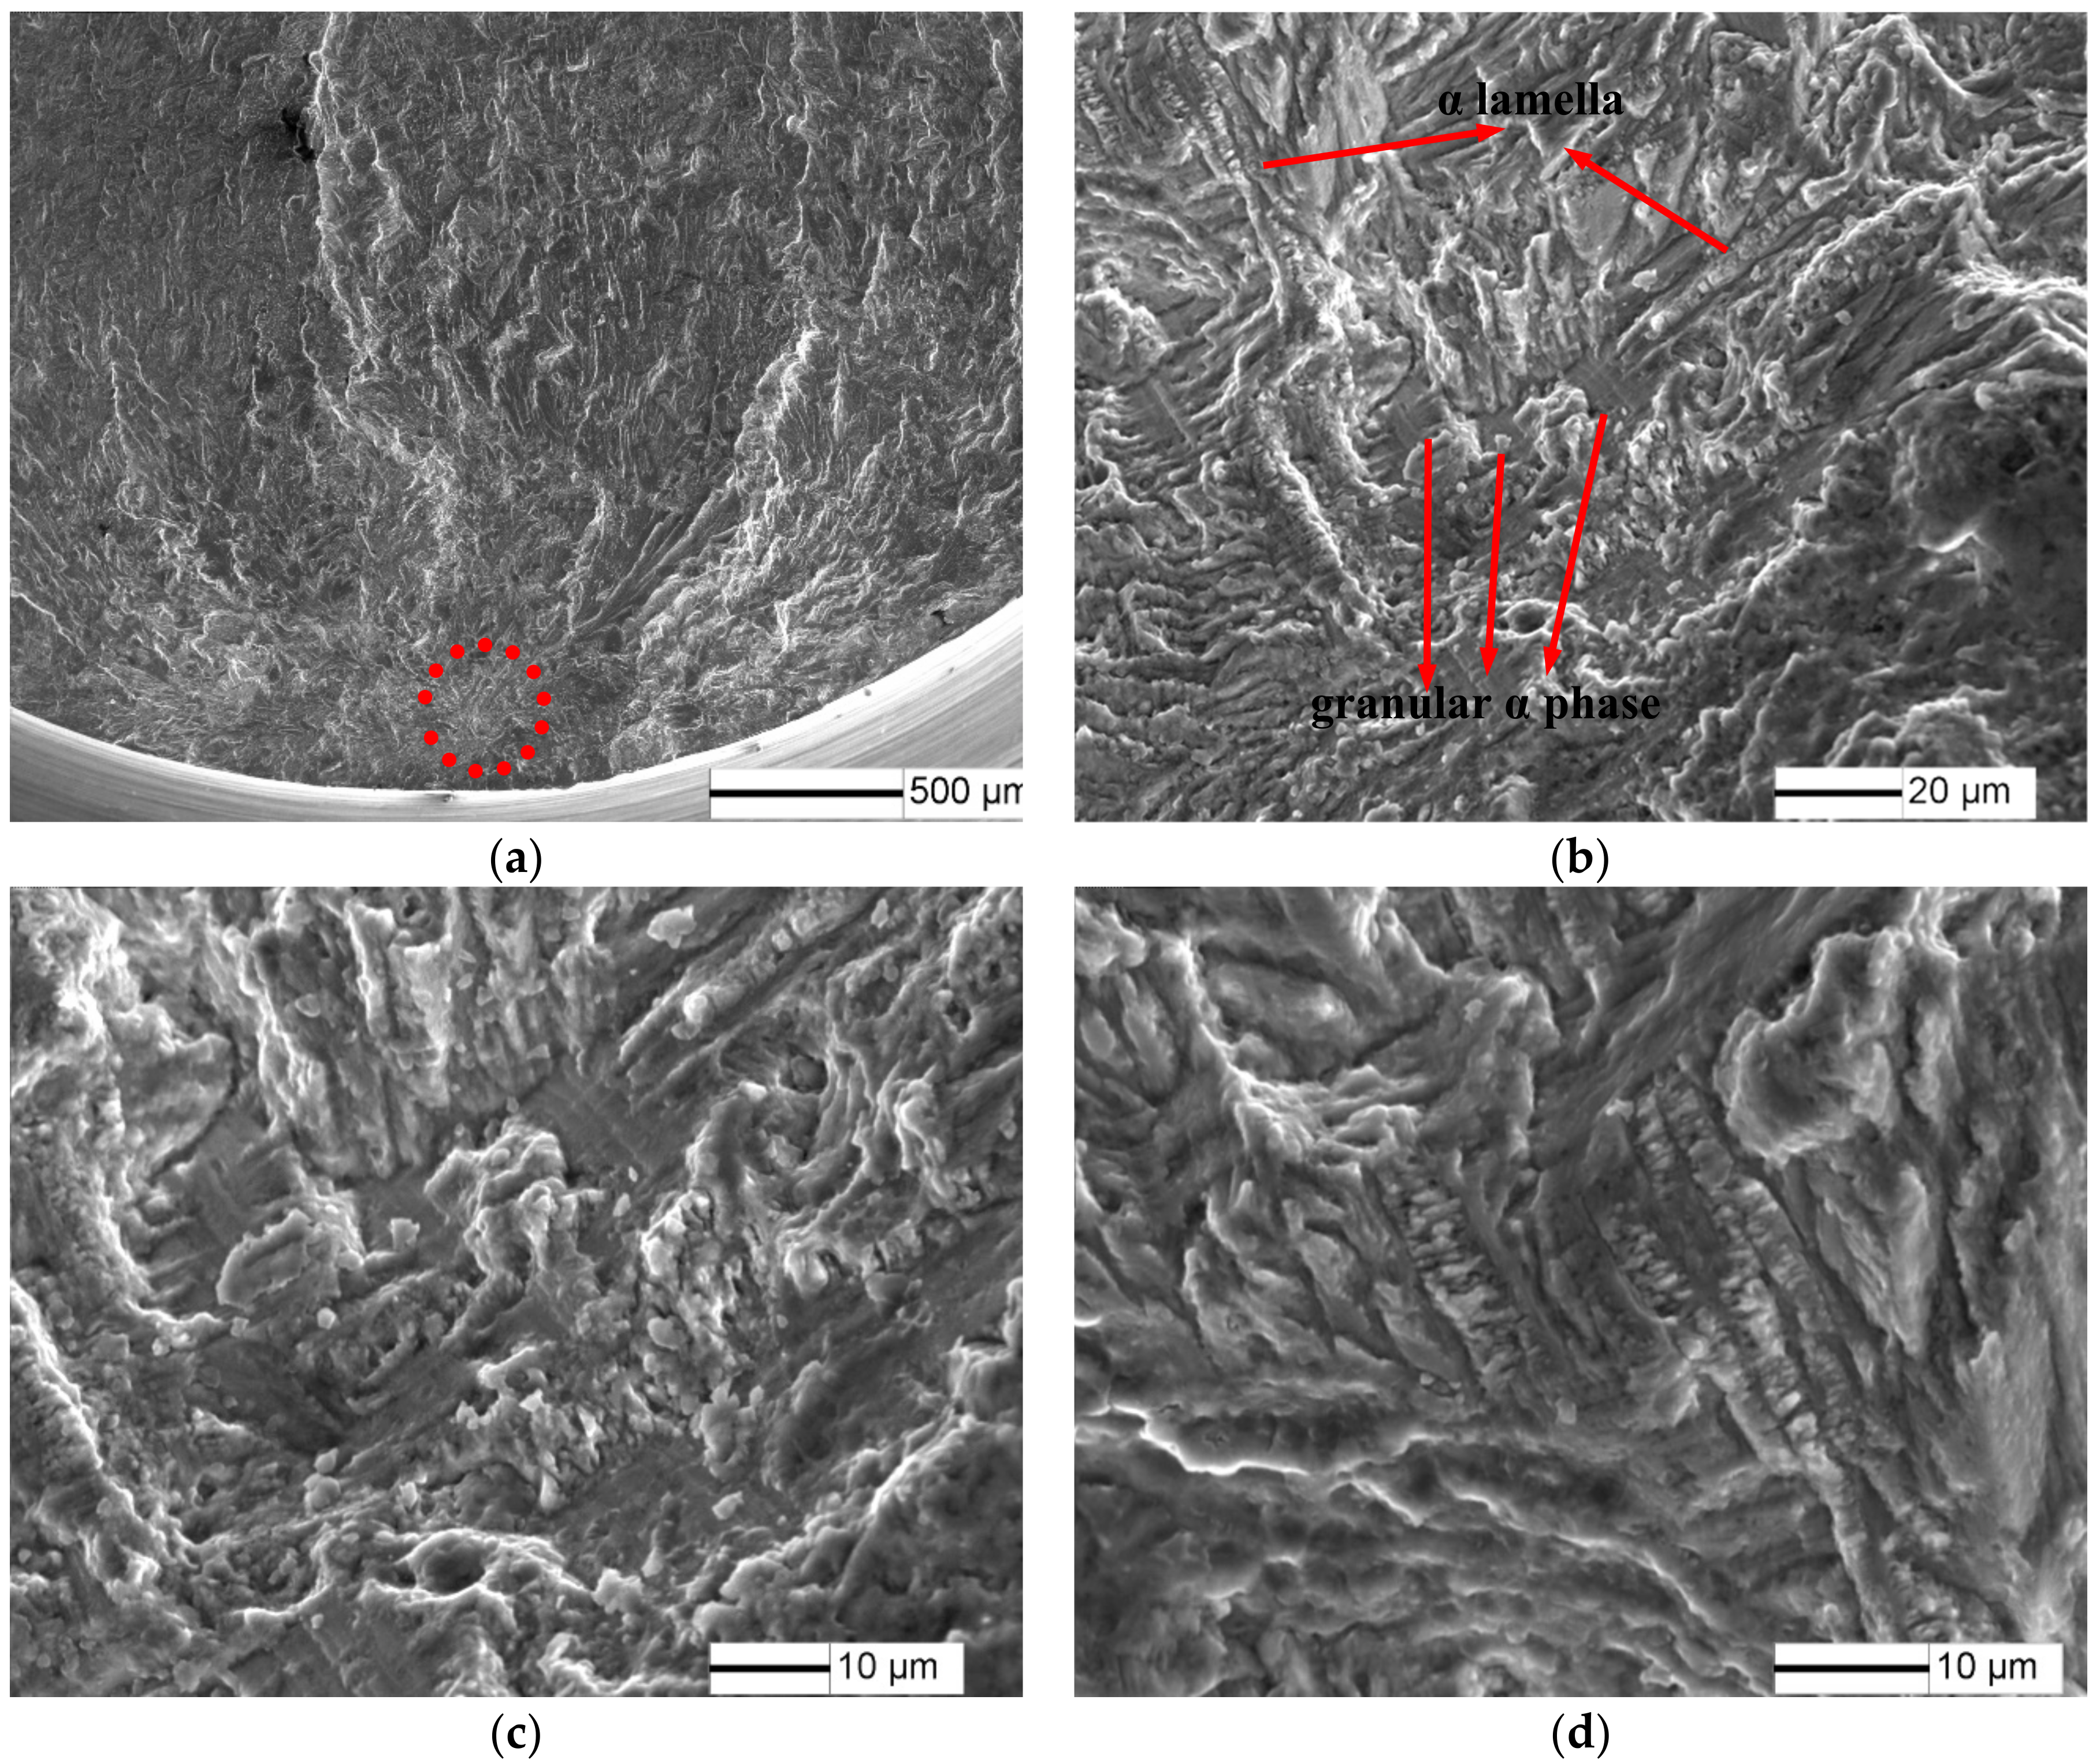
Other subsurface crack initiation characteristics with “facets + FGA” were revealed in notched specimens under a low-stress amplitude (Figure 10). It was indicated that the flat facets were formed by the separation of the granular α phase as the size of the flat facets were approximate to that of the granular α phase (Figure 10b,c). Furthermore, α/β lamellar characteristics were present at the vicinity of the flat facet where the fine grains were distributed on the α lamella (Figure 10d). A similar characteristic at crack initiation site was observed in the notched specimen of a Ti-8Al-1Mo-1V alloy [8]. Nakamura’s investigation [16] proposed that the morphology of the FGA can be formed regardless of materials when the next three conditions were satisfied: a vacuum environment, repeating contact of fracture surfaces, and long term loading over about 107 cycles. Furthermore, a wear process can take place due to the absence of oxygen, reducing the local crack closure effect. Thus, an arrested crack can propagate at a very slow rate. FGA characteristics of the specimens can result from the wear process.
However, the surface initiation mode can also be observed at a low stress amplitude. Figure 11 shows the fatigue crack initiated from the notch surface under a 250 MPa stress amplitude, and the crack-propagation character was associated with α/β lamellar microstructure that was generated by the subsequent low-stress fatigue.
4. Discussion
4.1. Fracture Mechanism of Notch Specimens
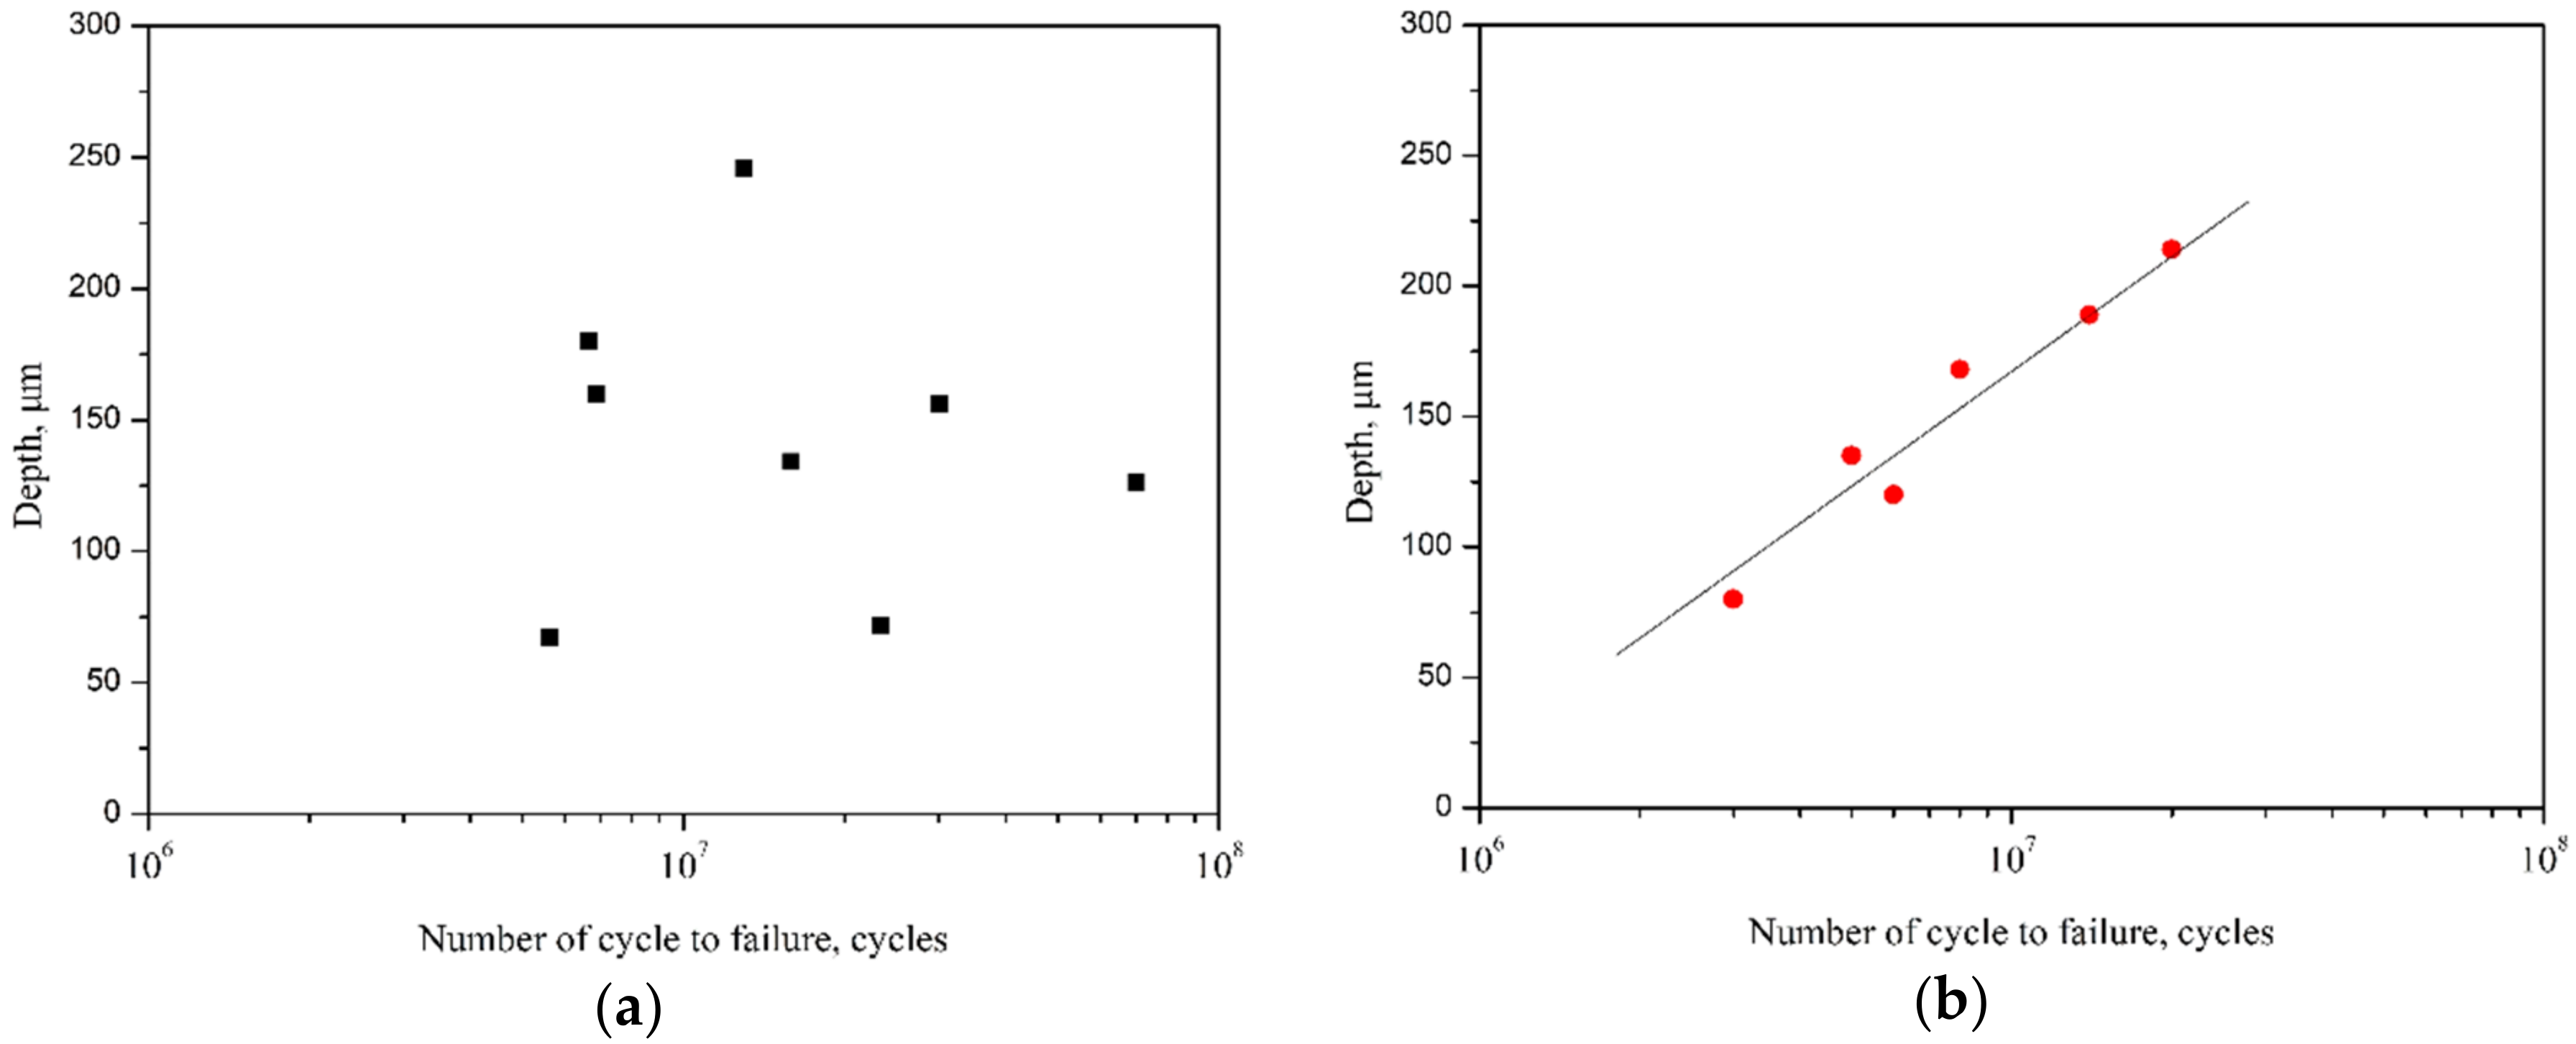
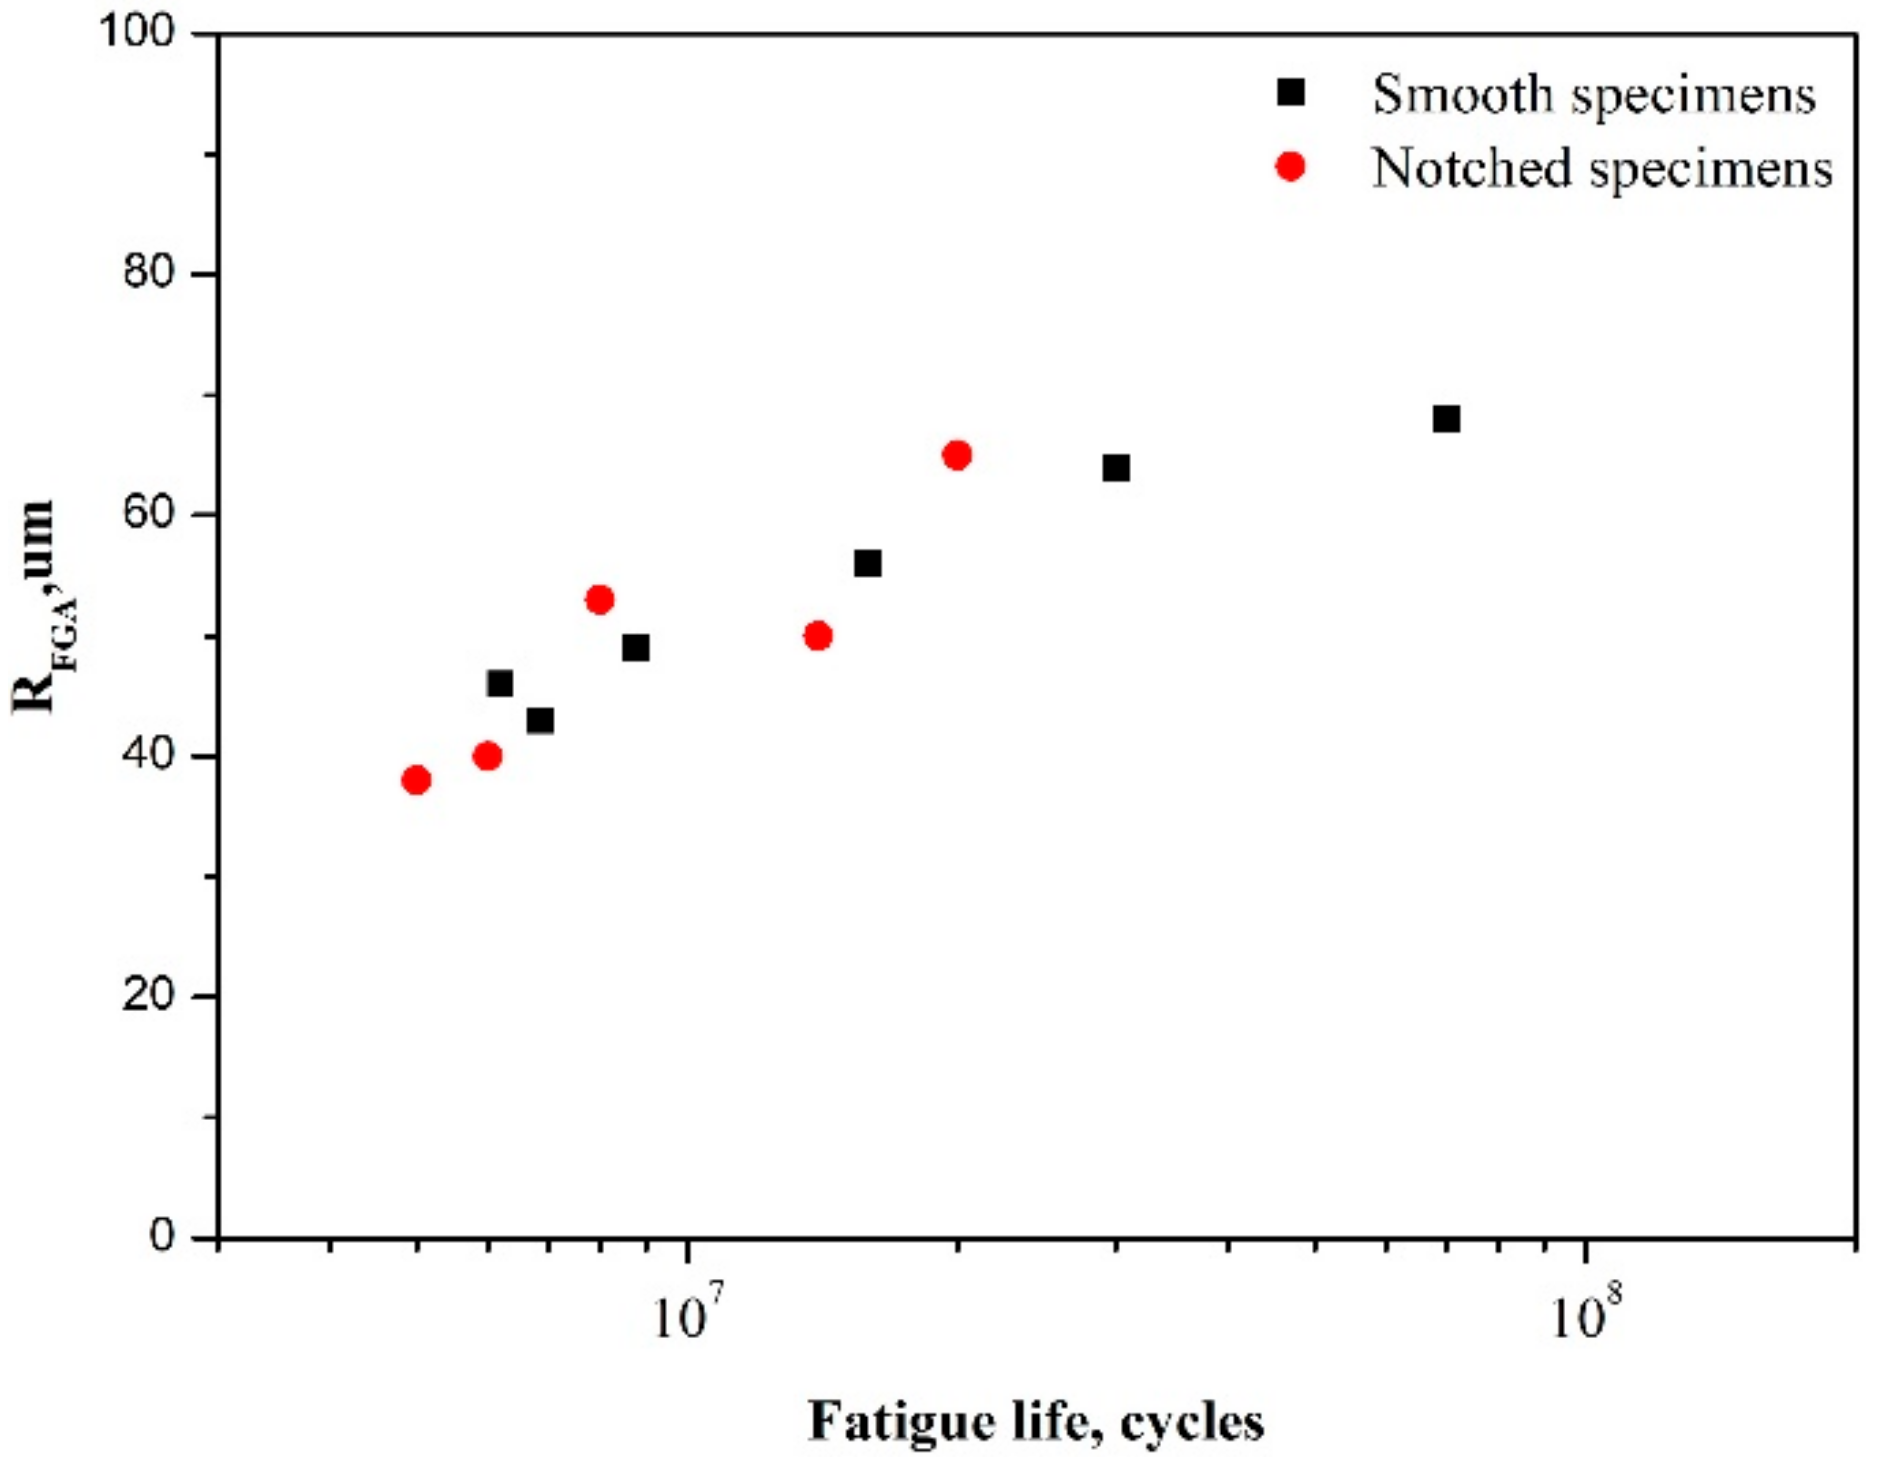
Figure 12 shows the relationship between the depth of the crack initiation site and the number of cycles to failure for both the notched and smooth specimens. For notched specimens, the distance was scattered over a range between 80 and 220 μm, and the fatigue life increased with the increase in crack initiation site depth. However, the depth of the crack initiation site was independent of the fatigue life for smooth specimens, indicating that the crack initiation site was randomly distributed under the uniform distribution of the axial stress. Figure 13 indicates that the fatigue life increased with the size of the FGA in both the smooth and notched specimens, ranging from 40 μm to 68 μm. As mentioned above, the fatigue life in the very high cycle regimes may have been mainly consumed in the wear process of the FGA.
Based on the formula of the equivalent stress range defined by Chapetti [17], the equivalent stress range of the subsurface crack in the range of blunt notch can be modified as:
where a is the distance from the subsurface crack initiation site to notch root surface, ρ is the radius of notch root, and d is the subsurface crack initiation size which can be obtained by fracture observation. According to Equation (2), the stress gradient of the blunt notch accelerated the fatigue crack initiation. The stress range was smaller at farther distances from the crack initiation site to notch root surface, thus resulting in the longer fatigue life.
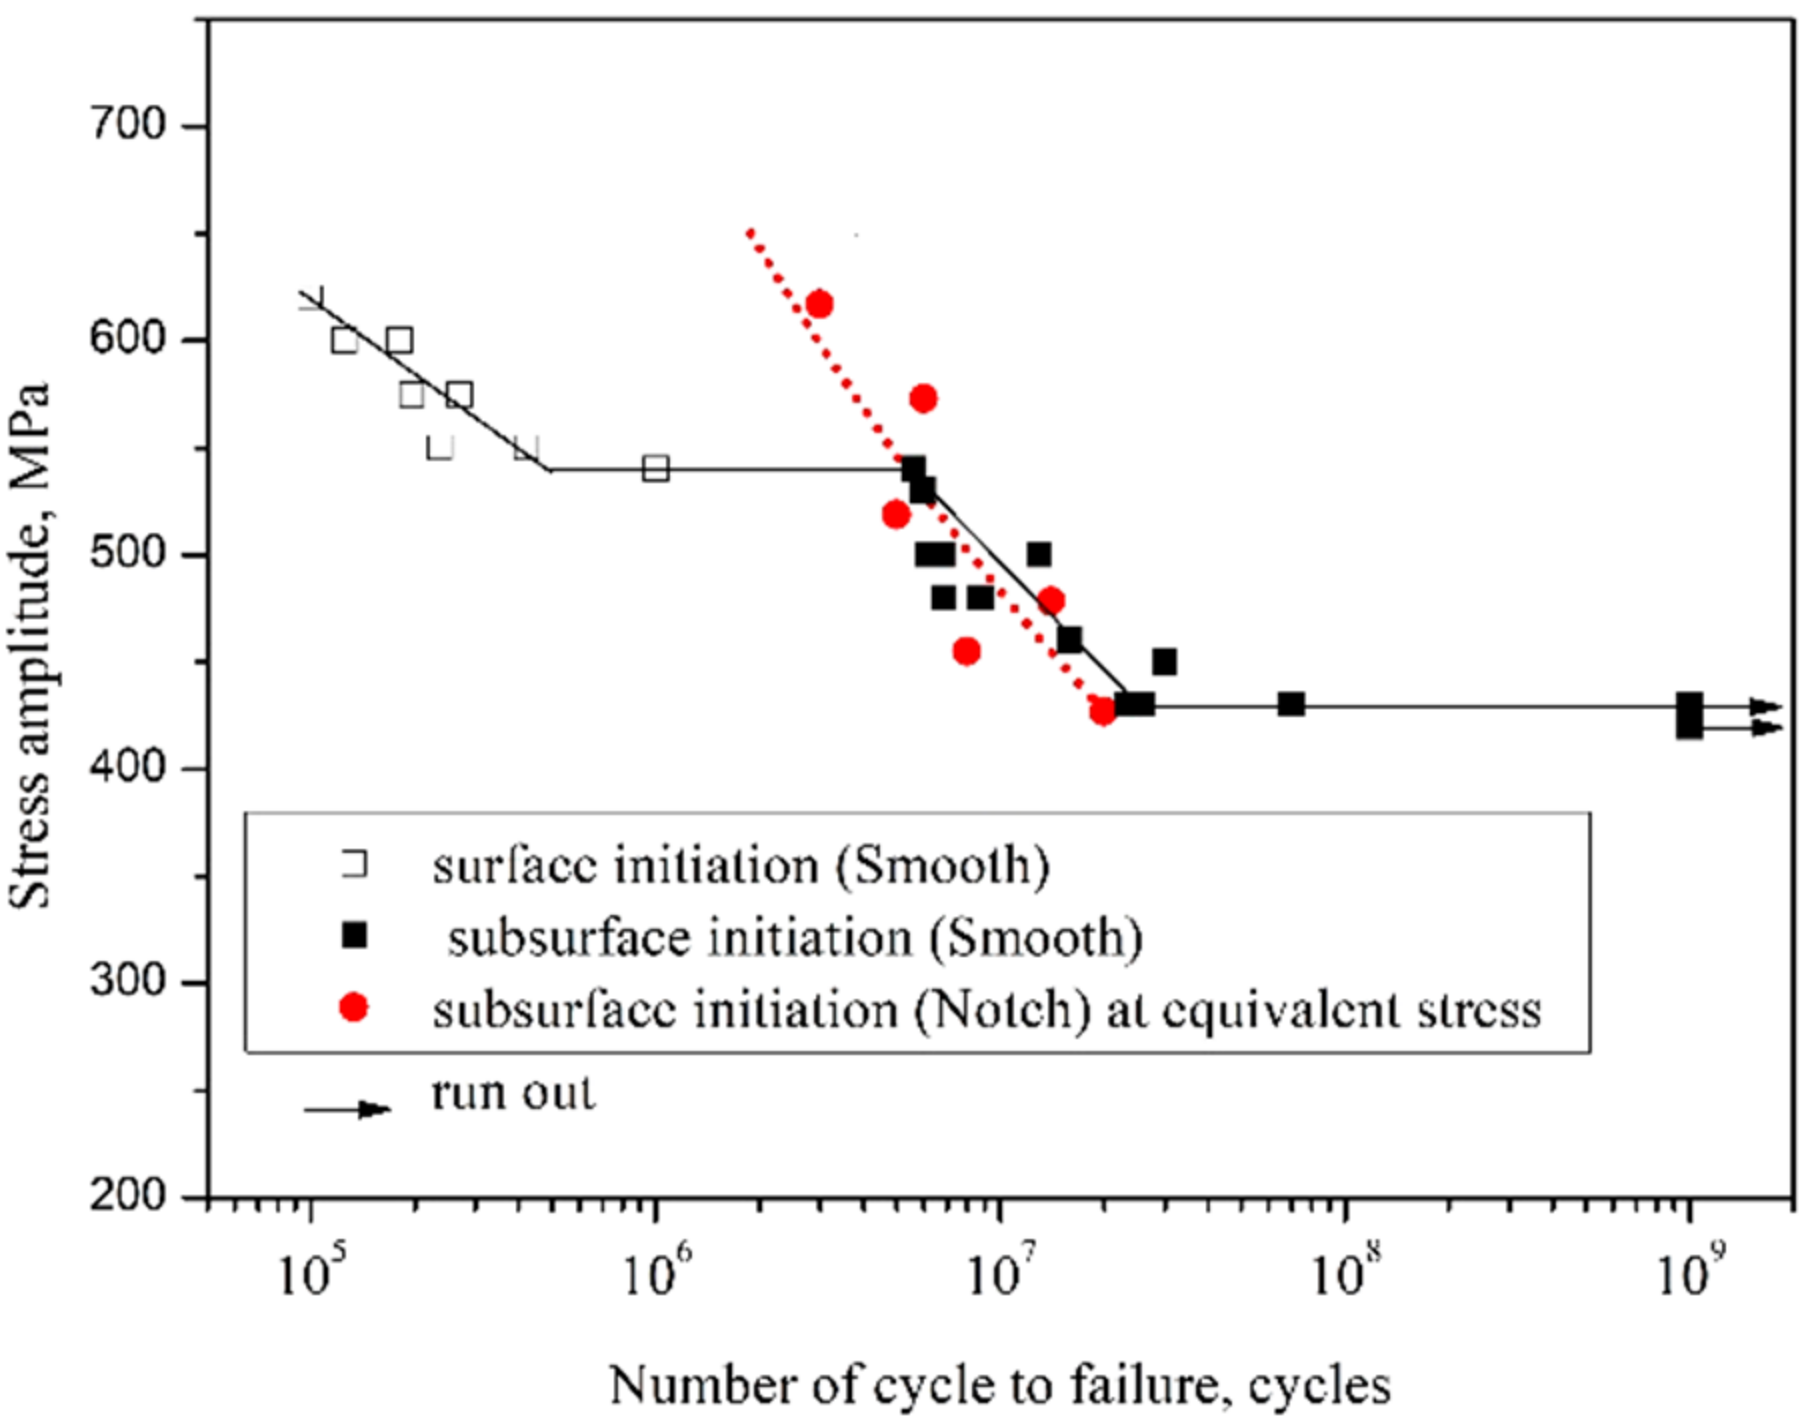
Based on the SEM observation, the equivalent stress at the subsurface crack initiation site can be calculated using Equation (2). S–N curves of smooth specimens and notched specimens for the equivalent stress are shown Figure 14. It is indicated that fatigue life of subsurface crack initiation was similar for both the smooth and notched specimens for equivalent stress. However, the subsurface initiation life of notched specimens was far longer than that of surface initiation for smooth specimens when both specimens were under the equivalent stress.
According to the Murakami model [18], the stress intensity factor range at the FGA front can be calculated using:
where Δσ is the stress amplitude range and is the area of the crack initiation.
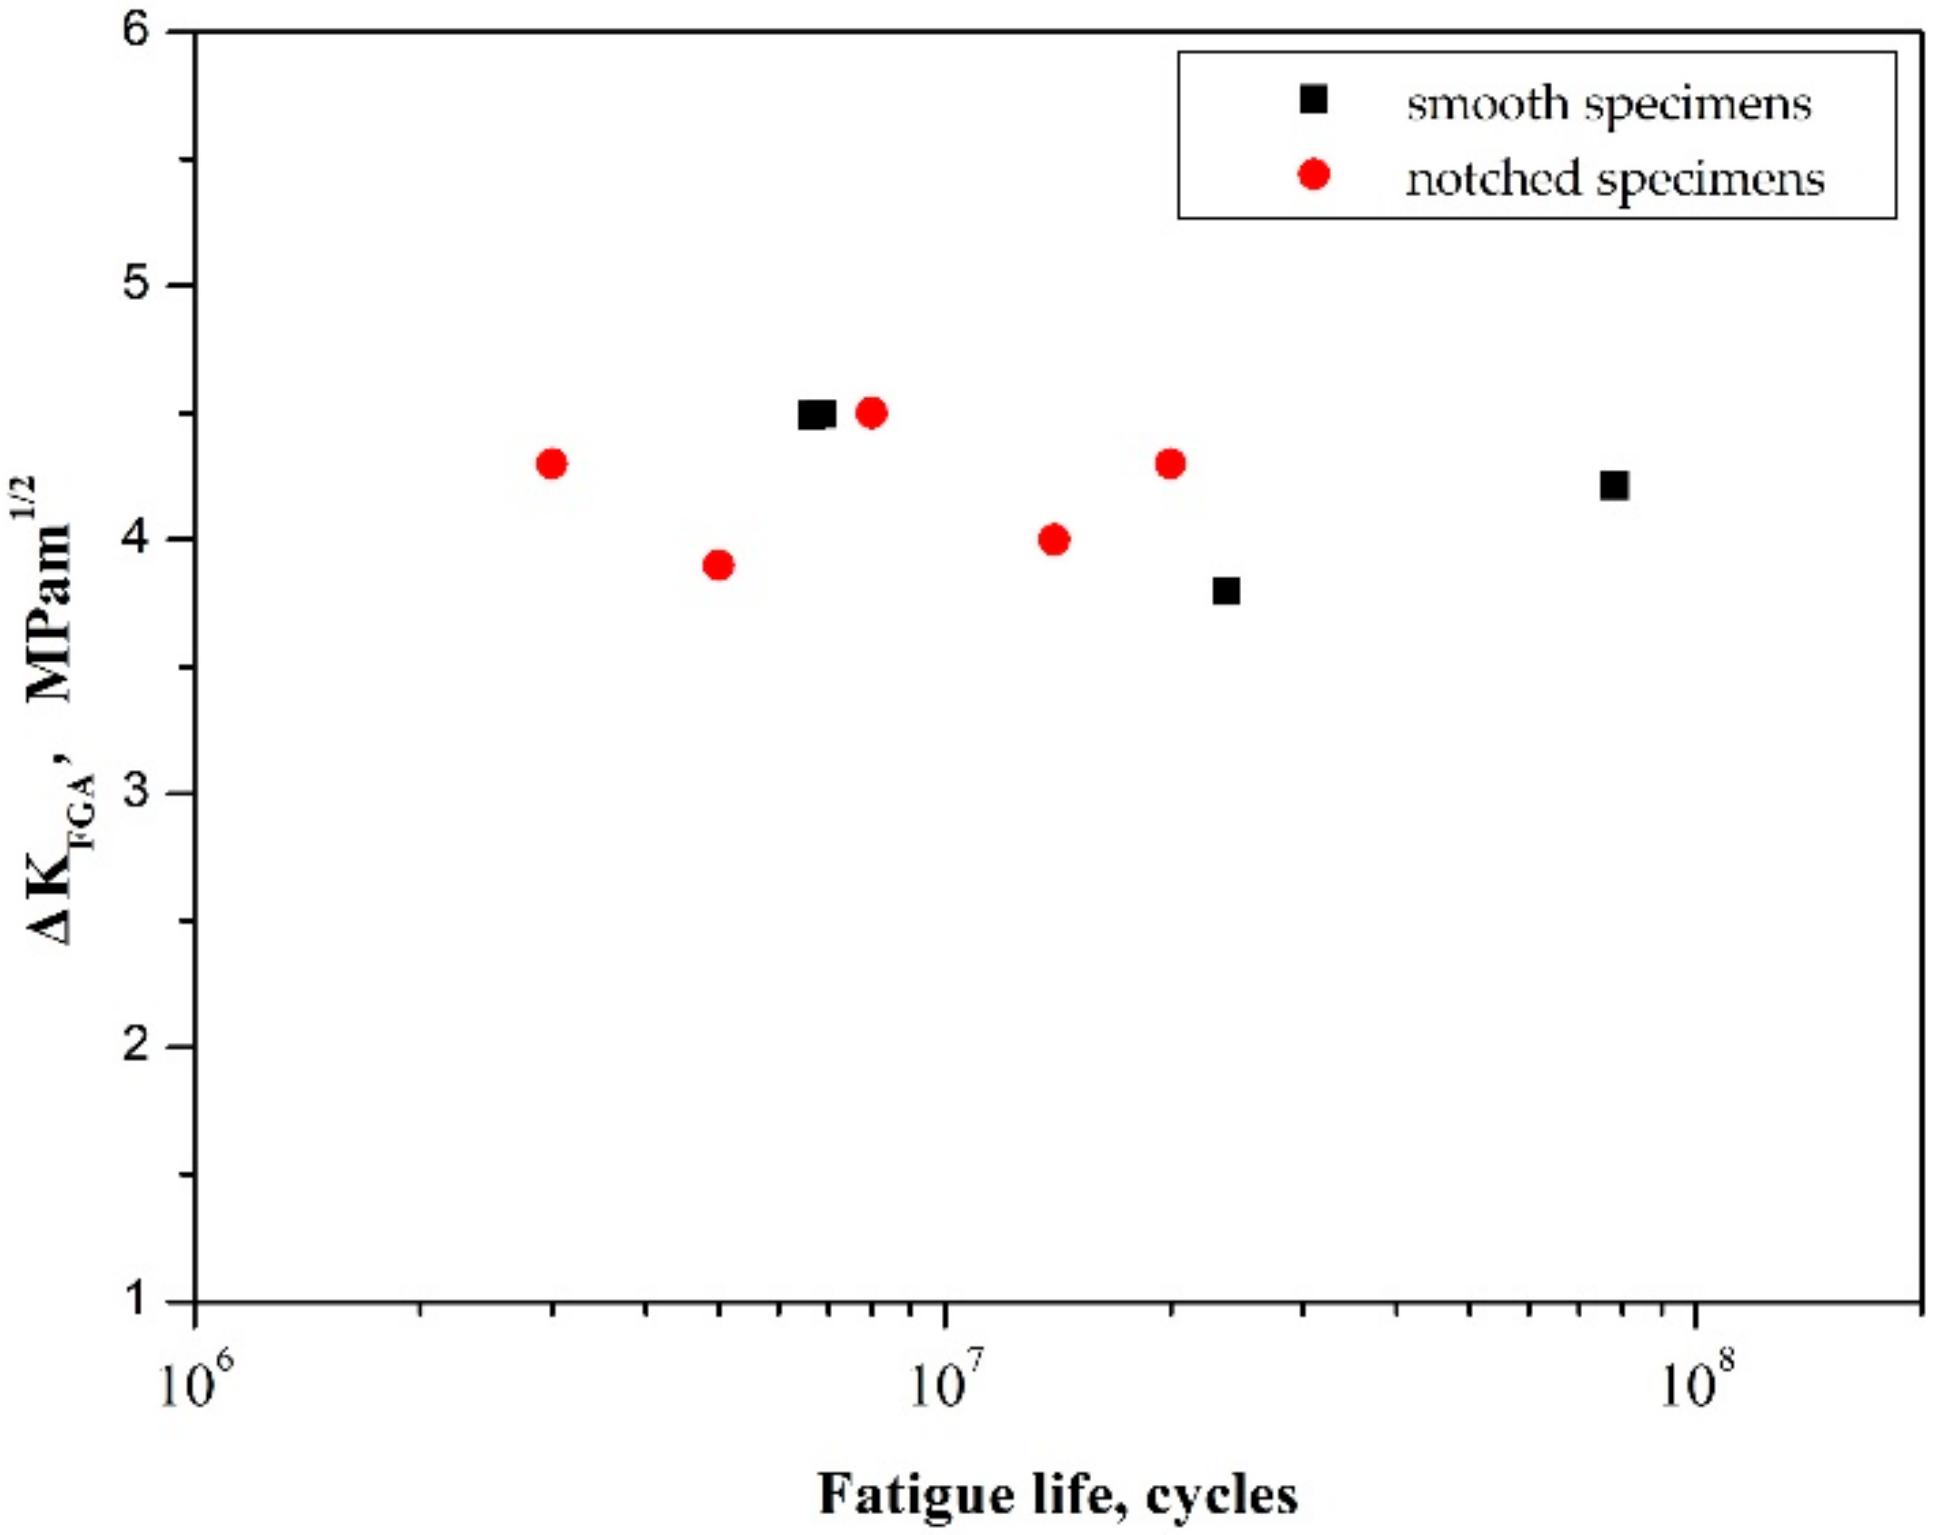
In ultrasonic fatigue with a mean load equal to zero (R = −1), ΔKFGA is estimated by substituting the stress amplitude, σa, into Equation (3) instead of Δσ as only the tensile part of the cycle affects the fatigue crack propagation [19]. Figure 15 shows the both the smooth and notched specimens had the scattering zone of ΔKFGA value ranged from 3.8 MPa·m1/2 to 4.5 MPa·m1/2, which can be considered as the threshold for the crack growth ΔKth [3].
It can be supposed that the VHCF crack initiation resulted from the interaction between the notch stress and heterogeneous microstructure. Under a relatively high stress amplitude, the stress that was introduced by the notch root was high enough to promote the formation of multiple cracks (Figure 8), which was similar to the characteristics of the low-cycle fatigue. However, when the specimens were in the elastic state under a low-stress amplitude, the VHCF crack was inclined to initiate from the interior of the specimens due to the fact that the frequency of the heterogeneous microstructure in the internal specimens was far higher than that of the specimen’s surface. On the other hand, the stress gradient of the notch had a significant influence on the crack initiation. According to Equation (2), the equivalent stress decreased with the increase in the distance to the notch root, and the VHCF crack initiation tended to occur at the specimen subsurface due to the high equivalent stress. When the heterogeneous microstructure, such as the coarse α/β lamellar and granular α phase cluster was present at the subsurface specimens, the subsurface crack initiation occured owing to the interaction between the heterogeneous microstructure and the stress gradient of the notch (Figure 9 and Figure 10). Thus, the subsurface initiation depth to the notch root randomly ranged from 80 μm to 220 μm (Figure 12). As ΔKinitiation was larger than ΔKth, the crack continuously propagated based on Paris’ law for both smooth and notched specimens.
4.2. Fatigue Limit Prediction Based on the Theory of Critical Distance
The theory of critical distance was assumed to estimate the fatigue limit based on the stress distribution around the notch. There are different manifestations of the TCD, such as the point method (PM) and line method (LM), which obtain a similar fatigue strength prediction result. As for the PM, the effective stress range ∆σeff at the critical distance around the notched specimens was equal to the stress range in smooth specimens, ∆σ0, and the formula can be expressed as follows [20]:
where θ, r are the polar coordinates, ∆σy is the axial stress range distribution along the x-axis and LPM is the critical distance in the point method.
According to TCD, the critical distance in the point method LPM can be estimated by a0/2, and a0 is the El Haddad parameter defined as [18]:
where Y is the geometry factor of the internal crack, and ΔKth is the threshold for the crack growth.
The fatigue limit stress at the 109 cycles, ∆σ0, was 430 MPa obtained by the smooth specimen fatigue test results, and the threshold value of the stress intensity factor range could be regarded as 4.0 MPam1/2 [3]. The critical distance for the very high cycle fatigue LPM = a0/2 was equal to 23.5 μm for the TC21 titanium alloy.
However, the VHCF crack was inclined to initiate in the subsurface of notch, and the effective stress range ∆σeff at the critical distance should include the distance from crack initiation site to notch root a. Thus, Equation (4) can be modified to become:
Considering the effect of the stress triaxiality in the case of notched specimens, the fatigue damage depends on the shear stress amplitude, τa, and on the maximum normal stress, σn,max, relative to the critical plane, which is defined as the plane experiencing the maximum shear stress amplitude [21]:
where τa is the shear stress amplitude relative to the materials plane experiencing the maximum shear stress amplitude, σn,max is the maximum stress perpendicular to this plane, and m1 is the material constant.
Thus, Equation (6) can be modified as follows:
In the above equation, the parameters m1 and ∆τ−1 can be calculated using the fatigue limits ∆σ−1 and ∆σ0 for R = −1 and R = 0, respectively [21]:
As for the TC21 alloy, ∆σ0 can be estimated using the Goodman equation, and was about 358 MPa based on ∆σ−1 = 430 MPa, and the parameters of m1 and ∆τ−1 were about 36 MPa and 251 MPa, respectively. The shear stress amplitude, τa, and the maximum normal stress, σn,max, can be calculated using finite element methods for the notched specimens with Kt = 2.67. Considering that the subsurface cracks may initiate at different sites, for example, the distance to the specimen surface was 0 μm, 100 μm, 200 μm, and 400 μm. According to Equation (8), fatigue limits of the notched specimen ranged from 194 MPa to 430 MPa, which corresponded to the surface crack initiation and internal crack initiation without the notch effect. Fatigue limits increased with the increase in the distance from subsurface initiation site to the notch root surface. Therefore, the VHCF property displayed a large scatter when the fatigue crack initiation site was located at different depths to the notch root surface. However, the crack initiation was inclined to occur at the subsurface of the notched specimen, as discussed in Section 4.1. Furthermore, Figure 10 shows that the distance from the subsurface crack initiation site to notch root surface was about 200 μm, and the fatigue limit of the notched specimen with Kt = 2.67 was calculated to be 263 MPa, which was consistent with the experimental result.
5. Conclusions
The conclusions are summarized as follows:
- (1)
- The S–N curve of the blunt-notched specimens illustrated a continuous decrease characteristic with a horizontal line over the 105–109 cycle regimes. The crack initiation modes, including surface initiation, subsurface with flat facet, and subsurface with “facet + fine granular area,” were observed at a low stress amplitude for the blunt-notched specimen, which was attributed to the interaction of the notch stress gradient and the microstructure.
- (2)
- The notch significantly decreased the fatigue property in the very high cycle regime, and the fatigue property showed a large scatter, as the fatigue crack initiated at the different depth site around the notch. Fatigue life increased with the increase in the crack initiation depth. The scatter of the fatigue property should be carefully considered in fatigue design.
- (3)
- The fatigue fracture mechanism was discussed based on the interaction of the notch stress gradient and the characteristic of the FGA for the notched specimens. Furthermore, the very high cycle fatigue limits of blunt-notched specimens were predicted based on the TCD method and the stress triaxiality effect.
Author Contributions
Z.Z. and D.C. conceived and designed the experiments; G.G., J.Z., and Y.M. performed the experiments; B.N. analyzed the data and wrote the paper.
Funding
This work was supported by the technological development of Guangdong (2017A010103029), scientific and technological program of Foshan (2017AB003941), “5511” project driven innovation program of Yichun City, The key project of department of education of Guangdong province (No. 2016GCZX008), the funding project of the university key platform of the Guangdong provincial education department (gg041002).
Conflicts of Interest
The authors declare no conflicts of interest.
References
- Zheng, Y.; Zhao, Z.H.; Zhang, Z.; Zong, W.; Dong, C. Internal crack initiation characteristics and early growth behaviors for very-high-cycle fatigue of a titanium alloy electron beam welded joints. Mater. Sci. Eng. A 2017, 706, 311–318. [Google Scholar] [CrossRef]
- Nie, B.; Zhao, Z.; Ouyang, Y.; Chen, D.; Chen, H.; Sun, H.; Liu, S. Effect of low cycle fatigue predamage on very high cycle fatigue behavior of TC21 titanium alloy. Materials 2017, 10, 1384. [Google Scholar] [CrossRef] [PubMed]
- Oguma, H.; Nakamura, T. The effect of microstructure on very high cycle fatigue properties in Ti-6Al-4V. Scr. Mater. 2010, 63, 32–34. [Google Scholar] [CrossRef]
- Haritos, G.K.; Nicholas, T.; Lanning, D.B. Notch size effects in HCF behavior of Ti-6Al-4V. Int. J. Fatigue 1999, 21, 643–652. [Google Scholar] [CrossRef]
- Qian, G.A.; Hong, Y.S.; Zhou, C.G. Investigation of high cycle and very-high-cycle fatigue behavors for a structural steel with smooth and notched specimens. Eng. Fail. Anal. 2010, 17, 1517–1525. [Google Scholar] [CrossRef]
- Schwerdt, D.; Pyttel, B.; Berger, C. Fatigue strength and failure mechanisms of wrought aluminium alloys in the VHCF-region considering material and component relevant influencing factors. Int. J. Fatigue 2011, 33, 33–41. [Google Scholar] [CrossRef]
- Akiniwa, Y.; Miyamoto, N.; Tsuru, H.; Tanaka, K. Notch effect on fatigue strength reduction of bearing steel in the very high cycle regime. Int. J. Fatigue 2006, 28, 1555–1565. [Google Scholar] [CrossRef]
- Yang, K.; Zhong, B.; Huang, Q.; He, C.; Huang, Z.Y.; Wang, Q.Y.; Liu, Y.J. Stress ratio effect on notched fatigue behavior of a Ti-8Al-1Mo-1V alloy in the very high cycle fatigue regime. Int. J. Fatigue 2018, 116, 80–89. [Google Scholar] [CrossRef]
- Chapetti, M.D. Prediction of the fatigue limit of blunt-notched components. Int. J. Fatigue 2001, 23, S171–S176. [Google Scholar] [CrossRef]
- Lanning, D.B.; Nicholas, T.; Haritos, G.K. On the use of critical distance theories for the prediction of the high cycle fatigue limit stress in notched Ti-6Al-4V. Int. J. Fatigue 2005, 27, 45–57. [Google Scholar] [CrossRef]
- Bathias, C. Piezoelectric fatigue testing machines and devices. Int. J. Fatigue 2006, 28, 1438–1445. [Google Scholar] [CrossRef]
- Yang, K.; He, C.; Huang, Q.; Huang, Z.Y.; Wang, C.; Wang, Q.Y.; Liu, Y.L.; Zhong, B. Very high cycle fatigue behaviors of a turbine engine blade alloy at various stress ratios. Int. J. Fatigue 2017, 99, 35–43. [Google Scholar] [CrossRef]
- Pilkey, W.D.; Pilkey, D.F. Peterson’s Stress Concentration Factors, 3rd ed.; John Wiley & Sons, Inc.: Hoboken, NJ, USA, 2008; p. 99. [Google Scholar]
- Furuya, Y. Specimen size effects on gigacycle fatigue properties of high-strength steel under ultrasonic fatigue testing. Scr. Mater. 2008, 58, 1014–1017. [Google Scholar] [CrossRef]
- Zuo, J.H.; Wang, Z.G.; Han, E.H. Effect of microstructure on ultra-high cycle fatigue behavior of Ti-6Al-4V. Mater. Sci. Eng. A 2008, 473, 147–152. [Google Scholar] [CrossRef]
- McEvily, A.J.; Nakamura, T.; Oguma, H.; Yamashita, K.; Matsunaga, H.; Endo, M. On the mechanism of very high cycle fatigue in Ti–6Al–4V. Scr. Mater. 2008, 59, 1207–1209. [Google Scholar] [CrossRef]
- Chapetti, M.D.; Kitano, T.; Tagawa, T.; Miyata, T. Fatigue limit of blunt-notched components. Fatigue Fract. Eng. Mater. Struct. 1998, 21, 1525–1536. [Google Scholar] [CrossRef]
- Murakami, Y.; Endo, M. Effects of defects, inclusion and inhomogeneities on fatigue strength. Fatigue 1994, 16, 163–182. [Google Scholar] [CrossRef]
- Nie, B.H.; Zhang, Z.; Zhao, Z.H.; Zhong, Q.P. Very high cycle fatigue behavior of shot peening 3Cr13 high strength spring steel. Mater. Des. 2013, 50, 503–508. [Google Scholar] [CrossRef]
- Susmel, L. High-cycle fatigue of notched plain concrete. Proced. Struct. Integr. 2016, 1, 2–9. [Google Scholar] [CrossRef]
- Araujo, J.A.; Susmel, L.; Taylor, D.; Ferro, J.C.T.; Mamiya, E.N. On the use of the Theory of Critical Distances and the Modified WÖhler Curve Method to estimate fretting fatigue strength of cylindrical contacts. Int. J. Fatigue 2007, 29, 95–107. [Google Scholar] [CrossRef]
Figure 1.
Basketweave microstructure of the TC21 titanium alloy: (a) optical micrograph and (b) backscattered electron micrograph.
Figure 1.
Basketweave microstructure of the TC21 titanium alloy: (a) optical micrograph and (b) backscattered electron micrograph.

Figure 2.
Shape and dimensions of the smooth specimens (units: mm).

Figure 3.
Shape and dimensions of the notch specimens (units: mm).
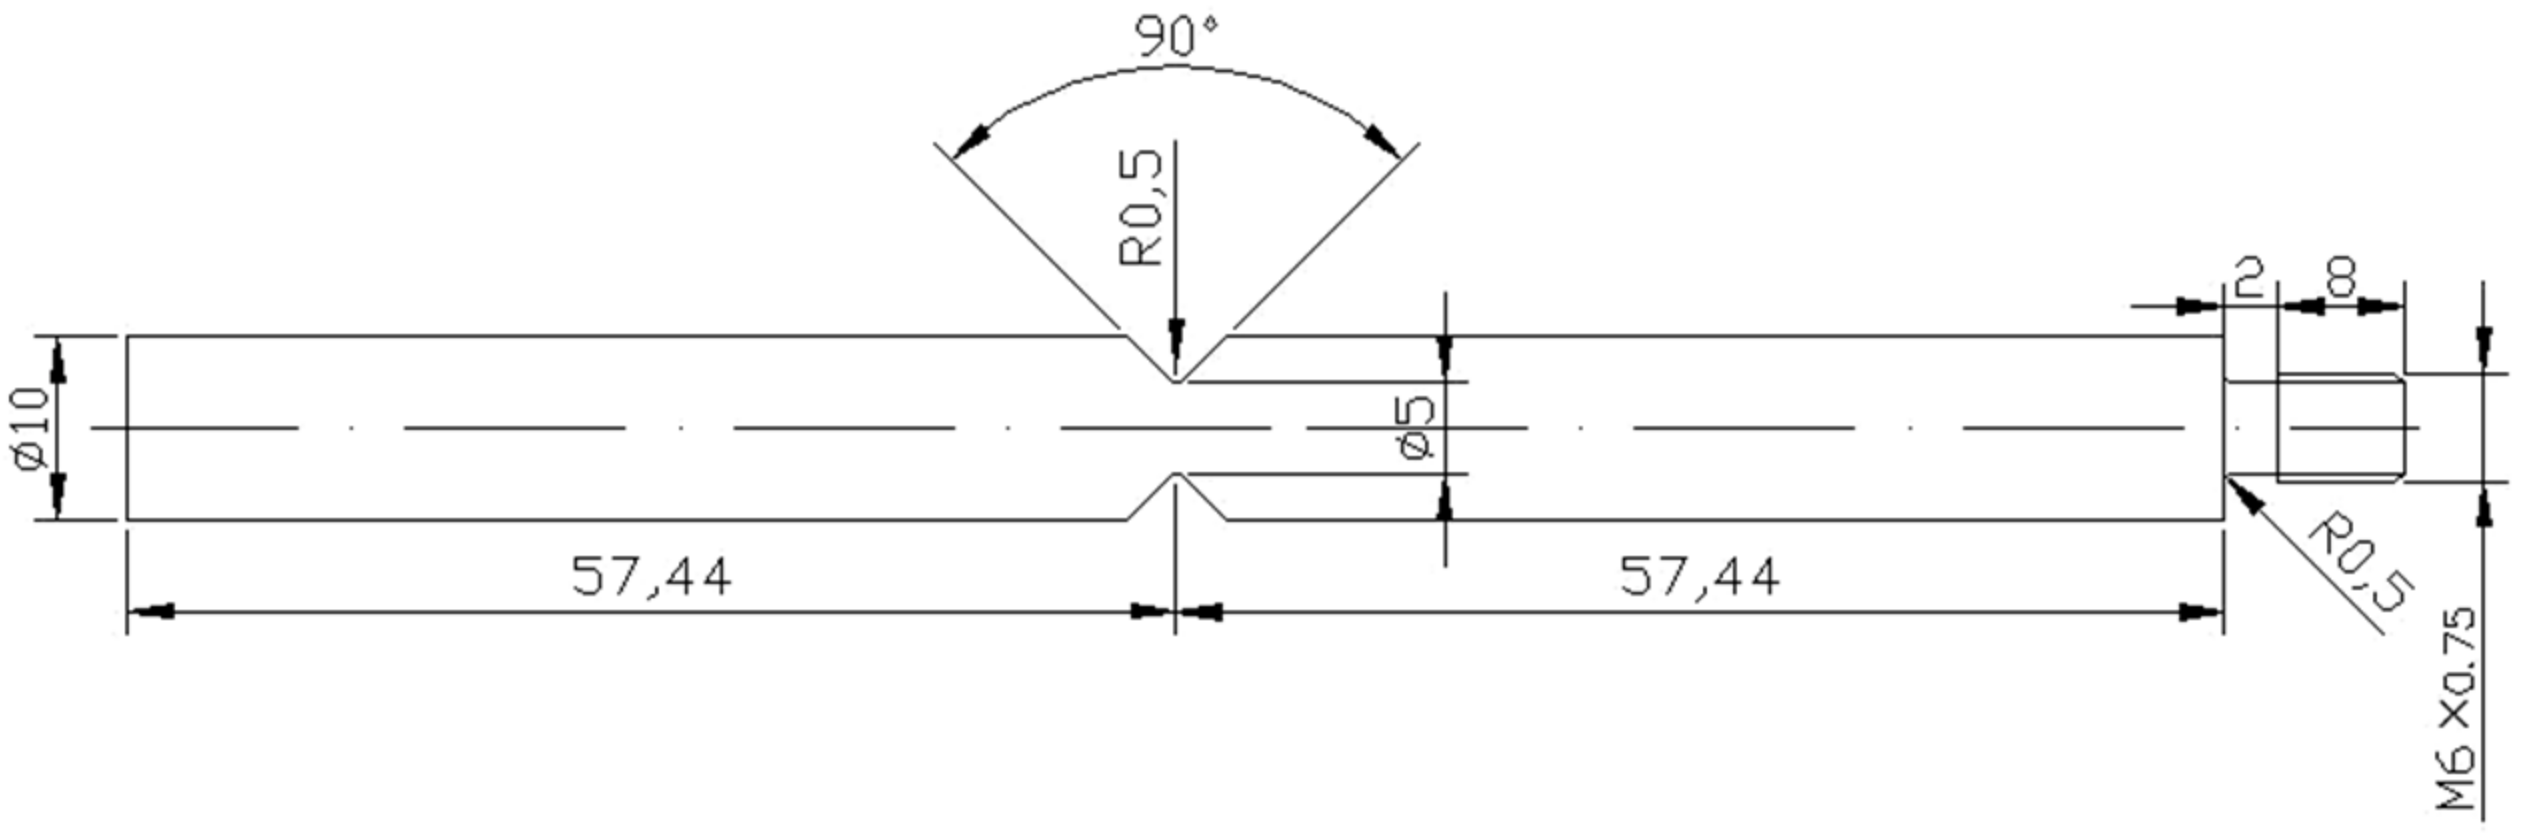
Figure 4.
The stress concentration factor Kt was calculated using the finite element model.
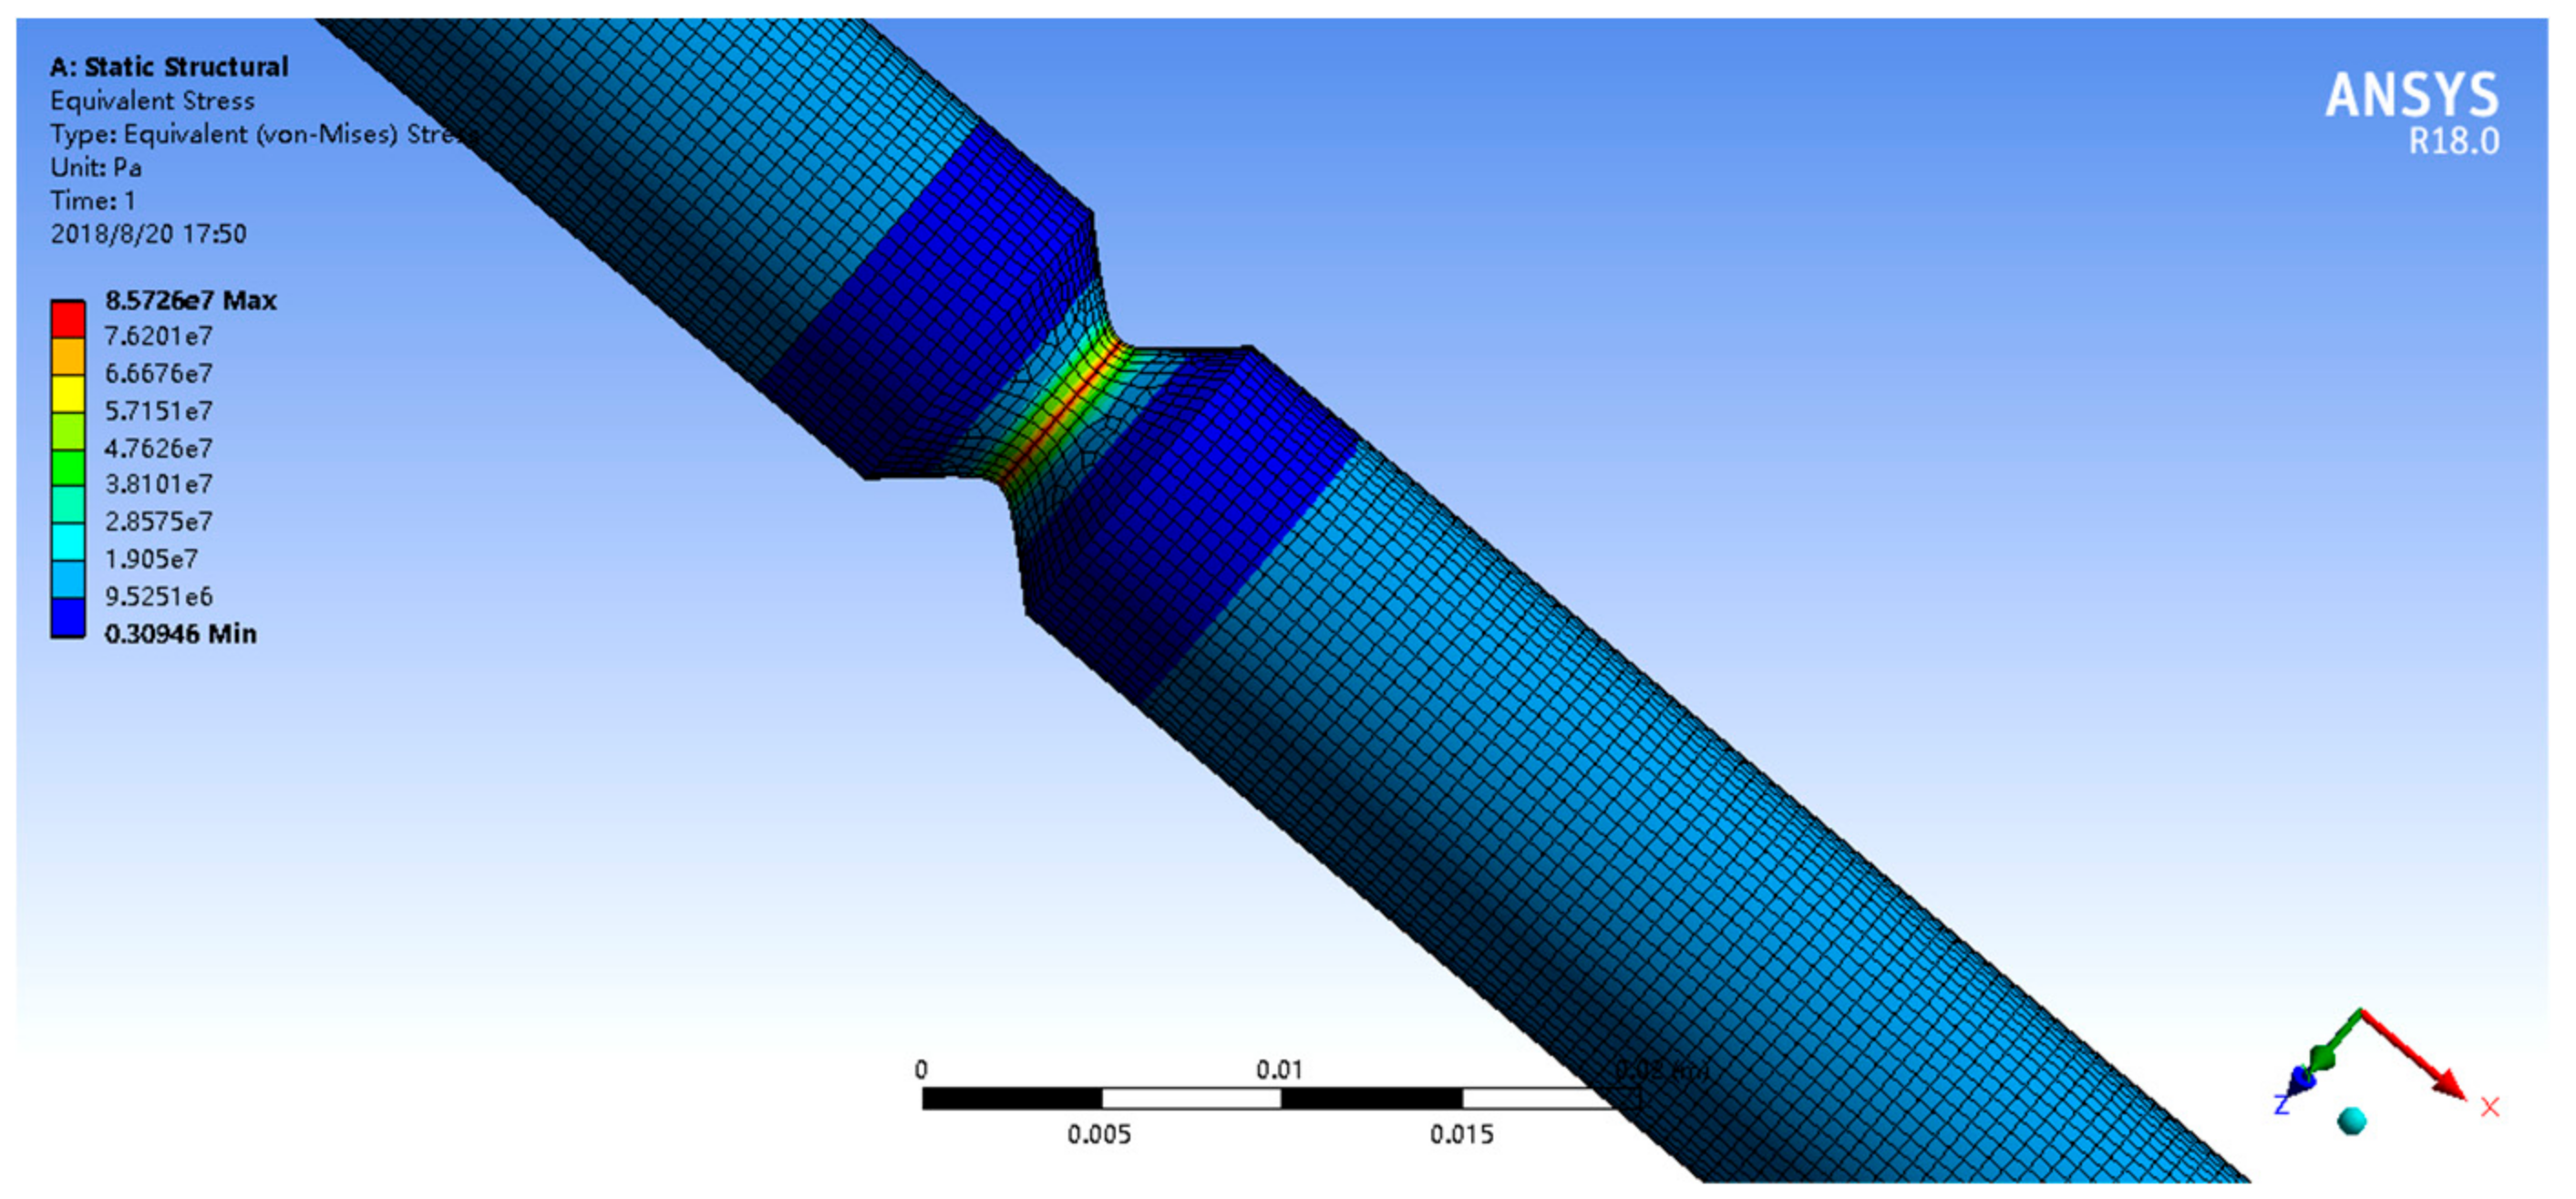
Figure 5.
S–N curves for smooth and notched specimens of TC21 titanium alloys (arrows denote the run-out specimens).
Figure 5.
S–N curves for smooth and notched specimens of TC21 titanium alloys (arrows denote the run-out specimens).

Figure 6.
Fatigue fracture surface of TC21 titanium alloy at σ = 550 MPa and N = 2.37 × 10⁵ cycles: (a) fatigue crack initiation site, and (b) high magnification morphology of crack initiation site.
Figure 6.
Fatigue fracture surface of TC21 titanium alloy at σ = 550 MPa and N = 2.37 × 10⁵ cycles: (a) fatigue crack initiation site, and (b) high magnification morphology of crack initiation site.

Figure 7.
Fatigue fracture surface of TC21 titanium alloy at σ = 460 MPa and N = 1.59 × 10⁷ cycles: (a) fatigue crack initiation site (remarked by red line), and (b) high magnification morphology of the crack initiation site.
Figure 7.
Fatigue fracture surface of TC21 titanium alloy at σ = 460 MPa and N = 1.59 × 10⁷ cycles: (a) fatigue crack initiation site (remarked by red line), and (b) high magnification morphology of the crack initiation site.
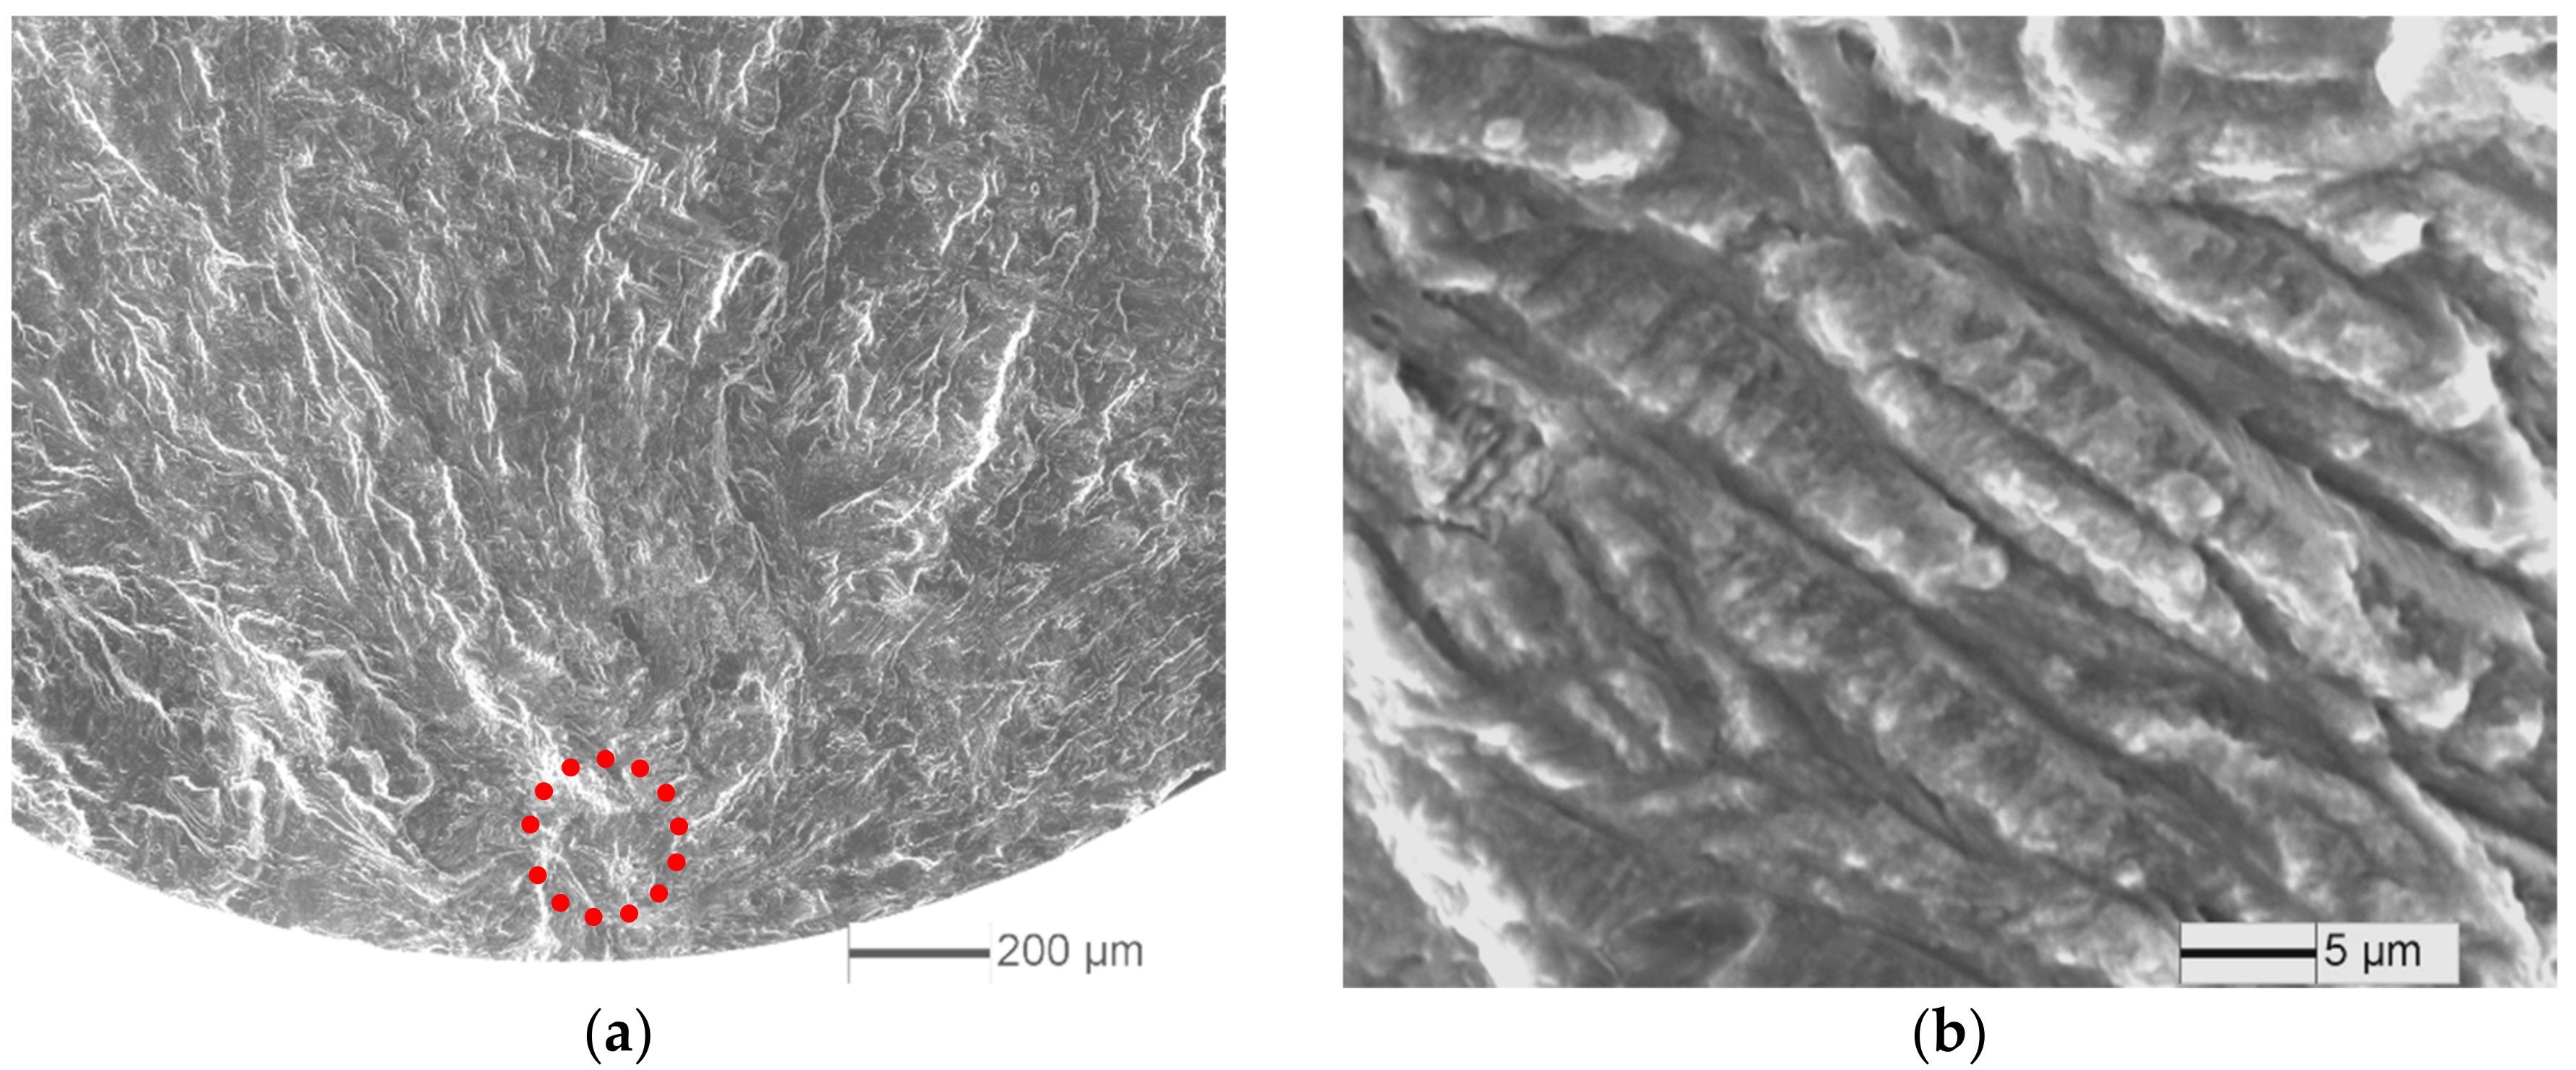
Figure 8.
Fracture surface for the notch specimens at σ = 400 MPa and N = 1.25 × 10⁵ cycles: (a) macroscopic morphology, and (b) crack initiation morphology.
Figure 8.
Fracture surface for the notch specimens at σ = 400 MPa and N = 1.25 × 10⁵ cycles: (a) macroscopic morphology, and (b) crack initiation morphology.
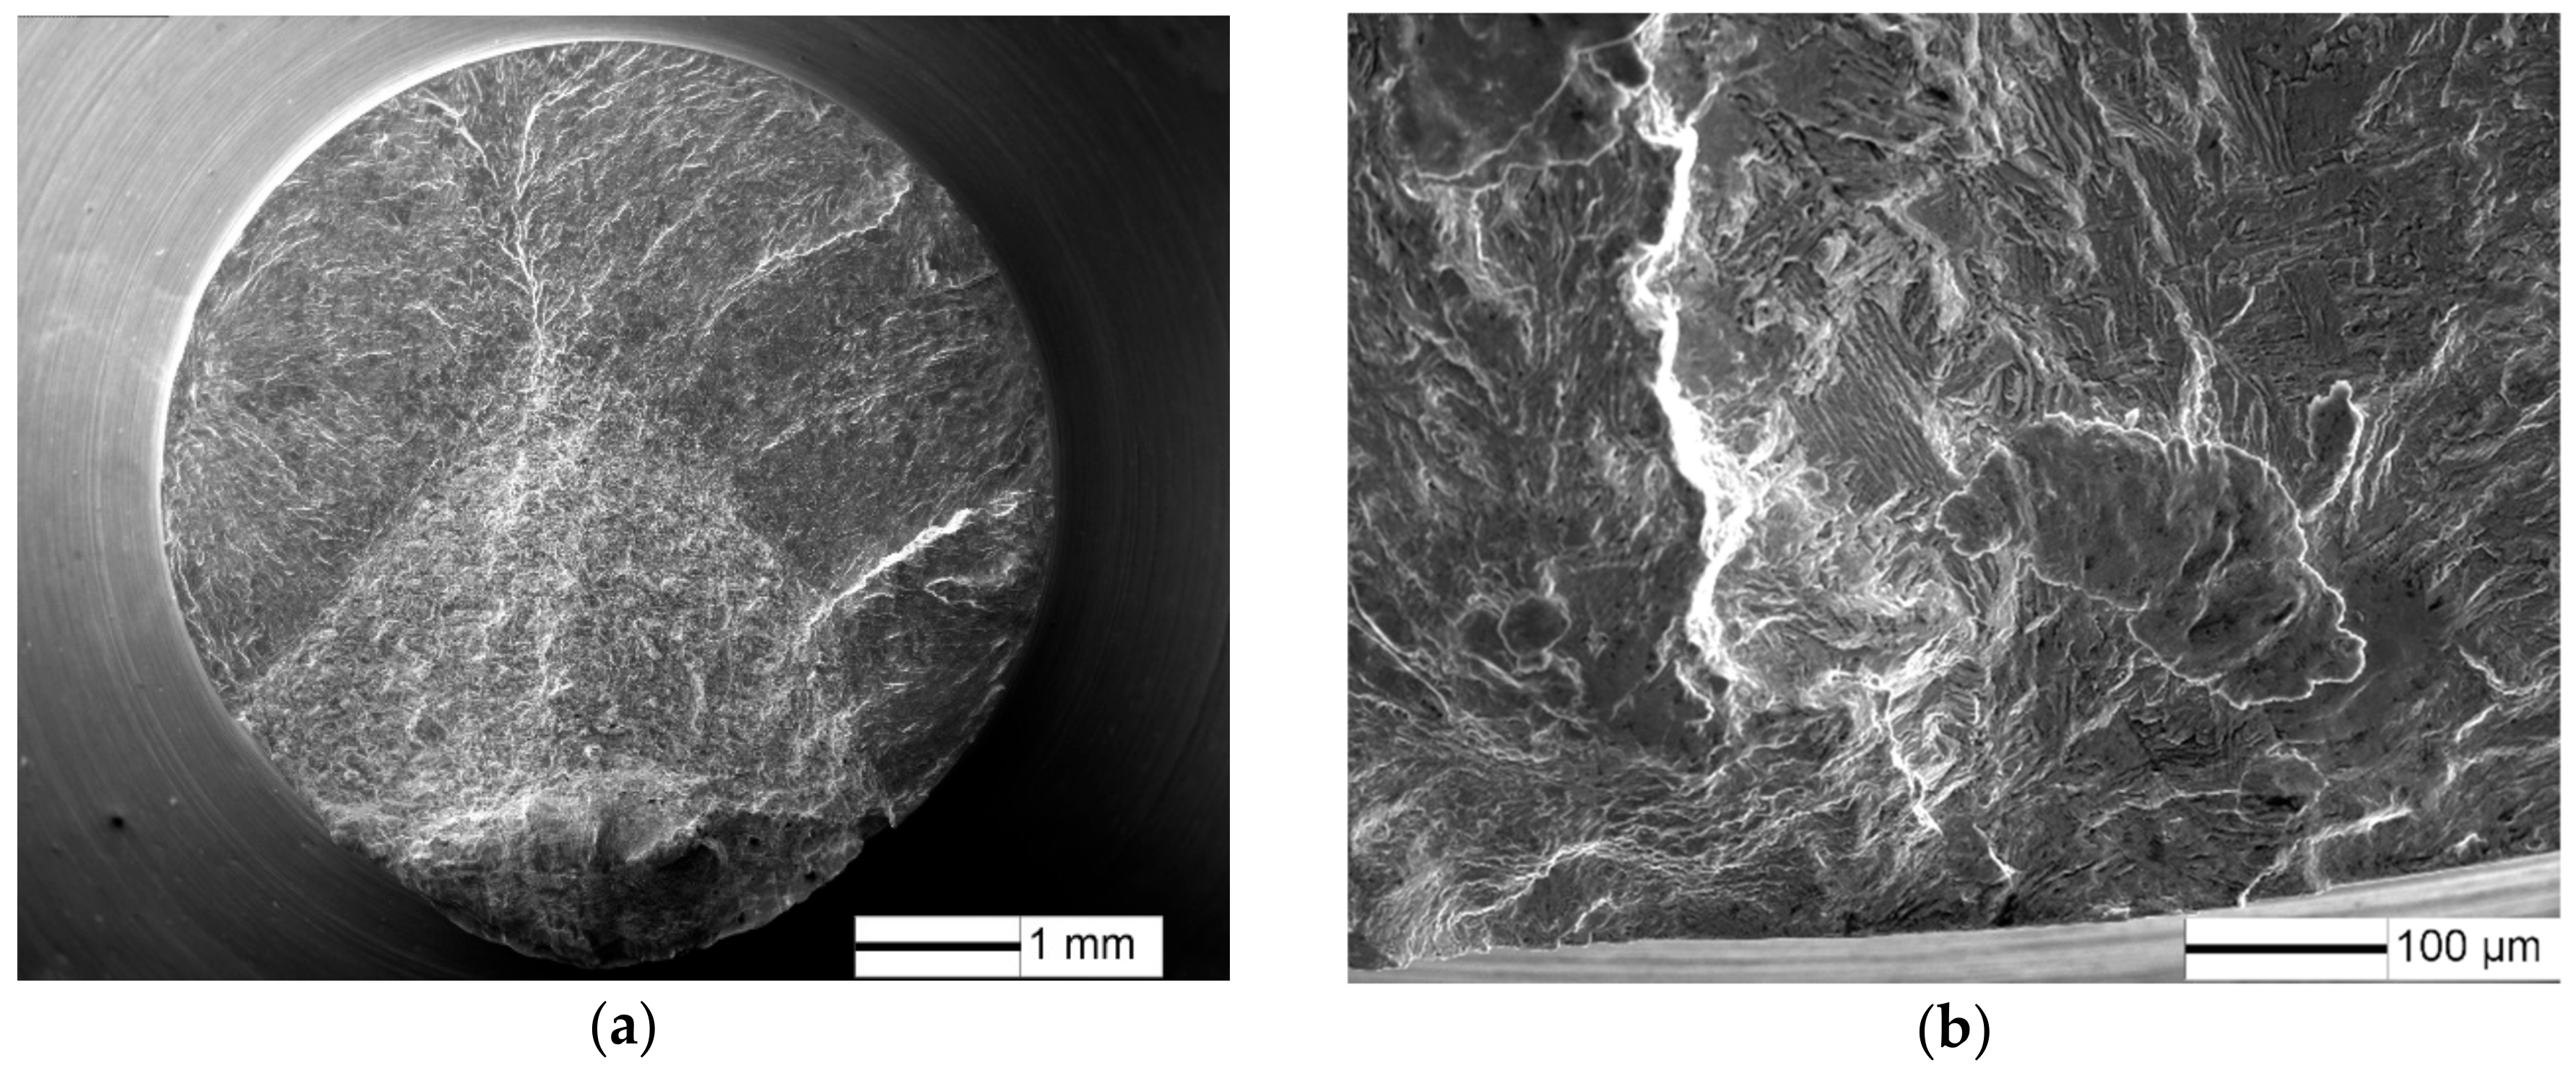
Figure 9.
Fracture surface for the notch specimens at σ = 350 MPa and N = 3 × 10⁶ cycles: (a) fatigue crack initiation site (remarked by red line), and (b) crack initiation morphology.
Figure 9.
Fracture surface for the notch specimens at σ = 350 MPa and N = 3 × 10⁶ cycles: (a) fatigue crack initiation site (remarked by red line), and (b) crack initiation morphology.

Figure 10.
Fracture surface for the notch specimens at σ = 300 MPa and N = 2 × 10⁷ cycles: (a) fatigue crack initiation site (remarked by red line), (b) crack initiation morphology, (c) flat facet morphology, and (d) distribution of fine grains on the α lamella.
Figure 10.
Fracture surface for the notch specimens at σ = 300 MPa and N = 2 × 10⁷ cycles: (a) fatigue crack initiation site (remarked by red line), (b) crack initiation morphology, (c) flat facet morphology, and (d) distribution of fine grains on the α lamella.

Figure 11.
Fracture surface for the notch specimens at σ = 250 MPa and N = 3.8 × 10⁵ cycles: (a) fatigue crack initiation site, and (b) crack initiation morphology.
Figure 11.
Fracture surface for the notch specimens at σ = 250 MPa and N = 3.8 × 10⁵ cycles: (a) fatigue crack initiation site, and (b) crack initiation morphology.
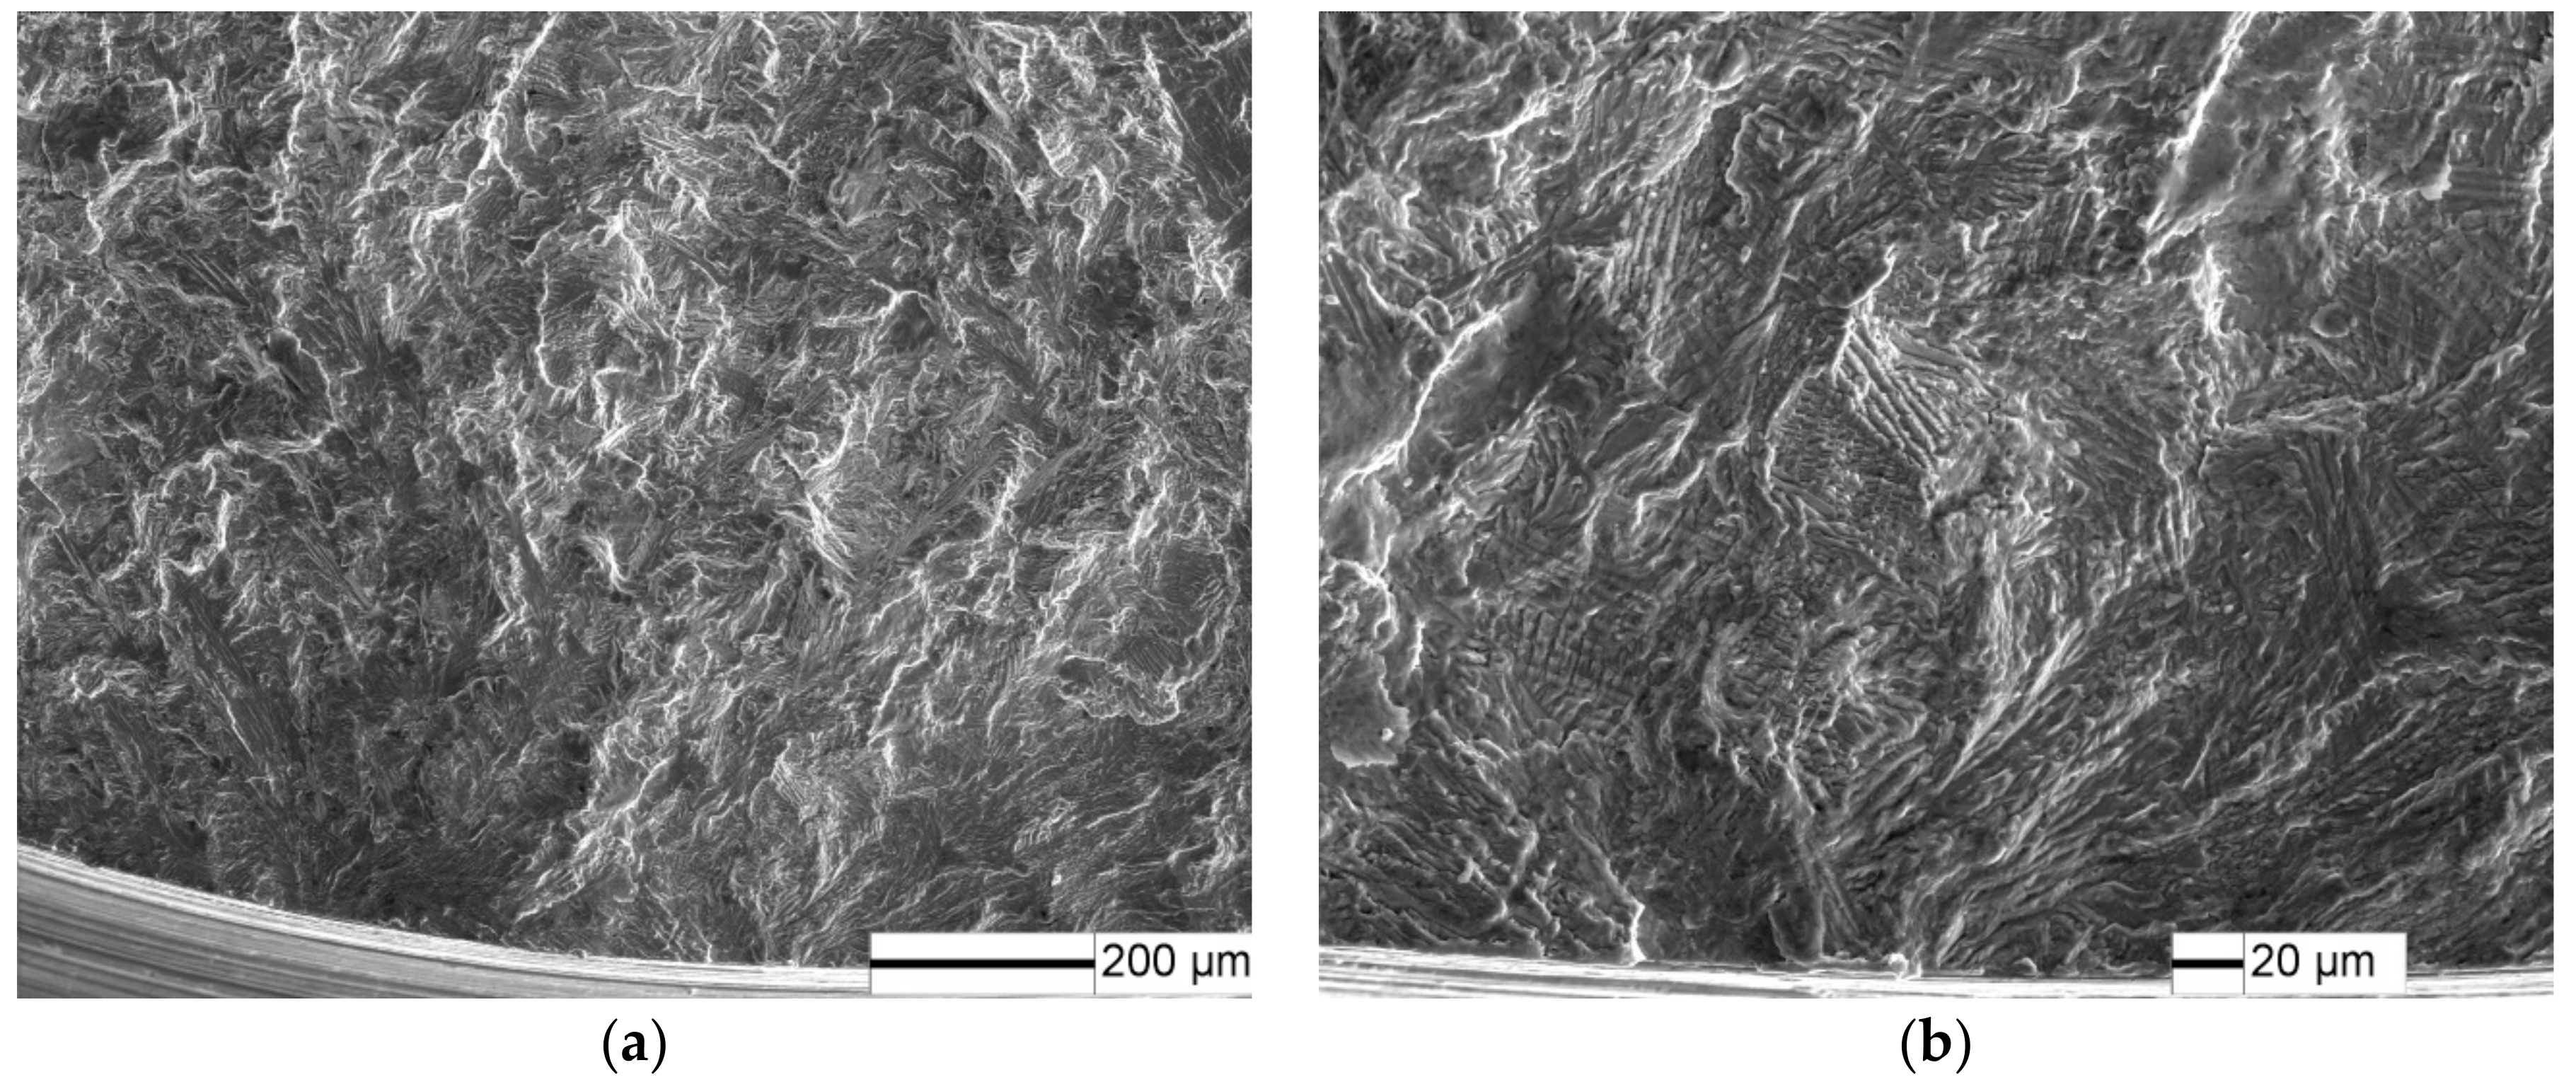
Figure 12.
Relationship between the crack initiation site depth and the number of cycles to failure: (a) smooth specimens, and (b) notched specimens.
Figure 12.
Relationship between the crack initiation site depth and the number of cycles to failure: (a) smooth specimens, and (b) notched specimens.

Figure 13.
Relationship between the size of the FGA and the number of cycles to failure.

Figure 14.
S–N curves of smooth specimens and notched specimens for equivalent stress.

Figure 15.
Relationship between the stress intensity factor range at the FGA and fatigue life.


Table 1.
Fatigue notch factors in various fatigue lives.
| Fatigue Life | Smooth Specimens | Notched Specimens | |
|---|---|---|---|
| (Cycles) | Fatigue Strength (MPa) | Fatigue Strength (MPa) | Kf |
| 1.25 × 10⁵ | 600 | 400 | 1.5 |
| 3 × 10⁶ | 550 | 350 | 1.57 |
| 2 × 10⁷ | 430 | 300 | 1.43 |
© 2018 by the authors. Licensee MDPI, Basel, Switzerland. This article is an open access article distributed under the terms and conditions of the Creative Commons Attribution (CC BY) license (http://creativecommons.org/licenses/by/4.0/).
Share and Cite
MDPI and ACS Style
Nie, B.; Chen, D.; Zhao, Z.; Zhang, J.; Meng, Y.; Gao, G. Notch Effect on the Fatigue Behavior of a TC21 Titanium Alloy in Very High Cycle Regime. Appl. Sci. 2018, 8, 1614. https://doi.org/10.3390/app8091614
AMA Style
Nie B, Chen D, Zhao Z, Zhang J, Meng Y, Gao G. Notch Effect on the Fatigue Behavior of a TC21 Titanium Alloy in Very High Cycle Regime. Applied Sciences. 2018; 8(9):1614. https://doi.org/10.3390/app8091614
Chicago/Turabian StyleNie, Baohua, Dongchu Chen, Zihua Zhao, Jianglong Zhang, Yu Meng, and Guiyan Gao. 2018. "Notch Effect on the Fatigue Behavior of a TC21 Titanium Alloy in Very High Cycle Regime" Applied Sciences 8, no. 9: 1614. https://doi.org/10.3390/app8091614
Note that from the first issue of 2016, this journal uses article numbers instead of page numbers. See further details here.