Article

Study on the Thermal Distribution Characteristics of High-Speed and Light-Load Rolling Bearing Considering Skidding

School of Mechatronic Engineering, Xi'an Technological University, Xi’an 710021, China
*
Author to whom correspondence should be addressed.
Appl. Sci. 2018, 8(9), 1593; https://doi.org/10.3390/app8091593
Submission received: 16 July 2018 / Revised: 5 September 2018 / Accepted: 6 September 2018 / Published: 8 September 2018
(This article belongs to the Section Mechanical Engineering)

Abstract

:
Skidding, which frequently occurs in high-speed rolling bearings, has a significant effect on the thermal distribution and service reliability of the bearings. An improved theoretical model of friction power loss distribution in high-speed and light-load rolling bearings (HSLLRBs) considering skidding is established, and the effects of various operating parameters on the friction power loss are investigated. The results show that the friction power loss of the inner ring and outer ring as well as the total friction power loss of the bearing increase as the slip ratio increases, but that the friction power loss of the cage guide surface and roller oil churning show a reverse trend. In addition, the increase in inner ring speed and kinematic viscosity leads to an increase in bearing friction power loss. The steady and transient temperature field distribution of HSLLRBs is obtained by the finite element method (FEM), and the results show that the inner ring raceway has the highest temperature, whereas the cage has the lowest. The temperature distribution test rig of a full-size roller bearing is constructed, and the influence mechanism of the slip ratio, rotation speed, load, lubrication, and surface topography on the bearing temperature distribution are obtained. The experimental results are consistent with the theoretical results, which also validates the theoretical method.

1. Introduction

The rolling element bearing is a critical part supporting the rotating components of the mechanical system and provides additional damping to stabilize the system. In comparison to plain bearings, it is more difficult to model the rolling bearing as a whole due to the complicated coupling between the interactions of components (i.e., rolling elements, cages, and rings) of rolling bearings [1]. Bercea et al. [2] proposed a conventional quasi-static analysis to determine the internal load distribution, the bearing stiffness, and the fatigue life of rolling bearings. Takabi et al. [3] investigated the influences of different traction models on the dynamic behavior of a cylindrical roller bearing under radial loads, and calculated the cage rotational speed for a wide range of rotational speeds and bearing loads. Nowadays, the problem of the excessive friction heat and the resulting failure of rolling bearing has become more prominent. Therefore, research on the heating mechanism, heat transfer process, and temperature distribution of bearings is very necessary. There are a number of researchers who have made remarkable contributions to this subject. Palmgren [4] proposed a method for calculating the friction heat generation of a rolling element bearing based on the integral method, which is suitable for medium- and low-speed and sufficient lubrication conditions. However, this method underestimates the total friction heat generation of bearings in high-speed working conditions. Therefore, the actual friction heat of the bearing cannot be estimated accurately. Astridge et al. [5] proposed an empirical formula for calculating the friction heat of high-speed roller bearings, which involved the dynamic viscosity and flux of the lubricant. Aramaki et al. [6] studied the thermal characteristics of the steel bearing and ceramic ball bearing through experiments. Rumbarger et al. [7] calculated the friction power loss caused by the roller, cage, and inner ring and outer ring raceways of a cylindrical roller bearing. Their model assumes that each element of the bearing is a cylinder rotating at a certain angular velocity inside the viscous fluid. The model has certain limitations for various kinds of contact friction heat in the bearing. Based on the quasi dynamics method, the friction power loss in the contact pairs between the parts of the rolling bearing, the friction power loss of the flange caused by the cage and inner (outer) ring guide, the friction power loss between the roller and cage pocket, and the oil churning of the roller were studied by Harris [8]. Harris's approach is an approximation based on the assumption of laminar flow. SKF [9] proposed a more accurate algorithm for calculating friction torque, but it has not been widely used because of the calculation process complexity and the mass of unknown parameters involved in the calculation. Doki-Thonon et al. [10,11] regarded lubricating oil as a non-Newtonian fluid, and applied thermal elastohydrodynamic lubrication to the thermal analysis of the rolling bearing. Mizuta et al. [12] studied the heat transfer characteristics between inner and outer rings of the angular ball bearing. Ai et al. [13] applied the thermal resistance network method for the thermal analysis of double-row tapered roller bearings. Wu et al. [14] developed a simulation method to determine the effects of non-uniform loading on bearing thermal performance under different preloads. Yan et al. [15] studied the thermal characteristics of double-row tapered roller bearings used in a high-speed locomotive. At present, the main theoretical methods for calculating the temperature field of a bearing assembly are the finite element method, heat flow network method, and thermal elastohydrodynamic lubrication method. Takabi et al. [16] obtained the instantaneous temperature distribution of a rolling bearing under different loads and speeds. Wang et al. [17,18] regarded the friction heat generation between the roller and the inner (outer) ring raceway as the moving heat source and calculated the two-dimensional temperature field distribution of the bearing assembly based on the finite element method. Tarawneh et al. [19] conducted experiments to acquire temperature histories at several locations on a stationary bearing subjected to heat sources imbedded in two rollers. Than et al. [20] presented a unified method to predict nonlinear thermal characteristics of a high-speed spindle bearing subjected to a preload.
Under the conditions of high speed and light load, rolling bearing skidding often occurs. Skidding is a tribodynamic phenomenon, occurring due to the sliding of rollers in the direction of motion, whilst rollers enter the high-load contact zone with insufficient lubrication. Many researchers have studied the skidding of rolling bearings. Harris [21] proposed an analytical method to predict the skidding of high speed rolling bearing(HSRB) under medium-load and overloaded conditions. Laniado-Jacome et al. [22] presented a numerical model of a rolling bearing for mechanical event simulations, which they developed with the finite element method to study sliding between the rollers and races. Tu et al. [23] investigated skidding during rolling element bearing acceleration, taking account of the contact force and friction force between the rolling elements and the races, as well as the cage, gravity, and the centrifugal force of the rolling elements. Han et al. [24] proposed a nonlinear dynamic model for angular contact ball bearings. The results have shown that combined loads (both axial and radial loads in operation) lead to distinct fluctuations in the slipping velocity of the rolling ball. In addition, Han et al. [25] established a nonlinear dynamic model for skidding behavior of the cylindrical roller bearing, and analyzed the skidding behavior of cylindrical roller bearings under time-variable load conditions. The skidding damage has become one of the main reasons for the failure of high-speed rolling bearings. Skid damage is mostly thermal failure where metal-to-metal contact occurs in the contact area of the bearing ring and roller; this can result in a sharp temperature rise and material transfer, and the damage can quickly extend to the whole contact area [26]. Skidding will cause the bearing’s temperature to rise and greatly affect its service reliability, even resulting in bearing failure. Scholars have carried out numerous researches in the thermal analysis of rolling bearings, but many studies have not paid attention on the skidding phenomenon in the thermal effect. The influence mechanisms between the skidding and thermal distribution characteristics of high-speed and light-load rolling bearings (HSLLRBs) have not been studied in depth. In addition, owing to the difficulty of installing sensors inside the bearing, the temperature of the bearing outer ring has been mostly measured and adopted in the past. Still, the most important temperature in the contact area of the roller and the inner ring raceways is difficult to obtain.
Therefore, the temperature generation and its evolution law of rolling bearings under skidding conditions are studied in this manuscript, and a new method to analyze the friction power loss and temperature distribution of HSLLRBs is established. The main object of the study is to reveal the coupling relationship between skidding and thermal distribution, so as to study the influence mechanism of slip ratio, rotation speed, load, and lubrication on the temperature field distribution of a bearing.

2. Numerical Model

The friction power loss analysis model of HSLLRBs with skidding is established. In this model, the friction power loss of the contact between the components and the friction power loss of the rotating parts in the viscous lubricant is considered, and the heat convection between the viscous flow lubricant and bearing element is also included.

2.1. Skidding

Slip ratio is defined as the relationship between the actual speed and the theoretical speed of the cage:
s f = ω c m ω c ω c m  
By replacing the cage speed with the slip ratio, the relationship between the slip ratio and the friction power loss of the rolling bearing can be obtained.

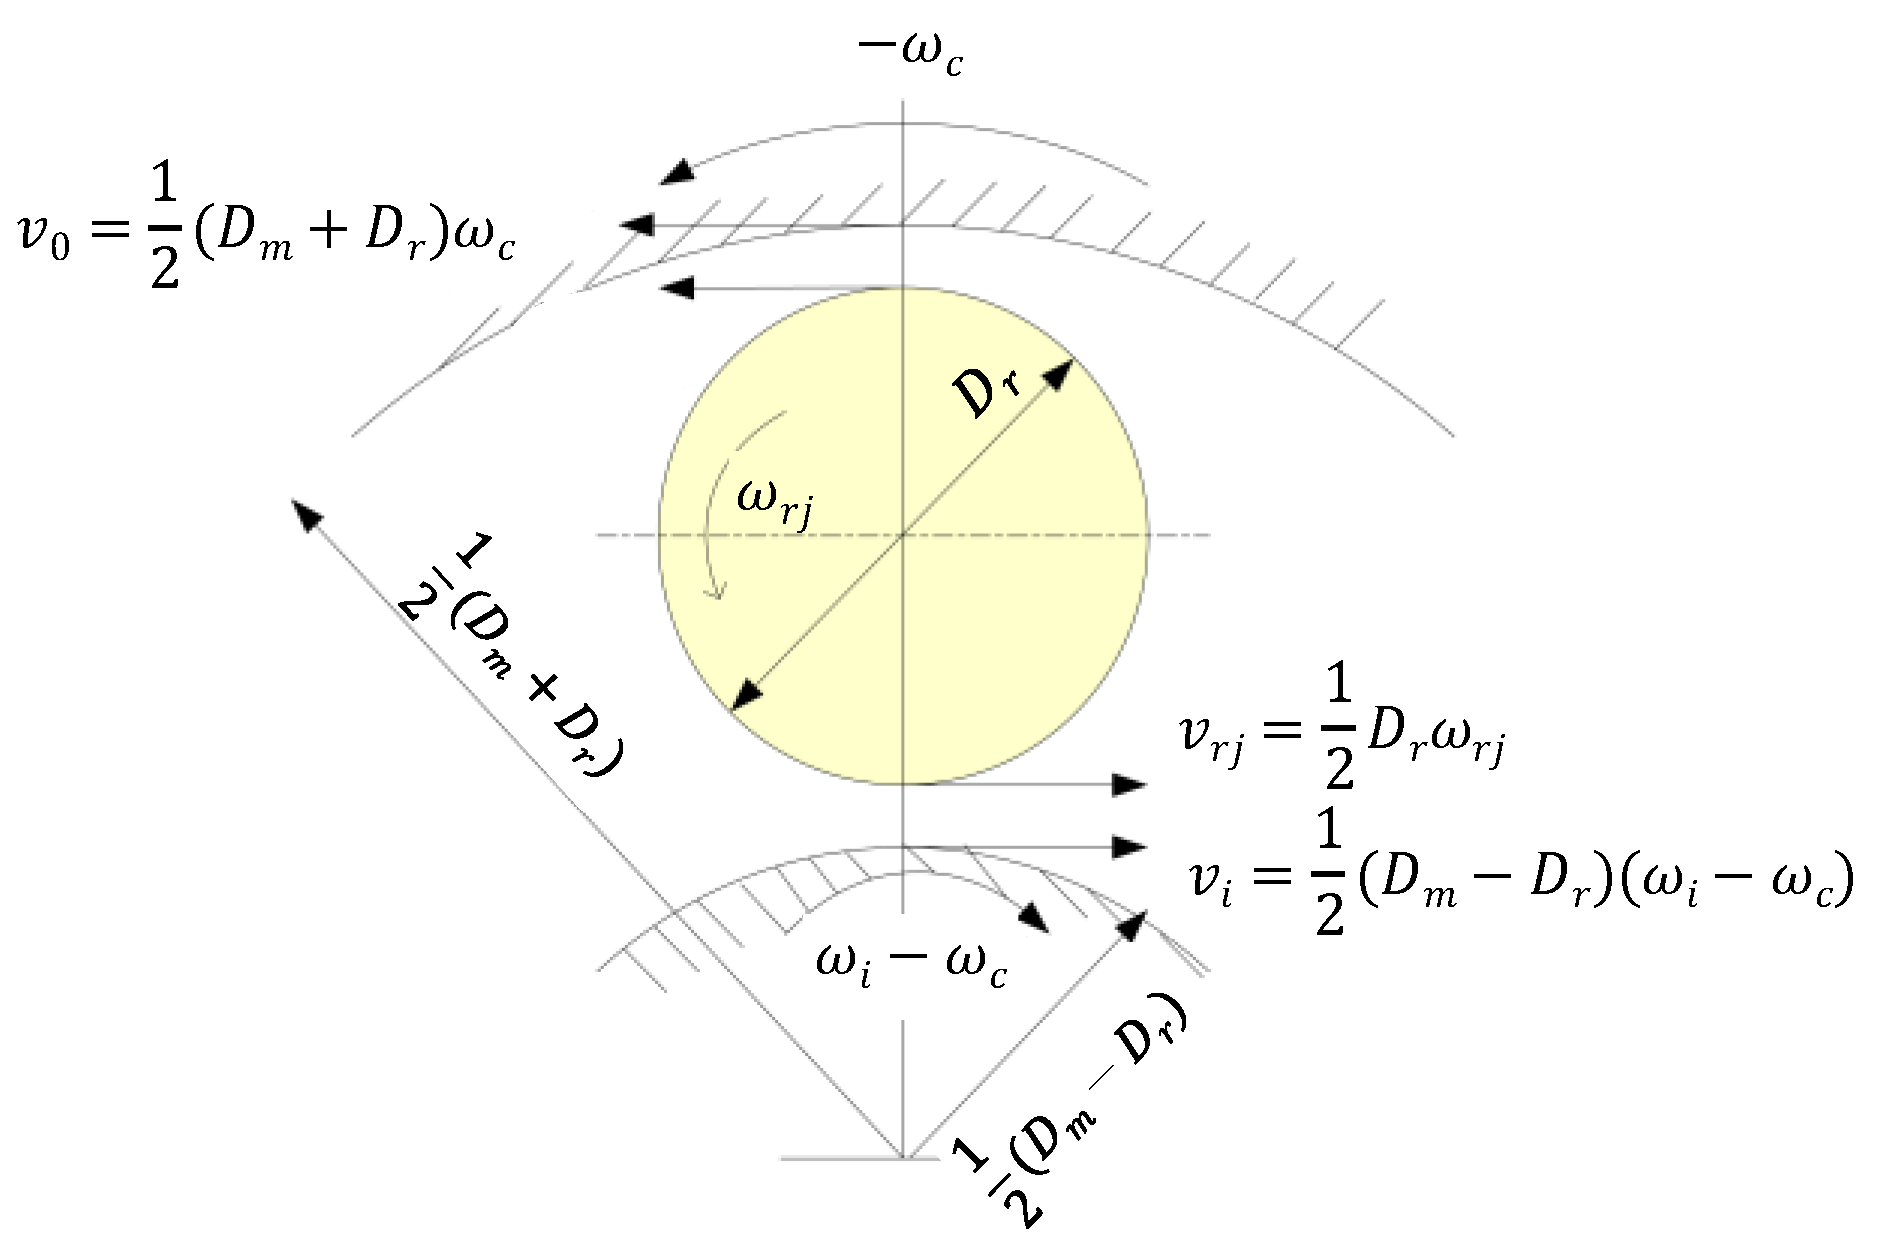
2.2. Kinematics Models of the Roller

Figure 1 shows the kinematics model of a roller, in which the outer ring is fixed and the angular velocity of the inner ring is ωi. The roller rotation angular velocity and the cage angular velocity are approximately equal, and are represented by ωc.
The relative sliding velocities between the roller and the inner and outer raceways can be expressed in the following form, respectively [21]:
V i j = D m 2 [ ( 1 γ ) ( ω i ω c ) γ ω r j ]  
V o j = D m 2 [ ( 1 + γ ) ω c γ ω r j ]  
In Equations (2) and (3) the parameter Ƴ = Dr/Dm.

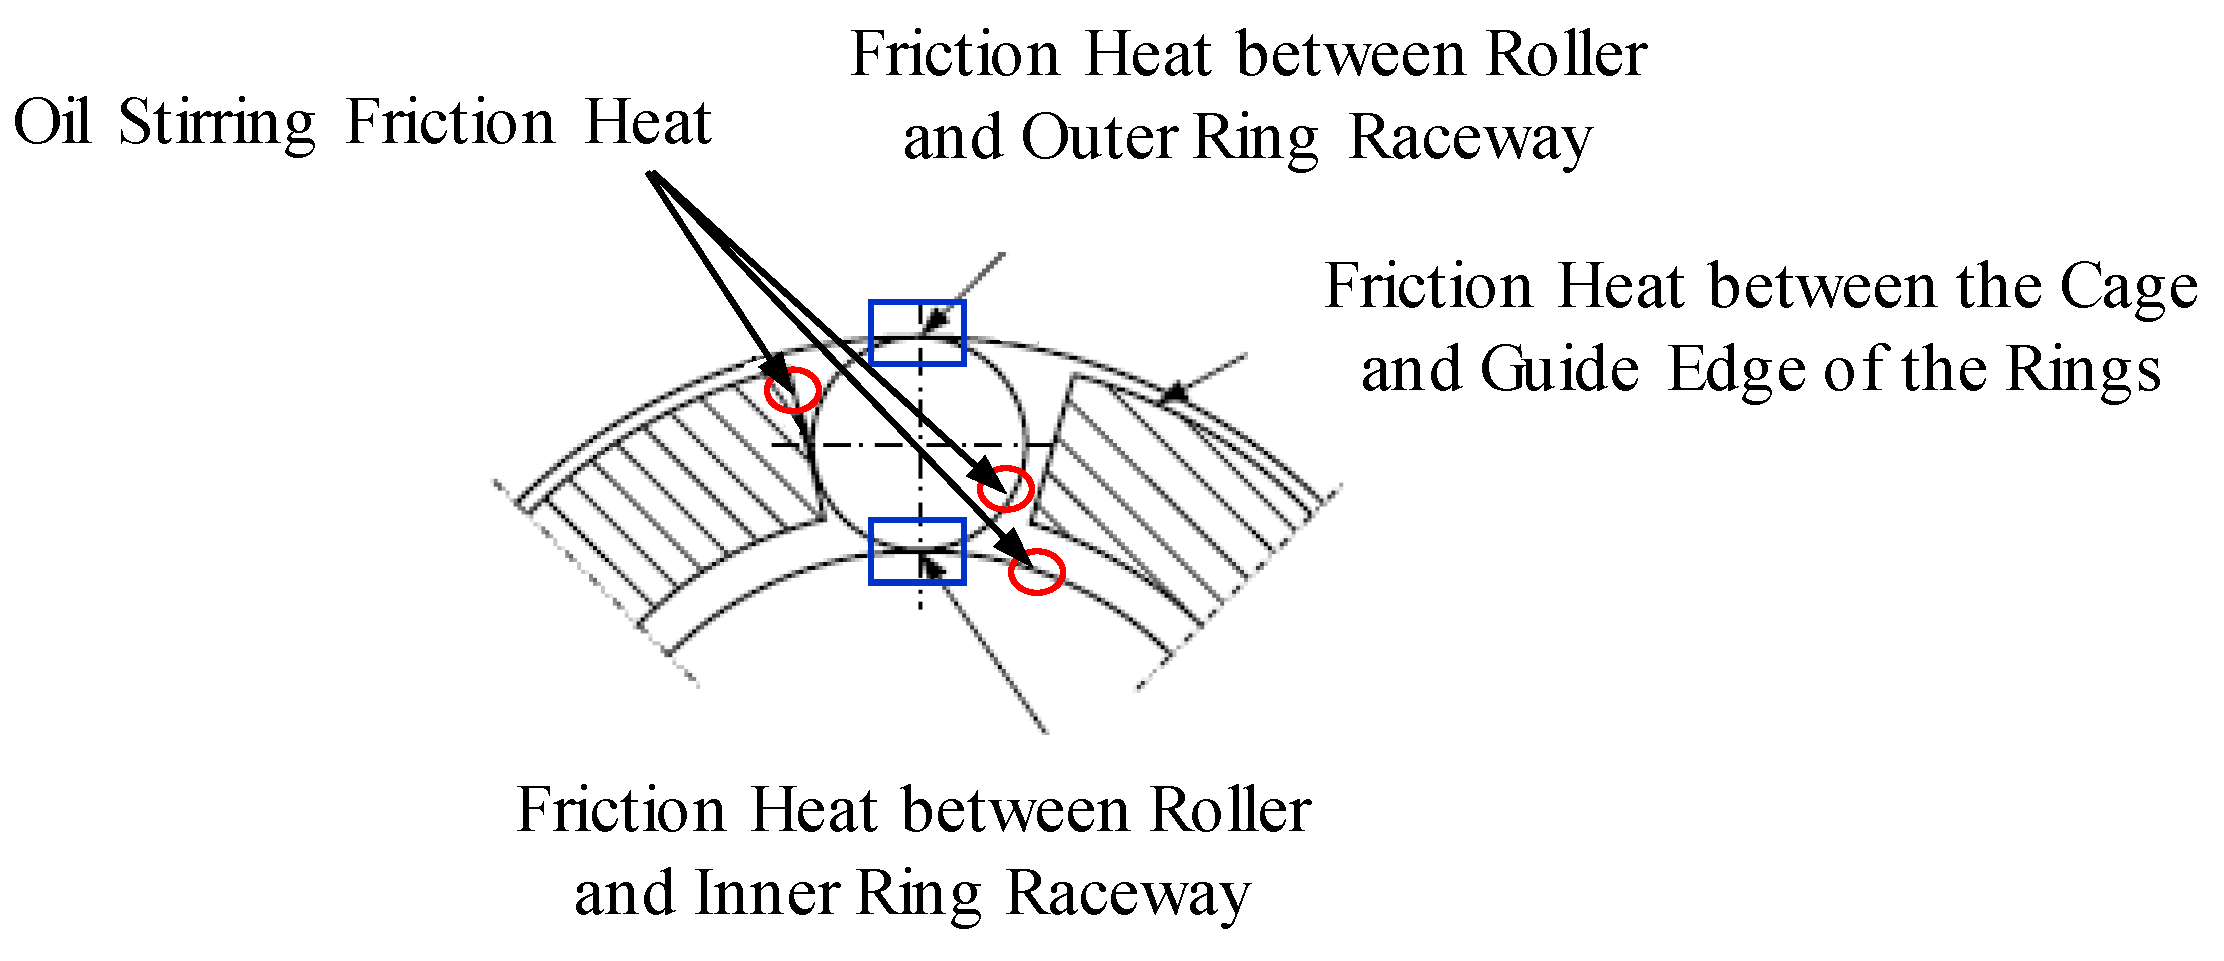
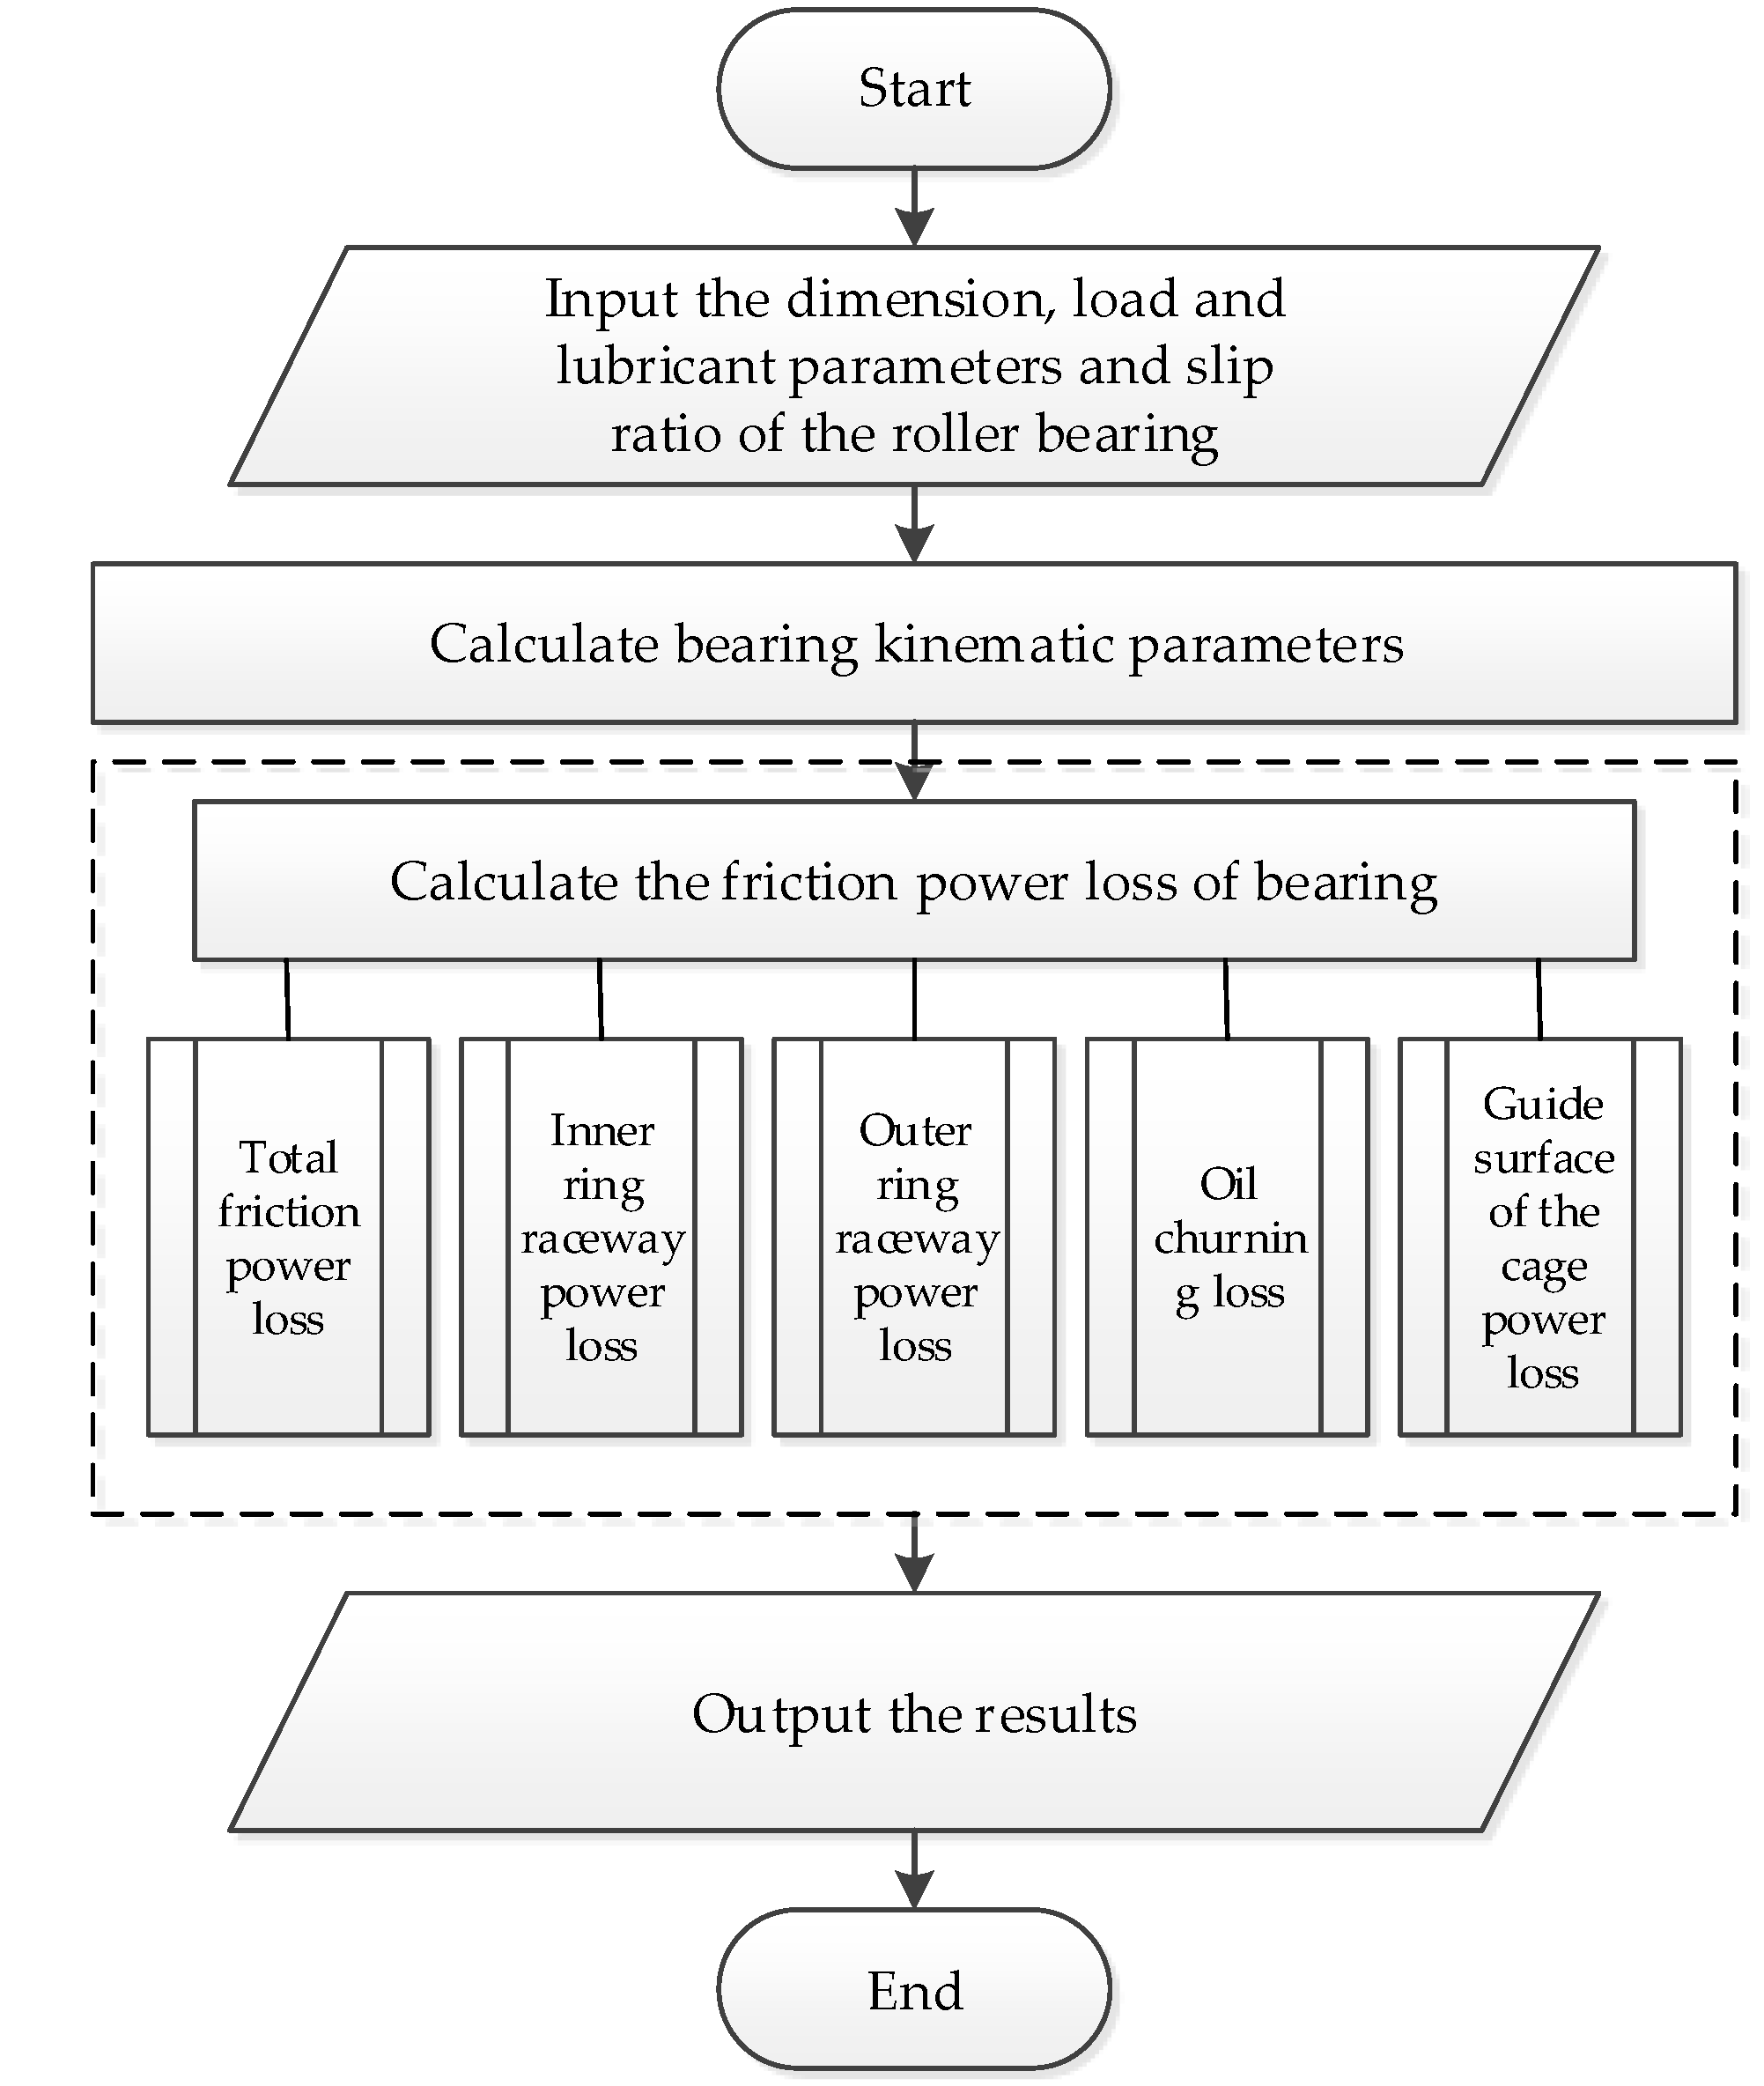
2.3. Friction Power Loss Analysis Model

The friction power loss of the bearing is mainly the contact friction power loss between the components and the friction power loss of the rotating parts in the viscous lubricant. The friction power loss analysis model of the bearing with skidding under the condition of a fixed outer ring and rotating inner ring is established, as shown in Figure 2.

2.3.1. Friction Power Loss between the Roller and Inner Ring Raceway

The friction power loss between the roller and inner ring raceway Hi can be calculated as [5,27]:
H i = T i 0 V i 0 + 2 j = 1 N T i j V i j + H i d r a g  
By introducing the slip ratio, Equations (2) and (3) are transformed to Equations (5) and (6), respectively.
V i 0 = D m 2 [ ( 1 γ ) ( ω i ω c m + ω c m × s f ) γ ω r 0 ]  
V i j = D m 2 [ ( 1 γ ) ( ω i ω c m + ω c m × s f ) γ ω r j ]  

2.3.2. Friction Power Loss between the Roller and Outer Ring Raceway

The total friction power loss between the roller and outer ring raceway Ho can be calculated as:
H o = H o 1 + H o 2 + 2 H r d r a g / 3  
H o 1 = T o 0 V o 0 + 2 j = 1 N T o j V o j  
H o 2 = [ Z ( 2 N + 1 ) ] F c f R e ω r  
F c = 33.9 D r l e D m n c 2  
Ho1 and Ho2 are the friction power loss between the roller and outer ring raceway in the loaded zone and unloaded zone of the bearing, respectively. fRe is the coefficient of the rolling friction. The equations of Voj, Vo0, and Fc contain the actual cage speed. By introducing the slip ratio, Equations (2), (3), and (10) are transformed to Equations (11)–(13), respectively.
V o 0 = D m 2 [ ( 1 + γ ) ( ω c m ω c m × s f ) γ ω r 0 ]  
V o j = D m 2 [ ( 1 + γ ) ( ω c m ω c m × s f ) γ ω r j ]  
F c = 33.9 D r l e D m ( n c m n c m × s f ) 2  

2.3.3. Oil Stirring Friction Power Loss

The Rumbarger empirical formula is adopted to calculate the oil stirring friction power loss caused by the effective surface area A of the roller, cage, and inner ring raceway of the roller bearing, respectively, as follows [7]:
H d = ξ f v A ω 3 r 3 / 8  
f v = { 16 / R e R e < 2500 , T a < 41 3 ( R e / 2500 ) 0.856 ( 16 / R e ) R e 2500 1.3 ( T a / 41 ) 0.539 ( 16 / R e ) T a 41
R e = ω r C / v  
where ξ is the density of the air oil mixture. fv is the viscous friction coefficient. r is the reference radius. Re is the Reynolds number. Ta is the Taylor number.
(1) By introducing the values of the cage A and ωc into Equations (14), (15), and (16), the friction power loss of oil stirring for the cage Hcdrag can be calculated as:
H c d r a g = π ξ f v c ( ω c m ω c m × s f ) 3 l C L D C L 4 / 40  
(2) By introducing the values of the inner ring raceway A into Equations (14), (15), and (16), the friction power loss of oil stirring for the inner ring Hidrag can be given as:
H i d r a g = π [ Z ( 2 N + 1 ) ] ξ f v i ω i 3 D i 4 l i / 192 Z  
(3) The friction power loss of oil stirring for the roller Hrdrag can be given as:
H r d r a g = D m ( ω c m ω c m × s f ) F v Z / 2  
F v = 707.54 c v ξ l e D r [ D m ( ω c m ω c m × s f ) ] 1.95 / 16 g  
In Equation (20), g is acceleration due to gravity, Cv is the drag coefficient, and η is the kinematic viscosity.
The formula for calculating ξ is as follows [21]:
ξ = 57.8 × 10 5 w 0.37 n D m 1.7  
where DCL and lCL are the cage land diameter and width, respectively. Di and li are the bore diameter and width of the bearing inner ring, respectively.

2.3.4. Friction Power Loss between the Cage and Guide Edge of the Rings

The contact friction moment between the cage and the guide edge of the ring depends on the force between the roller and cage, the eccentricity of the axis of the cage, and the speed of rotation of the cage relative to the guide ring [8]. The friction power loss between the cage and the guide edge of the ring HcL can be expressed as follows:
H c L = 6.864 × 10 3 w η π D C R 2 ( ω c m ω c m × s f ) 2 / 2 ( 1 d 1 / d 2 ) )  
where w is the width of a lamina. DCR is the cage rail diameter. d2 is the larger of the cage rail and ring land diameters and d1 is the smaller.
The HSLLRB endures radial load and neglects axial roller displacement, so the friction power loss between the roller end face and the ring flange can be neglected.

2.3.5. Total Friction Power Loss

The total friction power loss of rolling bearing Htot consists of the following parts [5,27]:
H t o t = H i + H o + H c L + H r d r a g / 3 + H c d r a g  
Figure 3 shows the program flow chart of the bearing friction power loss analysis. When the dimension, load, lubricant parameters, and slip ratio of the roller bearing are input, the theoretical model of friction power loss distribution characteristics in HSLLRBs considering skidding can be obtained by combining the slip ratio with the kinematic equations, load equations, friction power loss equation, and other related equations, then solving by MATLAB(R2016a, MathWorks inc., Natick, MA, USA,2016). Finally, the friction power loss can be obtained as the output [28,29].

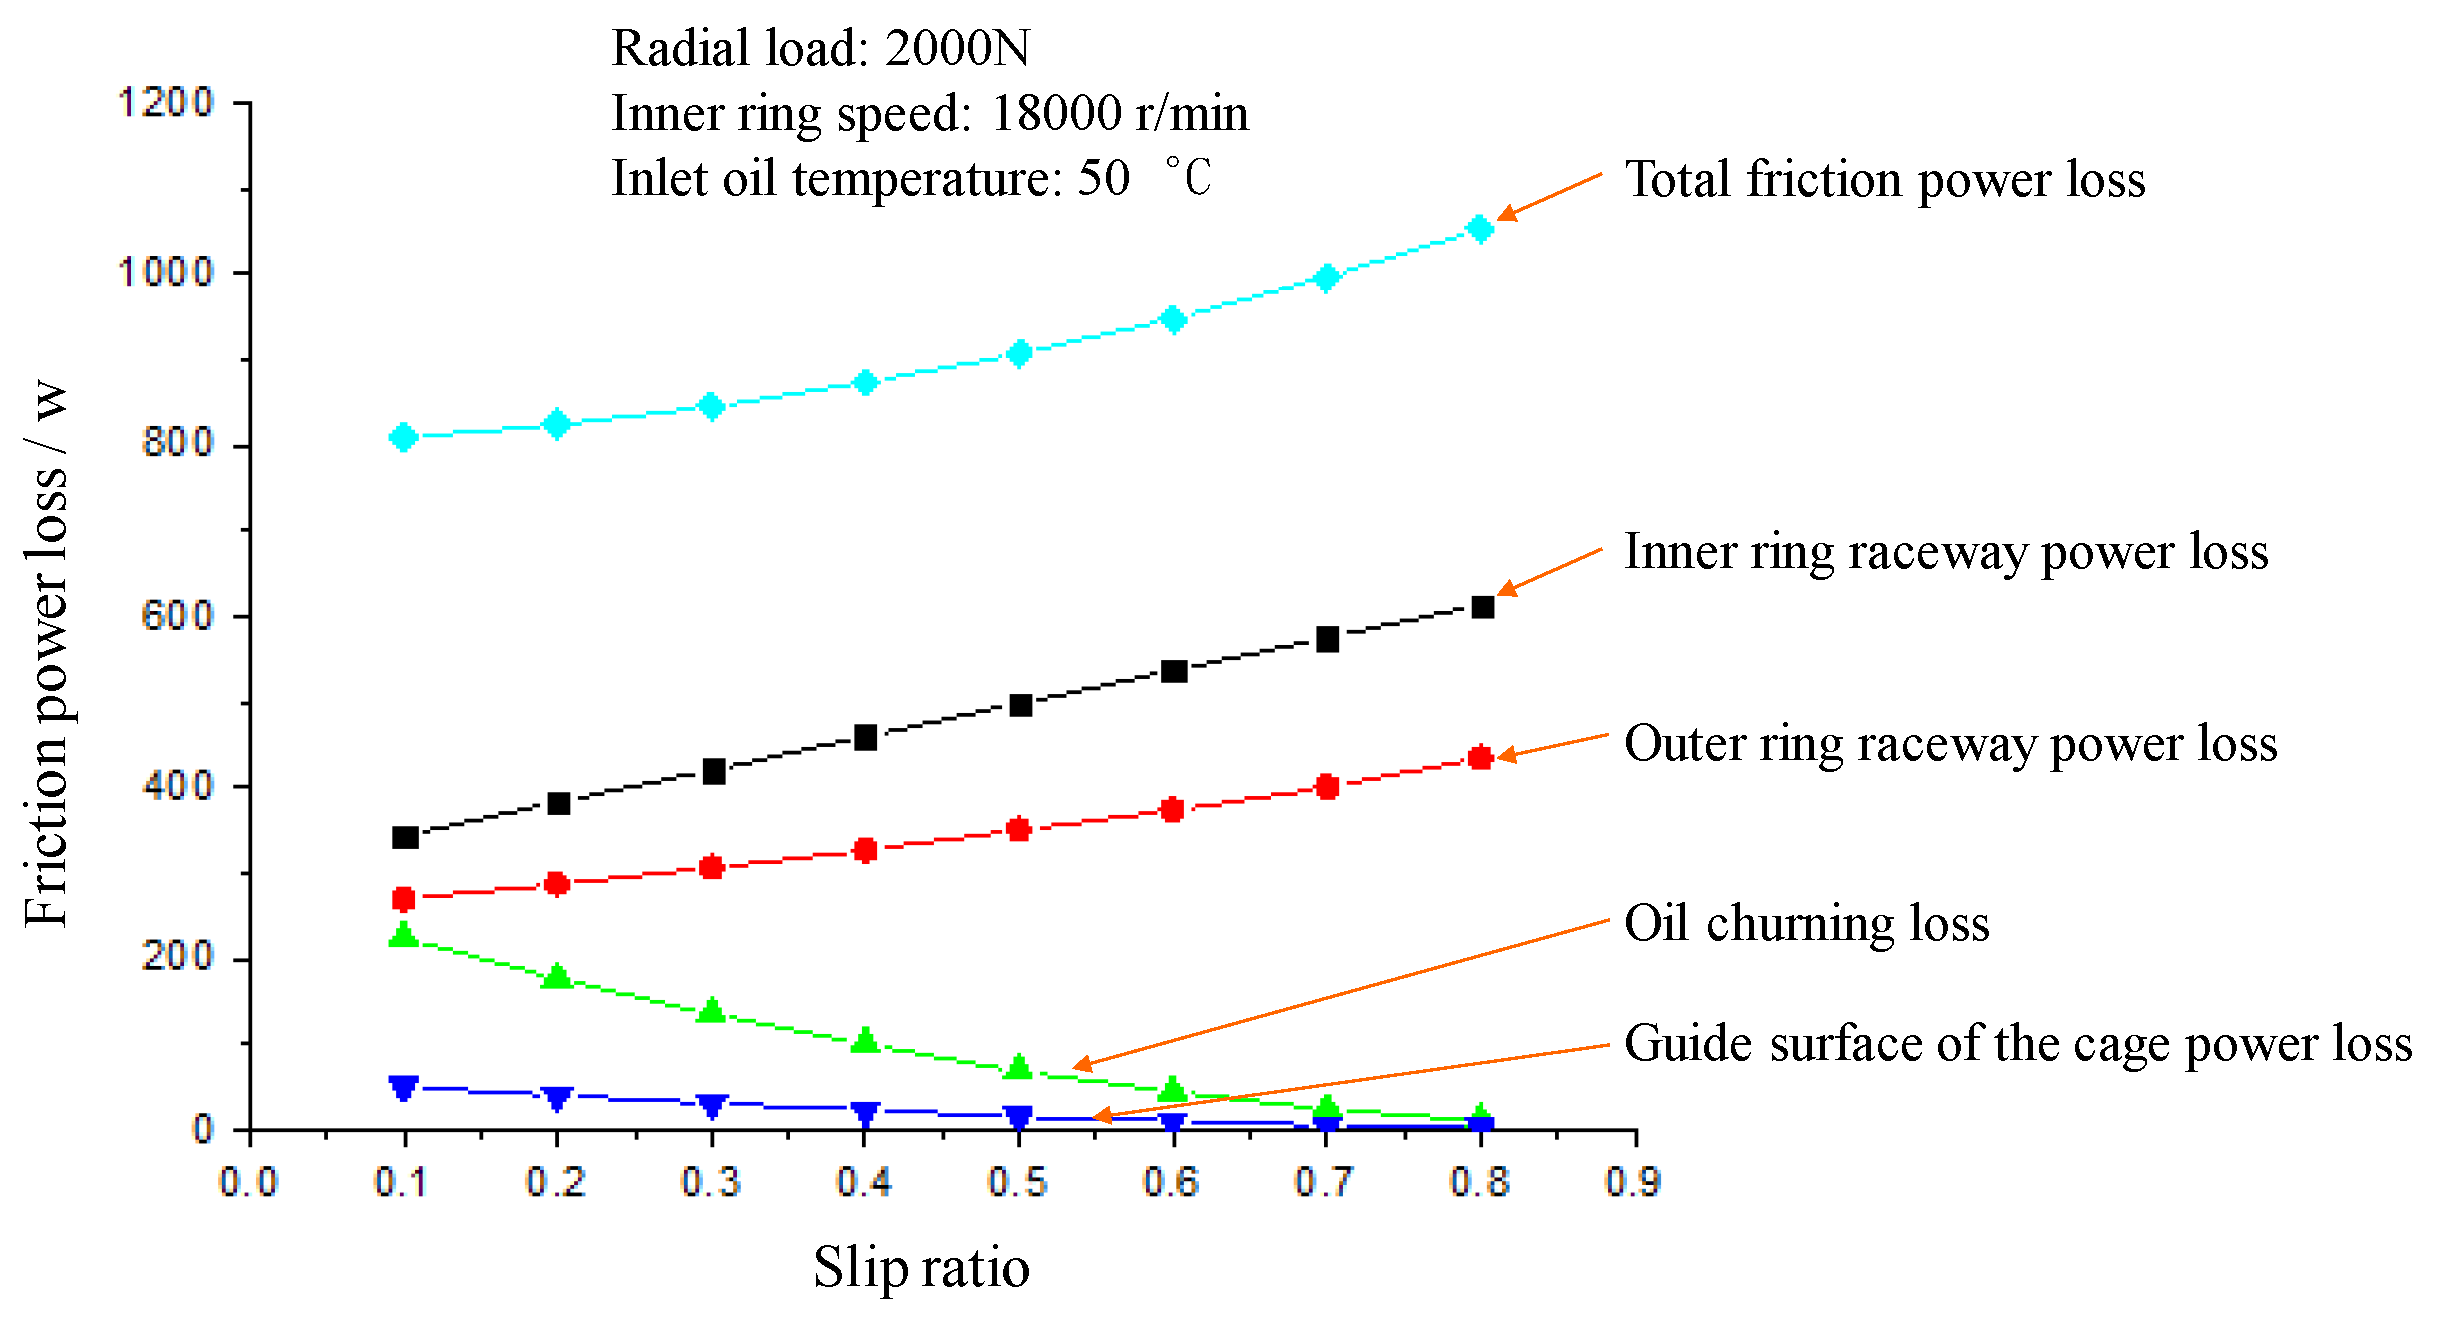
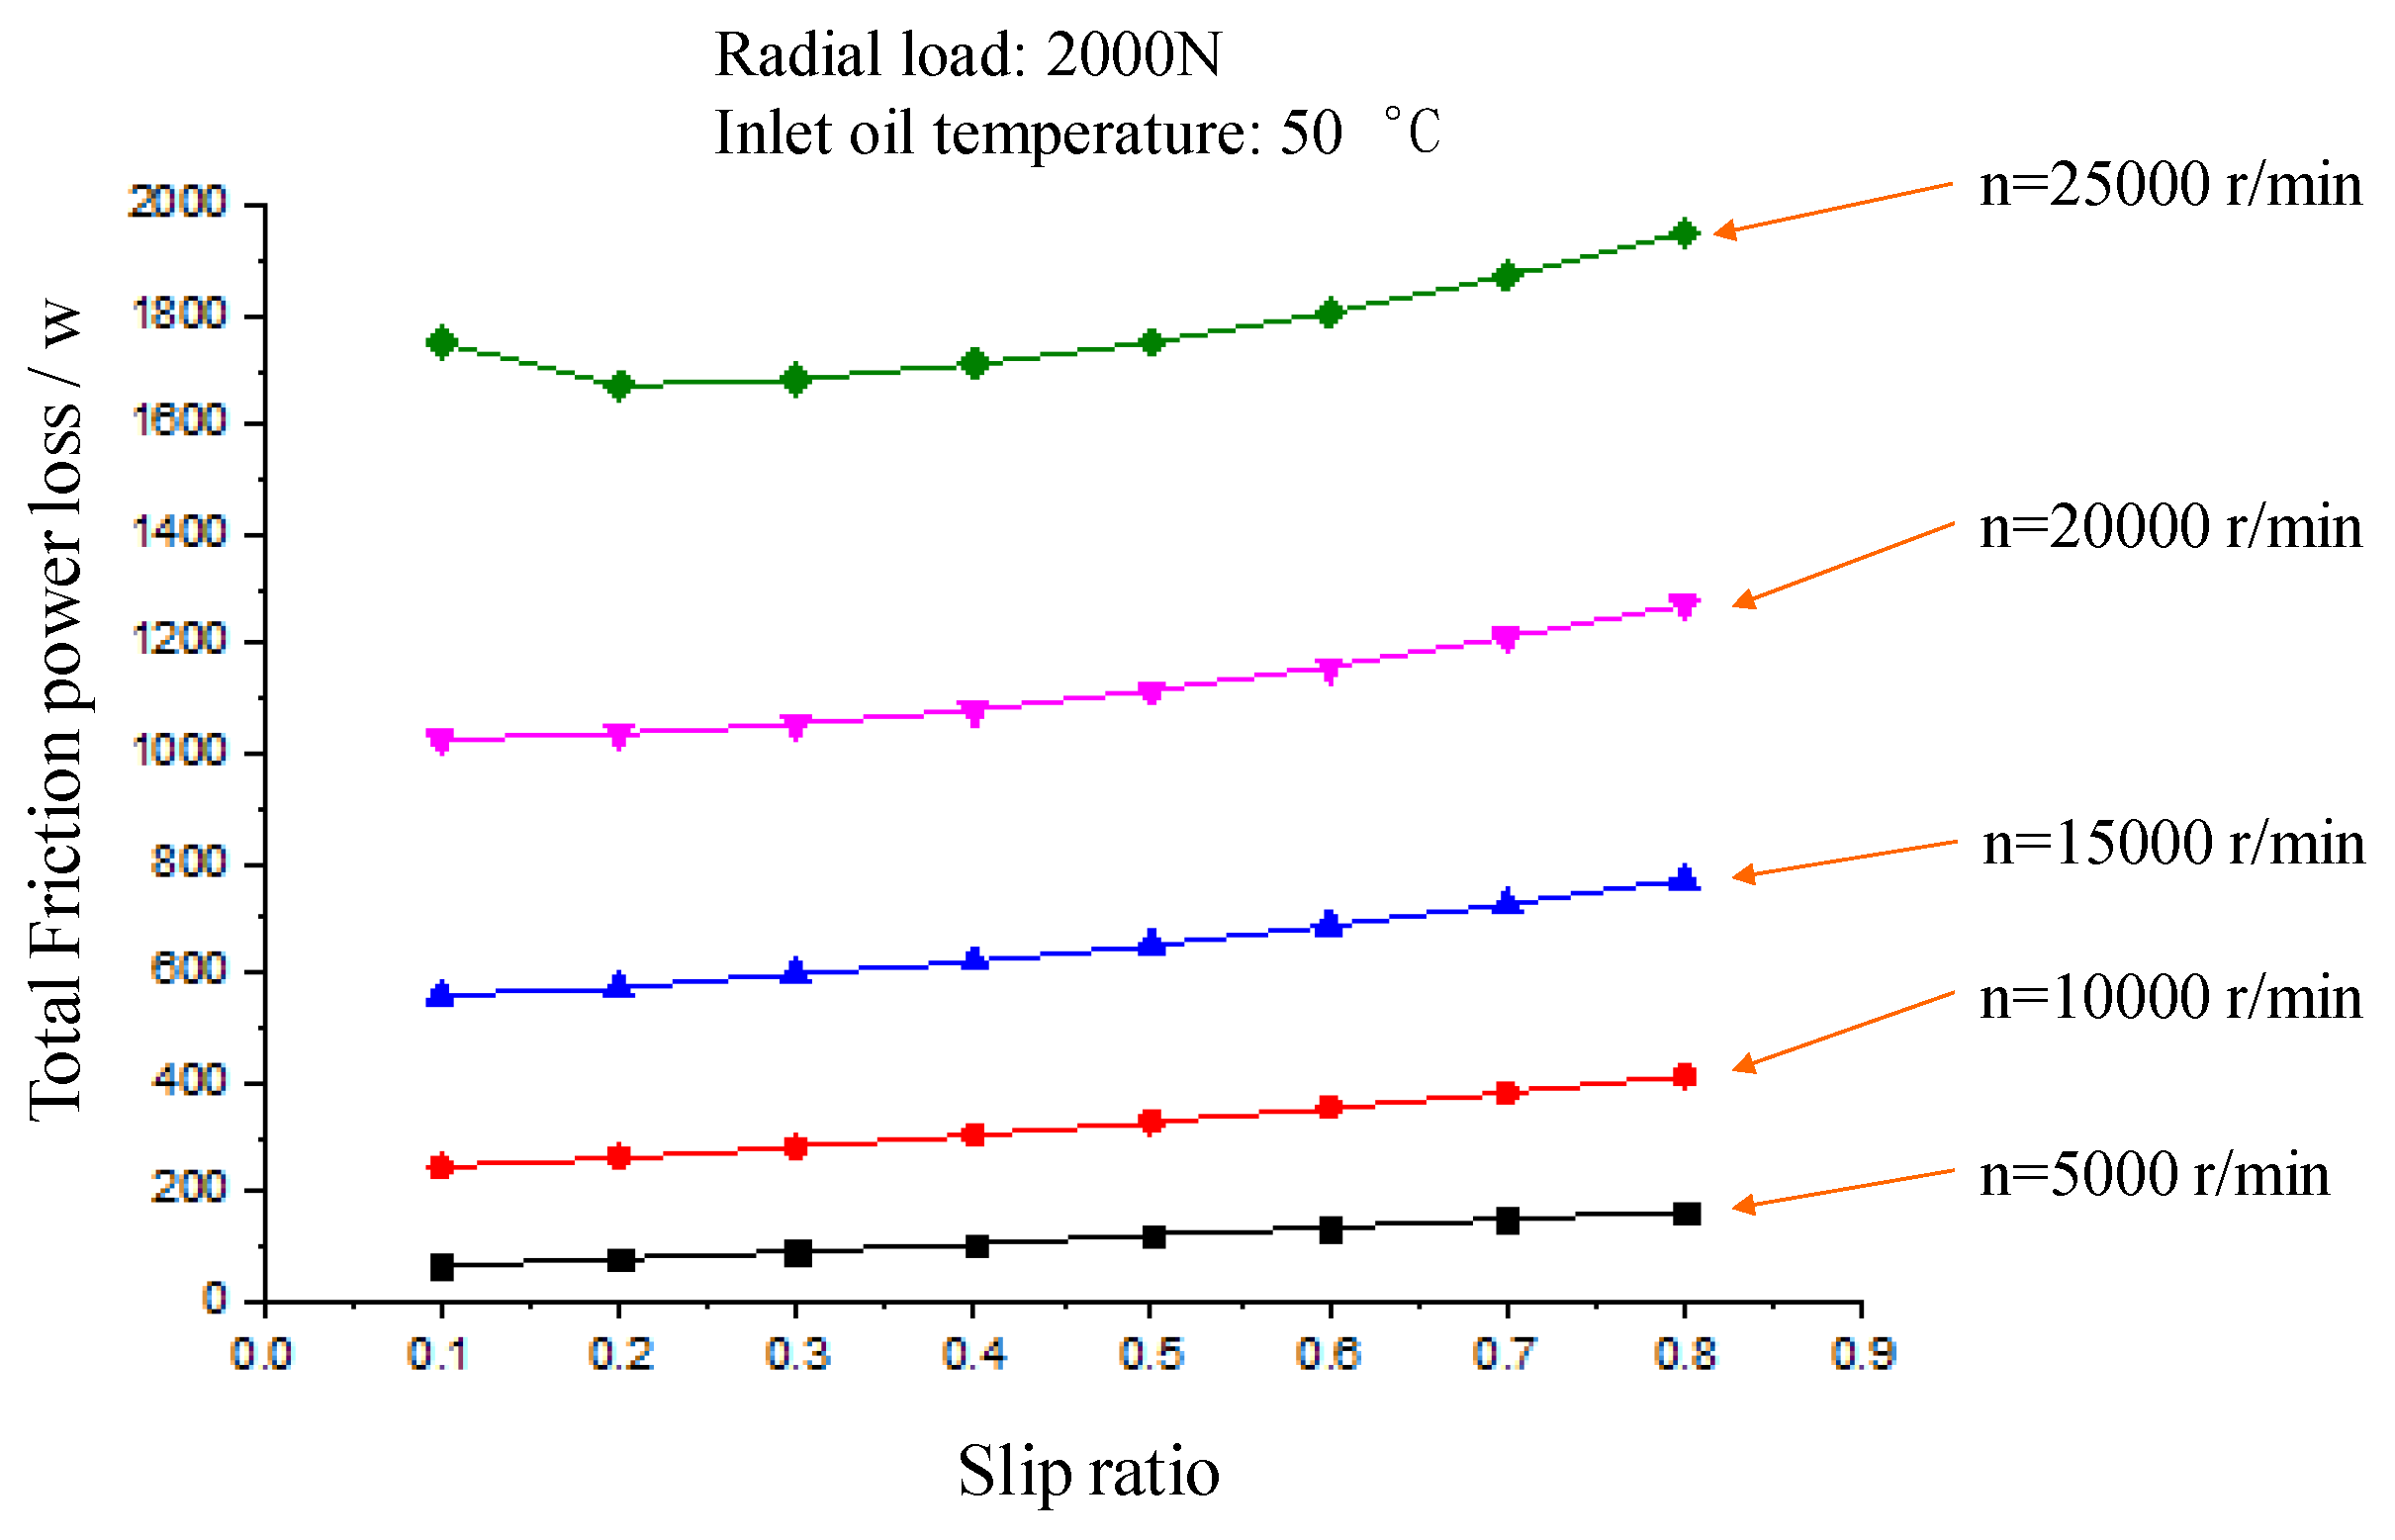
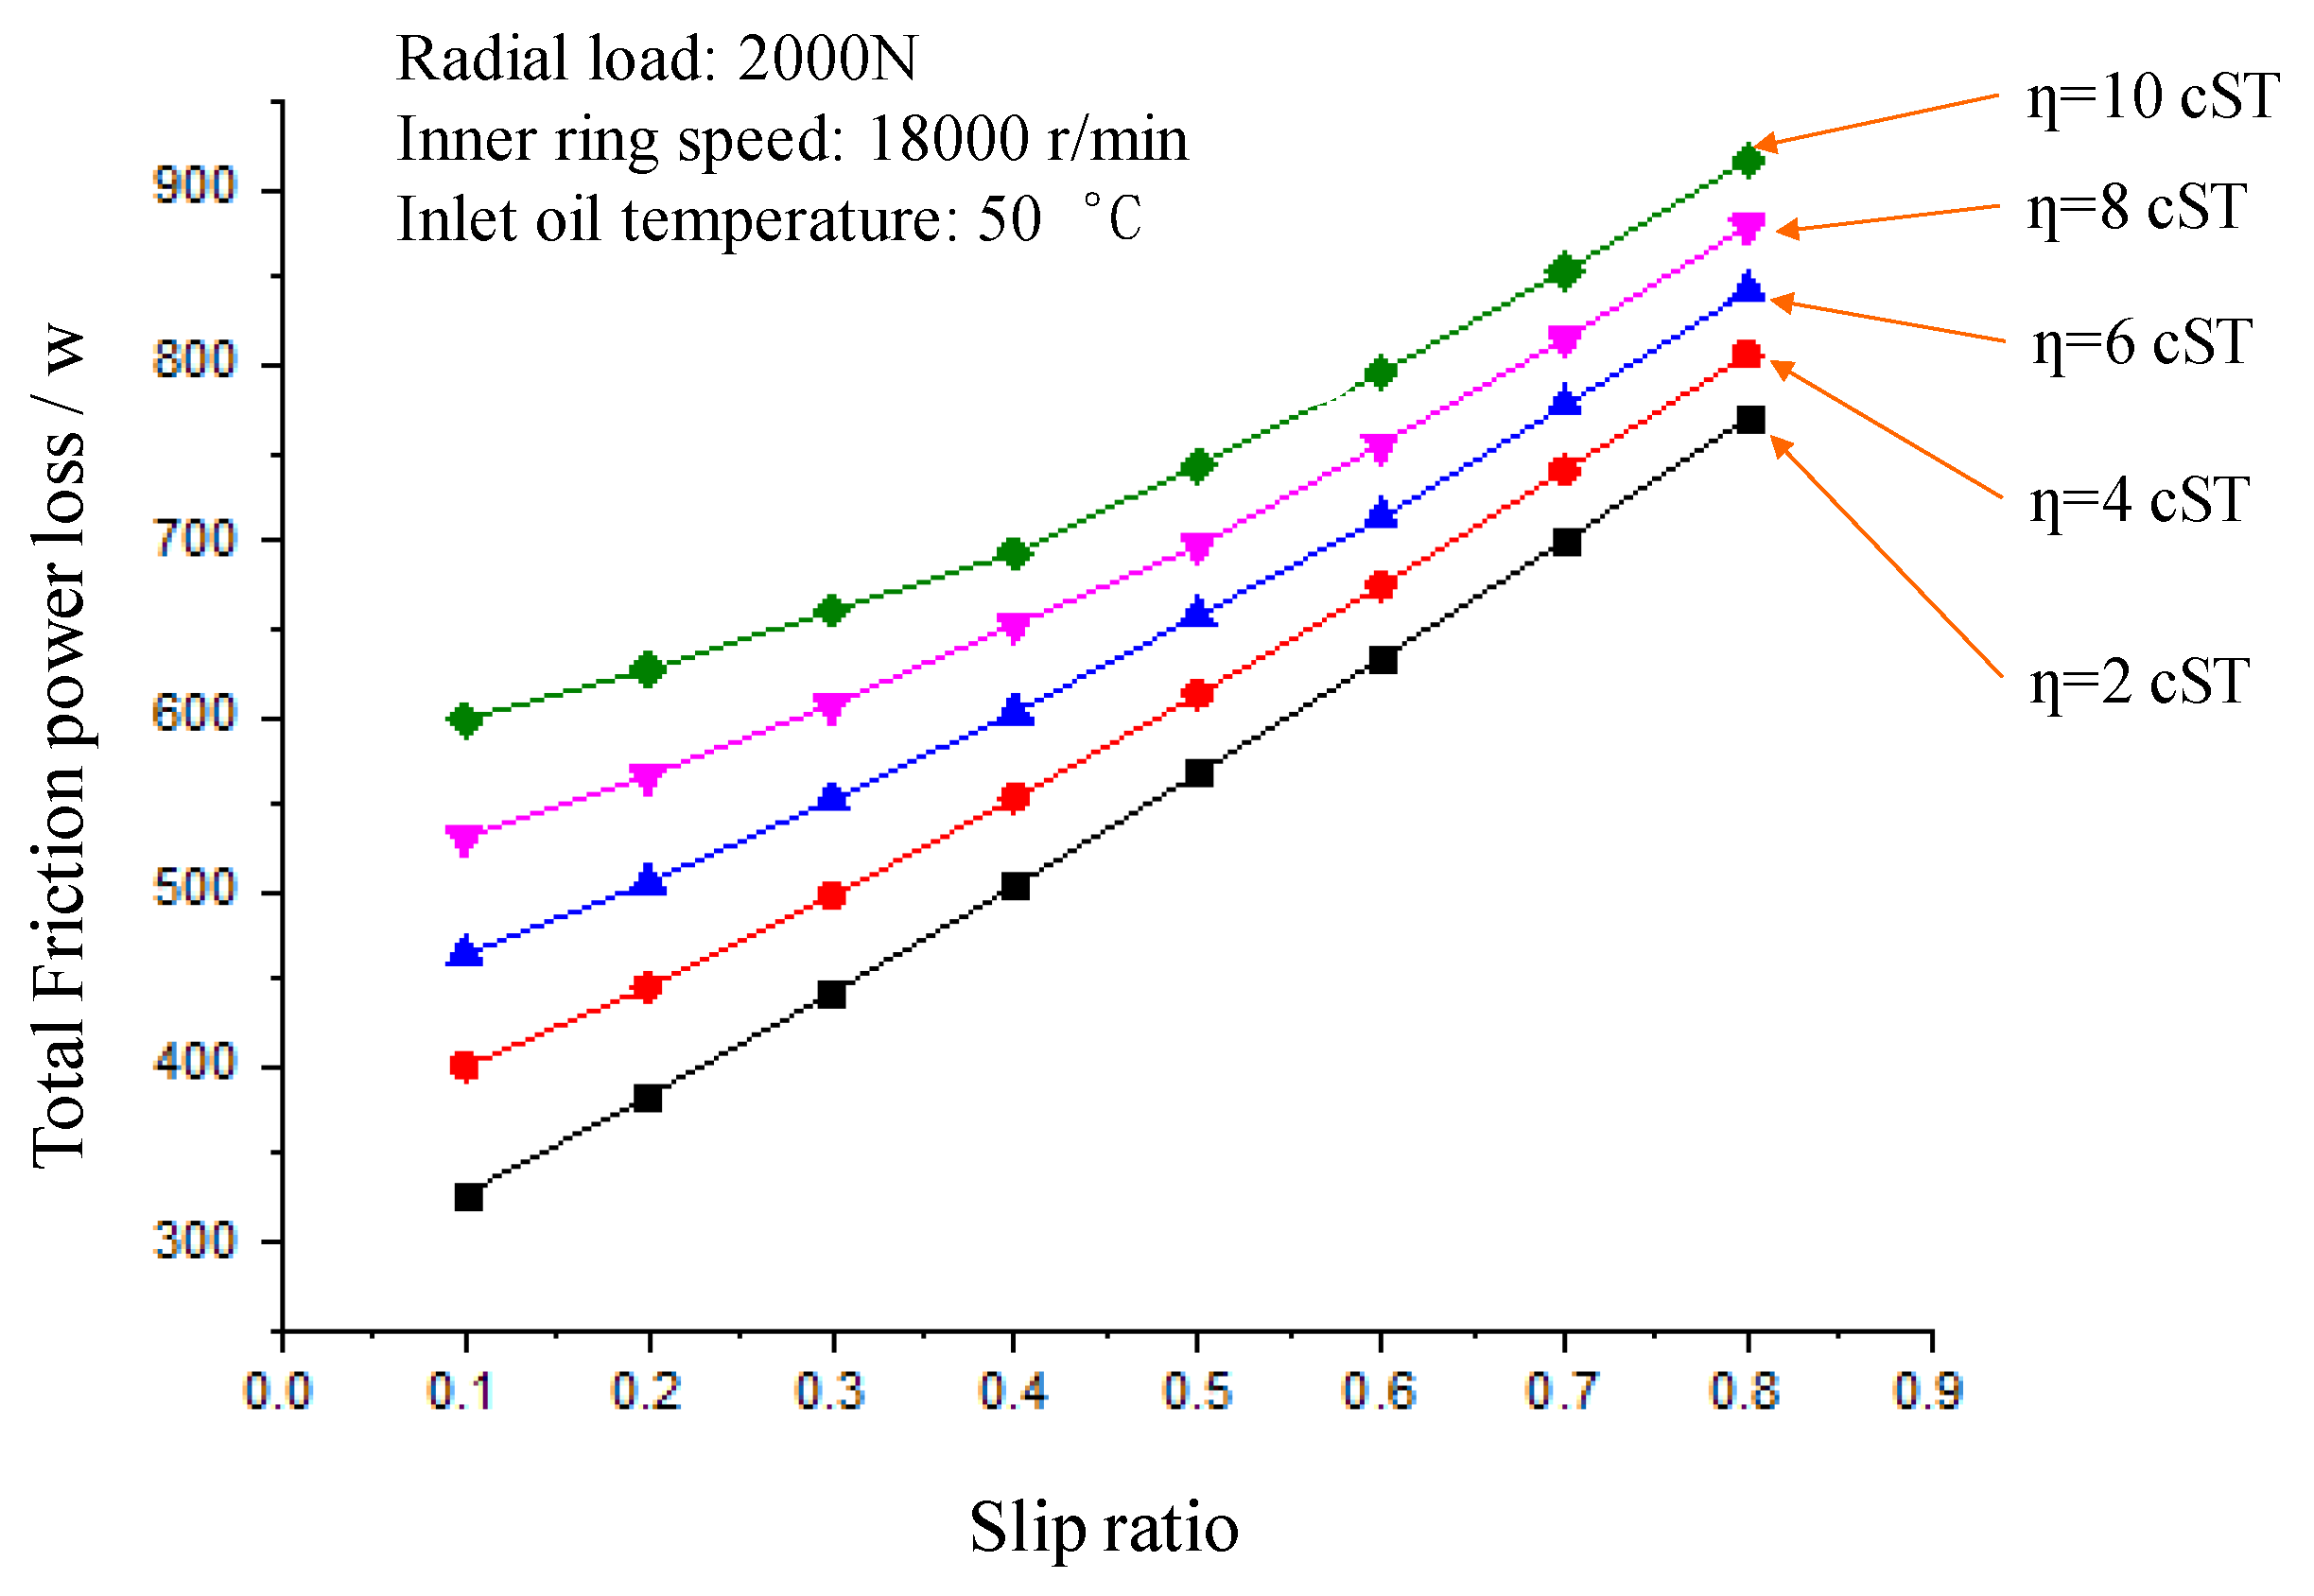
3. Theoretical Analysis of Friction Power Loss Distribution in HSLLRBs

A single-row cylinder roller bearing is taken as an example. The geometry and material parameters of the roller bearing are given in Table 1 and Table 2. The cage is made of H62 Cu material and the rest of the components use GCr15 bearing steel. The lubricant type is 4050(Sinopec inc., Beijing, China), which has a density of 971.2 kg/m3. The inlet oil temperature is 50 °C. The effects of various operating parameters on the heat distribution of the bearing considering skidding are investigated.
Figure 4 shows the total friction power loss distribution and friction power loss distribution of various parts of HSLLRBs under different slip ratios. The results show that the friction power loss of the inner ring and outer ring as well as the total friction power loss of the bearing increase as the slip ratio increases, but that the friction power loss of the cage guide surface and roller oil churning show a reverse trend. The main reason for this is that the increase in slip ratio can reduce the cage speed and roller speed. In addition, the increase in inner ring speed and kinematic viscosity leads to an increase in the bearing friction power loss. As the slip ratio increases, the actual speed of the cage is reduced, the centrifugal force becomes smaller, the increase in the friction power loss of the outer ring raceway slows down, and the friction power loss generated by the outer ring raceway increases faster than that of the inner ring.
Figure 5 shows the variation of the total friction power loss of the bearing under different slip ratios and inner ring speeds. The results show that, with the increase in inner ring speed, the total friction power loss increases; the higher the inner ring speed, the faster the increase in the total friction power loss. With the increase in the slip ratio, the total friction power loss of the bearing increases. The friction power loss of the bearing has a minimum when the inner ring speed is 25,000 r/min and the slip ratio is 0.2, because the reduction in the friction power loss of the oil stirring of roller and the guide surface of the cage are more than the increment in the friction power loss of the inner (outer) rings raceway under this working condition.
Figure 6 shows the variation of the total friction power loss of the bearing under different slip ratios and lubricant kinematic viscosities. The results show that, with the increase in the slip ratio, the total friction power loss of the bearing increases; with the increase in the kinematic viscosity, the total friction power loss of the bearing increases. Therefore, in the actual working condition of HSLLRBs, the kinematic viscosity of the lubricant at the same temperature is chosen to be as low as possible.

4. Finite Element Analysis of Temperature Distribution Characteristics in HSLLRBs

Based on the theoretical analysis model of the friction power loss of the rolling bearing considering skidding, the simulation analysis of the steady temperature field is carried out using ANSYS Workbench(14.0, Ansys inc., Canonsburg, PA, USA, 2011), so as to obtain the temperature distribution characteristics of the bearing. The transient simulation analysis of the bearing is carried out based on the steady-state temperature field analysis.

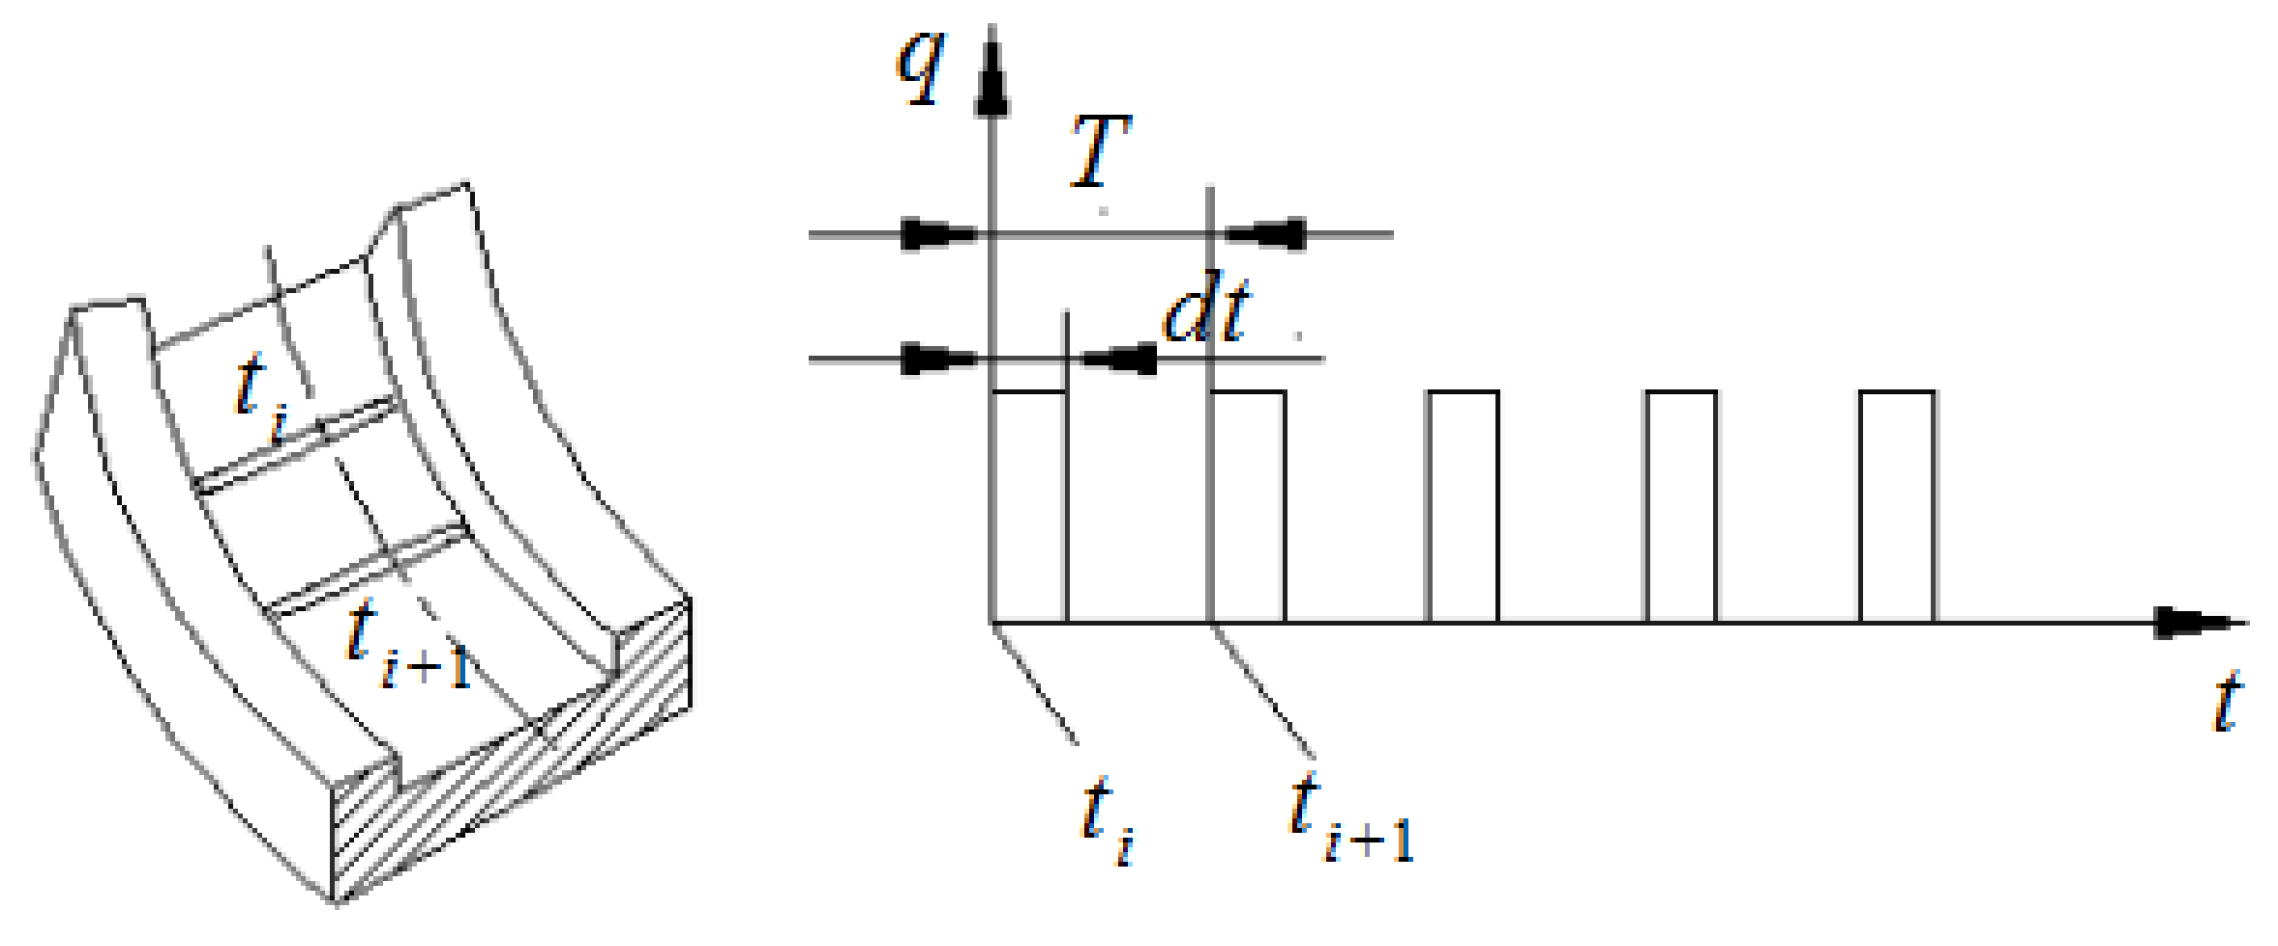
4.1. Friction Heat Source

In research on the working temperature field distribution of bearings, the first problem to be solved is the simplification of the friction heat source. Kannel et al. [30] regarded the heat transfer problem as a moving heat source between the roller and the inner and outer ring raceways of the rolling bearing, and assumed that the average heat generation acts on the contact surface through which the heat source passes. Based on the Kannel method, Wang et al. [18] considered that the raceway surface undergoes a cycle of limited heating and cooling of the roller, which finally causes the bearing to reach a stable temperature field.

4.2. Temperature Field Analysis Model

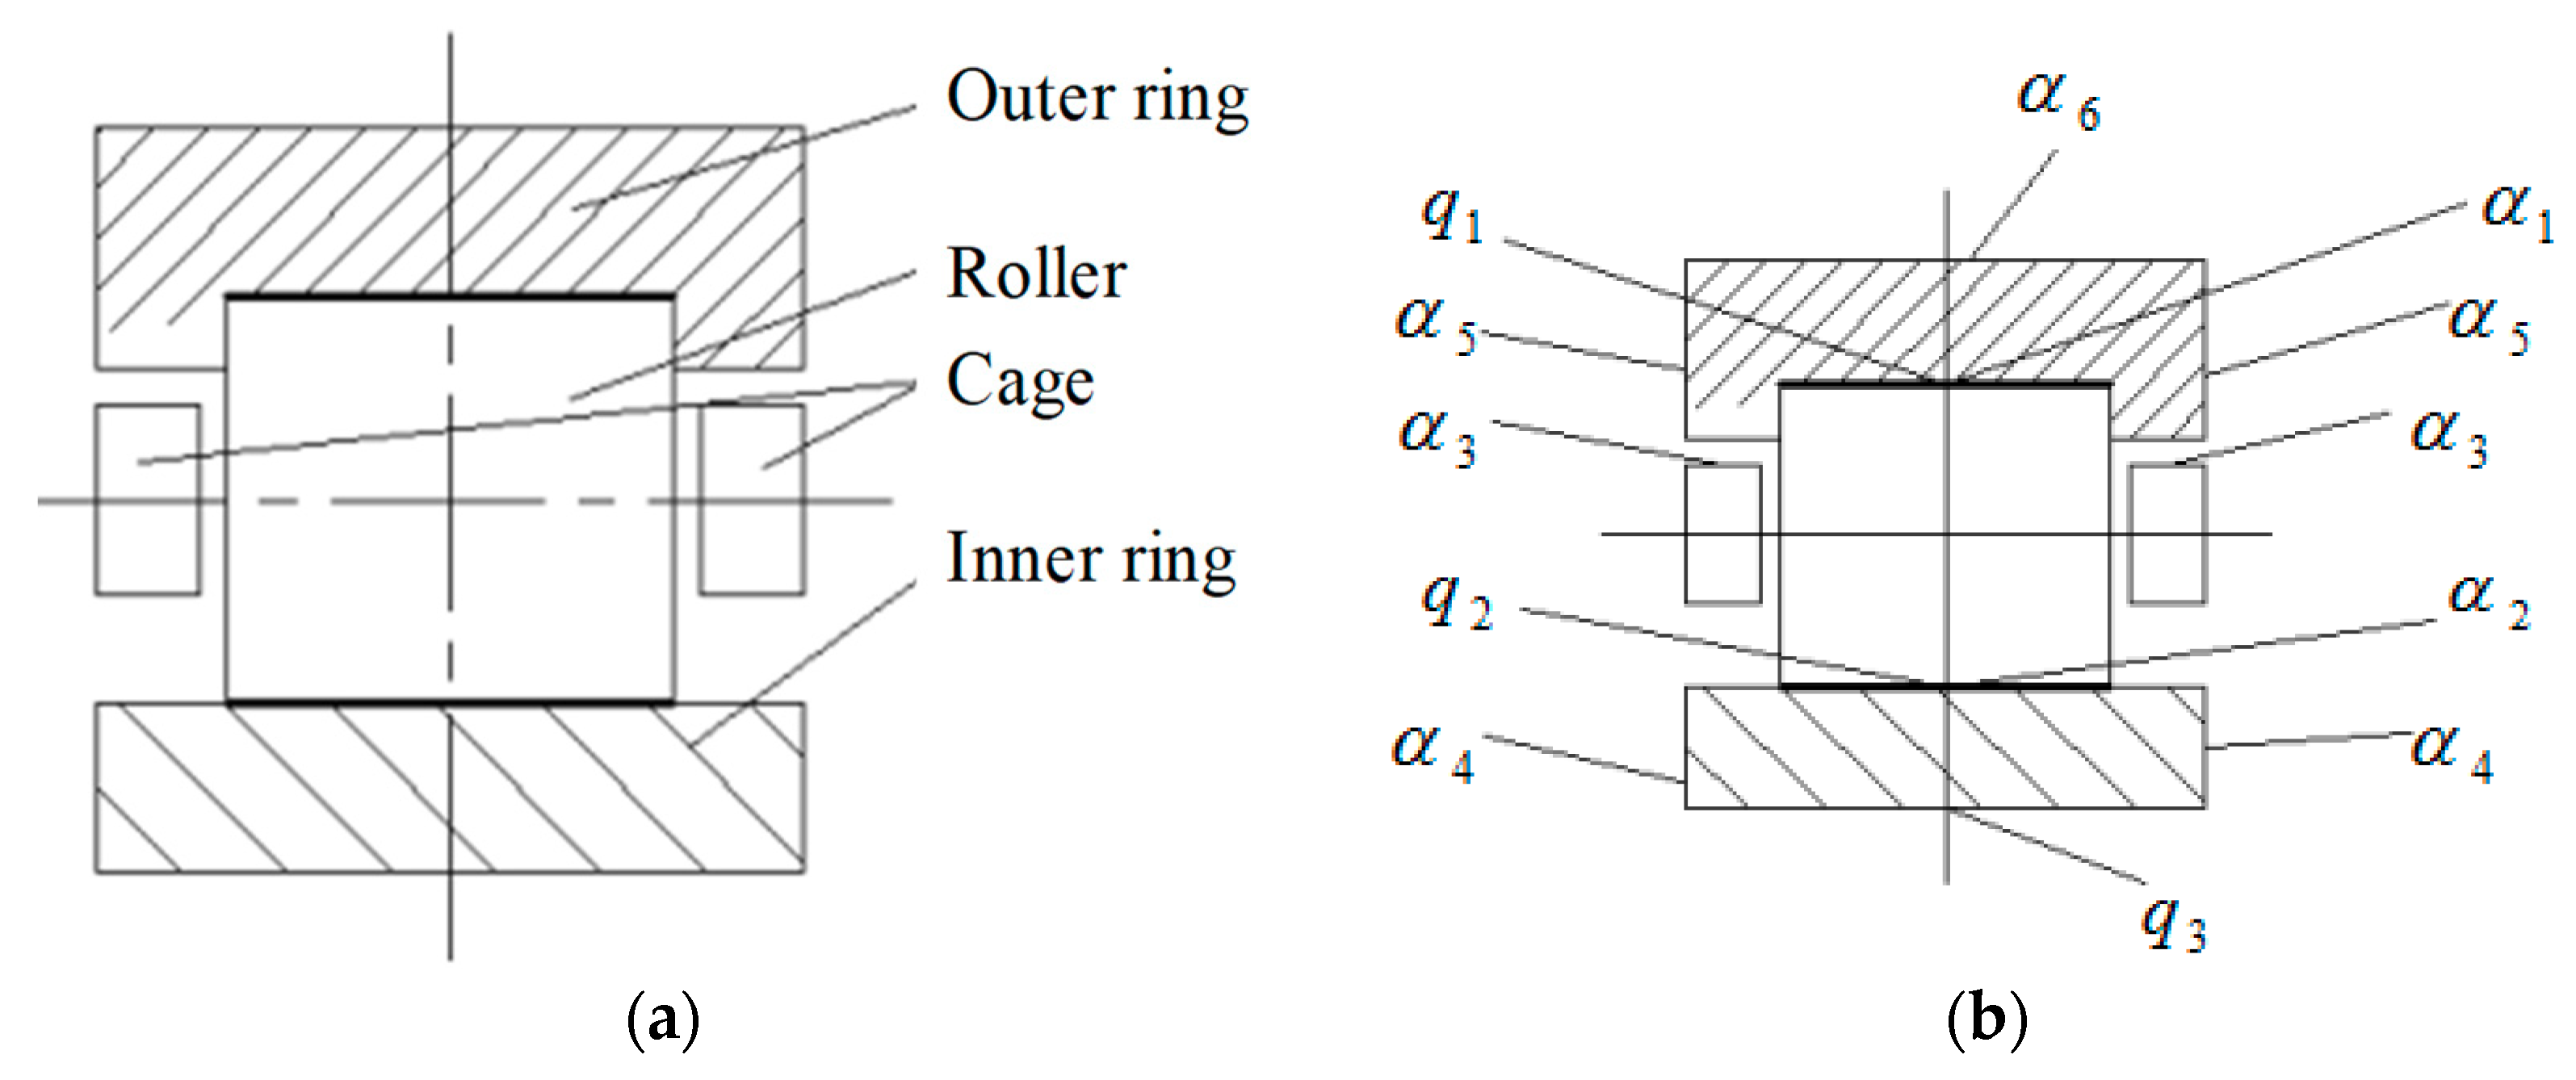
4.2.1. Contact and Heat Flux

The working temperature of rolling bearings depends on the type and flow of lubricating oils and the materials of the bearing. The working temperature distribution of the bearing can be calculated by inputting the heat conductivity parameter of the bearing material, lubricant parameter, heat flux, and heat convection coefficient into ANSYS Workbench.
The augmented Lagrangian multiplier method is used to define the contact between the roller and ring raceway, in which the roller is defined as the rigid target surface and the ring raceways are the flexible contact surface by using the surface contact.
The friction heat is loaded by the heat flux, as shown in Figure 7.
The heat flux q applied on the contact surface can be given as:
q = { I × H / A t i < t < t i + d t 0 t i + d t < t < t i + 1
Here, I is the heat distribution coefficient, H is the contact surface friction power loss, and t is action time. The results obtained by Burton et al. [31] showed that the value of I is 0.5.
The heat source action cycle T can be given as:
T = 2 π N | ω c ω n |  
The heat source action time dt can be obtained as follows:
d t = 2 b n D m | ω c ω n |  

4.2.2. Heat Transfer Model

Under the conditions of high speed and light load, the heat convection between the viscous flow lubricant and bearing elements is mainly considered in rolling bearings. The internal heat radiation of the bearings can be neglected. In this study, considering that skidding takes place, thermal conduction through solid-solid contact is negligible in comparison with the thermal convection.
Heat is transferred from the bearing element to the lubricant and, thereafter, to the rest of the bearing seat. There is also heat convection between the outer surface of the housing and the surrounding air. The heat flux Hv on the solid surface can be expressed as:
H v = α A ( T s u r f a c e T a m b i e n t )  
Here, Tsurface is the surface temperature and the Tambient is the environment temperature. The formula of heat convection coefficient α proposed by Rumbarger is adopted [7]. This formula considers the heat convection of the inner (outer) raceway surface, cage surface, roller surface, and lubricant.
(1) The heat convection coefficient of oil between the inner ring and the cage can be calculated as:
α 1 = 0.175 K R R i ω i C η C R / l n ( 1 + C R )  
(2) The heat convection coefficient of oil between the outer ring and the cage can be calculated as:
α 2 = 0.175 K R R ( ω c m ω c m × s f ) C η C R / l n ( 1 + C R )  
(3) The heat convection coefficient of air on the surface of the bearing seat can be obtained as follows:
α 3 = 0.53 k D h ( G r P r ) 1 / 4  
Here, Gr is the Grashof number and Pr is the Prandtl constant of the air. The natural heat convection coefficient between the outer surface of the bearing seat and air can be calculated.
(4) The loading analysis model of heat flux and the heat convection coefficient of the bearing is shown in Figure 8a, and the convection boundary conditions on each surface of the bearing are shown in Figure 8b. Loading is as follows: the heat flux of the outer ring raceway is q1, the heat convection coefficient of the outer ring raceway is α1, the heat convection coefficient of the outer surface of the outer ring is α5 = α1/3, and the natural convection coefficient of the outer surface of the outer ring is α6. The heat convection density of the inner ring raceway surface is q2, the heat convection coefficient of the inner ring raceway is α2, and the heat convection coefficient of the outer end of the inner ring is α4 = α2/2. The thermal convection coefficient between the cage and the guide surface of the outer ring is α3 = 2α1. The physical properties of the bearing roller and inner (outer) ring material are the same or similar, and the friction heat between the bearing roller and the ring raceway proposed by Burton [31] is distributed in a ratio of 1:1 on the contact surface.

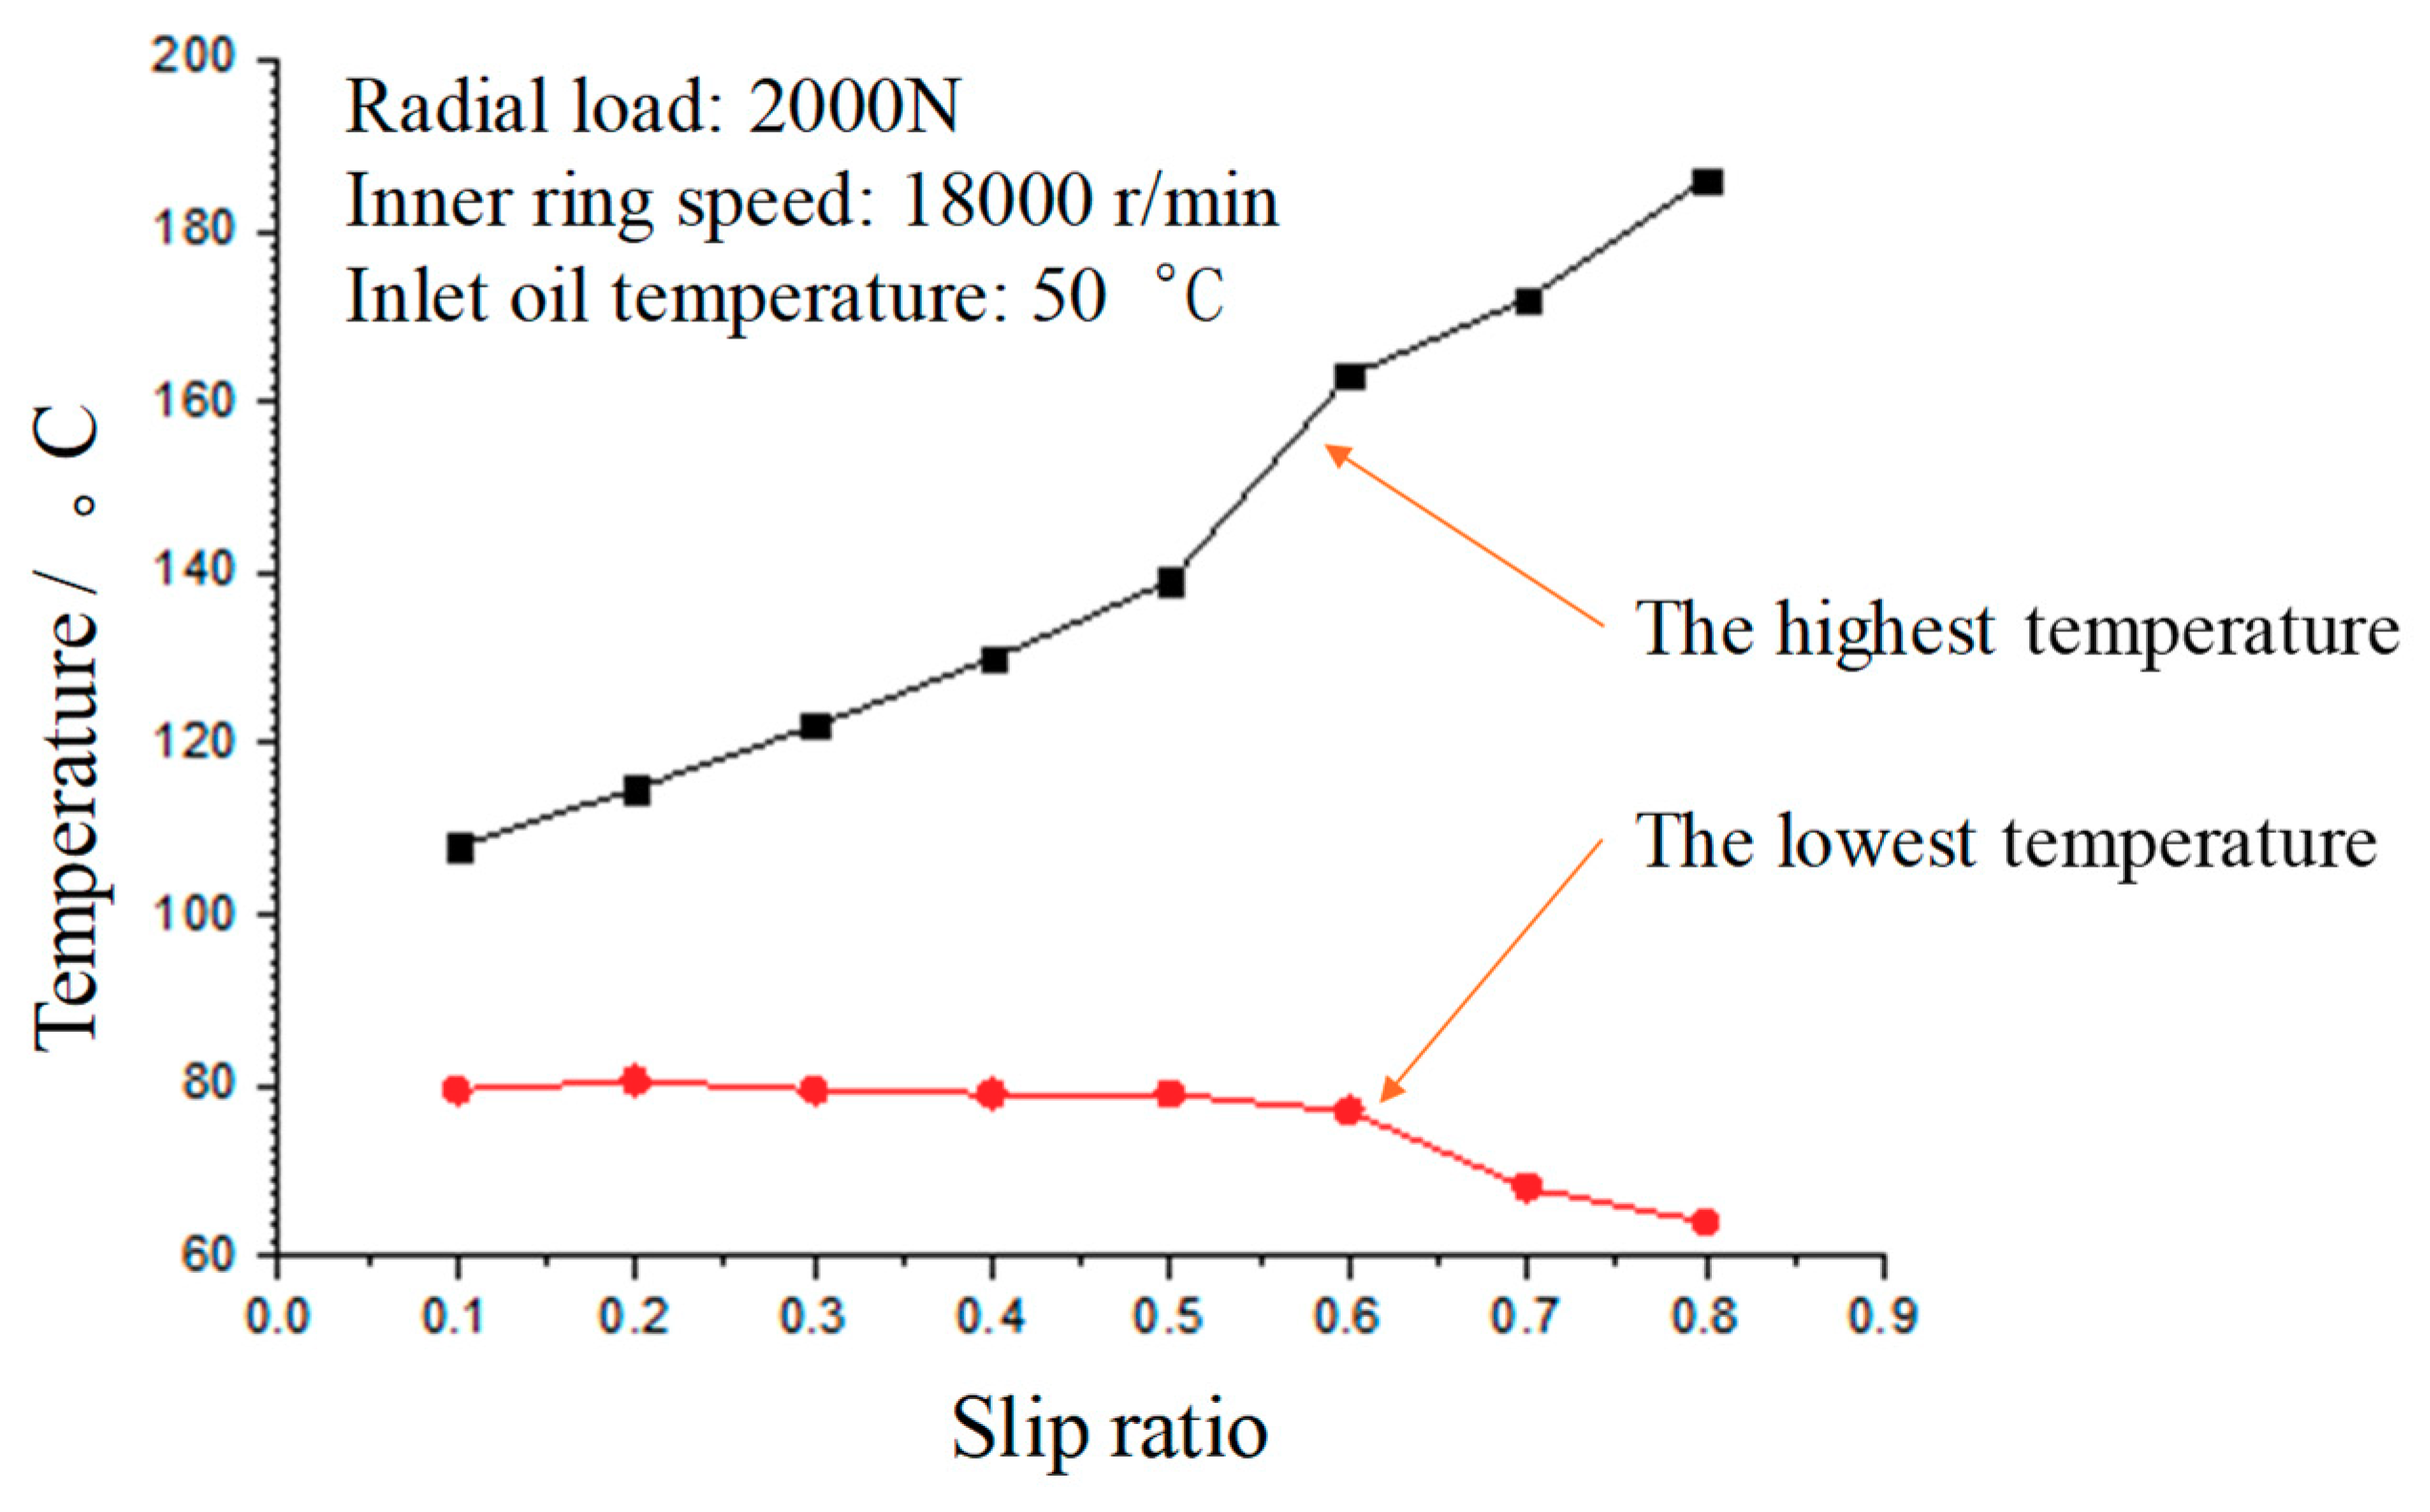
4.3. Temperature Distribution Analysis

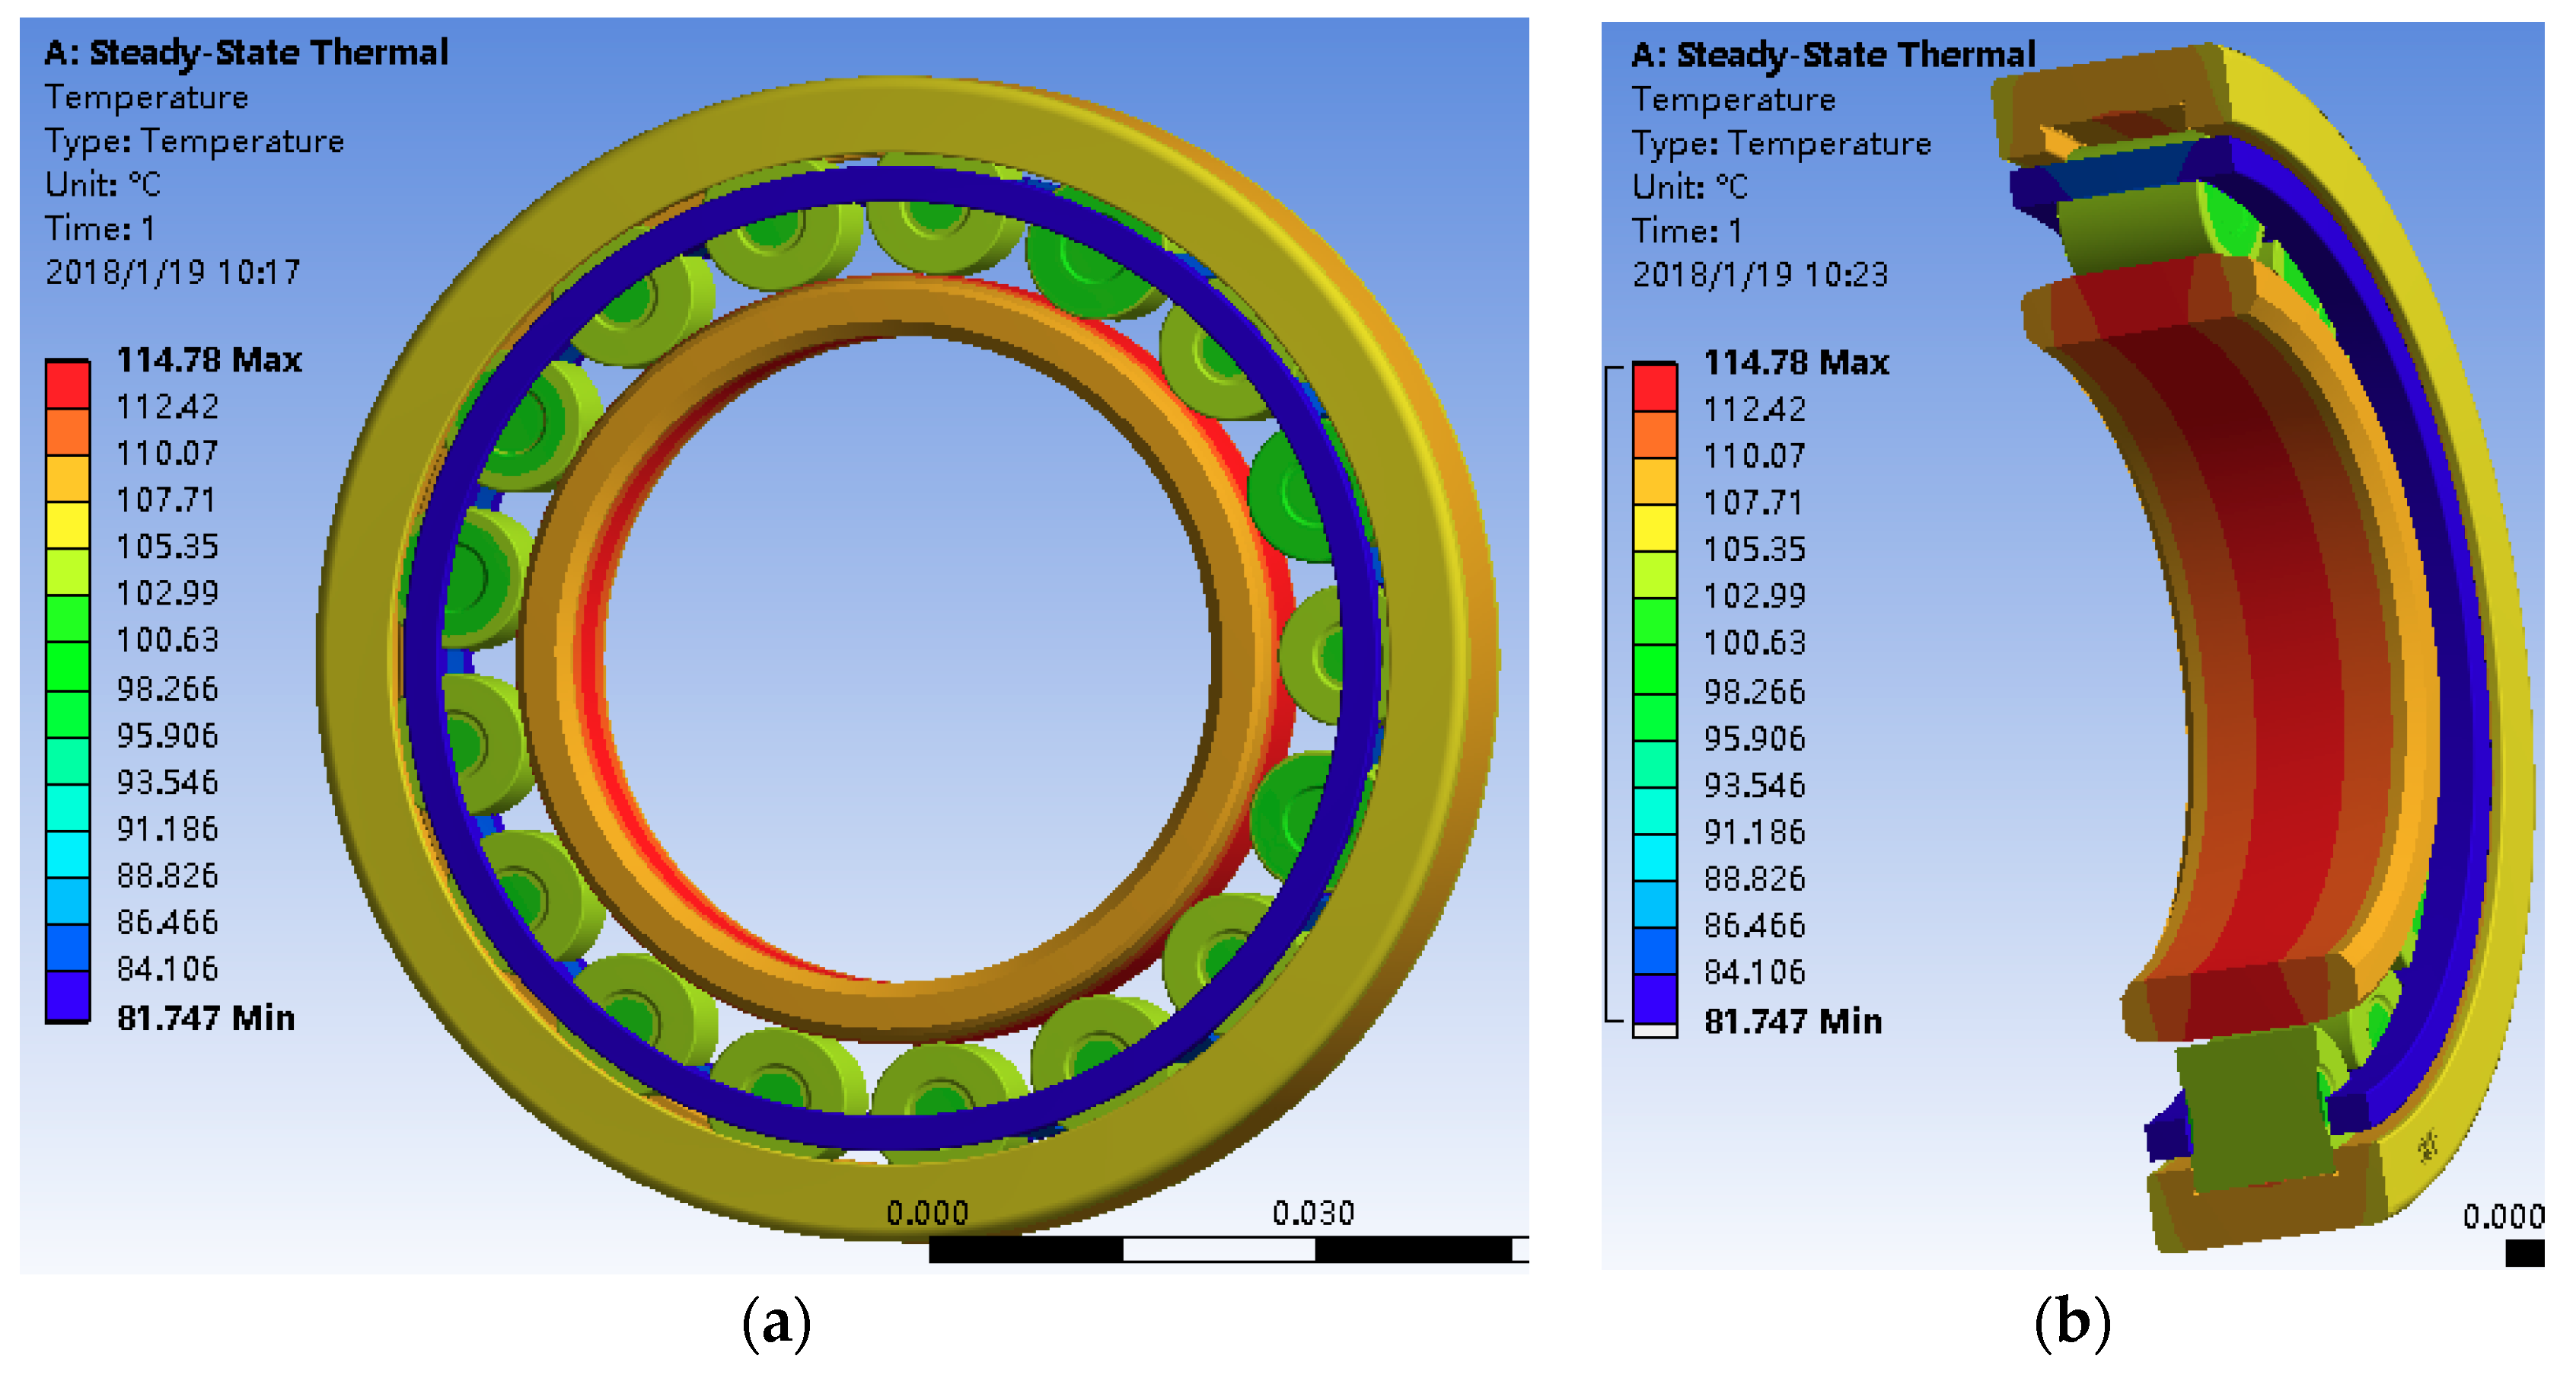
4.3.1. Steady-State Thermal Analysis

The steady-state thermal distribution is obtained by solving the temperature matrix equation:
[ K ] { T } = { Q ( T ) }  
This equation is based on Fourier's law, in which [K] and [Q] are constants. It is a linear equation, and the transient effect is not considered in the steady-state analysis.
In this study, the steady temperature distribution of the roller bearing is analyzed, and the parameters of the bearing are given in Table 1 and Table 2. The roller is defined as the rigid target surface and the two ring raceways are flexible contact surfaces. The rolling friction coefficient between the roller and the inner and outer raceways is 0.0025. The cylindrical roller bearing mesh is divided into 258,381 nodes and 150,100 units.
Figure 9 is the steady temperature distribution diagram of the bearing. The results show that the highest temperature of the bearing is 114.78 °C at the center of the inner ring raceway, and the lowest temperature is 81.74 °C on the outer surface of the cage.
Figure 10 shows the temperature distribution in HSLLRBs with different slip ratios. The highest temperature shows an increasing trend from 108 °C to 186 °C, but the lowest temperature shows a reverse trend. The main reason for this is that the increment in friction heat of the inner (outer) rings raceway is greater than the reduction in friction heat of the oil stirring of the roller and the guide surface of the cage. In addition, the results also show that the inner ring raceway has the highest temperature, while the cage has the lowest.

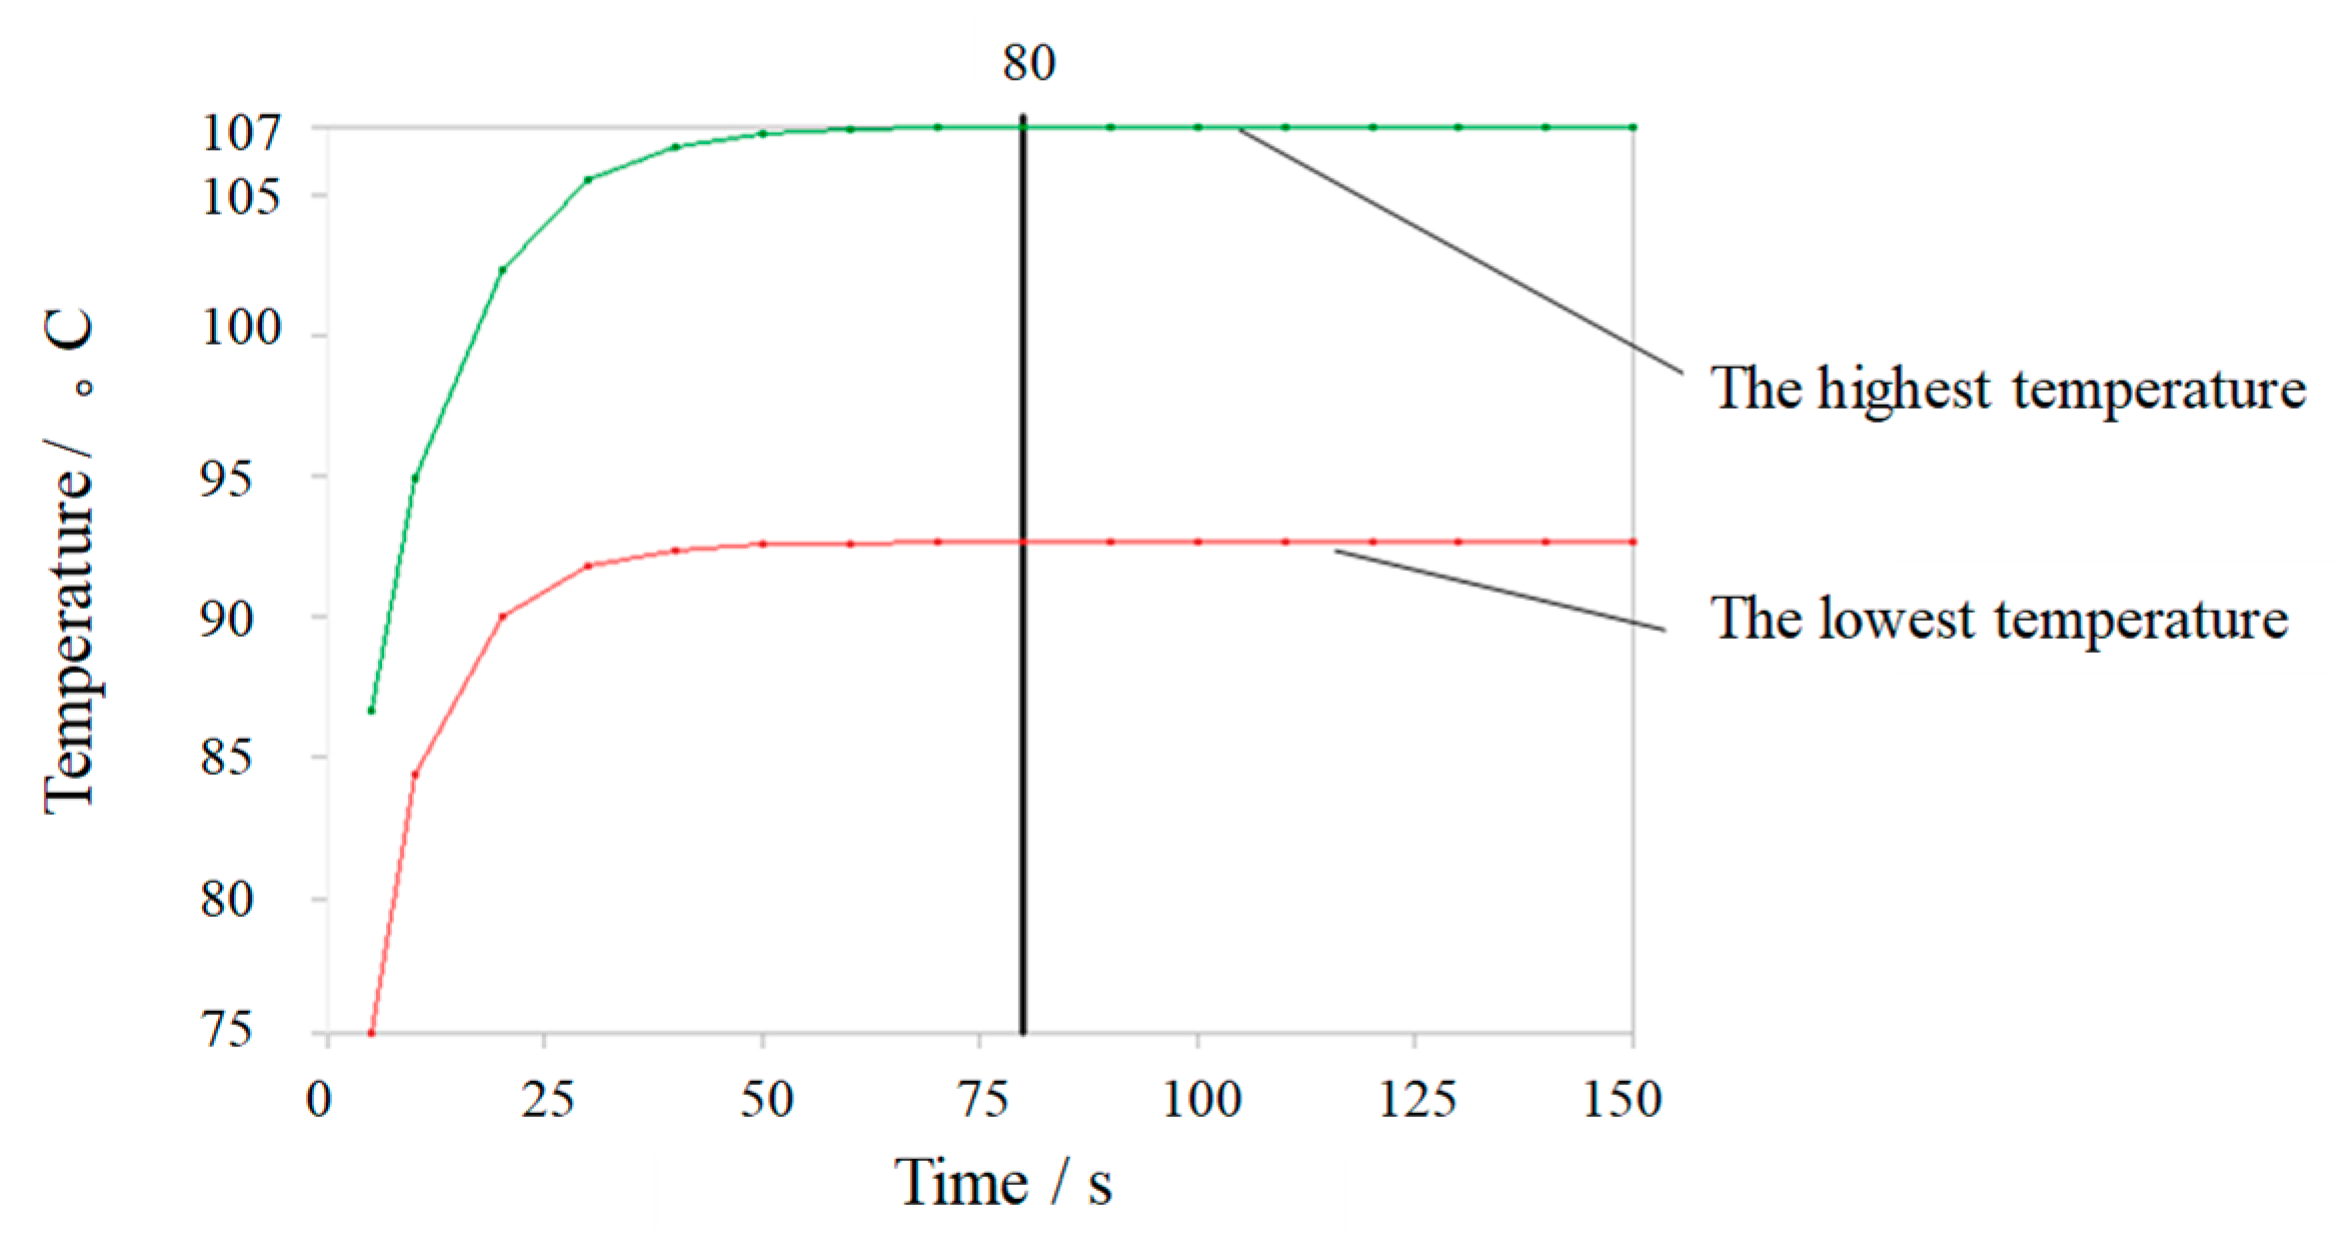
4.3.2. Transient Thermal Analysis

The transient thermal analysis equation can be expressed in the following form:
[ C ] { T } + [ K ] { T } = { Q }  
The slip ratio is 0.2, the radial load is 2000 N, and the inner ring speed is 13,000 r/min. Figure 11 shows the transient temperature distribution of HSLLRBs. The results show that, after the bearing is heated, its temperature increases rapidly; subsequently, the increase slows down, and eventually reaches the steady state at 107 °C. For this working condition, when the time exceeds 80 s, the maximum temperature of the bearing remains stable, and the temperature distribution of the bearing reaches a steady state.

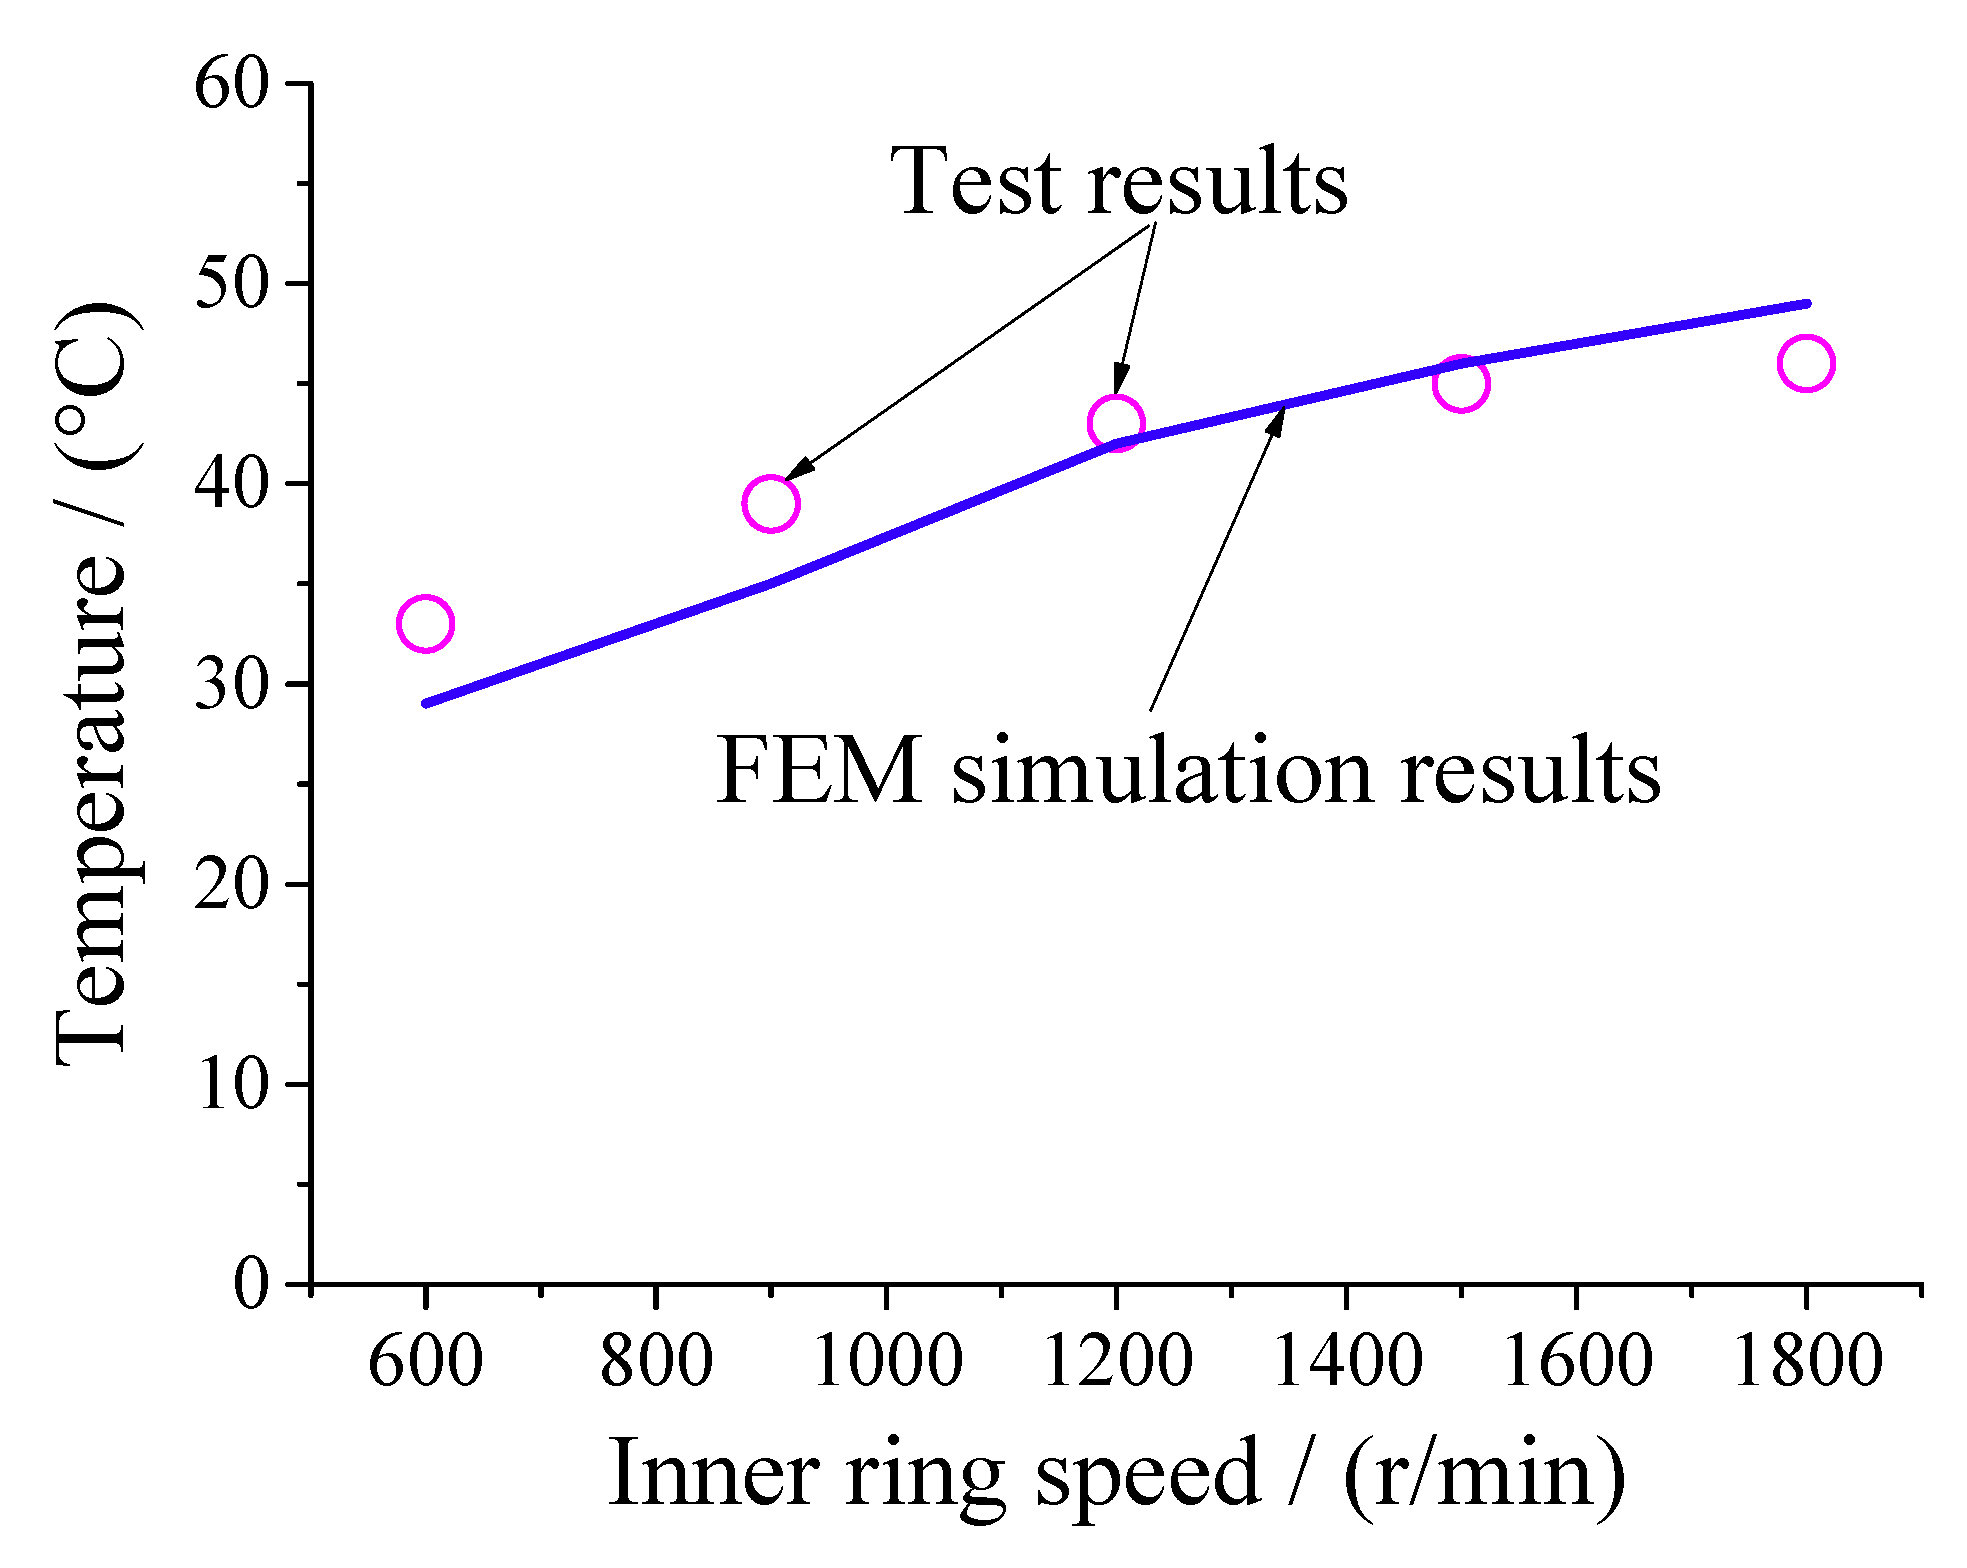
5. Experimental Validation

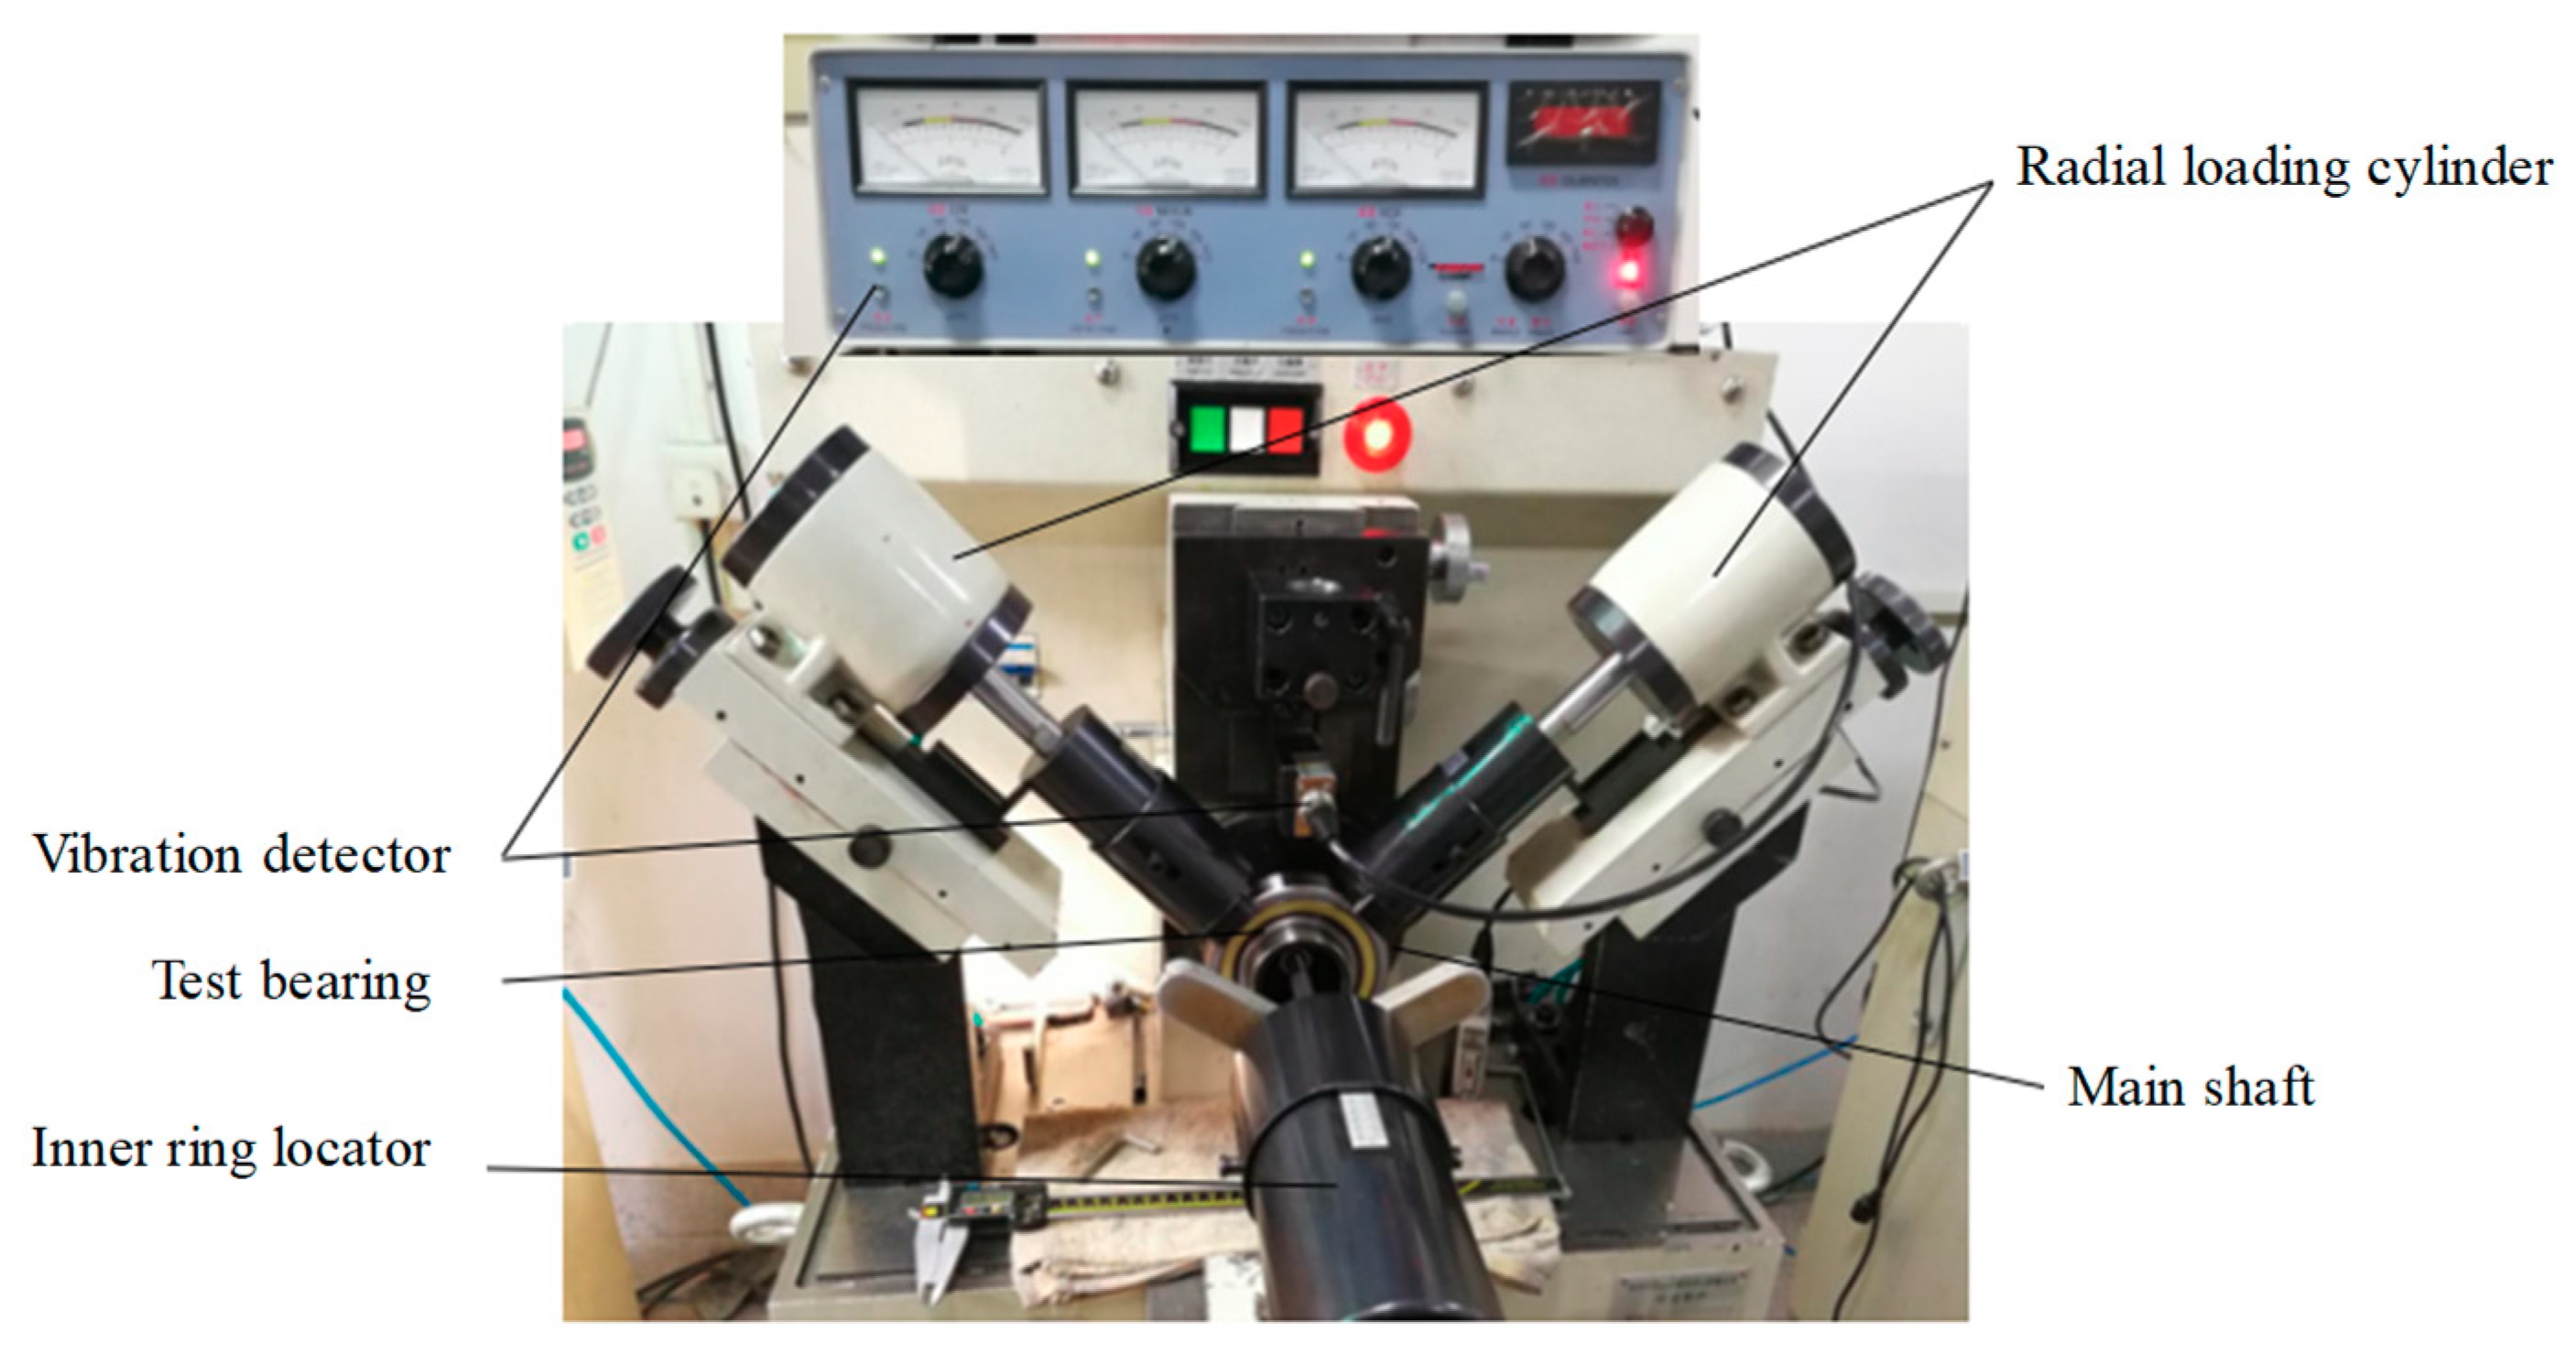
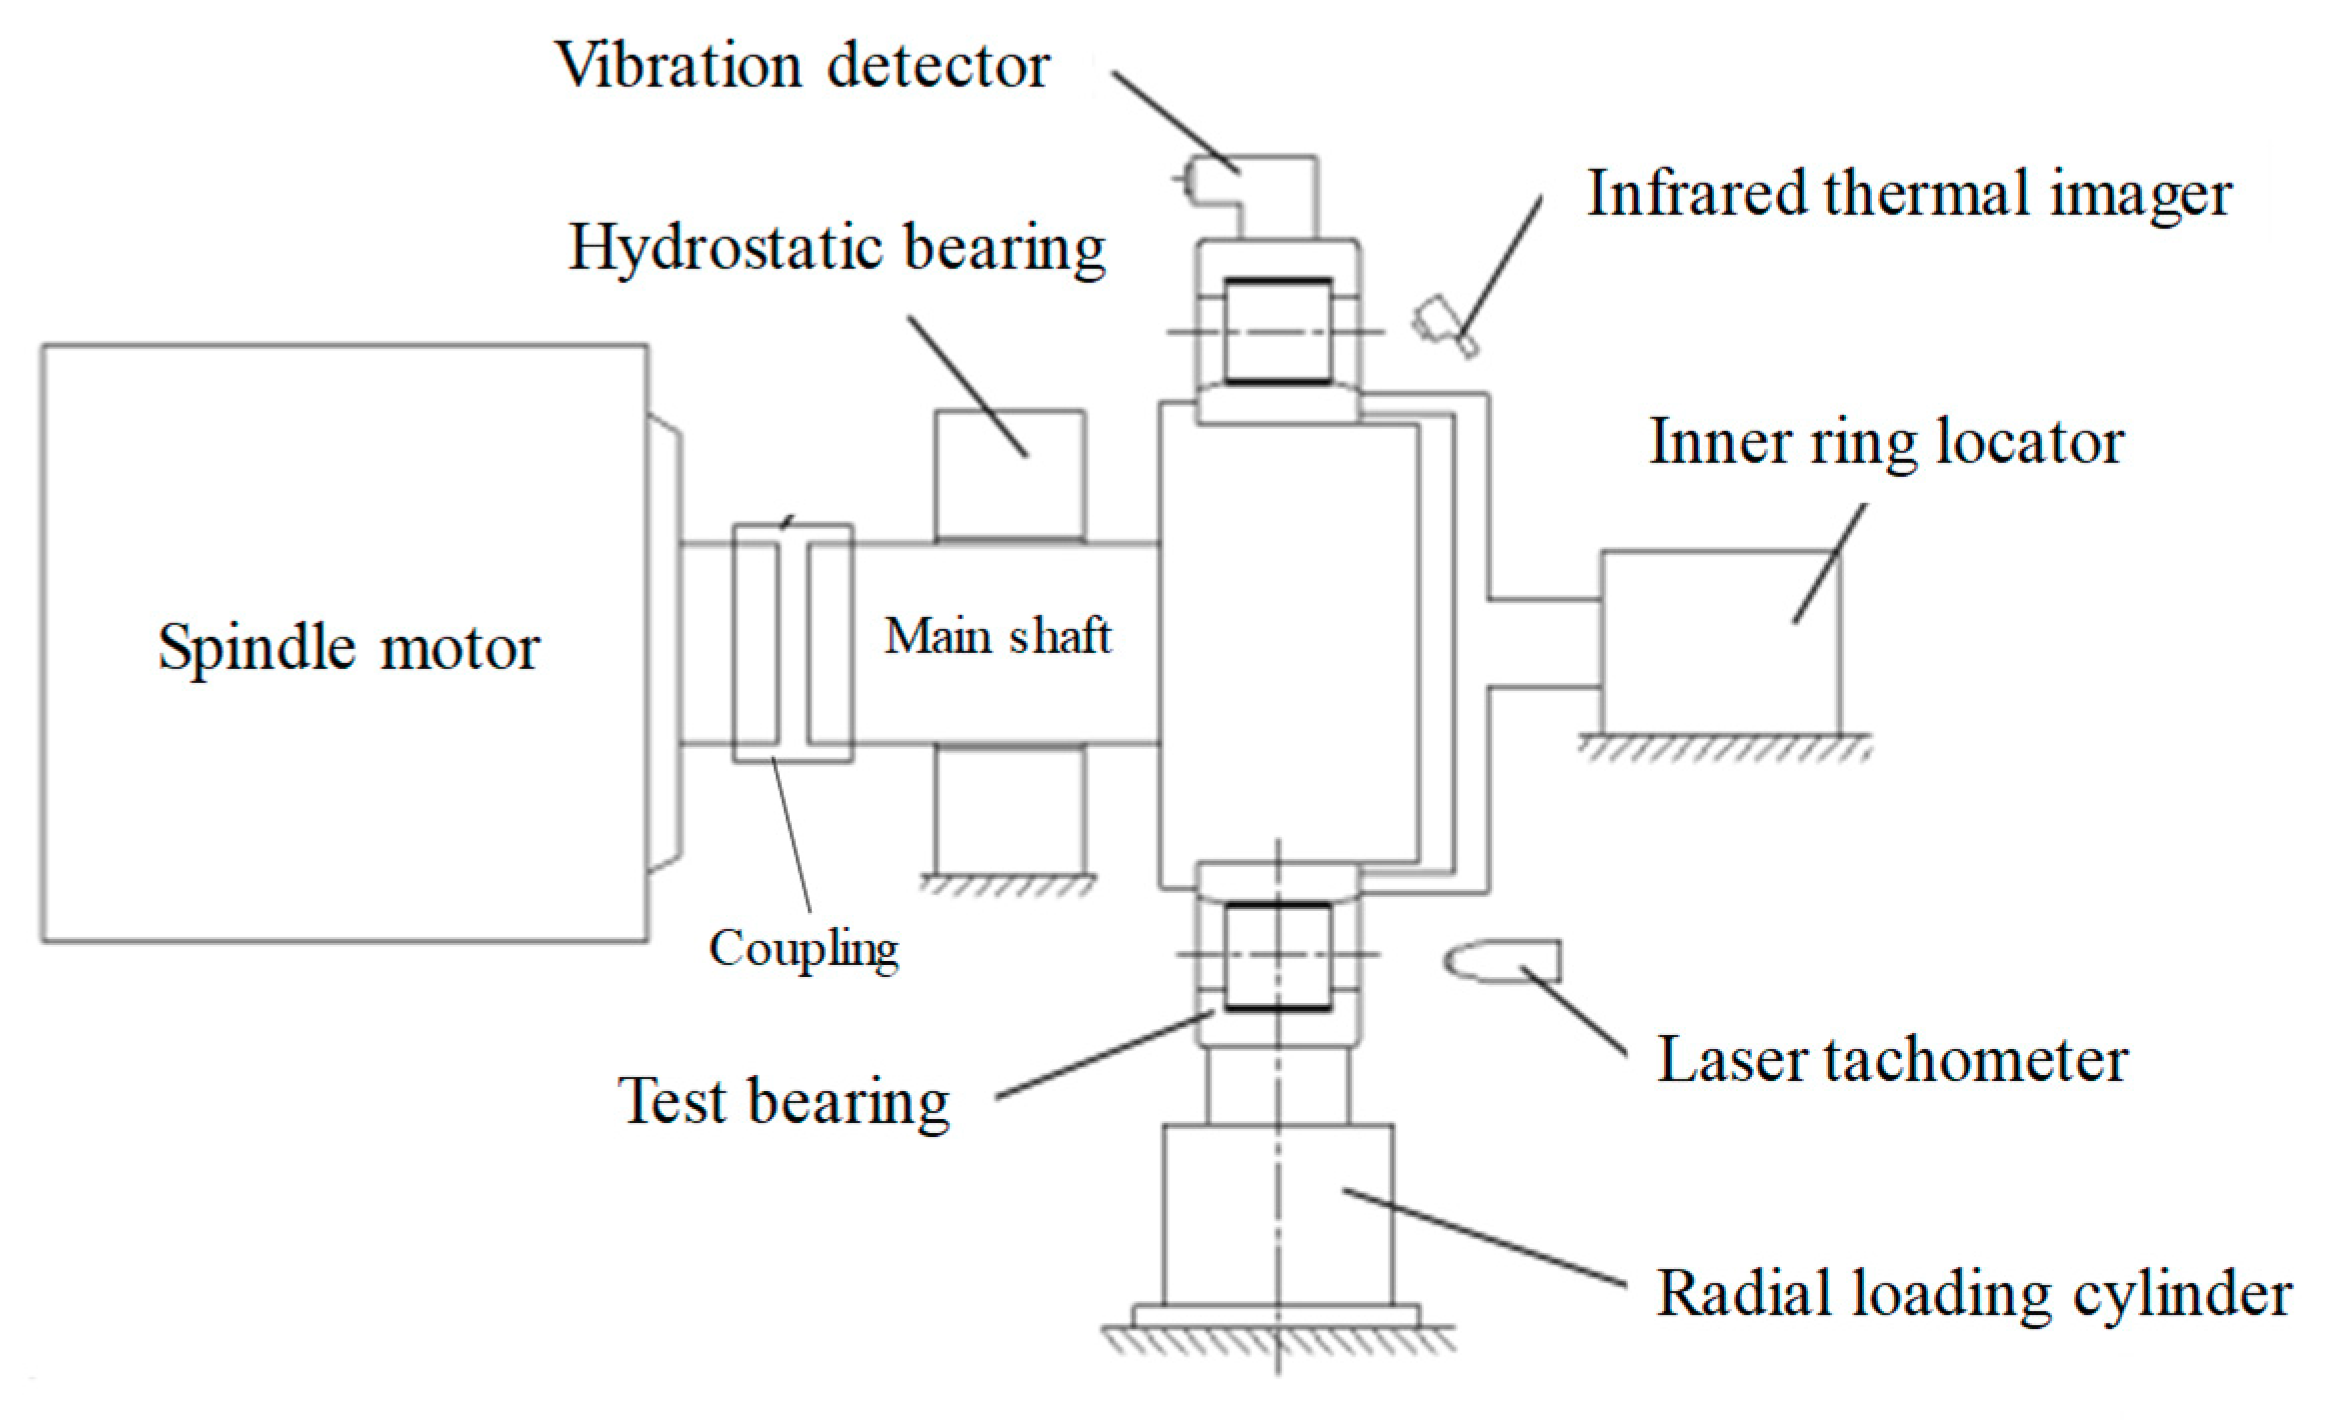
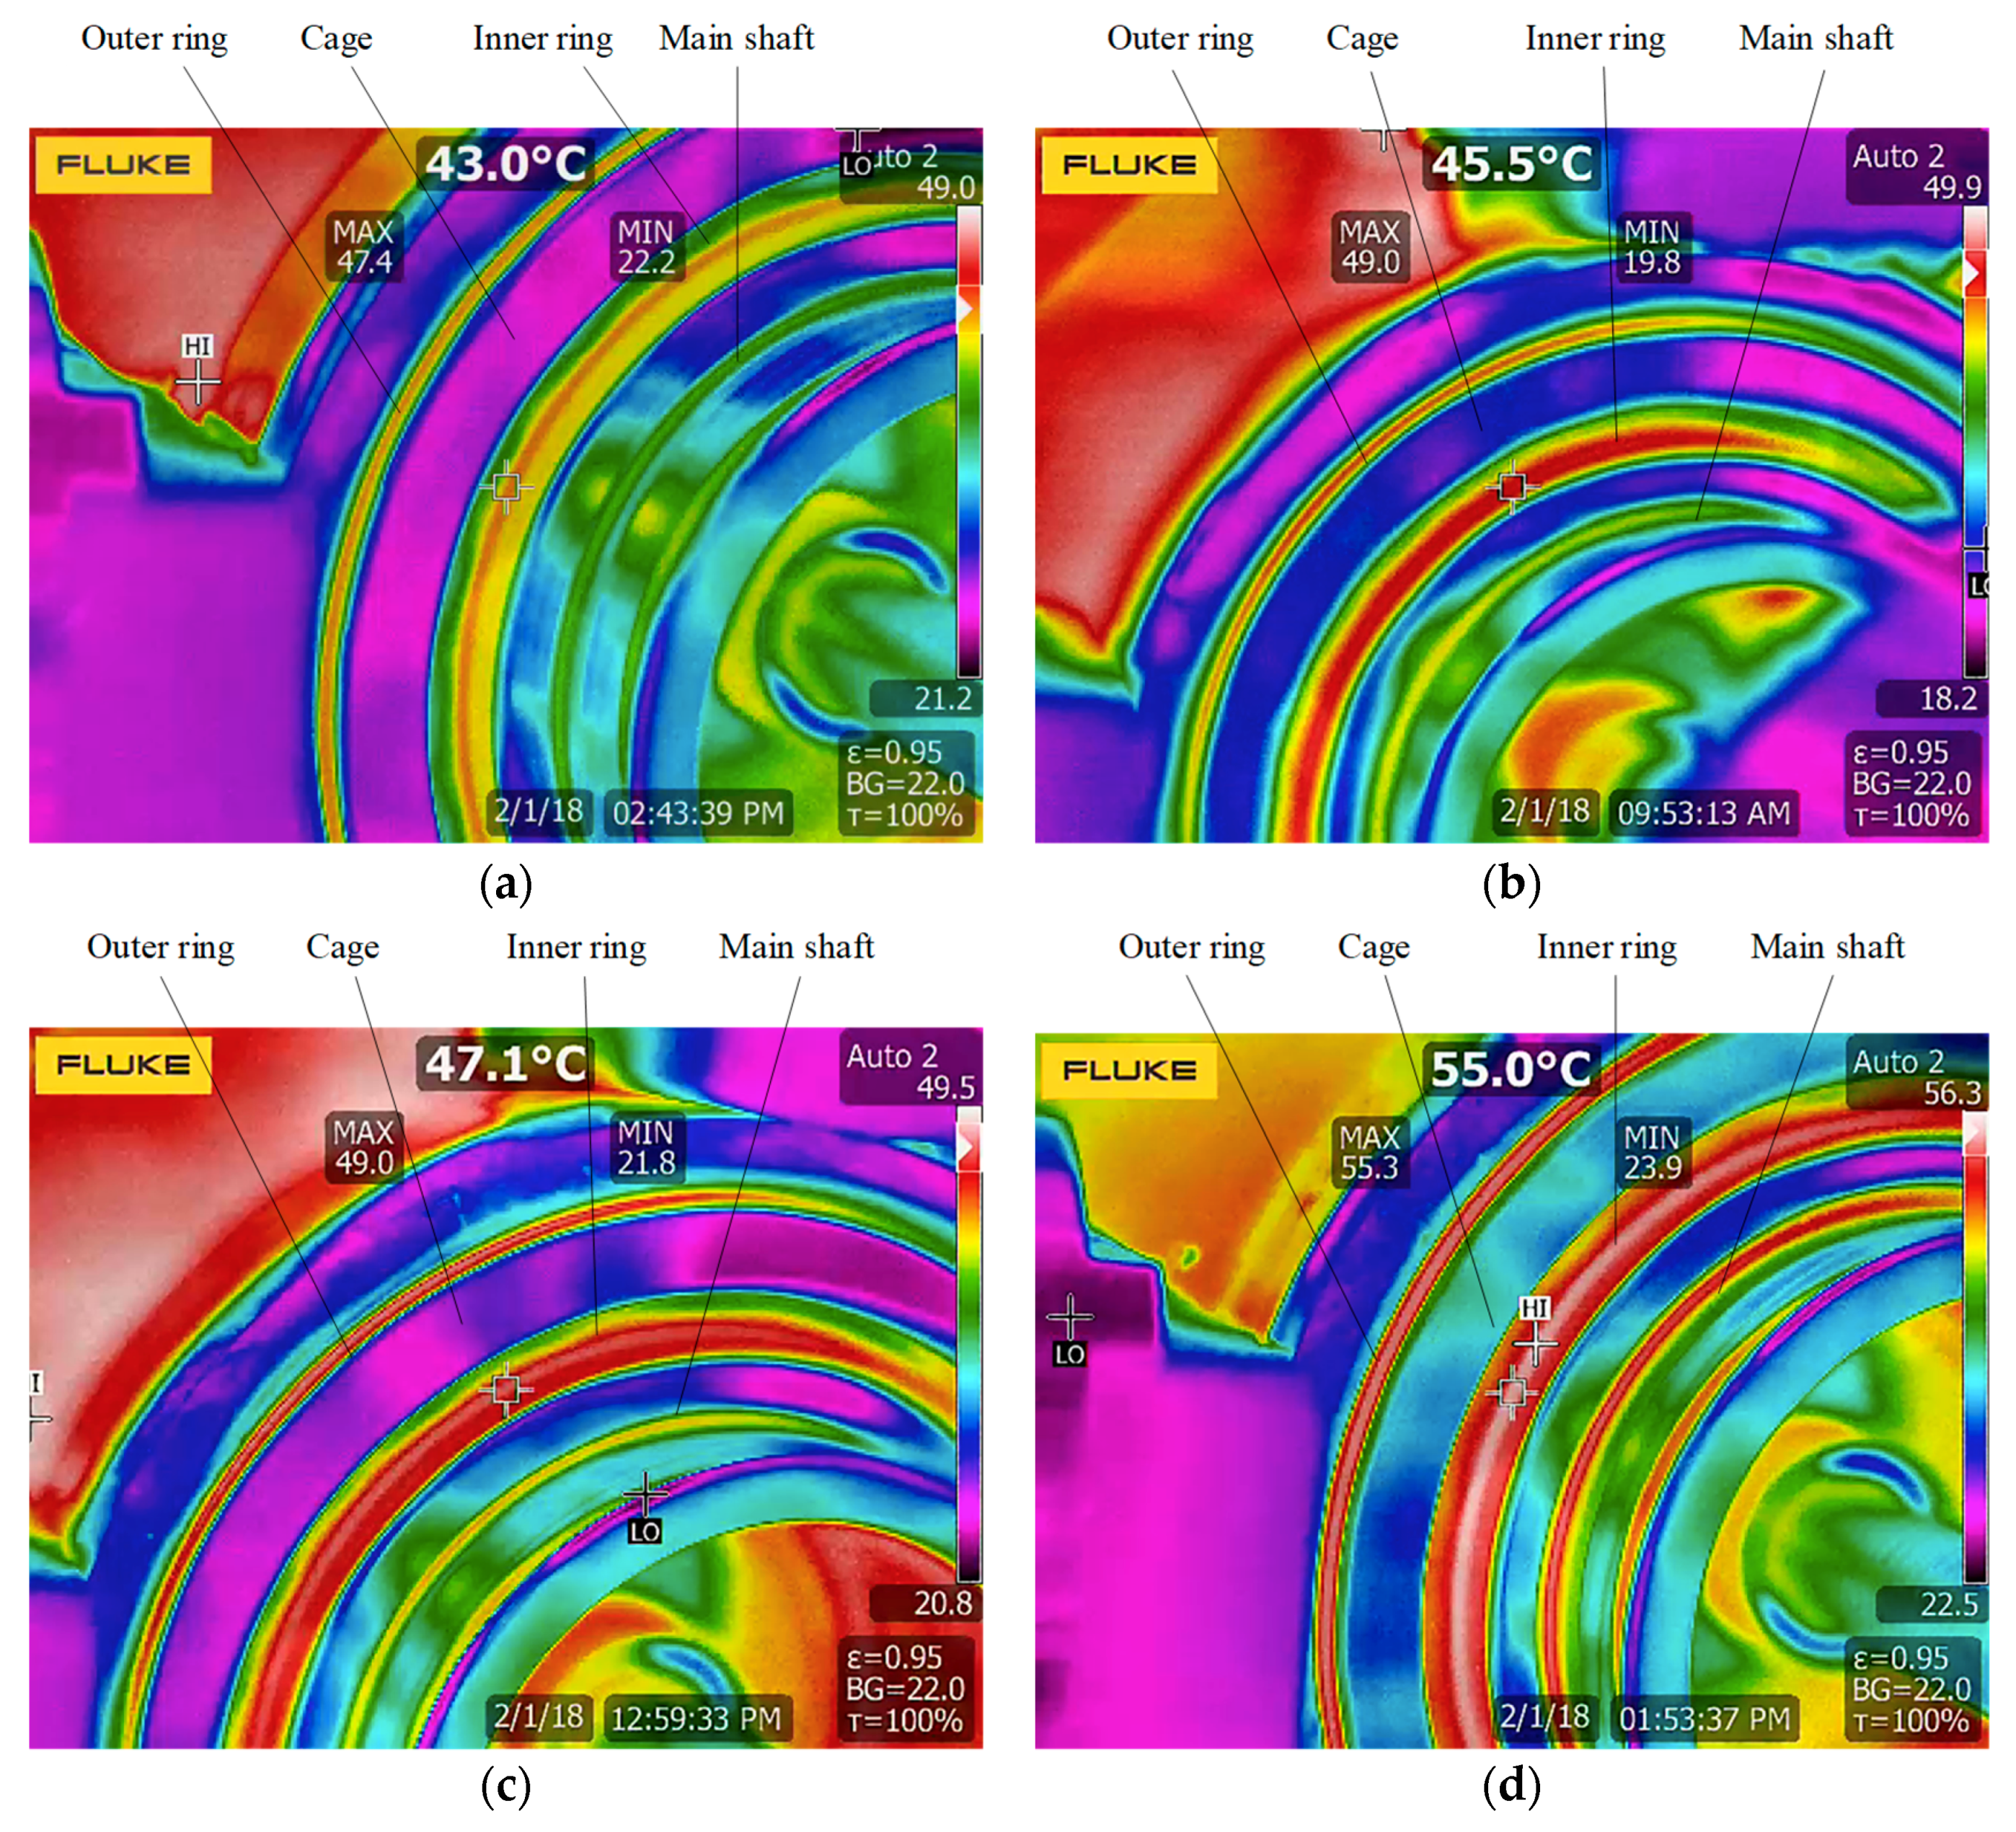
5.1. Test Rig and Test Method

Figure 12 and Figure 13 show the structure and constitution of the test rig. The test rig is composed of the power equipment, loading equipment, lubricating equipment, and measuring equipment. The test rig works as follows. The inner ring speed is controlled by a motorized spindle. The radial load is adjusted by a radial loading cylinder. The lubrication condition is changed by adjusting the type and amount of lubricating oil. In this study, the bearing temperature is measured using a Fluke TI450 infrared thermal imager(Fluke inc., Everett, WA, USA), which can capture the real-time temperature distribution in certain operating conditions with videos and photos. The slip ratio can be obtained by speed measurement of the cage, which is carried out using a laser tachometer(Double King inc., Shenzhen, China). The test bearing is the cylindrical roller bearing. Then, with the data acquisition and processing system, the thermal distribution characteristics of the roller bearing can be obtained.

5.2. Results and Analysis

Figure 14 is the temperature distribution diagram of the bearing obtained with a FLUKE TI450 under various working conditions. The results show that the temperature at the inner ring raceway is the highest, and that the lowest temperature appears in the cage. The experimental results and the theoretical simulation diagram yield the same temperature distribution characteristic. Therefore, the next research will focus on the temperature distribution in the inner ring raceway.
Figure 15 shows three-dimensional (3D) surface images of the bearing ring, which were obtained with a NewView™ 8000 3D optical surface profiler (Zygo inc., Middlefield, CT, USA). Figure 14 shows that the temperature at the inner ring increased from 43.0 °C to 55.0 °C in the situations (a) to (c). Figure 15 shows that the surface roughness (Ra) of the bearing inner ring increased from 0.160 μm to 0.285 μm and the irregular distribution of the inner ring surface profile was also exacerbated from situations (a) to (c). A more detailed analysis is shown Figure 16 and Figure 17. The preliminary results show that there must be a direct relationship between the temperature distribution and surface topography in the rolling bearing.
Figure 16 shows the changing trend of the temperature of the inner ring with various radial loads. The results show that the temperature of the inner ring increases with the increase in the radial load. The max difference between the tested and FEM simulation values of temperature is 5 °C, which shows that they are relatively consistent with each other.
Figure 17 shows the changing trend of the temperature with various inner ring speeds. The difference between tested and FEM simulation values of temperature is approximately 5 °C. With the increase in the inner ring speed, the gap the tested and simulation values becomes narrower.
Figure 18 shows the tested and numerical values of the cage speed under different inner ring speeds. The results show that the actual speed of the cage increases with the increase in the inner ring speeds.

6. Conclusions

In this manuscript, firstly, a theoretical model of friction power loss distribution in a rolling bearing considering skidding was established. Then, the steady and transient temperature field distributions of the roller bearing were obtained by the finite element method. Finally, the experimental test was conducted to validate the finite element analysis results of the temperature distribution. The main conclusions can be drawn as follows:
(1) The thermal characteristics analysis model of HSLLRBs considering skidding was built, and then the effect of the slip ratio, inner ring speed, and kinematic viscosity on the friction power loss distribution of the bearing were studied. The results show that, as the slip ratio increases, the friction power loss of the inner and outer raceways as well as the total friction power loss of the bearing increase, whereas the friction power loss of the guide surface of the cage and the oil churning of the roller decrease. With the increase in the inner ring speed and the kinematic viscosity, the total friction power loss of the bearing increases.
(2) Based on the finite element method, the steady and transient temperature field distributions of HSLLRBs were obtained. The results show that, in the steady-state thermal analysis, the inner ring raceway of the bearing has the highest temperature, and the cage has the lowest temperature. With the increase in slip ratio, the temperatures of the inner and outer ring raceways increase, whereas the cage temperature exhibits a decreasing trend. The transient thermal analysis shows that the temperature of the rolling bearings increases rapidly at first, and thereafter the increase slows down. After a certain time, the bearing reaches the steady-state temperature distribution.
(3) The temperature distribution characteristics test rig of the full-size roller bearing was constructed, and the temperature distribution mechanism with a different inner ring speed, radial load, and lubricating oil viscosity was obtained. Moreover, the test results also show that the temperature at the inner ring raceway is the highest, and that the lowest temperature appears in the cage. The preliminary results showed that there must be a direct relationship between the temperature distribution and surface topography in the rolling bearing. The tested and FEM simulation values of temperature were relatively consistent with each other, which validates the theoretical model well.

Author Contributions

Conceptualization, J.L.; Data curation, J.X.; Formal analysis, J.L.; Funding acquisition, J.L.; Investigation, J.X.; Methodology, Z.M.; Software, Z.M.; Writing – original draft, J.L.; Writing-Review & Editing, J.L.

Funding

This work was supported by the National Natural Science Foundation of China (No. 51505361), Innovative Talents Promotion Plan in Shaanxi Province (No. 2017KJXX-58).

Acknowledgments

The authors would like to thank Wei Chen for valuable discussions on this article. The authors are sincerely grateful to the reviewers for their valuable review comments, which substantially improved the paper.

Conflicts of Interest

The authors declare no conflict of interest.

Nomenclature

Parameters and Variables

Asurface area, m2
Cclearance between the cage and the inner ring, m
DCLcage land diameter, m
DCRcage rail diameter, m
Dhdiameter of the bearing seat surface,
Dibore diameter, m
Dmbearing pitch diameter, m
Drroller diameter, m
Fcroller centrifugal force, N
FcLfriction force in the guide edge of the cage, N
Frradial load, N
Fvviscous friction force, N
ffriction coefficient
fvviscous friction coefficient
HcLfriction power loss between the cage and the guide edge of the rings, W
Hdoil stirring friction power loss, W
Hifriction power loss between the roller and inner ring raceway, W
Hidragfriction power loss of oil stirring for the inner ring Hidrag, W
Hofriction power loss between the roller and outer ring raceway, W
Hrdragfriction power loss of oil stirring for the roller, W
Koil heat conductivity coefficient
kair heat conductivity coefficient
lCLcage land width, m
leroller length, m
liinner ring width, m
ninner ring speed, r/min
nccage speed, r/min
Qcontact force of each roller, N
Rbearing pitch radius, m
ReReynolds number
Riinner ring radius, m
rreference radius, m
Sfcage slip ratio
Tfriction force, N
TaTaylor number
Uentrainment velocity, m/s
Vsliding velocity, m/s
vabsolute viscosity, pa·s
wwidth of a lamina, m
Znumber of rollers per row
γDr /Dm
Ɛload distribution coefficient
ηkinematic viscosity, cSt
ξdensity of the air oil mixture, kg/m3
ωccage angular velocity, rad/s
ωcmcage theoretical angular velocity, rad/s
ωishaft angular velocity, rad/s
ωrjroller angular velocity about its own axis, rad/s
[C]specific heat matrix
[T]temperature vector
[K]heat conduction matrix
[Q]heat flux matrix
Subscripts:
ccage
iinner raceway
jroller located at φj
oouter raceway
rroller
uunloaded roller
0the most heavily loaded roller

References

  1. Cao, H.; Niu, L.; Xi, S.; Chen, X. Mechanical model development of rolling bearing-rotor systems: A review. Mech. Syst. Signal Process. 2018, 102, 37–58. [Google Scholar] [CrossRef]
  2. Bercea, I.; Cretu, S.; Nélias, D. Analysis of double-row tapered roller bearings, Part I-Model. Tribol. Trans. 2003, 46, 228–239. [Google Scholar] [CrossRef]
  3. Takabi, J.; Khonsari, M.M. On the influence of traction coefficient on the cage angular velocity in roller bearings. Tribol. Trans. 2014, 57, 793–805. [Google Scholar] [CrossRef]
  4. Palmgren, A. Ball and Roller Bearing Engineering, 3rd ed.; SKF industries: Philadelphia, PA, USA, 1959. [Google Scholar]
  5. Astridge, D.G.; Smith, C.F. Heat Generation in High-speed Cylindrical Roller Bearings, In Proceedings of the Inst. Mech. Eng. Elasto-hydrodynamic Lubrication Symposium, Leeds, UK, 11–13 April 1972. [Google Scholar]
  6. Aramaki, H.; Shoda, Y.; Morishita, Y.; Sawamoto, T. The performance of ball bearings with silicon nitride ceramic balls in high speed spindles for machine tools. J. Tribol. 1988, 110, 693–698. [Google Scholar] [CrossRef]
  7. Rumbarger, J.H.; Filetti, E.G.; Gubemick, D. Gas turbine engine mainshaft roller bearing-system analysis. J. Lubr. Technol. 1973, 95, 401–416. [Google Scholar] [CrossRef]
  8. Harris, T.A.; Kotzalas, M.N. Advanced Concepts of Bearing Technology: Rolling Bearing Analysis, 5th ed.; CRC Press: Boca Raton, FL., USA, 2006. [Google Scholar]
  9. Cousseau, T.; Graça, B.; Campos, A.; Seabra, J. Friction torque in grease lubricated thrust ball bearings. Tribol. Int. 2011, 44, 523–531. [Google Scholar] [CrossRef] [Green Version]
  10. Doki-Thonon, T.; Fillot, N.; Vergne, P.; Espejel, G.E.M. Numerical insight into heat transfer and power losses in spinning EHD non-Newtonian point contacts. Proc. Inst. Mech. Eng. Part J J. Eng. Tribol. 2011, 226, 23–25. [Google Scholar] [CrossRef]
  11. Doki-Thonon, T.; Fillot, N.; Espejel, G.E.M.; Querry, M.; philippon, D.; Devaux, N.; Vergne, P. A Dual Experimental/Numerical Approach for Film Thickness Analysis in TEHL Spinning Skewing Circular Contacts. Tribol. Lett. 2015, 50, 115–126. [Google Scholar] [CrossRef]
  12. Mizuta, K.; Inoue, T.; Takahashi, Y.; Huangm, S.; Ueda, K.; Omokawa, H. Heat transfer characteristics between inner and outer rings of an angular ball bearing. Heat Trans. Asian Res. 2003, 32, 42–57. [Google Scholar] [CrossRef]
  13. Ai, S.; Wang, W.; Wang, Y.; Zhao, Z. Temperature rise of double-row tapered roller bearings analyzed with the thermal network method. Tribol. Int. 2015, 87, 11–22. [Google Scholar] [CrossRef]
  14. Wu, W.; Li, X.; Xu, F. Investigating effects of non-uniform preload on the thermal characteristics of angular contact ball bearings through simulations. Proc. IMechE Part J J. Eng. Tribol. 2014, 228, 667–681. [Google Scholar] [CrossRef]
  15. Yan, K.; Wang, N.; Zhai, Q.; Zhu, Y.; Zhang, J.; Niu, Q. Theoretical and experimental investigation on the thermal characteristics of double-row tapered roller bearings of high speed locomotive. Int. J. Heat Mass Transfer 2015, 84, 1119–1130. [Google Scholar] [CrossRef]
  16. Takabi, J.; Khonsari, M.M. Experimental testing and thermal analysis of ball bearings. Tribol. Int. 2013, 60, 93–103. [Google Scholar] [CrossRef]
  17. Wang, L.; Chen, G.; Gu, L. Study on heat generation of high-speed cylindrical roller bearings. Lubr. Eng. 2007, 32, 8–11. [Google Scholar]
  18. Wang, L.; Chen, G.; Gu, L.; Zheng, D. Study on operating temperature of high-speed cylindrical roller bearings. J. Aerosp. Power 2008, 23, 179–183. [Google Scholar]
  19. Tarawneh, C.M.; Cole, K.D.; Wilson, B.M.; Fadi, A. Experiments and models for the thermal response of railroad tapered-roller bearings. Int. J. Heat Mass Transfer 2008, 51, 5794–5803. [Google Scholar] [CrossRef] [Green Version]
  20. Than, V.; Huang, J. Nonlinear thermal effects on high-speed spindle bearings subjected to preload. Tribol. Int. 2016, 96, 361–372. [Google Scholar] [CrossRef]
  21. Harris, T.A. An Analytical Method to Predict Skidding in High Speed Roller Bearings. ASLE Trans. 1966, 9, 229–241. [Google Scholar] [CrossRef]
  22. Laniado-Jacome, E.; Meneses-Alonso, J.; Diaz-Lopez, V. A study of sliding between rollers and races in a roller bearing with a numerical model for mechanical event simulations. Tribol. Int. 2010, 43, 2175–2182. [Google Scholar] [CrossRef]
  23. Tu, W.; Shao, Y.; Mechefske, C.K. An analytical model to investigate skidding in rolling element bearings during acceleration. J. Mech. Sci. Technol. 2012, 26, 2451–2458. [Google Scholar] [CrossRef]
  24. Han, Q.; Chu, F. Nonlinear dynamic model for skidding behavior of angular contact ball bearings. J. Sound. Vib. 2015, 354, 219–235. [Google Scholar] [CrossRef]
  25. Han, Q.; Li, X.; Chu, F. Skidding behavior of cylindrical roller bearings under time-variable load conditions. Int. J. Mech. Sci. 2018, 135, 203–214. [Google Scholar] [CrossRef]
  26. Li, J.; Chen, W.; Xie, Y. Experimental study on skid damage of cylindrical roller bearing considering thermal effect. Proc. IMechE Part J J. Eng. Tribol. 2014, 228, 1036–1046. [Google Scholar] [CrossRef]
  27. Liu, Z.; Zhang, P.; Shen, Y. Thermal analysis models of high speed cylindrical roller bearing. J. Mech. Sci. Technol. 1997, 16, 607–611. [Google Scholar]
  28. Parker, R.J. Comparison of Predicted and Experimental Thermal Performance of Angular-Contact Ball Bearings; National Aeronautics and Space Administration, Scientific and Technical Information Branch: Washington, DC, USA, 1984.
  29. Stribeck, R. Ball bearing for various loads. Trans. ASME 1907, 29, 420–463. [Google Scholar]
  30. Kannel, J.W.; Barber, S.A. Estimate of surface temperature during rolling contact. Tribol. Trans. 1989, 32, 305–310. [Google Scholar] [CrossRef]
  31. Burton, R.A.; Staph, H.E. Thermally Activated Seizure of Angular Contact Bearings. Tribol. Trans. 1967, 10, 408–417. [Google Scholar] [CrossRef]
Figure 1. Kinematics model.
Applsci 08 01593 g001
Figure 2. Friction power loss analysis model.
Applsci 08 01593 g002
Figure 3. Flow chart of the bearing friction power loss analysis.
Applsci 08 01593 g003
Figure 4. Effect of the slip ratio on the friction power loss of the bearing.
Applsci 08 01593 g004
Figure 5. Effect of the inner ring speed on the total friction power loss of the bearing.
Applsci 08 01593 g005
Figure 6. Effect of the lubricant kinematic viscosity on the total friction power loss of the bearing.
Applsci 08 01593 g006
Figure 7. The heat flux and action time of contact surface between the roller and ring raceway.
Applsci 08 01593 g007
Figure 8. Temperature distribution analysis model. (a) Solid model; (b) boundary condition model.
Applsci 08 01593 g008
Figure 9. Steady-state temperature distribution of the bearing. (a) Front view; (b) section view.
Applsci 08 01593 g009
Figure 10. Effect of the slip ratio on the bearing temperature distribution.
Applsci 08 01593 g010
Figure 11. Transient temperature of the bearing.
Applsci 08 01593 g011
Figure 12. Overview of the test rig.
Applsci 08 01593 g012
Figure 13. Structure of the testing system.
Applsci 08 01593 g013
Figure 14. Temperature distribution diagram of the bearing: (a) radial load: 400 N; inner ring speed: 1200 r/min; kinematic viscosity: 15 cSt; (b) radial load: 400 N; inner ring speed: 1800 r/min; kinematic viscosity: 15 cSt; (c) radial load: 600 N; inner ring speed: 1800 r/min; kinematic viscosity: 32 cSt; and (d) radial load: 600 N; inner ring speed: 1200 r/min; kinematic viscosity: 46 cSt.
Applsci 08 01593 g014
Figure 15. Three-dimensional (3D) surface images of the bearing inner ring: (a) radial load: 400 N; inner ring speed: 1200 r/min; kinematic viscosity: 15 cSt; (b) radial load: 400 N; inner ring speed: 1800 r/min; kinematic viscosity: 15 cSt; (c) radial load: 600 N; inner ring speed: 1800 r/min; kinematic viscosity: 32 cSt; and (d) radial load: 600 N; inner ring speed: 1200 r/min; kinematic viscosity: 46 cSt.
Applsci 08 01593 g015
Figure 16. Comparison between the tested and FEM simulation values of temperature under different radial loads (inner ring speed: 1800 r/min, kinematic viscosity: 15 cSt).
Applsci 08 01593 g016
Figure 17. Comparison between the tested and FEM simulation values of temperature under different inner ring speeds (radial load: 400 N, kinematic viscosity: 15 cSt).
Applsci 08 01593 g017
Figure 18. Comparison between the tested and numerical values of cage speed under different inner ring speeds (radial load: 400 N, kinematic viscosity: 15 cSt).
Applsci 08 01593 g018
Table 1. Geometry parameters of the roller bearing.
ParameterValueParameterValue
Inner ring (mm)50Roller length (mm)12
Outer ring (mm)90Roller number16
Pitch diameter (mm)70Inner ring speed (r/min)18,000
Roller diameter (mm)12Radial load (N)2000
Table 2. Material parameters of the roller bearing.
ParameterDensity (kg/m3)Elastic Modulus (GPa)Thermal Conductivity (W/(m·k))
Cage8430100108.9
Roller783020846
Rings783020846

