Evaluation of Energy Saving and Emission Reduction Effects for Electricity Retailers in China Based on Fuzzy Combination Weighting Method

Abstract
:Featured Application
Abstract
1. Introduction
1.1. Research Background and Significance
1.2. Research Status
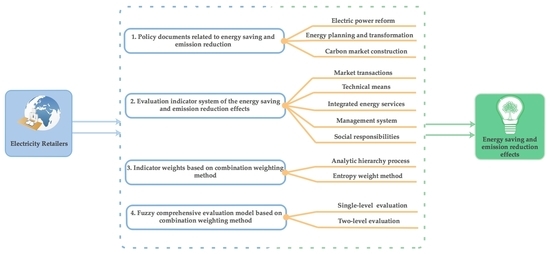
1.3. Main Research Contents
2. Present Situation and Development Prospect Analysis of Energy Saving and Emission Reduction in China’s Electric Power Industry
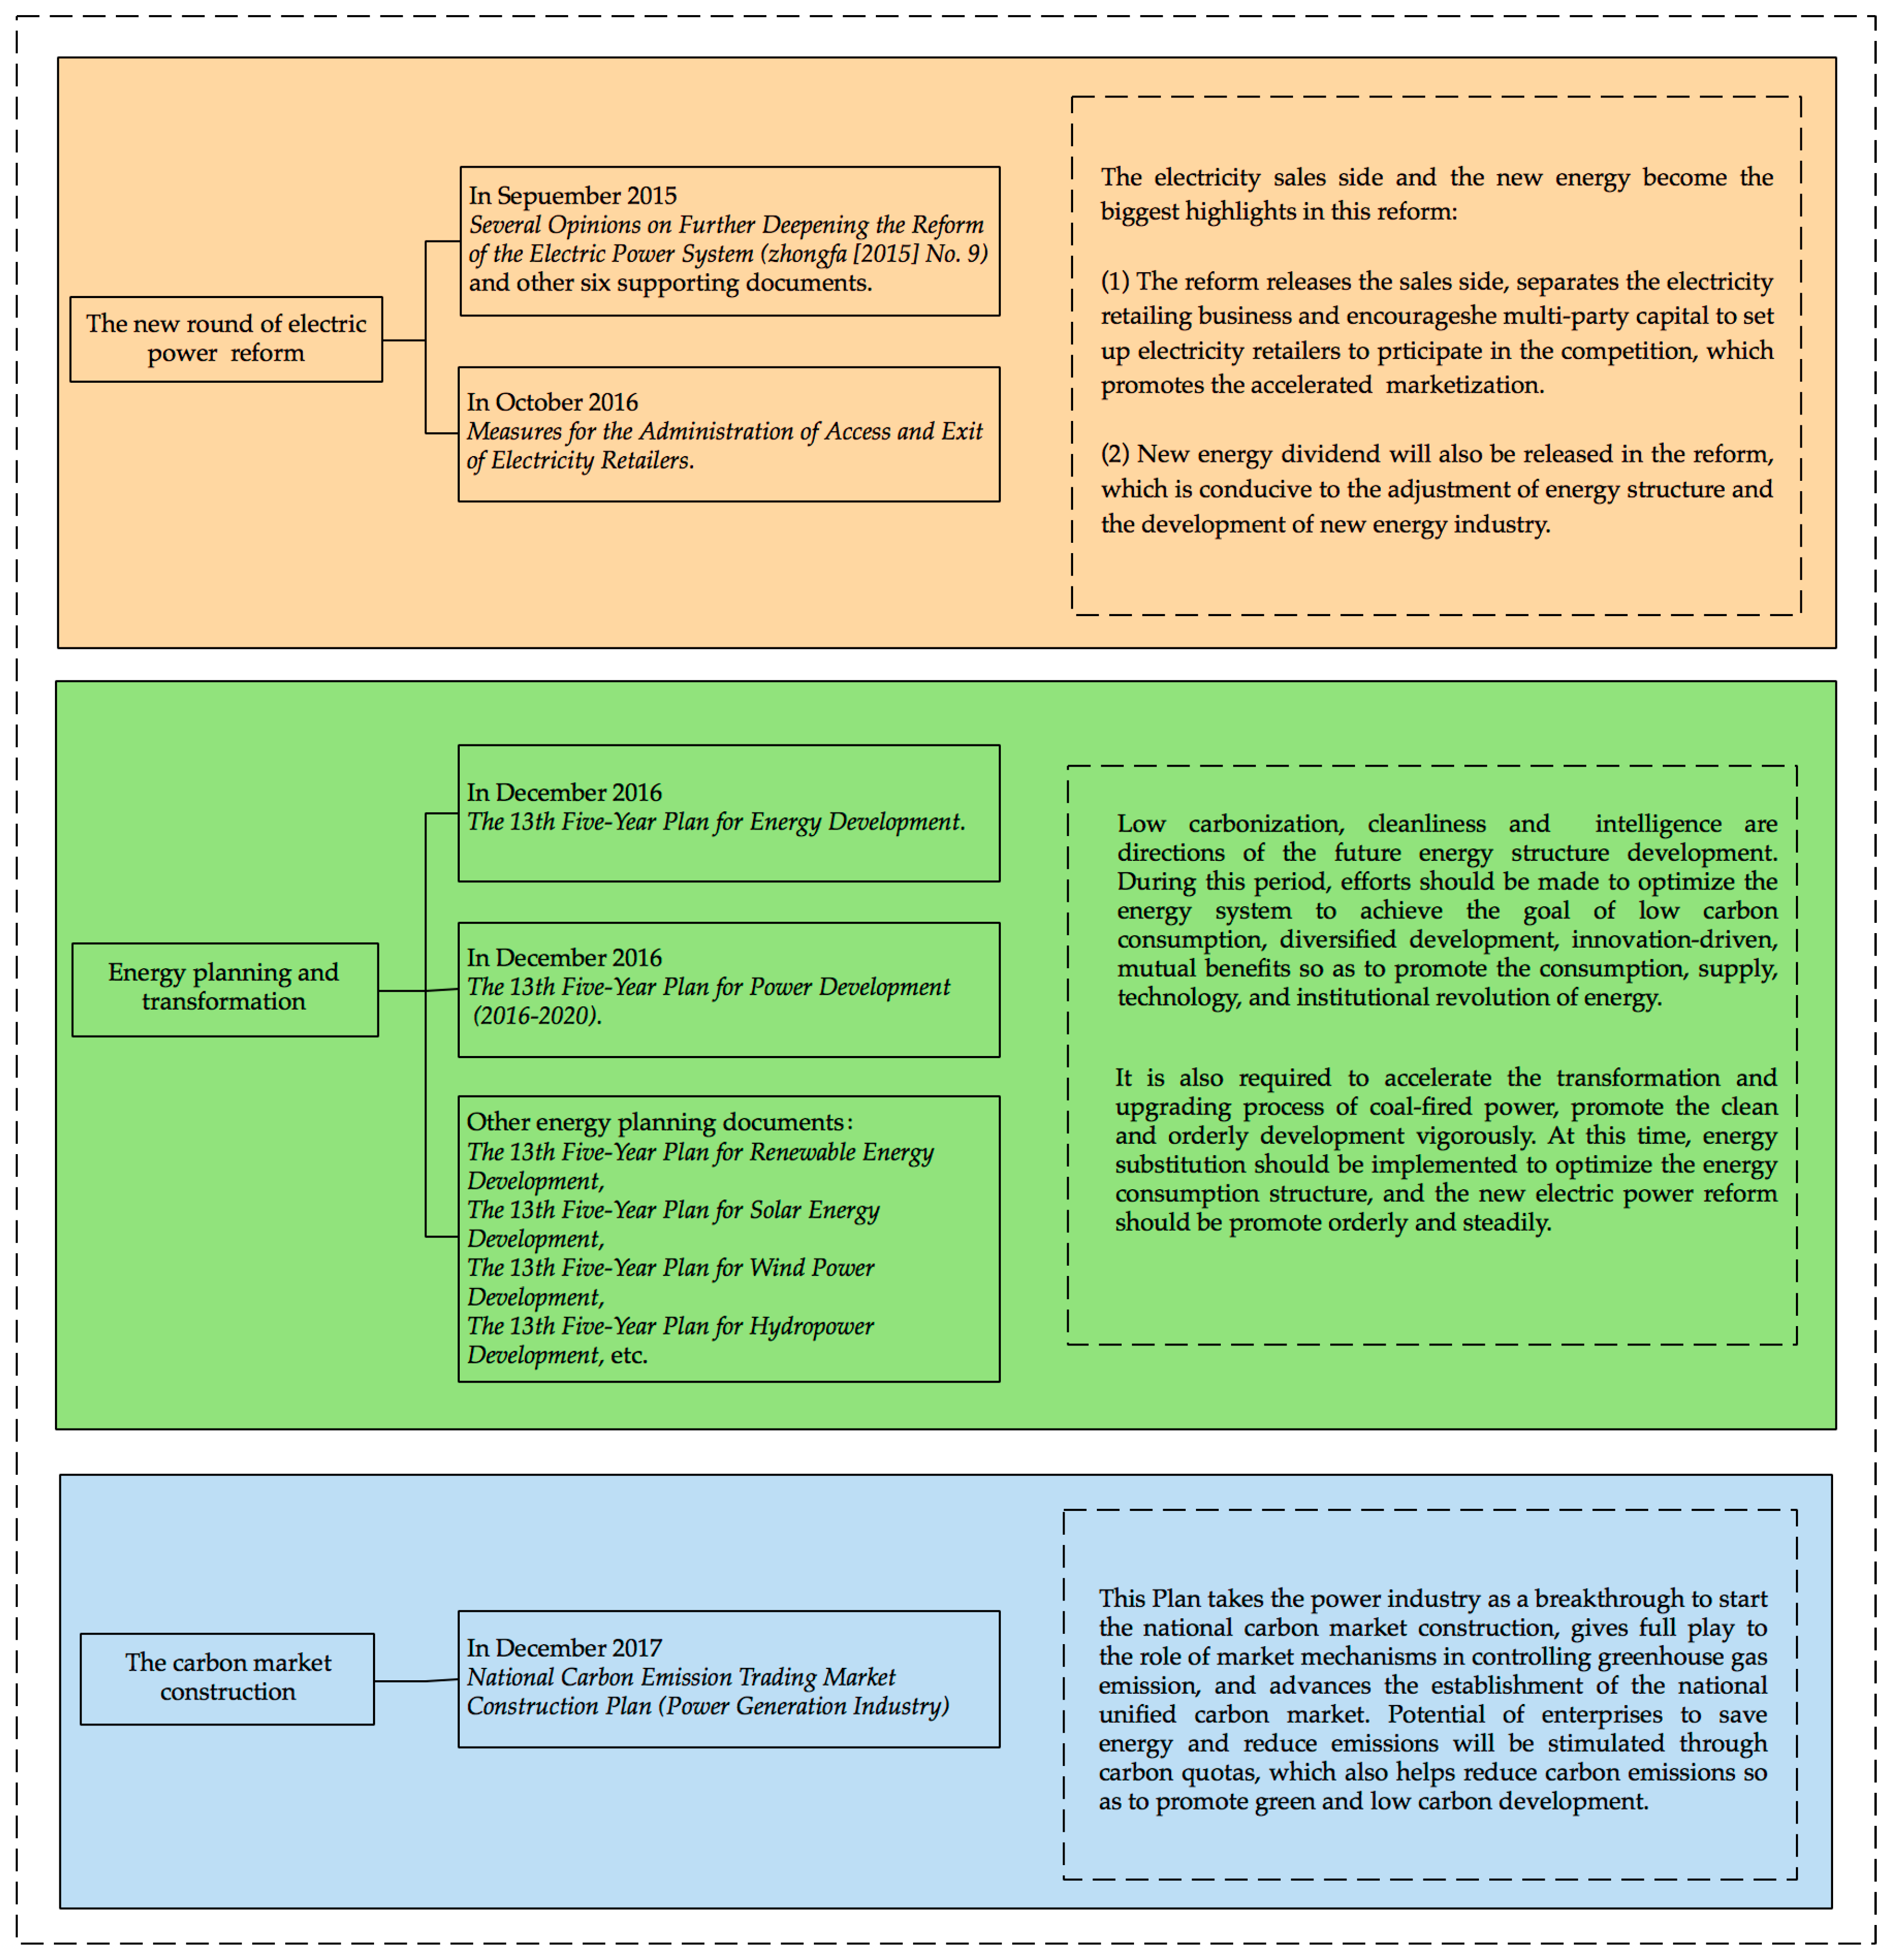
2.1. Overview of Relevant Policy Guidance in the Electric Power Industry
2.2. Analysis on the Development Direction of Energy Saving and Emission Reduction
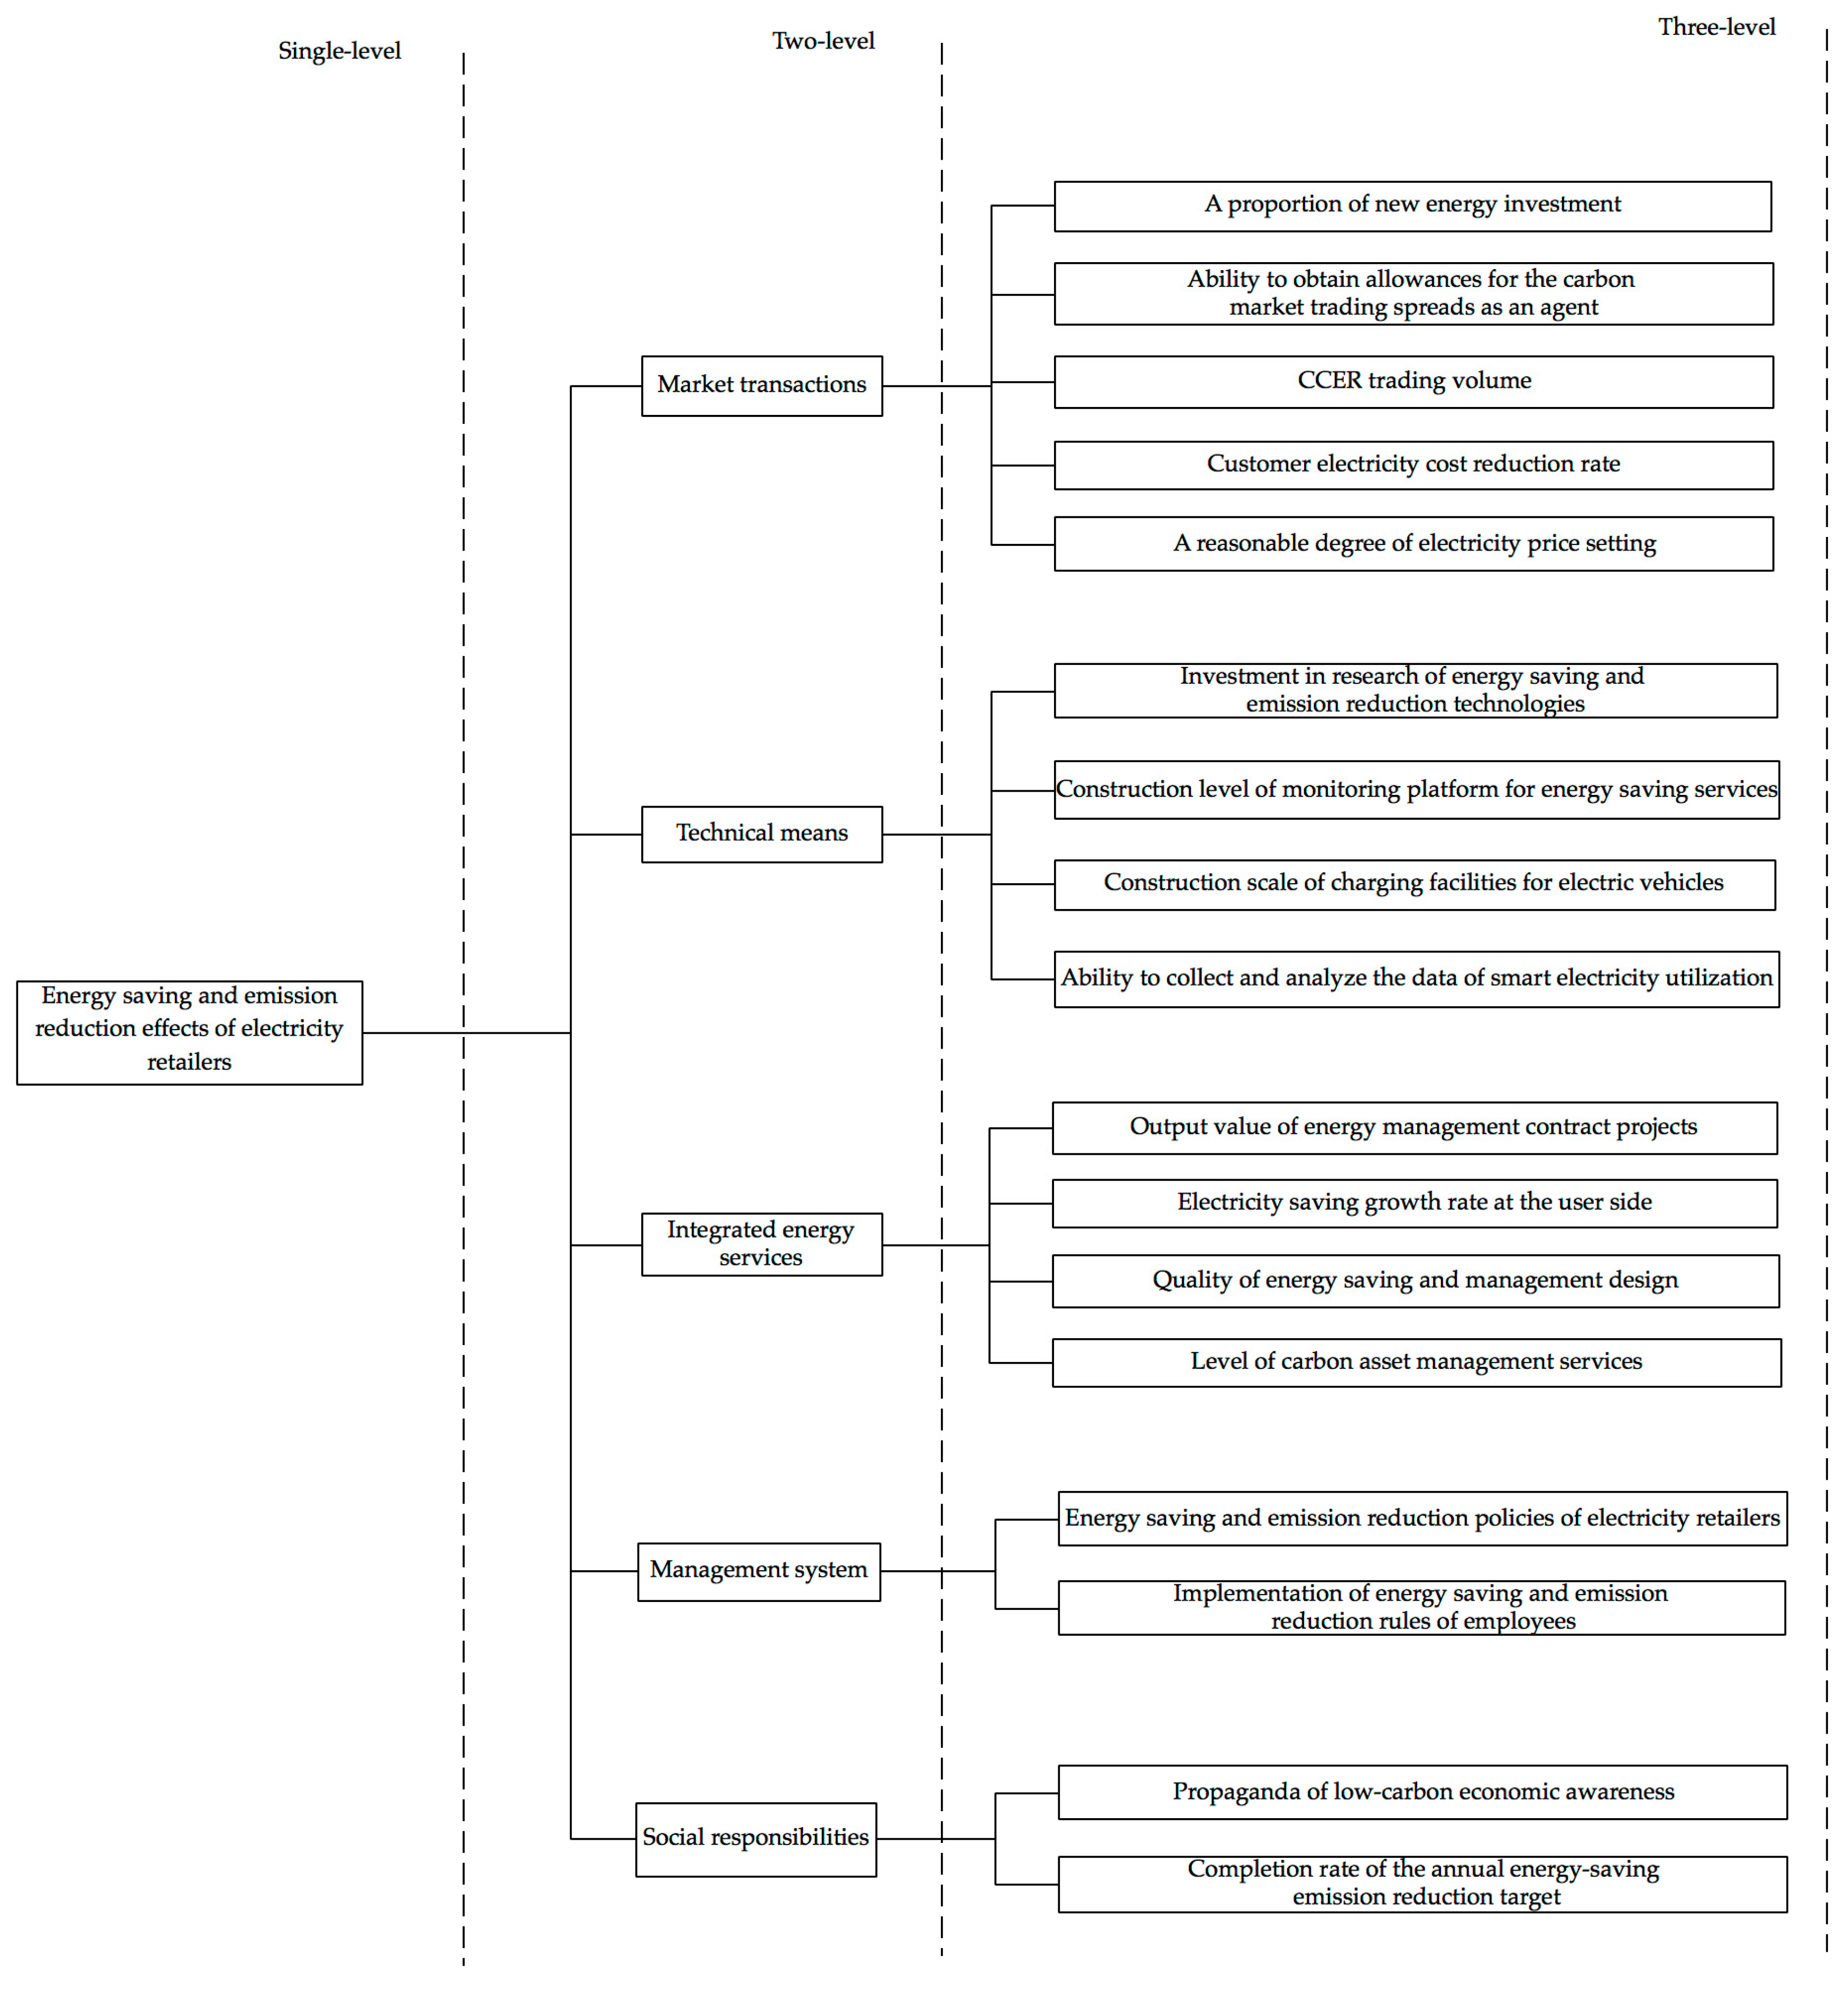
3. Selection of Evaluation Indicators of Energy Saving and Emission Reduction Effects for Electricity Retailers in China
4. Determination of Indicator Weights Based on Combination Weighting Method
4.1. Preprocessing of the Evaluation Indicators
4.2. Analytic Hierarchy Process
- (1)
- Calculate the consistency indicatorswhere is the order of the judgment matrix.
- (2)
- Determine the average random consistency indicator
- (3)
- Calculate the consistency ratio
4.3. Entropy Weight Method
- Construct the standardized judgment matrixThe standardized judgment matrix constituted by the pre-processed indicator data is .
- Measure the information entropy
4.4. Determination of the Combination Weight
5. Construction of Fuzzy Comprehensive Evaluation Model
5.1. Basic Theory of Fuzzy Comprehensive Evaluation
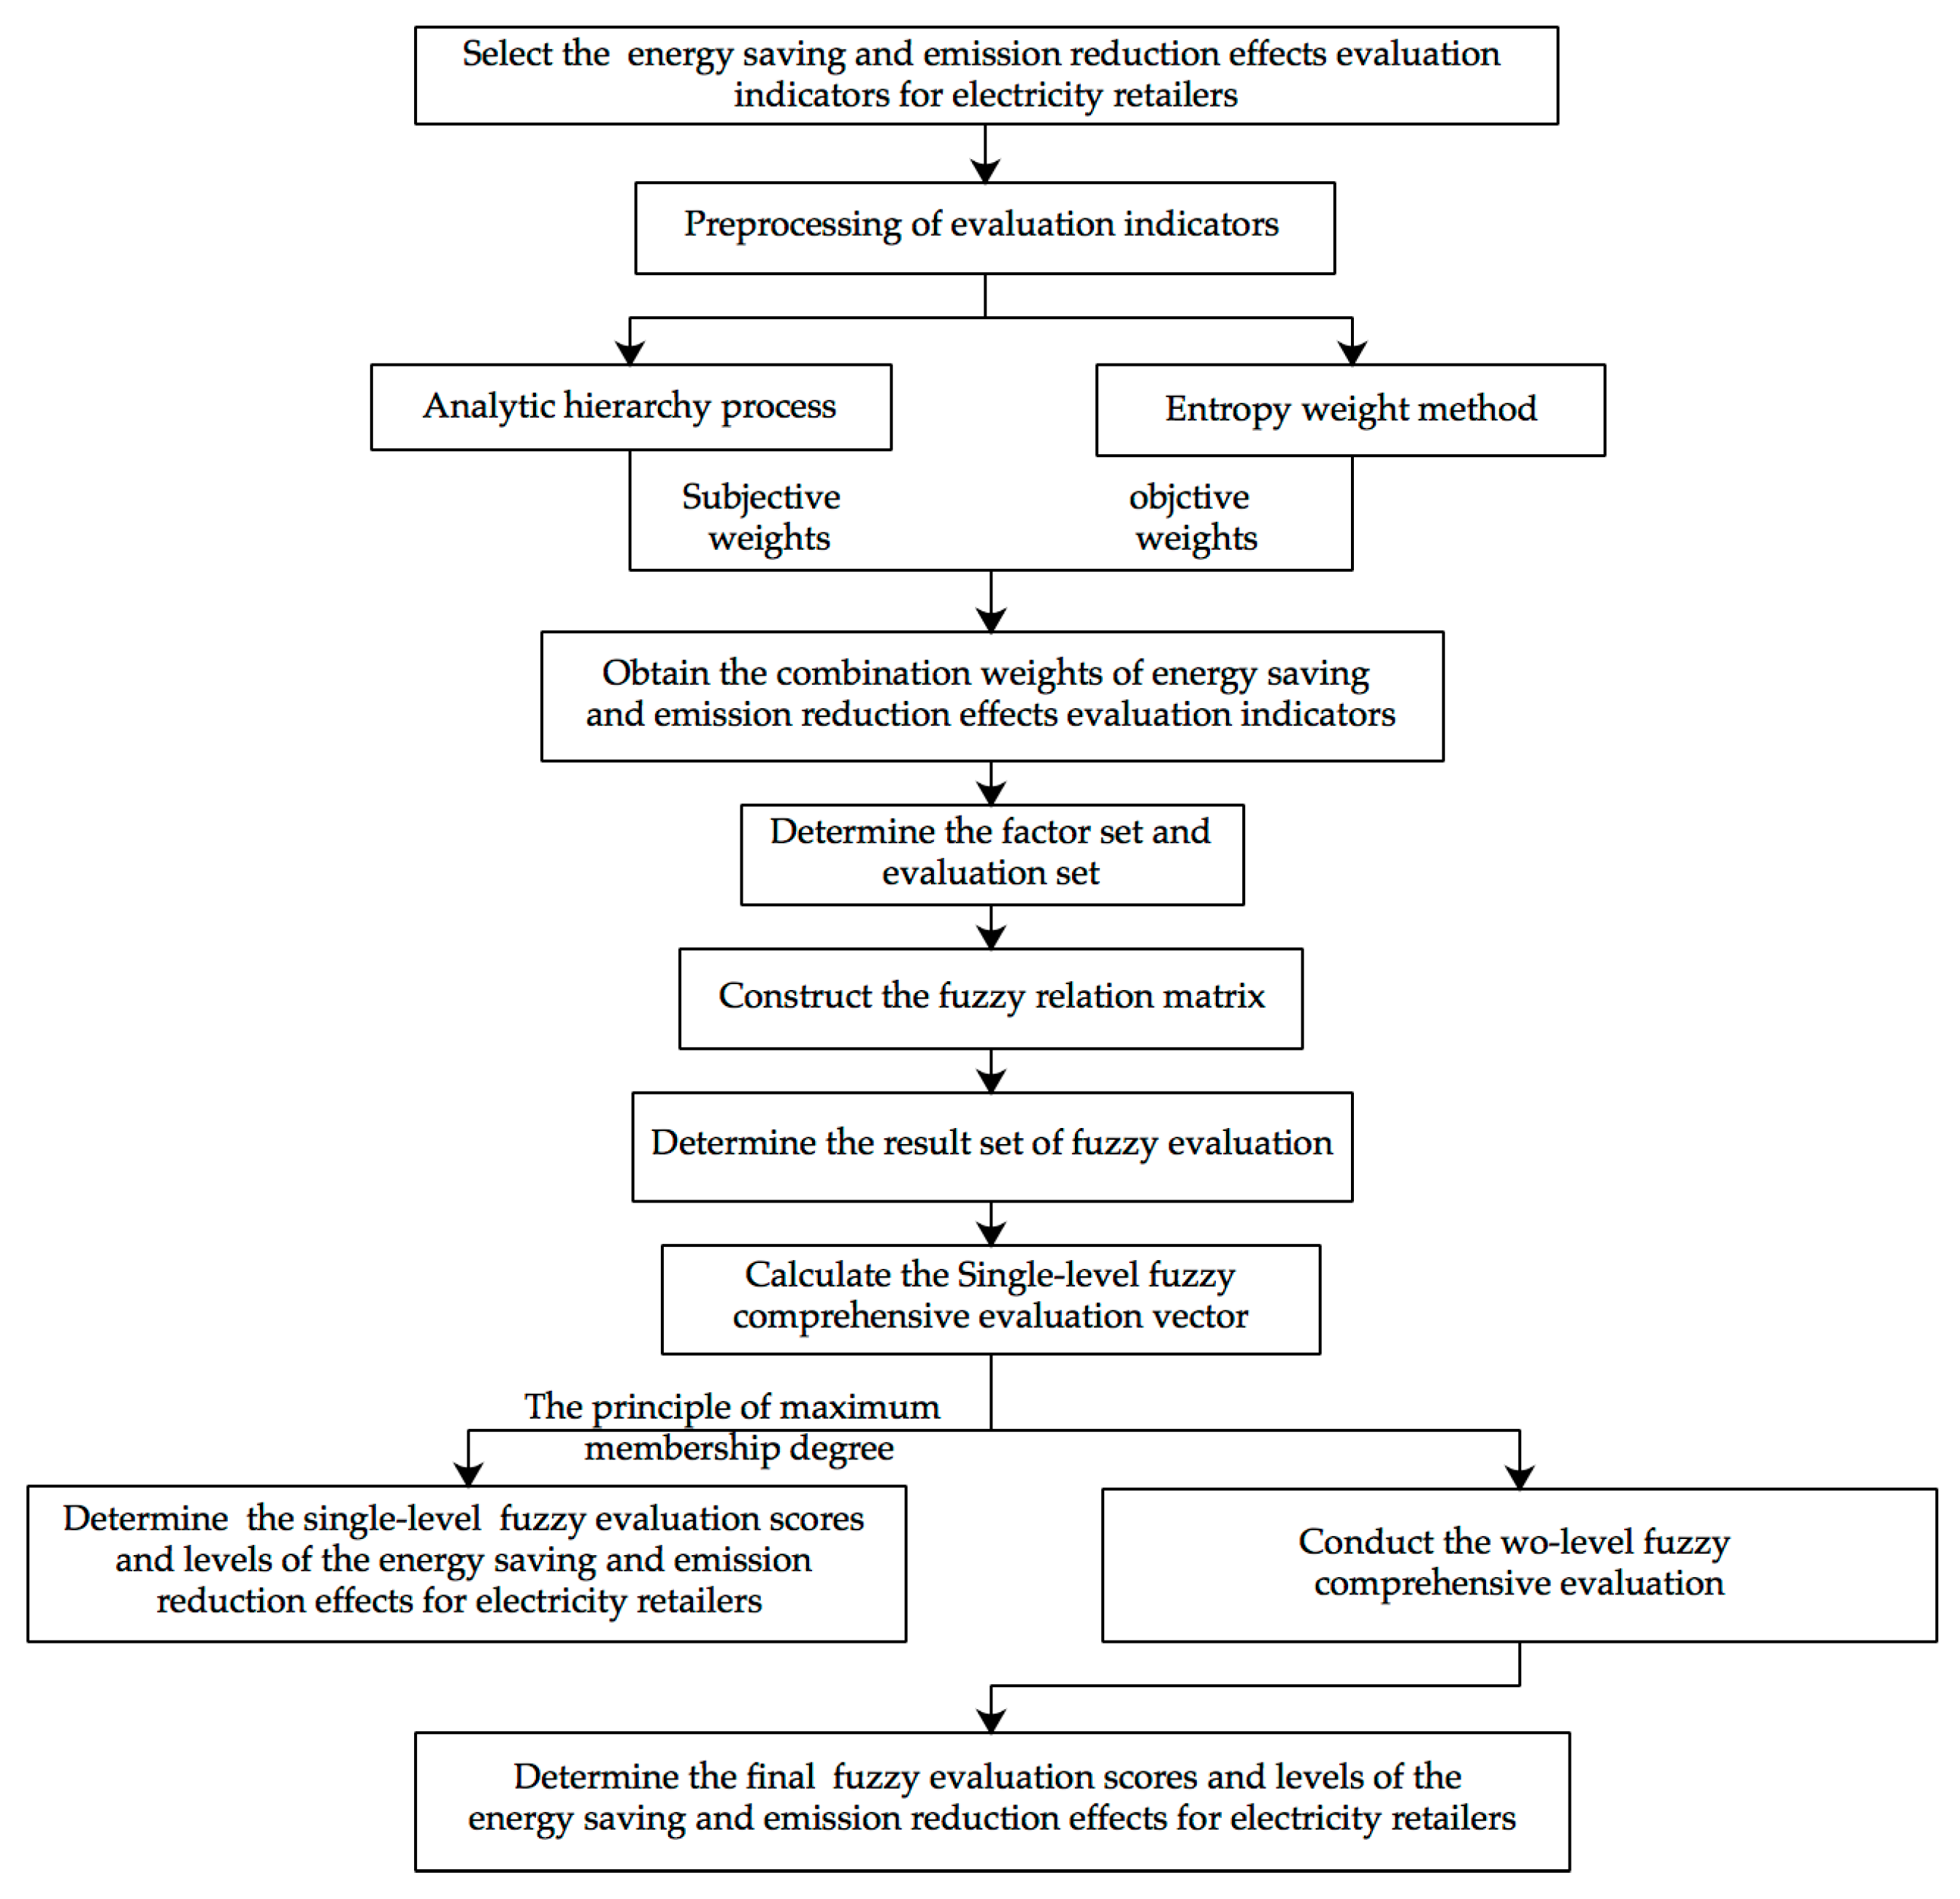
5.2. Construction of Fuzzy Comprehensive Evaluation Model Based on Combination Weighting Method
6. Example Analysis
6.1. Single-Level Fuzzy Comprehensive Evaluation
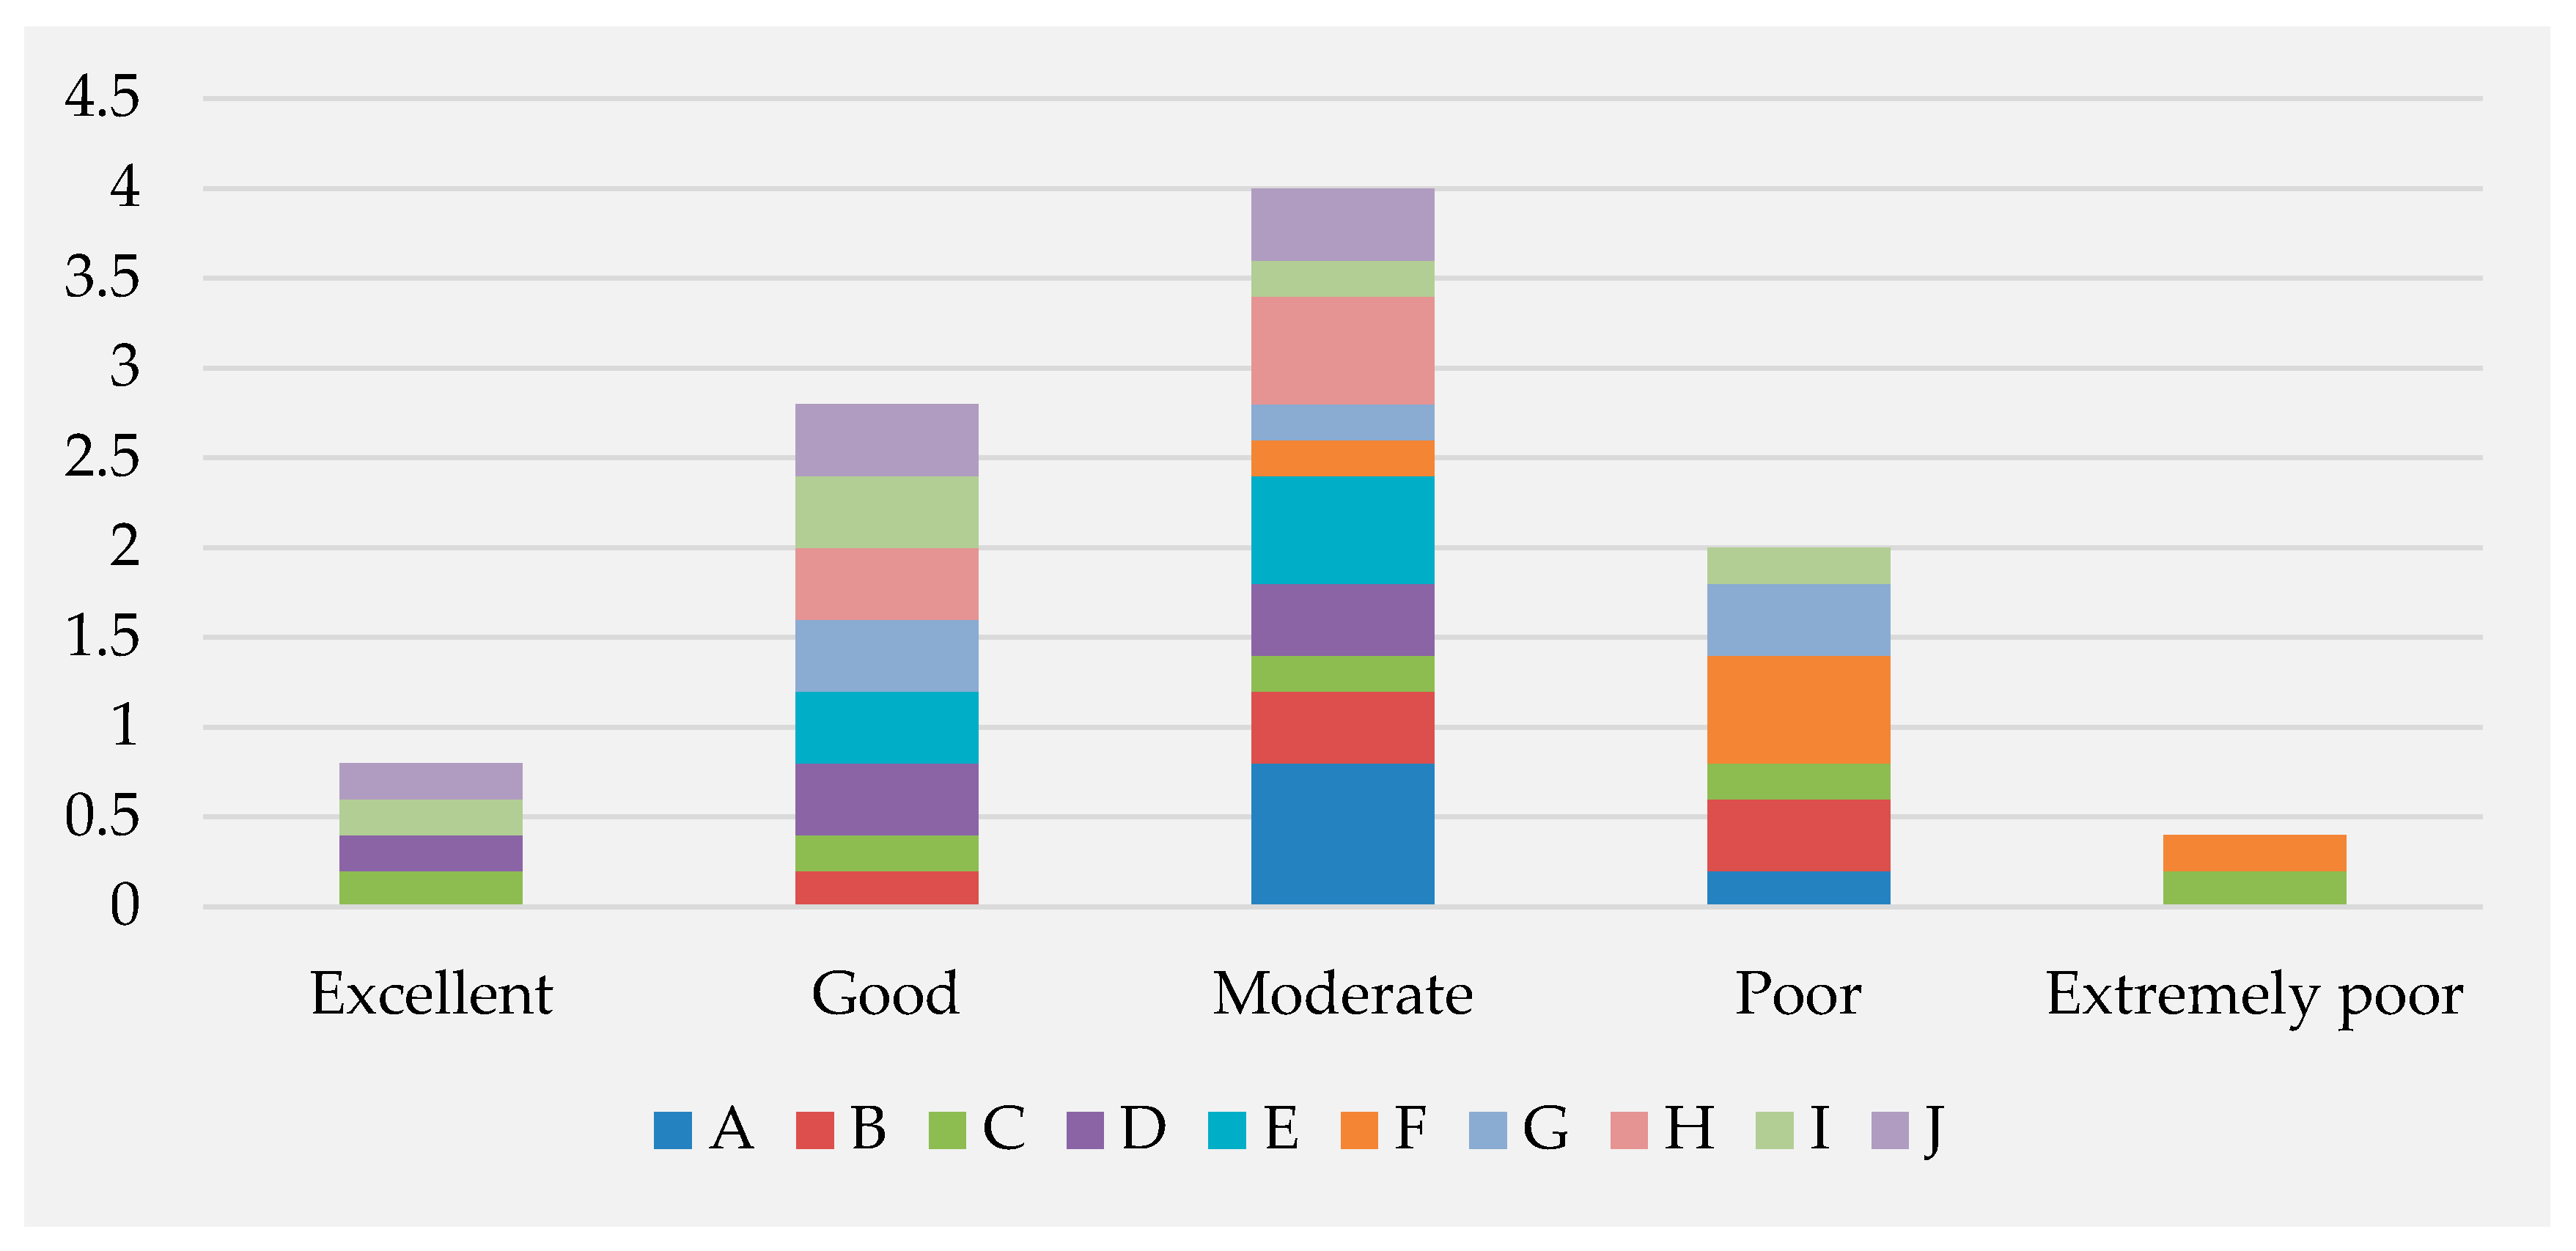
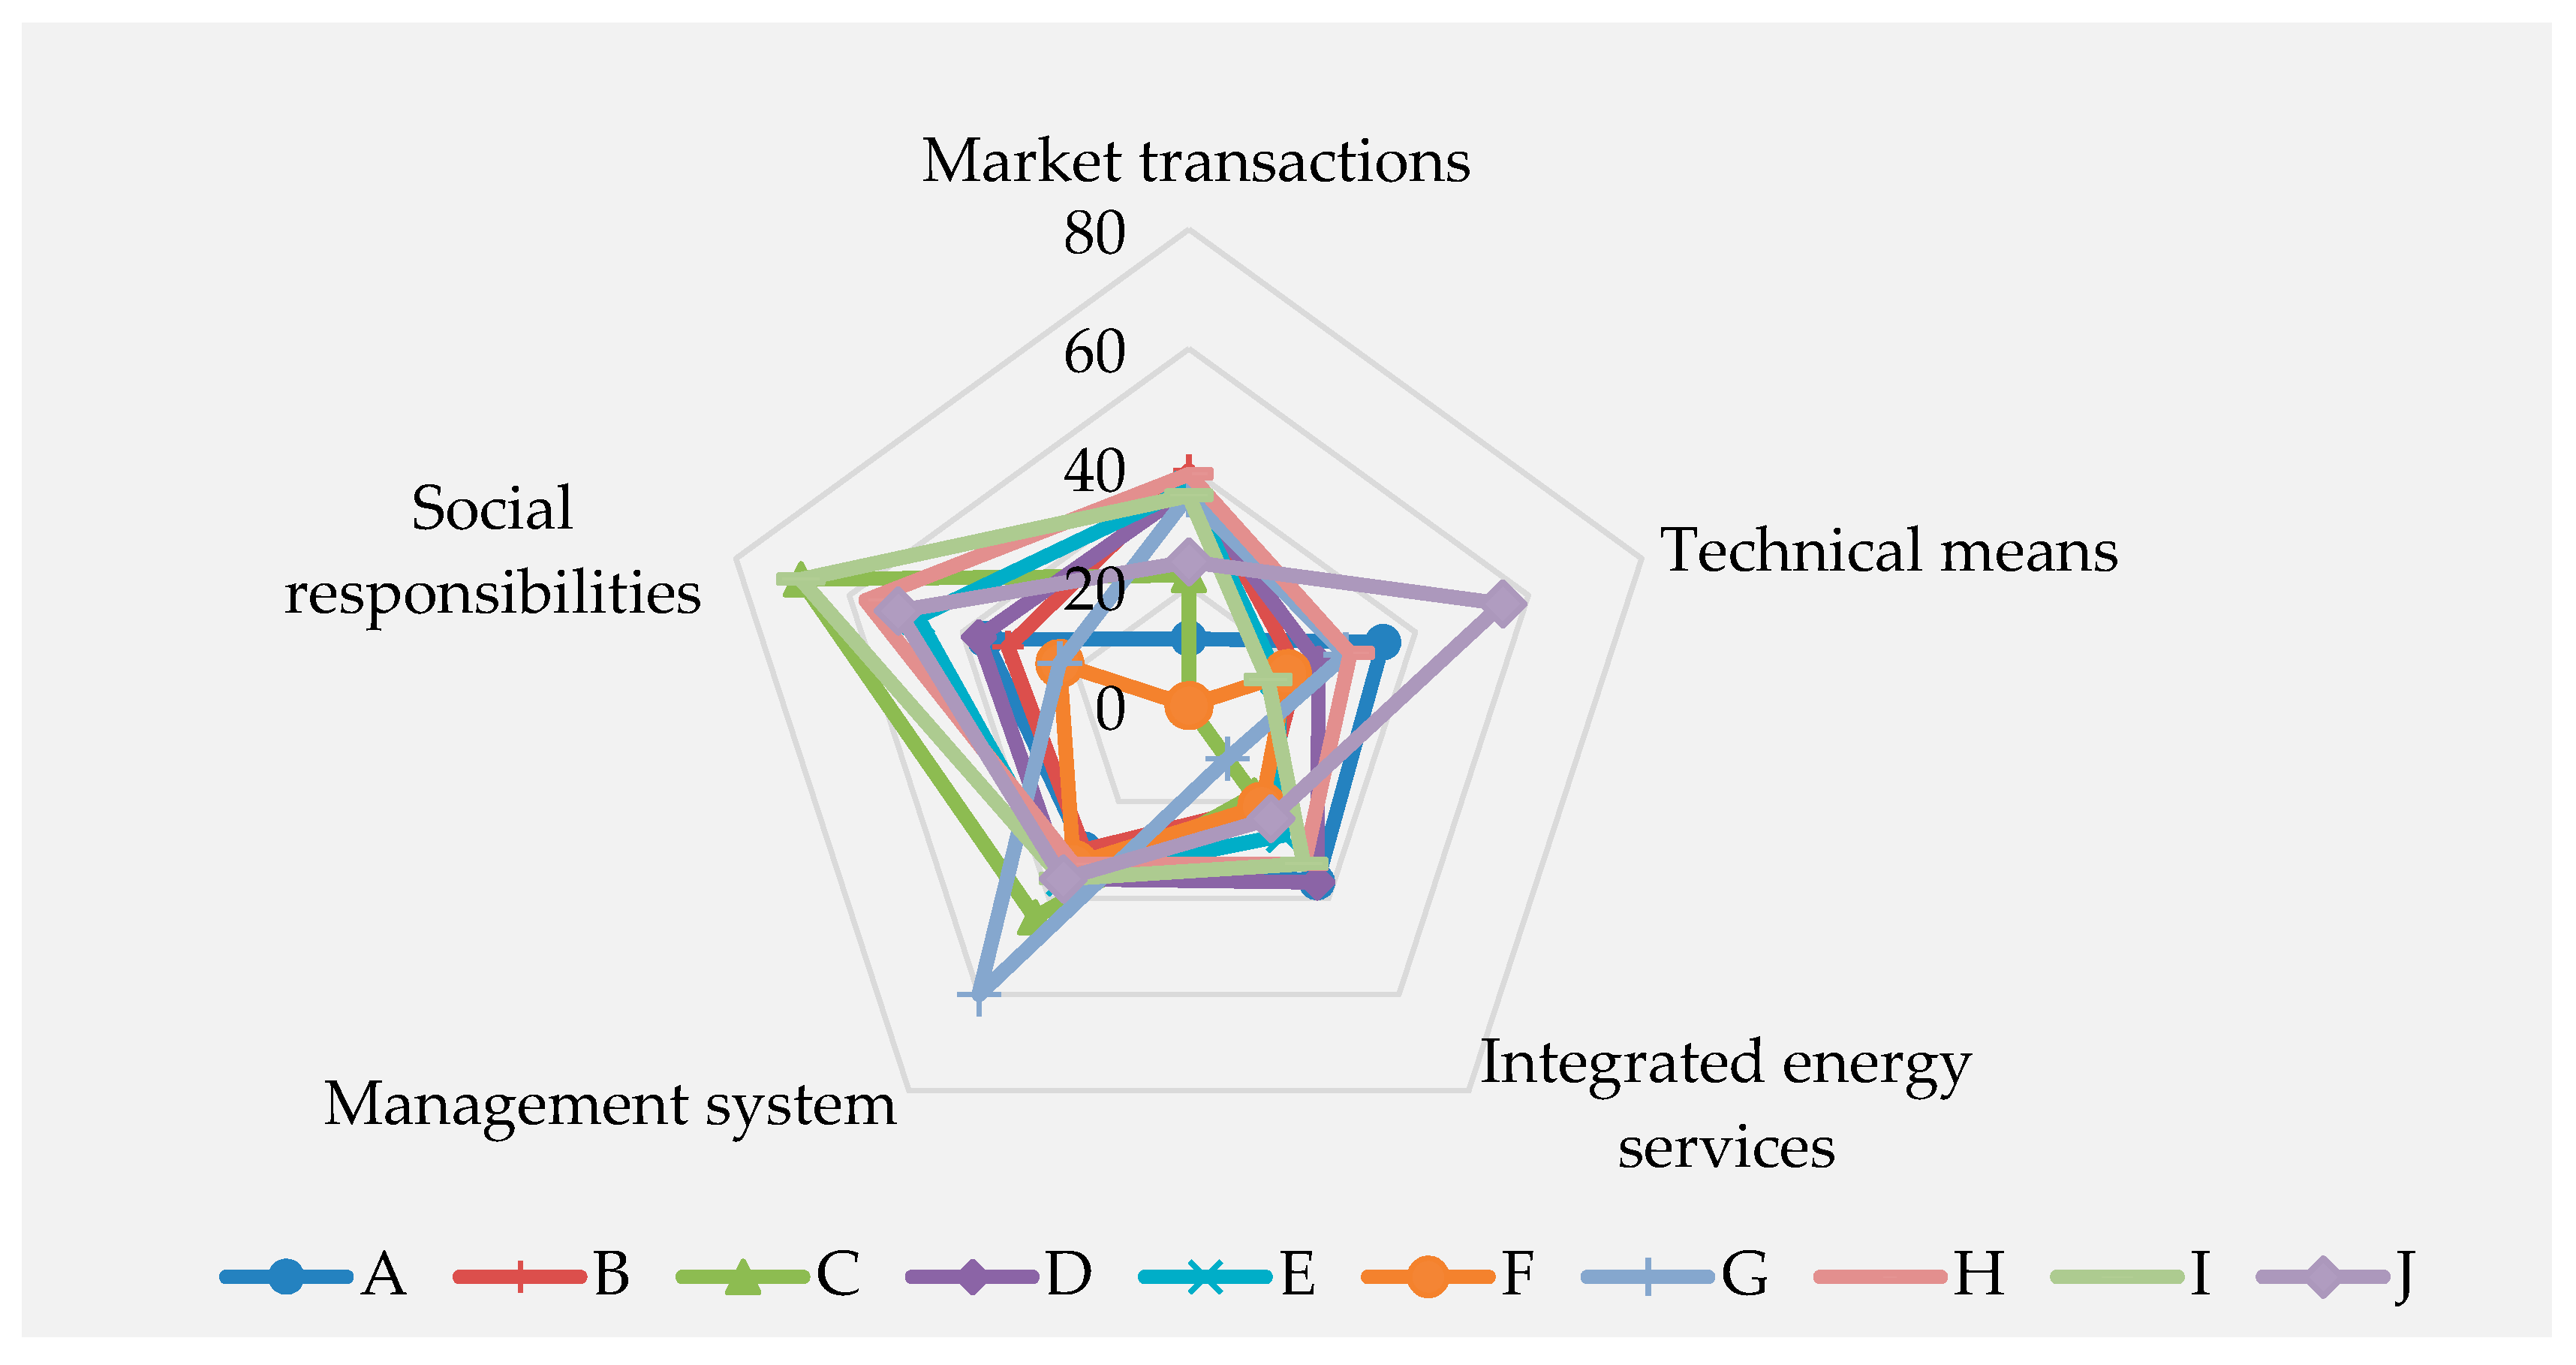
6.2. Two-Level Fuzzy Comprehensive Evaluation
7. Conclusions
- (1)
- Choose the emerged electricity retailers as evaluation objects and take the qualitative factors of policies into consideration in the process of constructing the indicator system. Therefore, the indicator system that is proposed in this paper can better reflect the specific impact of the new electric power reform, energy planning and transformation, and the carbon market construction on China’s current energy saving and emission reduction actions in the electricity sales side. In a word, it enlarges the research scope for market players in China’s electricity sales side on the evaluation of energy saving and emission reduction effects and it improves the totality of the existing evaluation indicator system in the electric power industry.
- (2)
- Apply the fuzzy combination weighting method into the evaluation of energy saving and emission reduction effects for electricity retailers. The weights of indicators given by combining AHP and entropy weight method are more comprehensive, accurate, and scientific. Moreover, qualitative indicators can be reasonably quantified through the multi-level fuzzy comprehensive evaluation, which helps to provide a valid method for electricity retailers that are actively involved in the current electricity sales market in China to assess the effects. Therefore, it gives the reference point for electricity retailers in China to realize the sustainable development in the sales side effectively by means of taking timely and appropriate actions on energy saving and emission reduction, implementing the concept of low carbon electricity to improve their core competitiveness.
- (1)
- With the continuous improvement of China’s electric power reform, energy planning and transformation, and the carbon market construction, timely interpretation of policy documents will be conducted so as to analyze the implications and impacts on energy saving and emission reduction actions of electricity retailers. Furthermore, the selection of indicators will be carried out around the latest market environment, and the existing evaluation indicator system will be improved and revised.
- (2)
- In the future research, according to the actual operation status of electricity retailers and the availability of data, we will consider converting some qualitative indicators into quantitative ones. To improve the reliability of evaluation results, the quantification process based on the expert scoring method will be replaced by actual data.
- (3)
- Based on the data distribution of indicators, we will study the corresponding membership function in the middle and later time of the sales market development. Then, the fuzzy evaluation value will be calculated by means of the explicit membership function and a more scientific and practical evaluation method will be realized.
Author Contributions
Funding
Acknowledgments
Conflicts of Interest
Appendix A
References
- Liu, J.R. Analysis of Energy Saving and Emission Reduction Effects of High Voltage Frequency Conversion Technology under the Characteristics of Electric Power Production. China Venture Cap. 2013, 12, 83. [Google Scholar] [CrossRef]
- Jiang, P.; Chen, B.; Qi, L. Analysis of Energy Saving and Emission Reduction Effect of Central Heating Supplied by Large Coal-Fired Power Unit. Guangxi Electr. Power 2017, 40, 22–24. [Google Scholar] [CrossRef]
- Lu, M.X.; Ji, H.H.; Mo, Y.T.; Wang, Z.X. Ways to Realize Energy Saving and Emission Reduction of Power Equipment, Especially Switchgear. Electrotech. Electr. 2014, 34, 60–61. [Google Scholar] [CrossRef]
- Luo, Y.H.; Ya, H.Q. Research and Application of Power Saving and Emission Reduction and Resource Optimization Allocation Technology. China High Technol. Enterp. 2013, 31, 70–72. [Google Scholar] [CrossRef]
- Xu, N.Z.; Zeng, W.H. A Comprehensive Method Based on Interval-Value for Evaluation of Energy-Saving and Emission-Reducing. Environ. Sci. Technol. 2014, 32, 187–192. [Google Scholar] [CrossRef]
- Cheng, Y.X. Research on the Effect Evaluation of Energy-Saving and Emission Reduction in Thermal Power Enterprises. Master’s Thesis, North China Electric Power University, Beijing, China, 2013. [Google Scholar]
- Cao, L.H.; Xu, J.J.; Li, Y. Evaluation on Performance of Energy-Saving and Emission Reduction in Thermal Power Plants Based on Grey Relation Method. Environ. Eng. 2014, 32, 140–143. [Google Scholar] [CrossRef]
- Wang, H.X.; Xie, C. Analysis on Energy-Saving Emissions Effect of Biomass Power Generation. Eng. Technol. 2015, 7, 218. [Google Scholar]
- Li, J.Y.; Zhang, H.; Cheng, Y.X. Study on Evaluation of Energy Saving and Emission Reduction Effect in Thermal Power Enterprises Based on Entropy-Weighted Extentic Model. Heilongjiang Electr. Power 2013, 35, 478–482. [Google Scholar] [CrossRef]
- Jia, Z.Y.; Wei, Z.C. The Effect Analysis and Empirical Research of Power Enterprises in Energy Conservation. Sci. Technol. Manag. Res. 2014, 34, 229–234. [Google Scholar] [CrossRef]
- Zhang, L. Comprehensive Evaluation of Energy Saving and Emission Reduction Performance of Thermal Power Enterprises Based on Complex System Theory. Master’s Thesis, North China Electric Power University, Beijing, China, 2015. [Google Scholar]
- Bai, J.H.; Wei, J.P.; Liu, J.X.; Xu, F.L.; Wang, H.S. Fuzzy Comprehensive Evaluation for Energy Saving and Emission Reduction of Coal-Fired Units Based on Subjective-Objective Weighting Method. Power Equip. 2018, 32, 90–93. [Google Scholar] [CrossRef]
- Cao, L.H.; Cui, W.T.; Xu, J.J.; Li, Y. Application of Entropy-Weight-Based Fuzzy-Matter Model Element in Comprehensive Evaluation of Energy Saving and Emission Reduction in Power Plants. Therm. Power Gener. 2015, 43, 54–57. [Google Scholar] [CrossRef]
- Ding, Y.F.; Tang, D.S.; Wang, T. Benefit Evaluation on Energy Saving and Emission Reduction of National Small Hydropower Ecological Protection Project. Energy Procedia 2011, 5, 540–544. [Google Scholar] [CrossRef]
- Zhou, H.R. Evaluation Model and Method for Energy Saving and Emission Reduction of Regional Power Grid. Electr. Age 2015, 35, 54–57. [Google Scholar]
- Zeng, M.; Xu, Z.Z.; Liu, X.L.; Liu, Q.Y. Power Grid Enterprise Energy Conservation and Emission Reduction Effect Analysis Model and Application—Based on Improved TOPSIS Method. Technoeconomics Manag. Res. 2012, 34, 12–16. [Google Scholar] [CrossRef]
- Liu, Q.Y. The Study on Comprehensive Evaluation about Energy-Saving and Emission Reduction Contribution Effect of Power Grid Enterprise. Master’s Thesis, North China Electric Power University, Beijing, China, 2012. [Google Scholar]
- Wu, Y.W.; Chen, R.; Lou, S.H.; Chen, W. Fuzzy Comprehension Evaluation of Potential Energy Saving and Emission Reduction on Regional Power Grid Using Entropy Weight. J. Huazhong Univ. Sci. Technol. Nat. Sci. 2010, 10, 115–118. [Google Scholar] [CrossRef]
- Sun, J.D.; Wang, X.D. Technology of Energy Saving and Emission Reducing in Boiler of Coal-Fired Power Plant. Electr. Power 2010, 43, 55–57. [Google Scholar] [CrossRef]
- Wang, Y. Research on Energy Saving and Consumption Reduction Method of Steam Turbine in Coal-Fired Power Plant. Sci. Technol. Vis. 2015, 34. [Google Scholar] [CrossRef]
- Li, S.K. Discussion on Energy Saving and Emission Reduction of Thermal Power System in Thermal Power Plant. Low Carbon World 2013, 20, 137–138. [Google Scholar]
- Xue, S.; Wang, Z.J.; Zeng, M. Energy Saving and Emission Reduction Assessment Model for Distributed Generation and Microgrid Technology. Huadong Electr. Power 2013, 41, 694–698. [Google Scholar]
- Song, X.H. Energy-Conservation Route of Power Generation Industry Based on Low Carbon Economy. Master’s Thesis, North China Electric Power University, Beijing, China, 2012. [Google Scholar]
- Tian, X.; Yang, S.Z.; Guo, B. Research on Energy Saving and Emission Reduction Measures for Provincial Power Grid Enterprises. Technol. Outlook 2015, 3, 68–73. [Google Scholar] [CrossRef]
- Liang, Z.H.; Yang, K.; Sun, Y.W.; Yuan, J.H.; Zhang, H.W.; Zhang, Z.Z. Decision Support for Choice Optimal Power Generation Projects: Fuzzy Comprehensive Evaluation Model Based on the Electricity Market. Energy Policy 2006, 34, 3359–3364. [Google Scholar] [CrossRef]
- Zhang, S.; Shi, X.Z.; Gu, D.S.; Huang, G.H. Analysis and Evaluation of Safety Management Capability in Mine Based on ISM and AHP and Fuzzy Evaluation Method. J. Cent. South Univ. 2011, 42, 2406–2416. [Google Scholar]
- Karavas, C.; Arvanitis, K.; Papadakis, G. A Game Theory Approach to Multi-Agent Decentralized Energy Management of Autonomous Polygeneration Microgrids. Energies 2017, 10, 1756. [Google Scholar] [CrossRef]
- Wang, M.; Niu, D.X. Research on Project Post-Evaluation of Wind Power Based on Improved ANP and Fuzzy Comprehensive Evaluation Model of Trapezoid Subordinate Function Improved by Interval Number. Renew. Energy 2019, 132, 255–265. [Google Scholar] [CrossRef]
- Li, B. Current Status and Improvement of Energy Saving and Emission Reduction in Power Industry. Low Carbon World 2017, 7, 109–110. [Google Scholar] [CrossRef]
- Peng, Z.L.; Zhang, A.P.; Wang, S.F.; Bai, Y. Designing Principles and Constructing Processes of the Comprehensive Evaluation Indicator System. Sci. Res. Manag. 2017, 38, 209–215. [Google Scholar] [CrossRef]
- Li, Z.M.; Zhang, J.H.; Chen, M.J. Fuzzy Comprehensive Evaluation of Enterprise’s Oderly Power Utility Based on Analytic Hierarchy Process. Power Syst. Prot. Control 2013, 41, 136–141. [Google Scholar] [CrossRef]
- Bai, L.; Wang, H.; Shi, C.; Du, Q.; Li, Y. Assessment of SIP Buildings for Sustainable Development in Rural China Using AHP-Grey Correlation Analysis. Int. J. Environ. Res. Public Health 2017, 14, 1292. [Google Scholar] [CrossRef] [PubMed]
- Deng, X.; Li, J.M.; Zeng, H.J.; Chen, J.Y.; Zhao, J.F. Research on Computation Methods of AHP Weight Vector and Its Applications. Math. Pract. Theory 2012, 42, 93–100. [Google Scholar] [CrossRef]
- Cheng, X.H.; Liang, Q.L.; He, J.Q. Method for Weight Decision of WSNs Performance Index Based on Entropy Weight Method. Transducer Microsyst. Technol. 2013, 32, 44–47. [Google Scholar] [CrossRef]
- Li, C.; Yu, C. Performance Evaluation of Public Non-Profit Hospitals Using A BP Artificial Neural Network: the Case of Hubei Province in China. Int. J. Environ. Res. Public Health 2013, 10, 3619–3633. [Google Scholar] [CrossRef] [PubMed]
- Lu, D.D.; Song, W.H.; Zhang, G.C.; Huang, N.; Liu, P. Evaluation on Vulnerability of Hazard Bearing Body in Petrochemical Enterprises Based on AHP-Entropy Weight Method. J. Saf. Sci. Technol. 2015, 11, 180–185. [Google Scholar] [CrossRef]
- Sun, L.; Zhang, Y.X. Fuzzy Comprehensive Evaluation on Risk of Human Resource Management Outsourcing Based on Combinational Weight. Technol. Econ. 2012, 31, 77–81. [Google Scholar] [CrossRef]
- Dong, Y.; Fu, W.X. Application of Fuzzy Comprehensive Evaluation Method in Water Quality Evaluation of the Weihe River. Ind. Saf. Environ. Prot. 2015, 41, 17–20. [Google Scholar] [CrossRef]
- Qin, Q.; Dai, W.; Yang, Q. Security Evaluation on Ecological System of City Based on Entropy Weight and Fuzzy Synthetic Evaluation. J. Northwest Teach. Univ. Nat. Sci. 2014, 50, 110–114. [Google Scholar] [CrossRef]
- Miao, S.J.; Wang, Z.M.; Liu, Y.Y.; Cui, S.J.; Liang, M.C. Fuzzy Evaluation Model of Mining Methods and Its Application Based on AHP. Min. Res. Dev. 2017, 25, 66–69. [Google Scholar] [CrossRef]
- Wang, Y.; Zhang, J.; Guo, E.; Sun, Z. Fuzzy Comprehensive Evaluation-Based Disaster Risk Assessment of Desertification in Horqin Sand Land, China. Int. J. Environ. Res. Public Health 2015, 12, 1703–1705. [Google Scholar] [CrossRef] [PubMed]


| Target Hierarchy | Program Hierarchy | Criterion Hierarchy | Type of Indicators | |
|---|---|---|---|---|
| Quantitative | Qualitative | |||
| Energy saving and emission reduction effects for electricity retailers | Market transactions | A proportion of new energy investment | √ | |
| Ability to obtain allowances for the carbon market trading spreads as an agent | √ | |||
| CCER trading volume | √ | |||
| Customer electricity cost reduction rate | √ | |||
| A reasonable degree of electricity price setting | √ | |||
| Technical means | Investment in research of energy saving and emission reduction technologies | √ | ||
| Construction scale of charging facilities for electric vehicles | √ | |||
| Construction level of monitoring platform for energy saving services | √ | |||
| Ability to collect and analyze the data of smart electricity utilization | √ | |||
| Integrated energy services | Output value of energy management contract projects | √ | ||
| Electricity saving growth rate at the user side | √ | |||
| Quality of energy saving and management design | √ | |||
| Level of carbon asset management services | √ | |||
| Management system | Energy saving and emission reduction policies of electricity retailers | √ | ||
| Implementation of energy saving and emission reduction rules of employees | √ | |||
| Social responsibilities | Propaganda of low-carbon economic awareness | √ | ||
| Completion rate of the annual energy-saving emission reduction target | √ | |||
| Scale Values | Implications of |
|---|---|
| 1 | Indicator is as important as indicator |
| 3 | Indicator is slightly more important than indicator |
| 5 | Indicator is more important than indicator |
| 7 | Indicator is strongly more important than indicator |
| 9 | Indicator is extremely more important than indicator |
| 2,4,6,8 | The middle value of the above two adjacent scale judgment |
| Reciprocal | Ratio of the importance of indicator to indicator |
| Values of | Values of | ||
|---|---|---|---|
| 1 | 0 | 9 | 1.46 |
| 2 | 0 | 10 | 1.49 |
| 3 | 0.52 | 11 | 1.52 |
| 4 | 0.89 | 12 | 1.54 |
| 5 | 1.12 | 13 | 1.56 |
| 6 | 1.24 | 14 | 1.58 |
| 7 | 1.36 | 15 | 1.59 |
| 8 | 1.41 | — | — |
| Three-Level Indicators | Electricity Retailers | |||||||||
|---|---|---|---|---|---|---|---|---|---|---|
| A | B | C | D | E | F | G | H | I | J | |
| 0.8689 | 0.8060 | 0.7355 | 0.9398 | 0.9995 | 0.7626 | 0.8507 | 0.8829 | 0.8960 | 1.0000 | |
| 0.8975 | 0.8604 | 0.8157 | 0.9520 | 0.9760 | 0.8124 | 1.0000 | 0.9324 | 0.9520 | 0.9237 | |
| 0.1489 | 0.3925 | 0.2684 | 0.6444 | 1.0000 | 0.3327 | 0.5553 | 0.7106 | 0.2977 | 0.3340 | |
| 0.6190 | 0.7619 | 0.5524 | 0.9048 | 0.7143 | 0.6476 | 0.7810 | 0.7143 | 1.0000 | 0.8571 | |
| 0.8481 | 0.9335 | 0.8404 | 0.9279 | 1.0000 | 0.9346 | 0.8038 | 0.9479 | 0.9157 | 0.9579 | |
| 0.7125 | 0.5375 | 0.3656 | 0.8031 | 0.4219 | 0.3250 | 0.6906 | 0.8625 | 1.0000 | 0.8906 | |
| 0.6000 | 0.4889 | 0.2889 | 1.0000 | 0.7111 | 0.4444 | 0.5333 | 0.4444 | 0.3333 | 0.5556 | |
| 0.7713 | 0.5923 | 0.6477 | 0.8054 | 0.8707 | 0.5526 | 0.9134 | 0.8366 | 0.8125 | 1.0000 | |
| 0.9407 | 0.9021 | 0.7352 | 0.8455 | 1.0000 | 0.6717 | 0.9545 | 0.7669 | 0.7228 | 0.9076 | |
| 0.8521 | 0.6549 | 0.2993 | 0.9085 | 1.0000 | 0.5880 | 0.4366 | 0.7852 | 0.6127 | 0.8627 | |
| 0.3064 | 0.4641 | 0.2368 | 0.6855 | 1.0000 | 0.5685 | 0.3371 | 0.3832 | 0.6552 | 0.8382 | |
| 0.9595 | 0.8639 | 0.8155 | 0.9269 | 0.7402 | 0.6862 | 0.8493 | 0.7750 | 0.9291 | 1.0000 | |
| 0.8904 | 0.8800 | 0.7774 | 1.0000 | 0.9814 | 0.8403 | 0.9709 | 0.8834 | 0.9592 | 0.9825 | |
| 0.9016 | 0.9147 | 0.9357 | 0.9921 | 0.9501 | 0.8635 | 1.0000 | 0.8898 | 0.9777 | 0.9606 | |
| 0.9265 | 0.9027 | 0.9870 | 0.8519 | 0.9146 | 0.8249 | 1.0000 | 0.8303 | 0.8908 | 0.9243 | |
| 0.7123 | 0.8630 | 0.7511 | 0.9372 | 1.0000 | 0.6644 | 0.7477 | 0.8196 | 0.7123 | 0.8345 | |
| 0.9615 | 0.9707 | 0.9791 | 1.0000 | 0.9791 | 0.8678 | 0.9637 | 0.9749 | 0.9791 | 0.9791 | |
| Program Hierarchy | Weights of Indicators | Criterion Hierarchy | Weights of Indicators | Consistency Check |
|---|---|---|---|---|
| 0.0939 | 0.1443 | = 5.2461 = 0.0615 = 0.0549 | ||
| 0.4309 | ||||
| 0.3155 | ||||
| 0.0665 | ||||
| 0.0429 | ||||
| 0.2188 | 0.5280 | = 4.2496 = 0.0832 = 0.0936 | ||
| 0.3221 | ||||
| 0.0604 | ||||
| 0.0895 | ||||
| 0.5800 | 0.3326 | = 4.1179 = 0.0393 = 0.0442 | ||
| 0.1136 | ||||
| 0.2572 | ||||
| 0.2975 | ||||
| 0.0412 | 0.2500 | = 2 Complete consistency | ||
| 0.7500 | ||||
| 0.0661 | 0.1429 | = 2 Complete consistency | ||
| 0.8571 |
| Single-Level Indicators | Two-Level Indicators | Three-Level Indicators | The Weights of Indicators |
|---|---|---|---|
| 0.0105 | |||
| 0.0050 | |||
| 0.2814 | |||
| 0.0320 | |||
| 0.0044 | |||
| 0.1329 | |||
| 0.1300 | |||
| 0.0339 | |||
| 0.0179 | |||
| 0.1072 | |||
| 0.1993 | |||
| 0.0140 | |||
| 0.0064 | |||
| 0.0023 | |||
| 0.0042 | |||
| 0.0171 | |||
| 0.0014 |
| Single-Level Indicators | Two-Level Indicators | Three-Level Indicators | Weights of Energy Saving and Emission Reduction Effects Indicators of Electricity Retailers | ||
|---|---|---|---|---|---|
| AHP | Entropy Weight Method | Combination Weights | |||
| 0.1443 | 0.0105 | 0.1440 | |||
| 0.4309 | 0.0050 | 0.4305 | |||
| 0.3155 | 0.2814 | 0.3136 | |||
| 0.0665 | 0.0320 | 0.0663 | |||
| 0.0429 | 0.0044 | 0.0429 | |||
| 0.5280 | 0.1329 | 0.5176 | |||
| 0.3221 | 0.1300 | 0.3171 | |||
| 0.0604 | 0.0339 | 0.0602 | |||
| 0.0895 | 0.0179 | 0.0892 | |||
| 0.3326 | 0.1072 | 0.3278 | |||
| 0.1136 | 0.1993 | 0.1170 | |||
| 0.2572 | 0.0140 | 0.2565 | |||
| 0.2975 | 0.0064 | 0.2971 | |||
| 0.2500 | 0.0023 | 0.2499 | |||
| 0.7500 | 0.0042 | 0.7494 | |||
| 0.1429 | 0.0171 | 0.1425 | |||
| 0.8571 | 0.0014 | 0.8569 | |||
| Electricity Retailers | Fuzzy Evaluation Value | ||||
|---|---|---|---|---|---|
| A | 0.0288 | 0 | 0 | 0 | 0.1714 |
| 0.2298 | 0.2839 | 0.162 | 0.4496 | 0.1999 | |
| 0.2555 | 0.5726 | 0.6117 | 0.4997 | 0.5996 | |
| 0.2817 | 0.1276 | 0.2013 | 0.05 | 0.0285 | |
| 0.2014 | 0 | 0.0234 | 0 | 0 | |
| B | 0 | 0 | 0 | 0 | 0.1714 |
| 0.1367 | 0 | 0.0234 | 0.1499 | 0.3998 | |
| 0.6589 | 0.1903 | 0.3851 | 0.4997 | 0.2284 | |
| 0.194 | 0.4793 | 0.5243 | 0.3497 | 0.1999 | |
| 0.0086 | 0.3145 | 0.0656 | 0 | 0 | |
| C | 0 | 0 | 0 | 0.1499 | 0.6855 |
| 0.0947 | 0 | 0 | 0.5496 | 0.1999 | |
| 0.3647 | 0.1109 | 0.1107 | 0.2498 | 0.0855 | |
| 0.3128 | 0.3191 | 0.4678 | 0.05 | 0.0285 | |
| 0.2251 | 0.5512 | 0.4198 | 0 | 0 | |
| D | 0.1995 | 0.1268 | 0.1484 | 0 | 0.3713 |
| 0.4542 | 0.2938 | 0.4588 | 0.1999 | 0.3713 | |
| 0.3436 | 0.3824 | 0.3399 | 0.5996 | 0.2569 | |
| 0 | 0.1633 | 0.0513 | 0.1999 | 0 | |
| 0 | 0.0178 | 0 | 0 | 0 | |
| E | 0.335 | 0.1625 | 0.1358 | 0 | 0.3998 |
| 0.457 | 0.25 | 0.1484 | 0.2998 | 0.5996 | |
| 0.1788 | 0.261 | 0.4495 | 0.5996 | 0 | |
| 0.0265 | 0.1035 | 0.2133 | 0.1 | 0 | |
| 0 | 0.207 | 0.0513 | 0 | 0 | |
| F | 0 | 0 | 0 | 0 | 0 |
| 0.0172 | 0.0634 | 0.0468 | 0.1499 | 0 | |
| 0.1384 | 0.2081 | 0.2546 | 0.5496 | 0.057 | |
| 0.3611 | 0.4337 | 0.5207 | 0.2998 | 0.5711 | |
| 0.4807 | 0.2788 | 0.1763 | 0 | 0.3713 | |
| G | 0.1722 | 0 | 0.0594 | 0.05 | 0 |
| 0.4425 | 0.2923 | 0.2296 | 0.7495 | 0 | |
| 0.3113 | 0.4615 | 0.2367 | 0.1999 | 0.057 | |
| 0.0713 | 0.2304 | 0.276 | 0 | 0.5711 | |
| 0 | 0 | 0.1967 | 0 | 0.3713 | |
| H | 0.0288 | 0 | 0 | 0 | 0.1714 |
| 0.4858 | 0.386 | 0 | 0.1499 | 0.714 | |
| 0.4562 | 0.4749 | 0.5497 | 0.5496 | 0.114 | |
| 0.0265 | 0.1232 | 0.4487 | 0.2998 | 0 | |
| 0 | 0 | 0 | 0 | 0 | |
| I | 0.1391 | 0.3106 | 0 | 0 | 0.6855 |
| 0.4413 | 0.207 | 0.4105 | 0.05 | 0.1999 | |
| 0.166 | 0.1174 | 0.2744 | 0.5996 | 0.0855 | |
| 0.1882 | 0.3491 | 0.248 | 0.3497 | 0.0285 | |
| 0.0627 | 0 | 0.0656 | 0 | 0 | |
| J | 0.0288 | 0 | 0.0747 | 0 | 0.5141 |
| 0.3019 | 0.6926 | 0.3429 | 0.1999 | 0.3998 | |
| 0.2669 | 0.2023 | 0.3902 | 0.5996 | 0.057 | |
| 0.1488 | 0.0535 | 0.1905 | 0.1999 | 0.0285 | |
| 0.2509 | 0.0357 | 0 | 0 | 0 | |
| Electricity Retailers | |||||
|---|---|---|---|---|---|
| A | Poor | Moderate | Moderate | Moderate | Moderate |
| B | Moderate | Poor | Poor | Moderate | Good |
| C | Moderate | Extremely poor | Poor | Good | Excellent |
| D | Good | Moderate | Good | Moderate | Excellent |
| E | Good | Moderate | Moderate | Moderate | Good |
| F | Extremely poor | Poor | Poor | Moderate | Poor |
| G | Good | Moderate | Poor | Good | Poor |
| H | Good | Moderate | Moderate | Moderate | Good |
| I | Good | Poor | Good | Moderate | Excellent |
| J | Good | Good | Moderate | Moderate | Excellent |
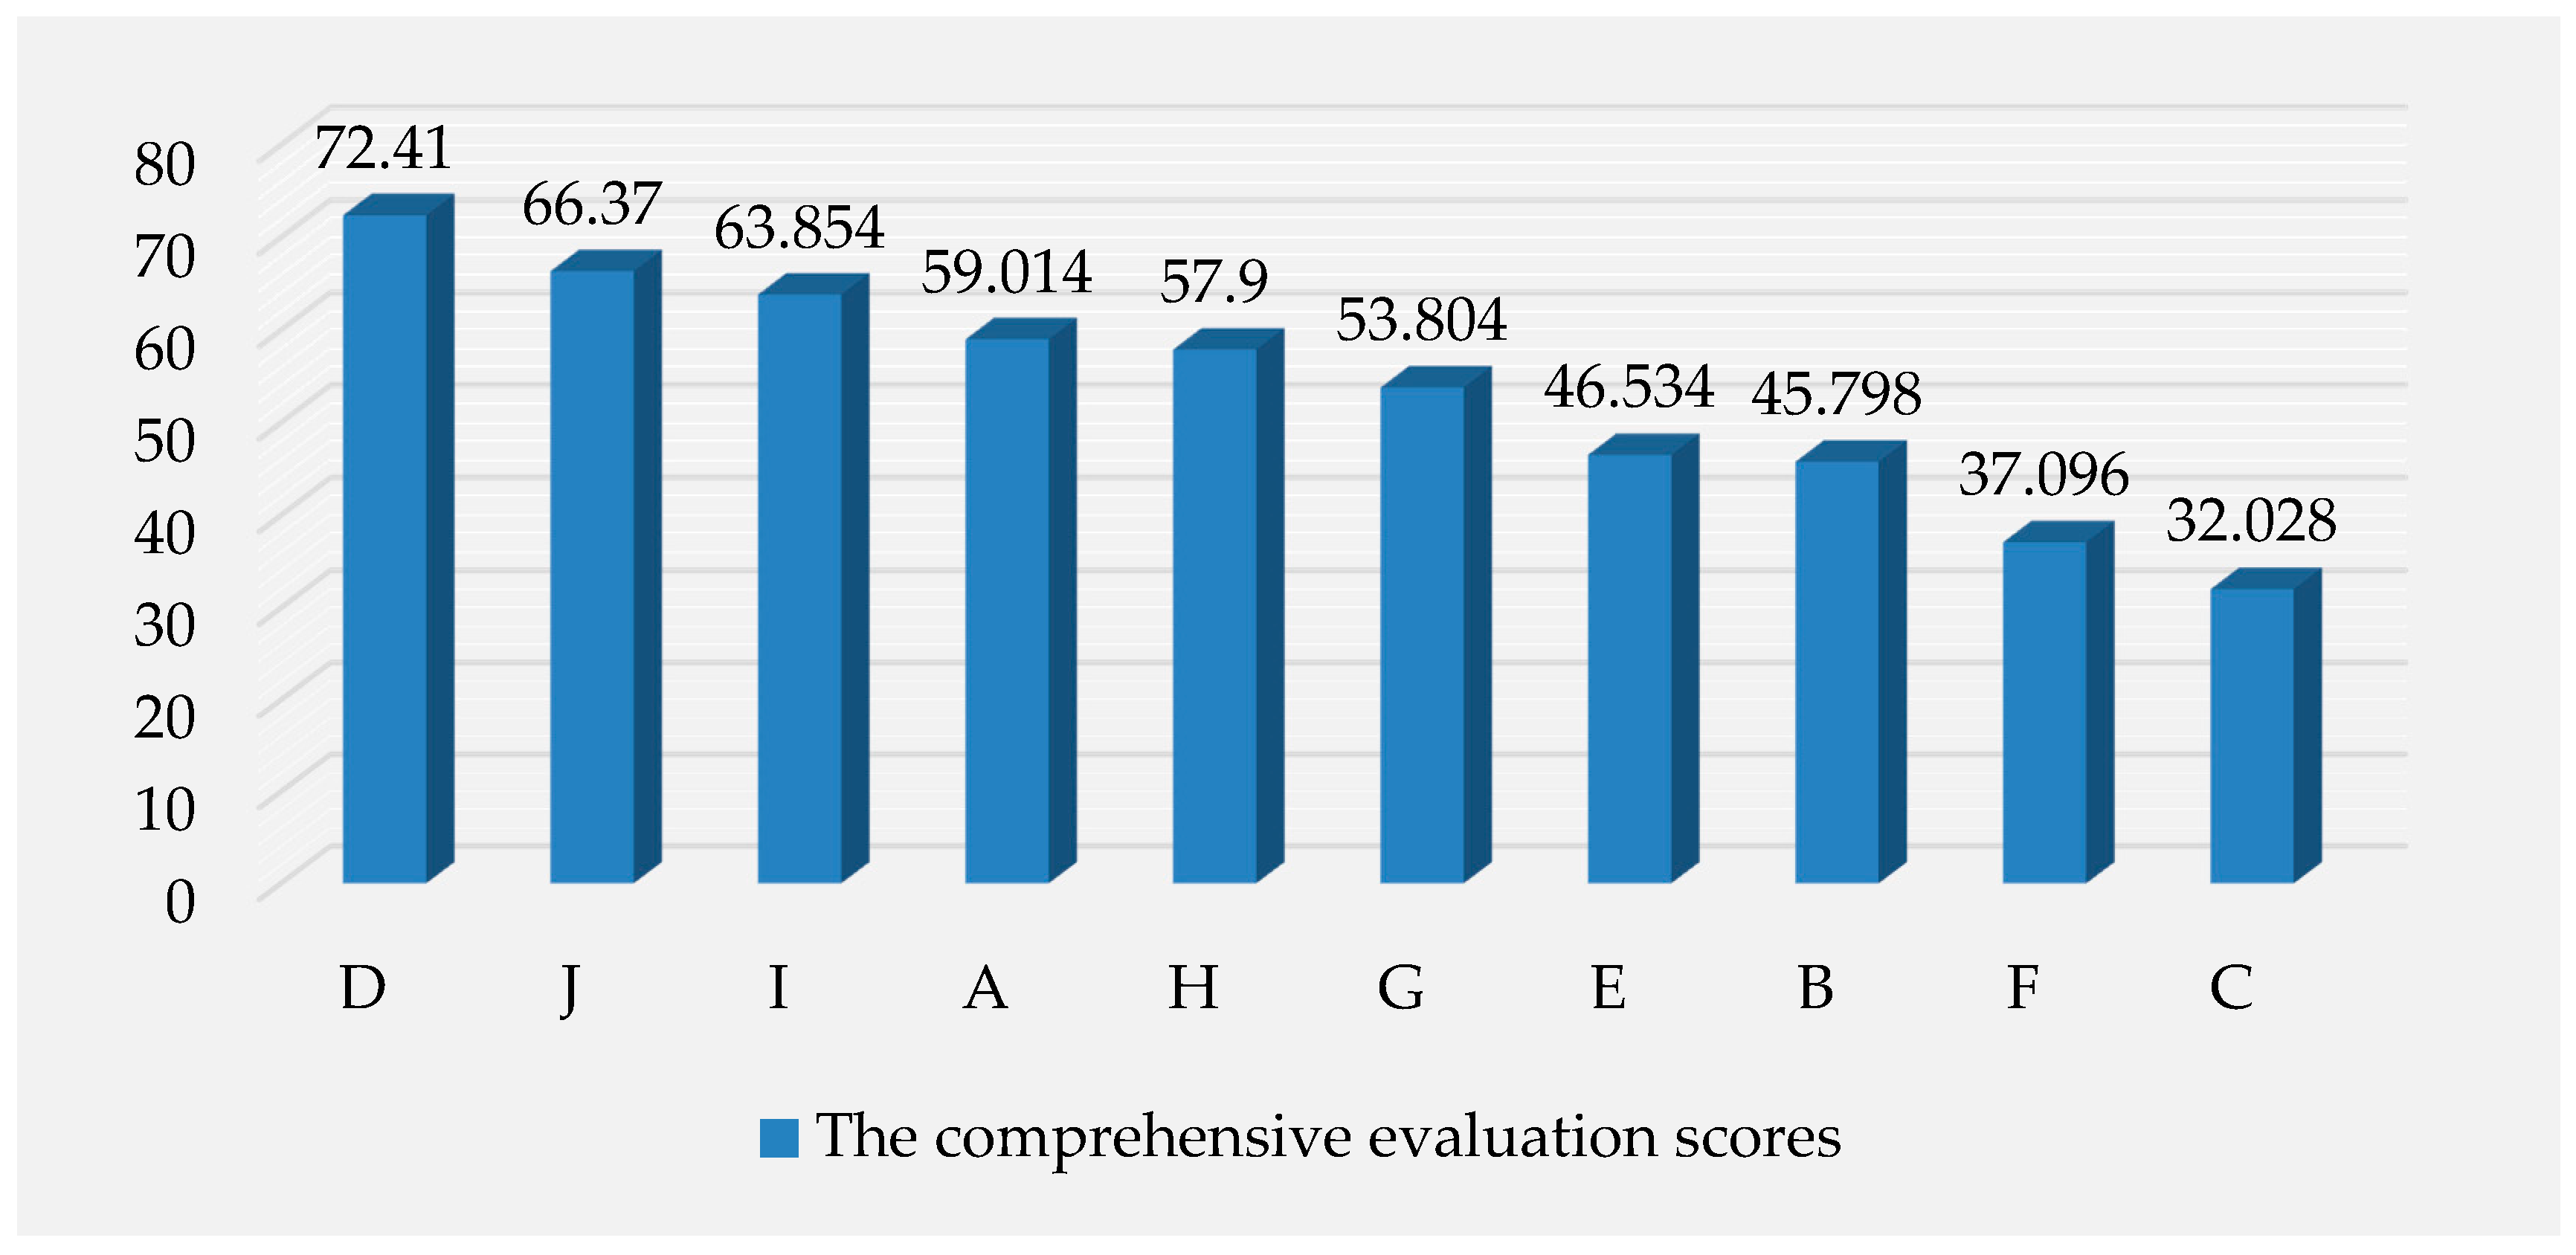
| Electricity Retailers | Fuzzy Comprehensive Evaluation Vectors | Maximum Membership Degree | Fuzzy Evaluation Levels | Comprehensive Evaluation Scores | Sorted Resuls |
|---|---|---|---|---|---|
| A | (0.0140, 0.2094, 0.5643, 0.1751, 0.0325) | 0.5643 | Moderate | 59.014 | 4 |
| B | (0.0113, 0.0590, 0.3626, 0.4548, 0.1077) | 0.4548 | Poor | 45.798 | 8 |
| C | (0.0515, 0.0447, 0.1387, 0.3745, 0.3852) | 0.3852 | Extremely poor | 32.028 | 10 |
| D | (0.1571, 0.4058, 0.3548, 0.0737, 0.0039) | 0.4058 | Good | 72.41 | 1 |
| E | (0.1722, 0.2357, 0.3593, 0.1530, 0.0750) | 0.3593 | Moderate | 46.534 | 7 |
| F | (0, 0.4880, 0.2326, 0.4809, 0.2329) | 0.4809 | Poor | 37.096 | 9 |
| G | (0.0527, 0.2696, 0.2795, 0.2549, 0.1386) | 0.2795 | Moderate | 53.804 | 6 |
| H | (0.0140, 0.1834, 0.4958, 0.3020,0) | 0.4958 | Moderate | 57.9 | 5 |
| I | (0.1263, 0.3401, 0.2308, 0.2542, 0.0439) | 0.3401 | Good | 63.854 | 3 |
| J | (0.0800, 0.4134, 0.3241, 0.1463, 0.0314) | 0.4134 | Good | 66.37 | 2 |
© 2018 by the authors. Licensee MDPI, Basel, Switzerland. This article is an open access article distributed under the terms and conditions of the Creative Commons Attribution (CC BY) license (http://creativecommons.org/licenses/by/4.0/).
Share and Cite
Li, S.; Niu, D.; Wu, L. Evaluation of Energy Saving and Emission Reduction Effects for Electricity Retailers in China Based on Fuzzy Combination Weighting Method. Appl. Sci. 2018, 8, 1564. https://doi.org/10.3390/app8091564
Li S, Niu D, Wu L. Evaluation of Energy Saving and Emission Reduction Effects for Electricity Retailers in China Based on Fuzzy Combination Weighting Method. Applied Sciences. 2018; 8(9):1564. https://doi.org/10.3390/app8091564
Chicago/Turabian StyleLi, Si, Dongxiao Niu, and Luofei Wu. 2018. "Evaluation of Energy Saving and Emission Reduction Effects for Electricity Retailers in China Based on Fuzzy Combination Weighting Method" Applied Sciences 8, no. 9: 1564. https://doi.org/10.3390/app8091564