Article

The Method of Multi-Camera Layout in Motion Capture System for Diverse Small Animals

1
Institute of Bio-inspired Structure and Surface Engineering, Nanjing University of Aeronautics and Astronautics, 29 Yudao Street, Nanjing 210016, Jiangsu, China
2
Mechanical Engineering Institute, Nantong University, 9 Sik Yuen Road, Nantong 226019, Jiangsu, China
3
Shanghai Institute of Aerospace System Engineering, 3888 Yuanjiang Road, Shanghai 201109, China
*
Authors to whom correspondence should be addressed.
Appl. Sci. 2018, 8(9), 1562; https://doi.org/10.3390/app8091562
Submission received: 2 August 2018 / Revised: 27 August 2018 / Accepted: 31 August 2018 / Published: 5 September 2018

Abstract

:
Motion capture based on multi-camera is widely used in the quantification of animal locomotor behaviors and this is one of the main research methods to reveal the physical laws of animal locomotion and to inspire the design and realization of bionic robot. It has been found that the multi-camera layout patterns greatly affect the effect of motion capture. Due to the researches for animals of diverse species, determining the most appropriate layout patterns to achieve excellent capture performance remains an unresolved challenge. To improve the capturing accuracy, this investigation focuses on the method of multi-camera layout as a motion capture system for diverse animals with significant differences in outward appearance characteristics and locomotor behaviors. The demand boundaries of motion capture are determined according to the appearance types (shapes and space volume) and the behavior characteristics of the animals, resulting in the matching principle of the typical multi-camera layout patterns (arch, annular and half-annular) with diverse animals. The results of the calibration experiments show that the average standard deviation rate (ASDR) of multi-camera system in the half-annular layout patterns (0.52%) is apparently smaller than that of the other two patterns, while its intersecting volume is the largest among the three patterns. The ASDR at different depths of field in a half-annular layout demonstrate that the greater depth of field is conducive to improving the precision of the motion capture system. Laboratory experiments of the motion capture for small animals (geckos and spiders) employed the multi-camera system locked in the 3-D force measuring platform in a half-annular layout pattern indicate that the ASDR of them could reach less than 3.8% and their capturing deviation rate (ACDR) are respectively 3.43% and 1.74%. In this report, the correlations between the motion capture demand boundaries of small animals and the characteristics of the multi-camera layout patterns were determined to advance the motion capture experimental technology for all kinds of small animals, which can provide effective support for the understanding of animal locomotion.

1. Introduction

Locomotion is a kernel characteristic of animals and is often the basis or inspiration for the design of artificial motion systems, especially in the case of unusual or efficacious mobility. Bionic robots are an active area of research in the field of robots and a deeper understanding of the physical laws that govern motion in animals can provide useful insight with respect to the advancement of bionic robots. The key to understanding the excellent mobility of certain animals is to accurately quantify their locomotion [1]. Motion capture technology based on video sequence analysis could facilitate the acquisition of quantitative data on animal locomotor behaviors by recording, replaying, digital processing and analyzing the motion information [2,3], with the desired characteristics of small restrictions in the capturing process of the animal locomotion and low requirements of the environment. The correlation between the shape and motion characteristics of diverse animals, with the layout pattern of the motion capture system, is a vital factor in the acquisition of effective and accurate quantified data [4,5].
To adapt to numerous and complicated natural environments, animals possess a wide variety of body shapes and associated locomotion types, such as swimming in lakes and oceans (fish [6,7], sharks [8], etc.), walking or running on land (elephants [1,9], horses [10,11], geckos [12,13], etc.), flying in the sky (bird [14], moths [15], mosquitoes [16,17], etc.). To meet the requirements of a diverse range of animals’ studies, investigators have developed numerous motion capture systems to study the locomotion of distinctly different animals with regard to shapes and mobility. In a wide range of motion capture of large-scale objects (for instance, multiplayer dance, unmanned aerial vehicle formation flight, etc.) [18], the theory of target visibility maximization has been adopted for the optimal configuration of multi-camera systems (specifically, the visual analysis method is used to obtain the optimal number and location of the cameras) [19]. This approach is mainly used in large scenes such as museums and shopping malls. However, in the case of motion capture of small animals, in-depth studies on the optimization method of multi-camera layout has not been investigated. In the specific cases of flying objects whose range of motion is much greater than their size, Miller et al. successfully captured and mapped out the wing trajectory of mosquitoes using eight high-speed cameras with an annular layout [16]. Zheng et al. also realized motion capture of small-sized hawk moths by employing three sets of high-speed cameras with orthogonal spatial layout [15]. Nevertheless, multi-camera systems typically achieve motion capture by using a higher number of cameras or using a single orthogonal layout.
In addition, the measurement and analysis of behavioral observations and locomotor reaction forces have been widely used in the research and analysis of biological locomotion mechanics involving animals such as gecko [20,21,22], tree frog [23,24,25], spider [26], locust [27] and so forth, in particular, Webb, et al. was successful in obtaining the kinematic data for a rat’s hind legs using four cameras set in two sides of a movement channel and force data were acquired via an action-reaction force measuring platform [28]. However, the occlusion problem still exists in stereovision if two cameras are used for three-dimensional positioning of an object. Dai, et al. has developed a 3D reaction force testing platform within a very small rectangular area (about 300 mm × 100 mm), which has been successfully applied to measure the reaction force of various small animals [29]. Since behavioral observations and locomotor reaction force measurements are two key aspects in the study of animal locomotor behaviors, it is necessary to optimize the accuracy and efficiency of motion capture systems for effective integration with the small-scale force measurement platform. Therefore, it is important to the development of multi-camera layout methods that are matched to the different demand boundaries of small animals.
Additional restrictions and constraints are placed on motion capture of biological objects, since diverse small animals have notable differences in their shapes and method of locomotion. Moreover, it is often necessary to obtain synchronous locomotor behavior of the animal’s reaction force in a limited area. Therefore, we investigated the configuration and layout methods of multi-camera in motion capture system in-depth. The animals’ locomotion demand boundaries including body shapes and locomotor behavior characteristics were analyzed and summarized. In addition, the capture characteristics of typical multi-camera layout patterns of one unit module were analyzed using theoretical calculation. The exact motion area which can be captured was then determined according to the relationship between the camera layout patterns and the depth range. Thus, the correlation between the layout patterns of a multi-camera system and the animal locomotion’s capture demand boundaries was established and the matching mechanism between the patterns and diverse small animals is revealed. In this report, it was determined that the maximized intersecting volume of the visible field of the multi-camera and the reasonable modulation of the depth of field could effectively improve the accuracy of a motion capture system. Finally, typical small animals (gecko and spider) were selected for motion capture experiments. The method of multi-camera layout proposed in this report has flexible scalability. This method is valid for diverse small animals and it is potentially an effective basis for promoting the development of motion capture systems in other domains (such as the capture of objects with different shapes and sizes in the industrial field).

2. The Parameters of Multi-Camera System

The cuboid is one of the most basic geometric shapes. Small animals of different shapes can be abstractly simplified by the smallest outer enveloping cuboids (length L, width W, height H) which can completely capture the spatial distribution of the animal (Figure 1), using different ratios of width to length and height to length. It can be determined from this visual principle that when the object is simultaneously photographed by at least two cameras, the position information of the object in the defined space can be obtained. The motion information of the object can be acquired when a sufficient number of position images are recorded in a time sequence [30].
The number of cameras used is one of the key variable parameters in a motion capture system. Different camera numbers are associated with different requirements for accuracy and precision of the motion capture. From the perspective of stereoscopic vision, the ordinary monocular camera generally needs to move to provide depth information and the binocular vision system are often obscured. A trinocular camera system, or a multi-camera system consisting of more than three cameras, can effectively address the occlusion problem based on the third camera and the parallax of a single pixel can be calculated many times to make the error small, since the parallax of a sub-pixel is more reliable [31]. From the point of view of a biological motion capture system, when N is 1, the researchers generally use 2D image matching with mirror imaging to obtain three-dimensional positions, although the accuracy is not high and the visual acuity is poor. In the case when N is 2, a binocular stereoscopic vision system is generally used to obtain 2D images on two planes. When N is 3, motion capture is very difficult because it is necessary to ensure that the captured objects are in the intersecting area of a certain common field of view, arbitrarily formed by at least two cameras. In addition, according to a previous study, three high-speed cameras within an orthogonal position were used to successfully capture the flight of mosquitoes in a glass room with a total volume of 0.37 m3 [15]. The layout of these three cameras is orthogonal and the layout pattern of the trinocular camera system is relatively simplified and does not have good scalability. When N is 4, any three of the cameras can be selected to undertake the task of capturing and the other camera is used as the supplementary unit. The capturing task cameras capture the object and the supplementary camera records the multi-dimensional video. As such, this system is able to not only improve the success rate but also increase the interest by visual images. In summary, four cameras can form a self-complementary basic unit module. When N is greater than 4, this can be regarded as the expansion of the four-camera unit module. In a multi-camera motion capture system, the union of the intersecting volume of any two cameras can be used as a sampling area for motion capture.
With the aim of motion capture for different types of small animals, the success rate and the accuracy rate are prime considerations. Secondly, the load capacity of the hardware system and the economy of the equipment system should also be taken into consideration. As such, we chose the minimum number of cameras to capture the motion of small animals, which can greatly improve the efficiency and cost performance of the motion capture system. Therefore, the theoretical calculations and experimental verification were carried out on a unit module consisting of four cameras. Depending on the spatial positions of the cameras, the layout could be summarized into the following three categories: (a) the arch layout, (b) the annular layout and (c) the half-annular layout (Figure 2). The multi-camera layout has a lot of parameters (Table 1) and the parameter definition domain corresponding to different layout forms can be obtained by calculation (see Appendix A for the details of the calculation process).

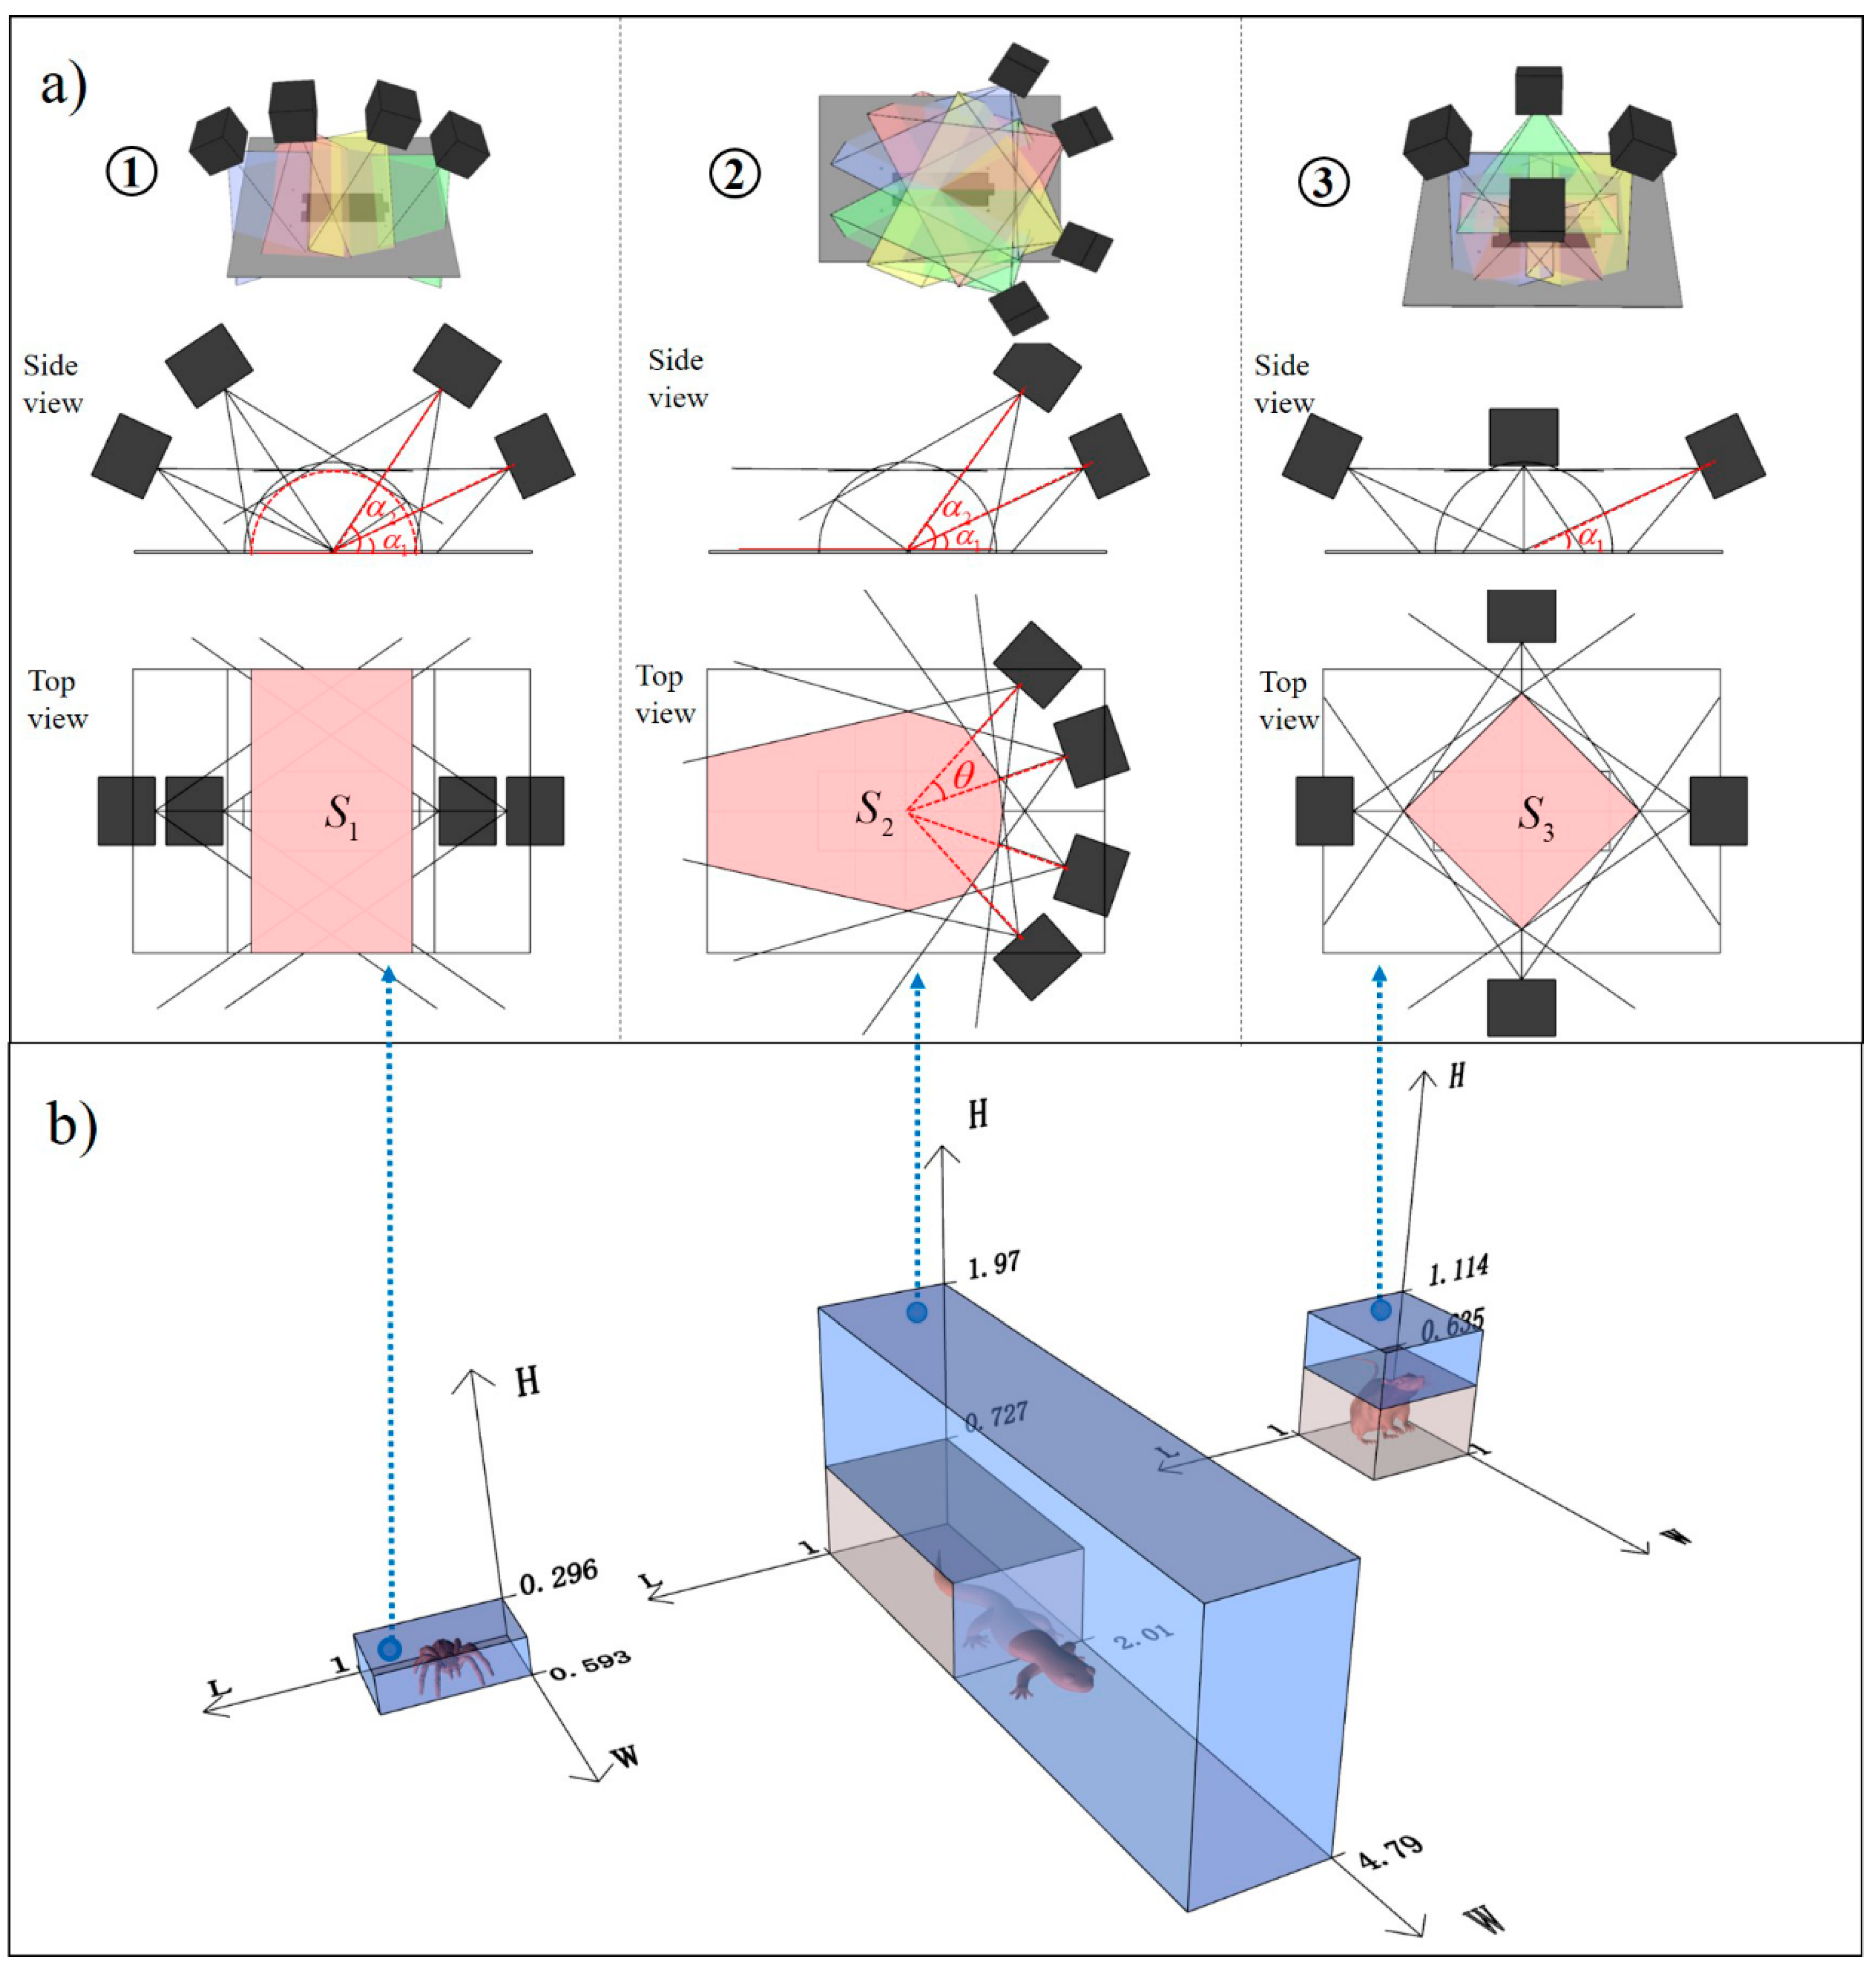
2.1. The Intersecting Volume of Multi-Camera System

A successful motion capture begins when the capture object is photographed by at least 2 cameras which require the object to be within the range of the visual field of this two cameras [16]. The intersection area of the multi-camera is cut by the moving plane of the target. The size of the working field of the camera is determined according to the size of the working distance (WD), focal length (f) and the chip size (v and h). By calculating the intersecting volume in the typical layout (shown support file S4 for details), it is known that: (1) the variation range of the intersection volume of multiple cameras in the half-annular layout is the largest and the intersection volume of the arch layout is always larger than the annular layout; (2) the intersection volume of the three kinds of layout increases with the increase of the focal length (f) and the intersecting volume of the annular and half-annular layout decreases with the increase of the pitch angle (α). (3) When the angle between the cameras (θ) is closer to 23.33 degrees, the greater the intersecting volume of the half-annular layout; (4) when θ is greater than 40 degrees, the intersecting volume of the half-annular layout is smaller than the other two types within the definition domain of f and α. Therefore, if we want to get a larger intersecting volume than the rest of the two forms using the half-annular layout, we need to make sure that θ is within the range of 25 to 40 degrees and α is within 21.33 to 90 degrees.
Small animals of different shapes can be abstracted as the smallest outer enveloping cuboids (length—l, width—w, height—h) that can completely capture the animals’ body and the intersecting volume of a multi-camera is an irregular space volume which can abstract the inner enveloping cuboids (length—L, width—W, height—H), that can be completely covered by the intersection volume. It is an important precondition to ensure that the object is successfully captured because the overall shape of the captured object is within the inner enveloping cuboid of the multi-camera. Therefore, the study of the coordination between the two is the first step to determine an appropriate camera layout for different kinds of small animal motion capture. Based on theoretical calculations (Support File S4 for details), the dimensions and proportions of the inner enveloping cuboids of different multi-camera layouts were obtained. The ratio of the width to the length and the ratio of the height to the length of the smallest outer enveloping cuboids of the small animal (see Figure 1) are used to determine the inner enveloping cuboids of the intersecting volume of the multi-camera, in the selection of an appropriate camera layout.
It is known that the inner enveloping cuboids of the arch layout tend to be flat, the ratio of the width to the length (W/L) was about 0.593 and the ratio of the height to the length (H/L) was about 0.296 (Figure 3). When the length (L) of the intersection volume of the three layouts were the same, the volume of the inner enveloping cuboids of the half-annular layout was obviously larger than that of the other two forms. Moreover, the ratio of the width to length was about 4.79 and the ratio of the height to length was about 1.97. The inner enveloping cuboids of the annular layout was near the cube, the ratio of the width to length was about 1 and the ratio of the height to length was about 1.114.
According to theoretical calculations, when the length and width of the smallest outer enveloping cuboids of the captured object were satisfied: (1) the ratio of the width to length <0.6 and the ratio of the height to length <0.3 and the arch layout should be adopted, (2) the ratio of the width to length <4.8 and the ratio of the height to length <2 and the half-annular layout should be adopted; (3) the ratio of the width to length <1 and the ratio of the height to length <1.1 and the annular layout should be adopted. According to these relationships, the arched layout is suitable for a low height cuboid shape, such as a spider. However, the half-annular layout is suitable for a flat long or thin cuboid shape, such as flat long creeping house lizards, long snakes; and the annular layout was suitable for a square-shaped cuboid shape, such as rats (Figure 3b).

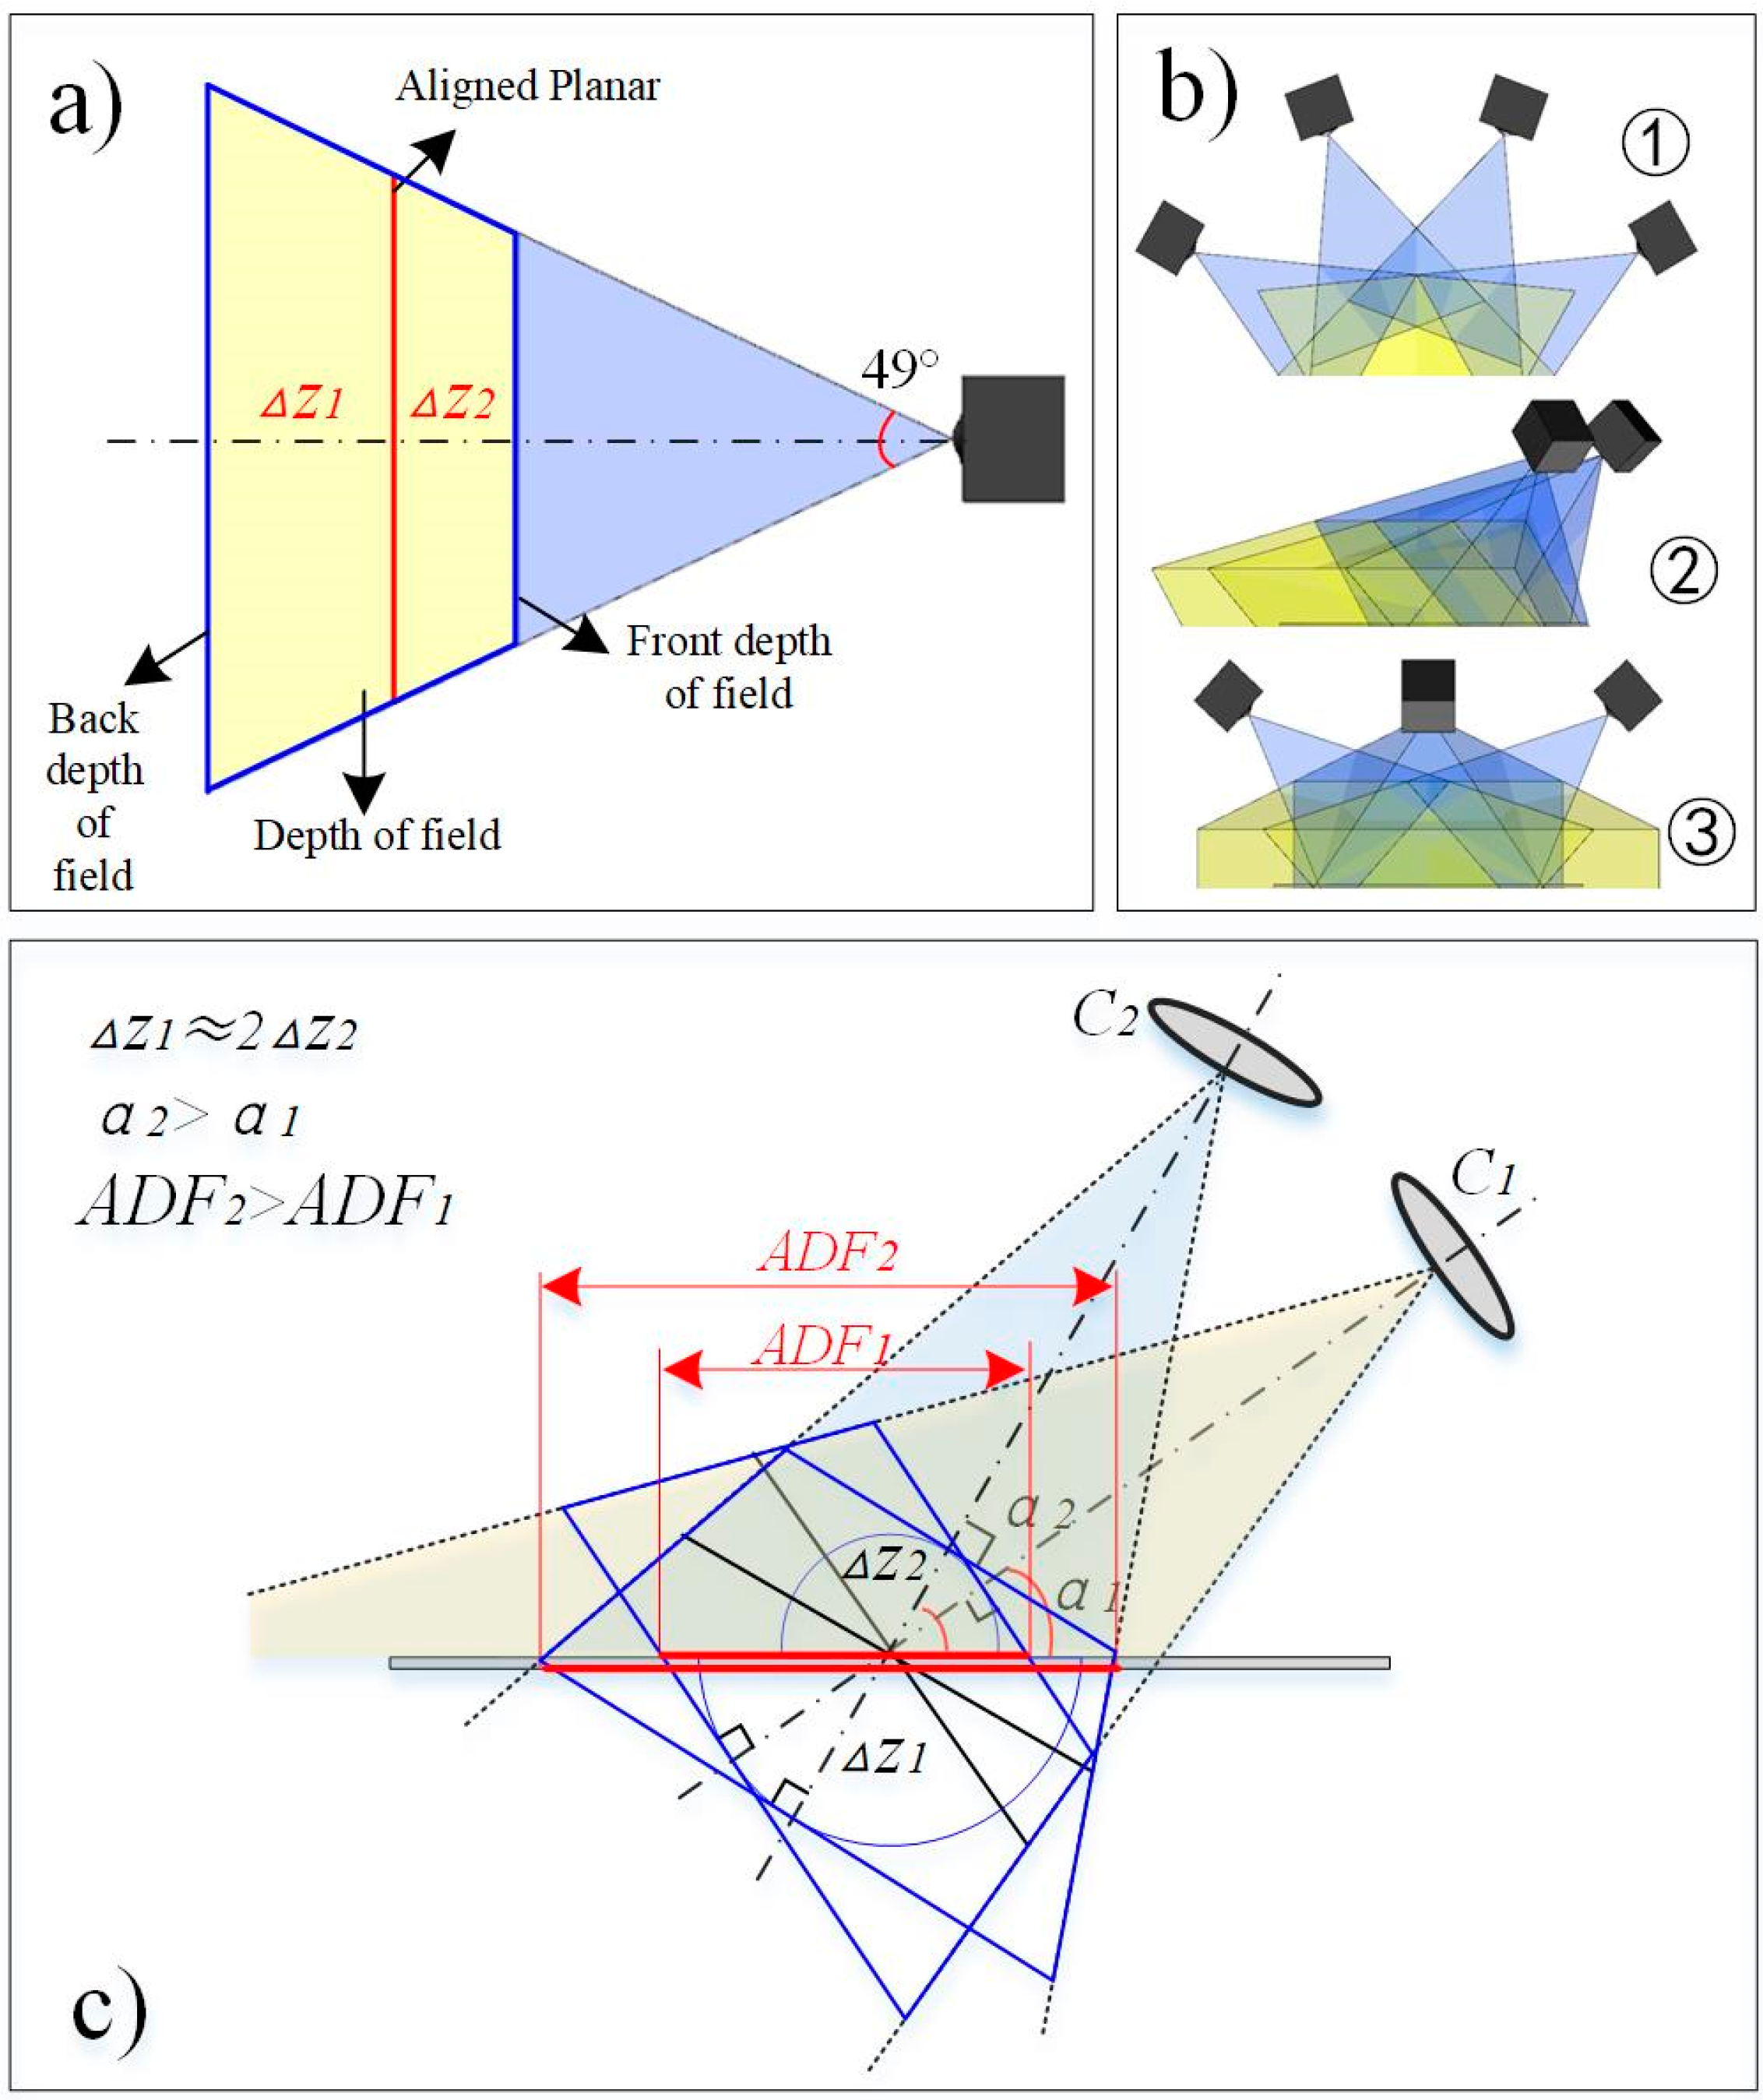
2.2. The Depth of Field of Multi-Camera

The accuracy of motion capture also depends on the depth of field of the multi-camera system. According to the principle of geometric optics, the farthest plane that can be clearly imaged on the image plane is called the far scene, while the nearest plane is called the near scene. The sum of the two is called the depth of field and the plane of the image is called the scene plane. It should be noted that, the conjugate plane is also called the alignment plane [32] (Figure 4a, the detailed calculation of the depth of field is detailed in the Supporting Documents S5). The front depth of field is less than the back depth of field, that is, after precise focusing, the scenery within a short distance in front of the focus can be clearly imaged but the scenery within a long distance at the back of the focus is clear. Image processing is a key step of the motion capture technique based on a video sequence. The position of the markers was identified from the picture to acquire corresponding 3-D coordinates at each moment. It is well-known that the clearer the image, the more recognizable the markers.
The depth of field has a significant correlation with the layout of the camera. Seen in Figure 4a, the depth of field (the yellow area), which is covered by the visual angle of the camera, has intersecting volume characteristics that are the same as a multi-camera system. As shown in Figure 4b, the half-annular layout has a significantly larger depth of field than the other layouts. It can be directly determined that the corresponding depth of field is determined by WD and f (Figure 4c). The length (L) represents the depth of field area segmented by the motion plane and increases as α increases, while the field of view volume decreases as α increases when the camera’s field of view is divided by the work plane. Therefore, the relationship between the depth of field and the field of view volume should be balanced according to the different motion characteristics of the small animal of interest. When the sampling motion area of the small animal is a long channel, a relatively small angle of pitch is sufficient. The selection of the motion area of different small animals is restrictive and it needs to be considered comprehensively based on the locomotion characteristics, the camera’s depth of field and the pitch angle of the camera.
We proposed the layout method of multi-camera based on a rectangular planar 3D force measuring platform (length 300 mm). Since the pitch angle imposed limitations on the depth of field, it was necessary to select an appropriate pitch angle. According to the size constraint of the target motion plane, the working distance could be adjustable within the range from 350 mm to 700 mm. When WD was 350 mm, the depth of field was about 120 mm. To ensure that L was greater than 300 mm, α should be greater than or equal to 66.5°. In addition, when WD was greater than or equal to 540 mm, the depth of field could be more than 300 mm and then, α could optionally be any value within the defined domain.

3. Experimental Verification

3.1. Materials and Methods

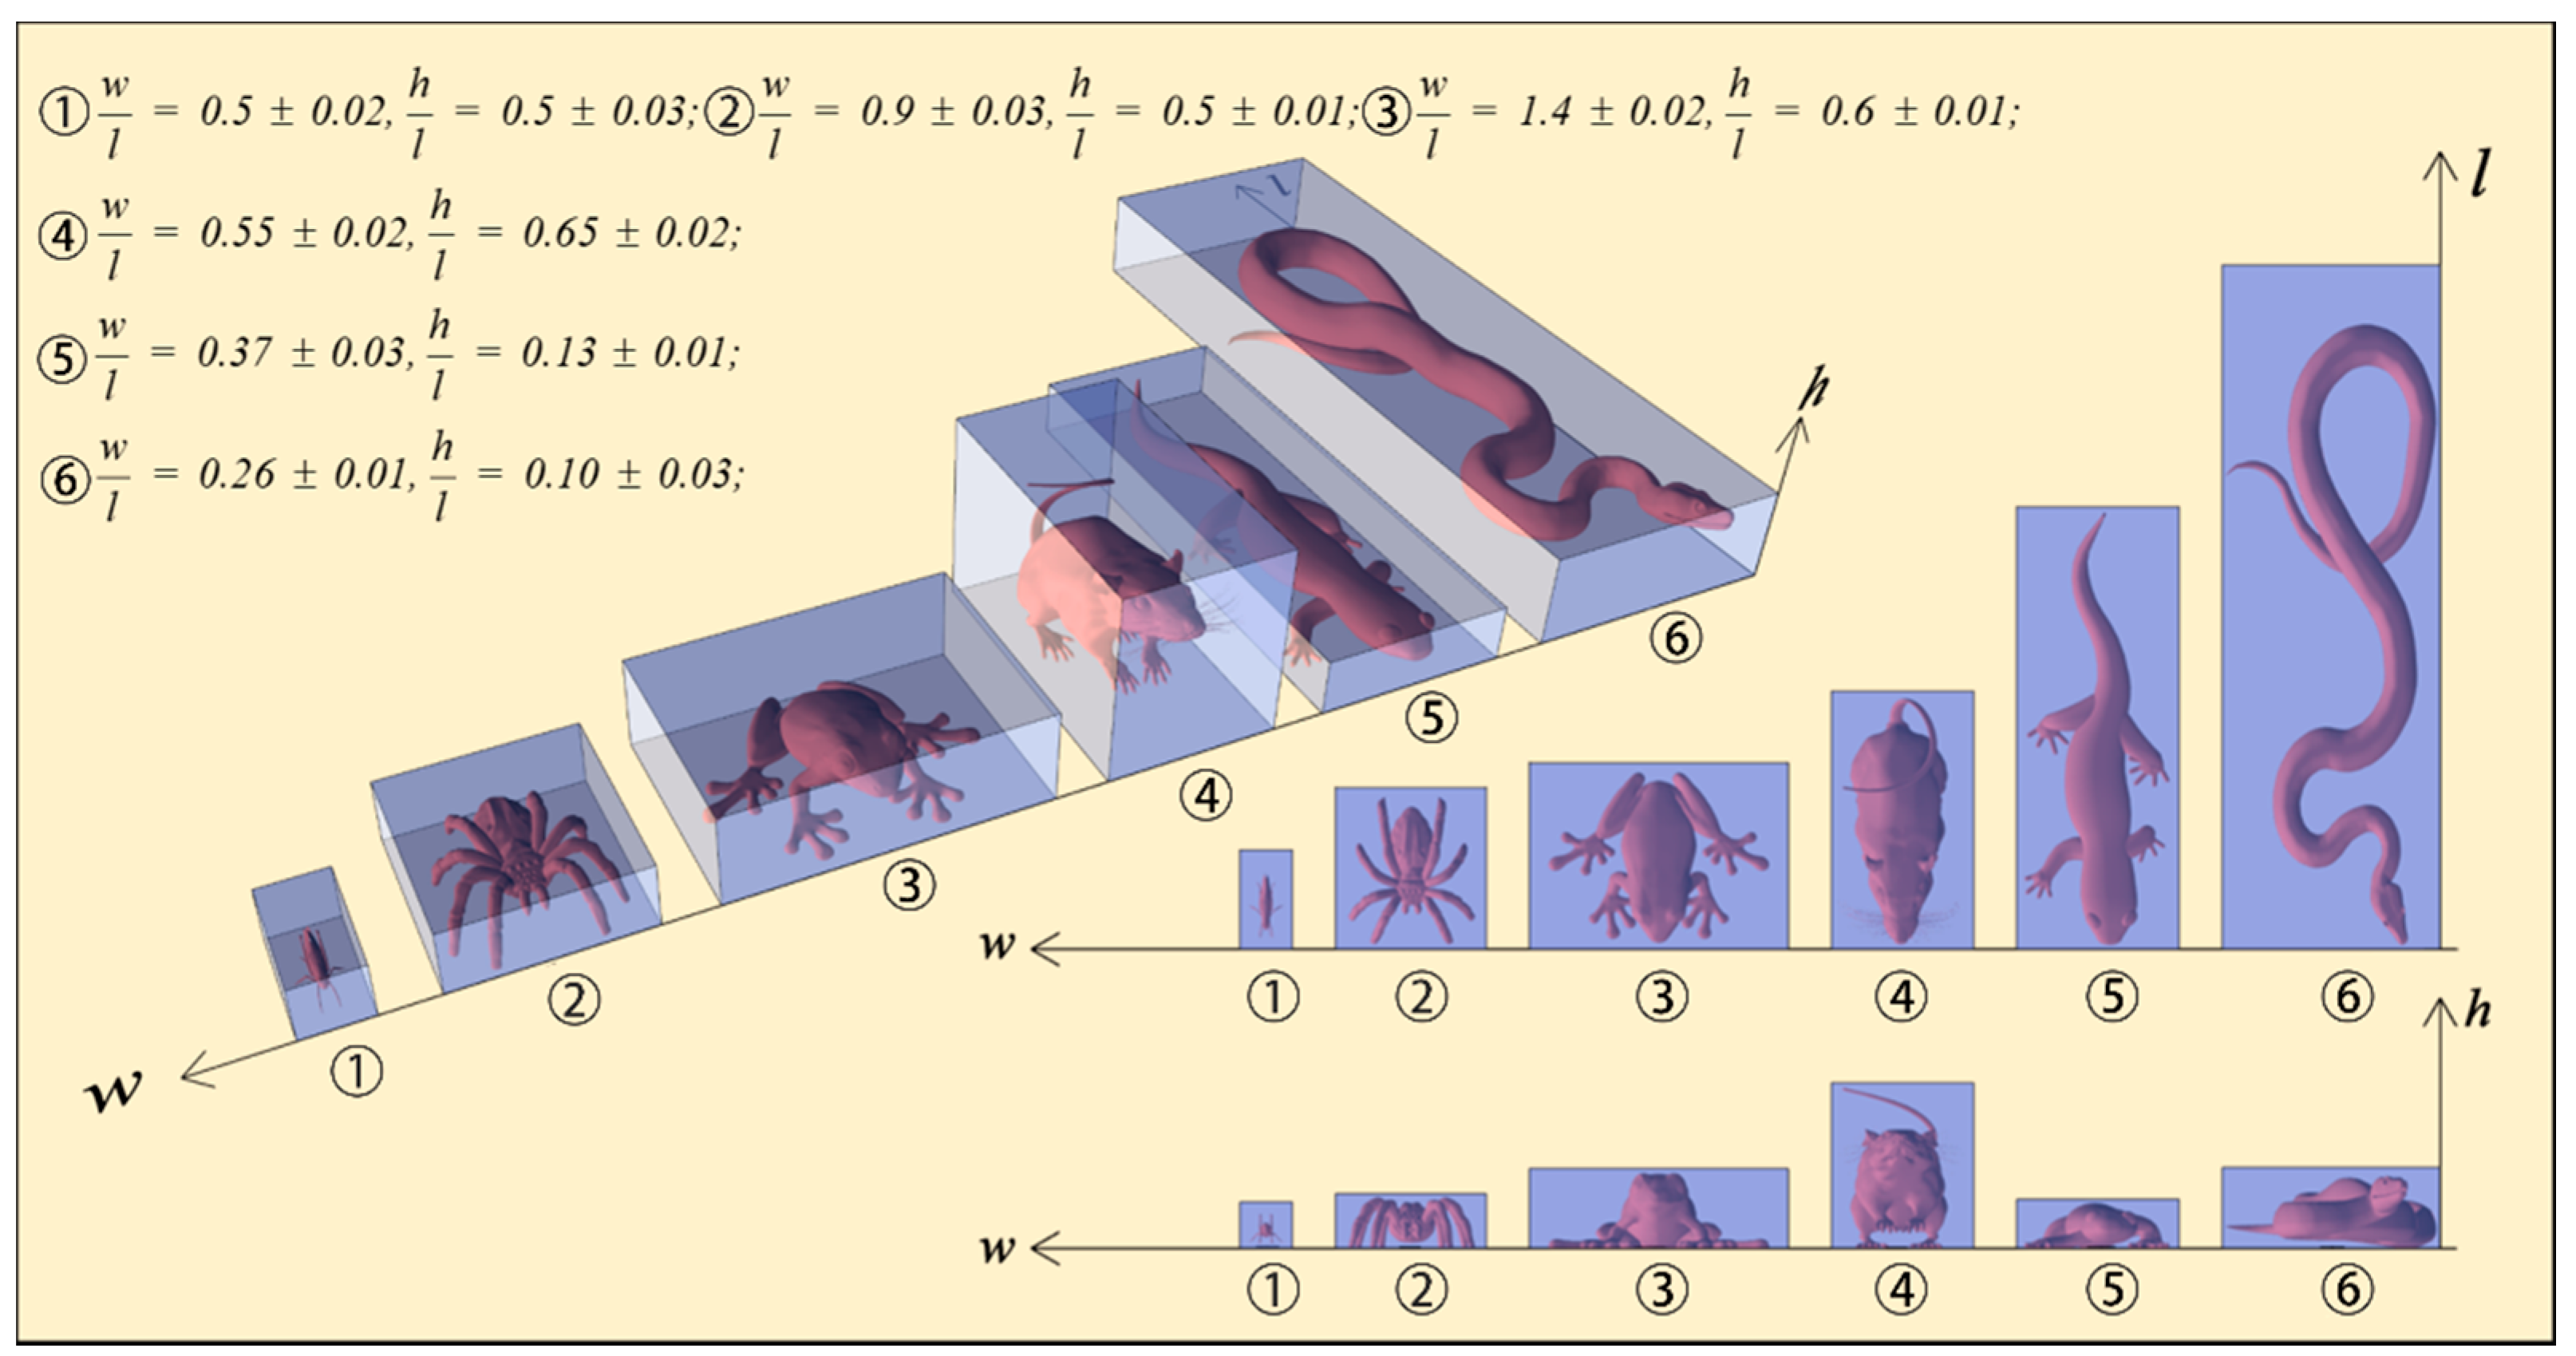
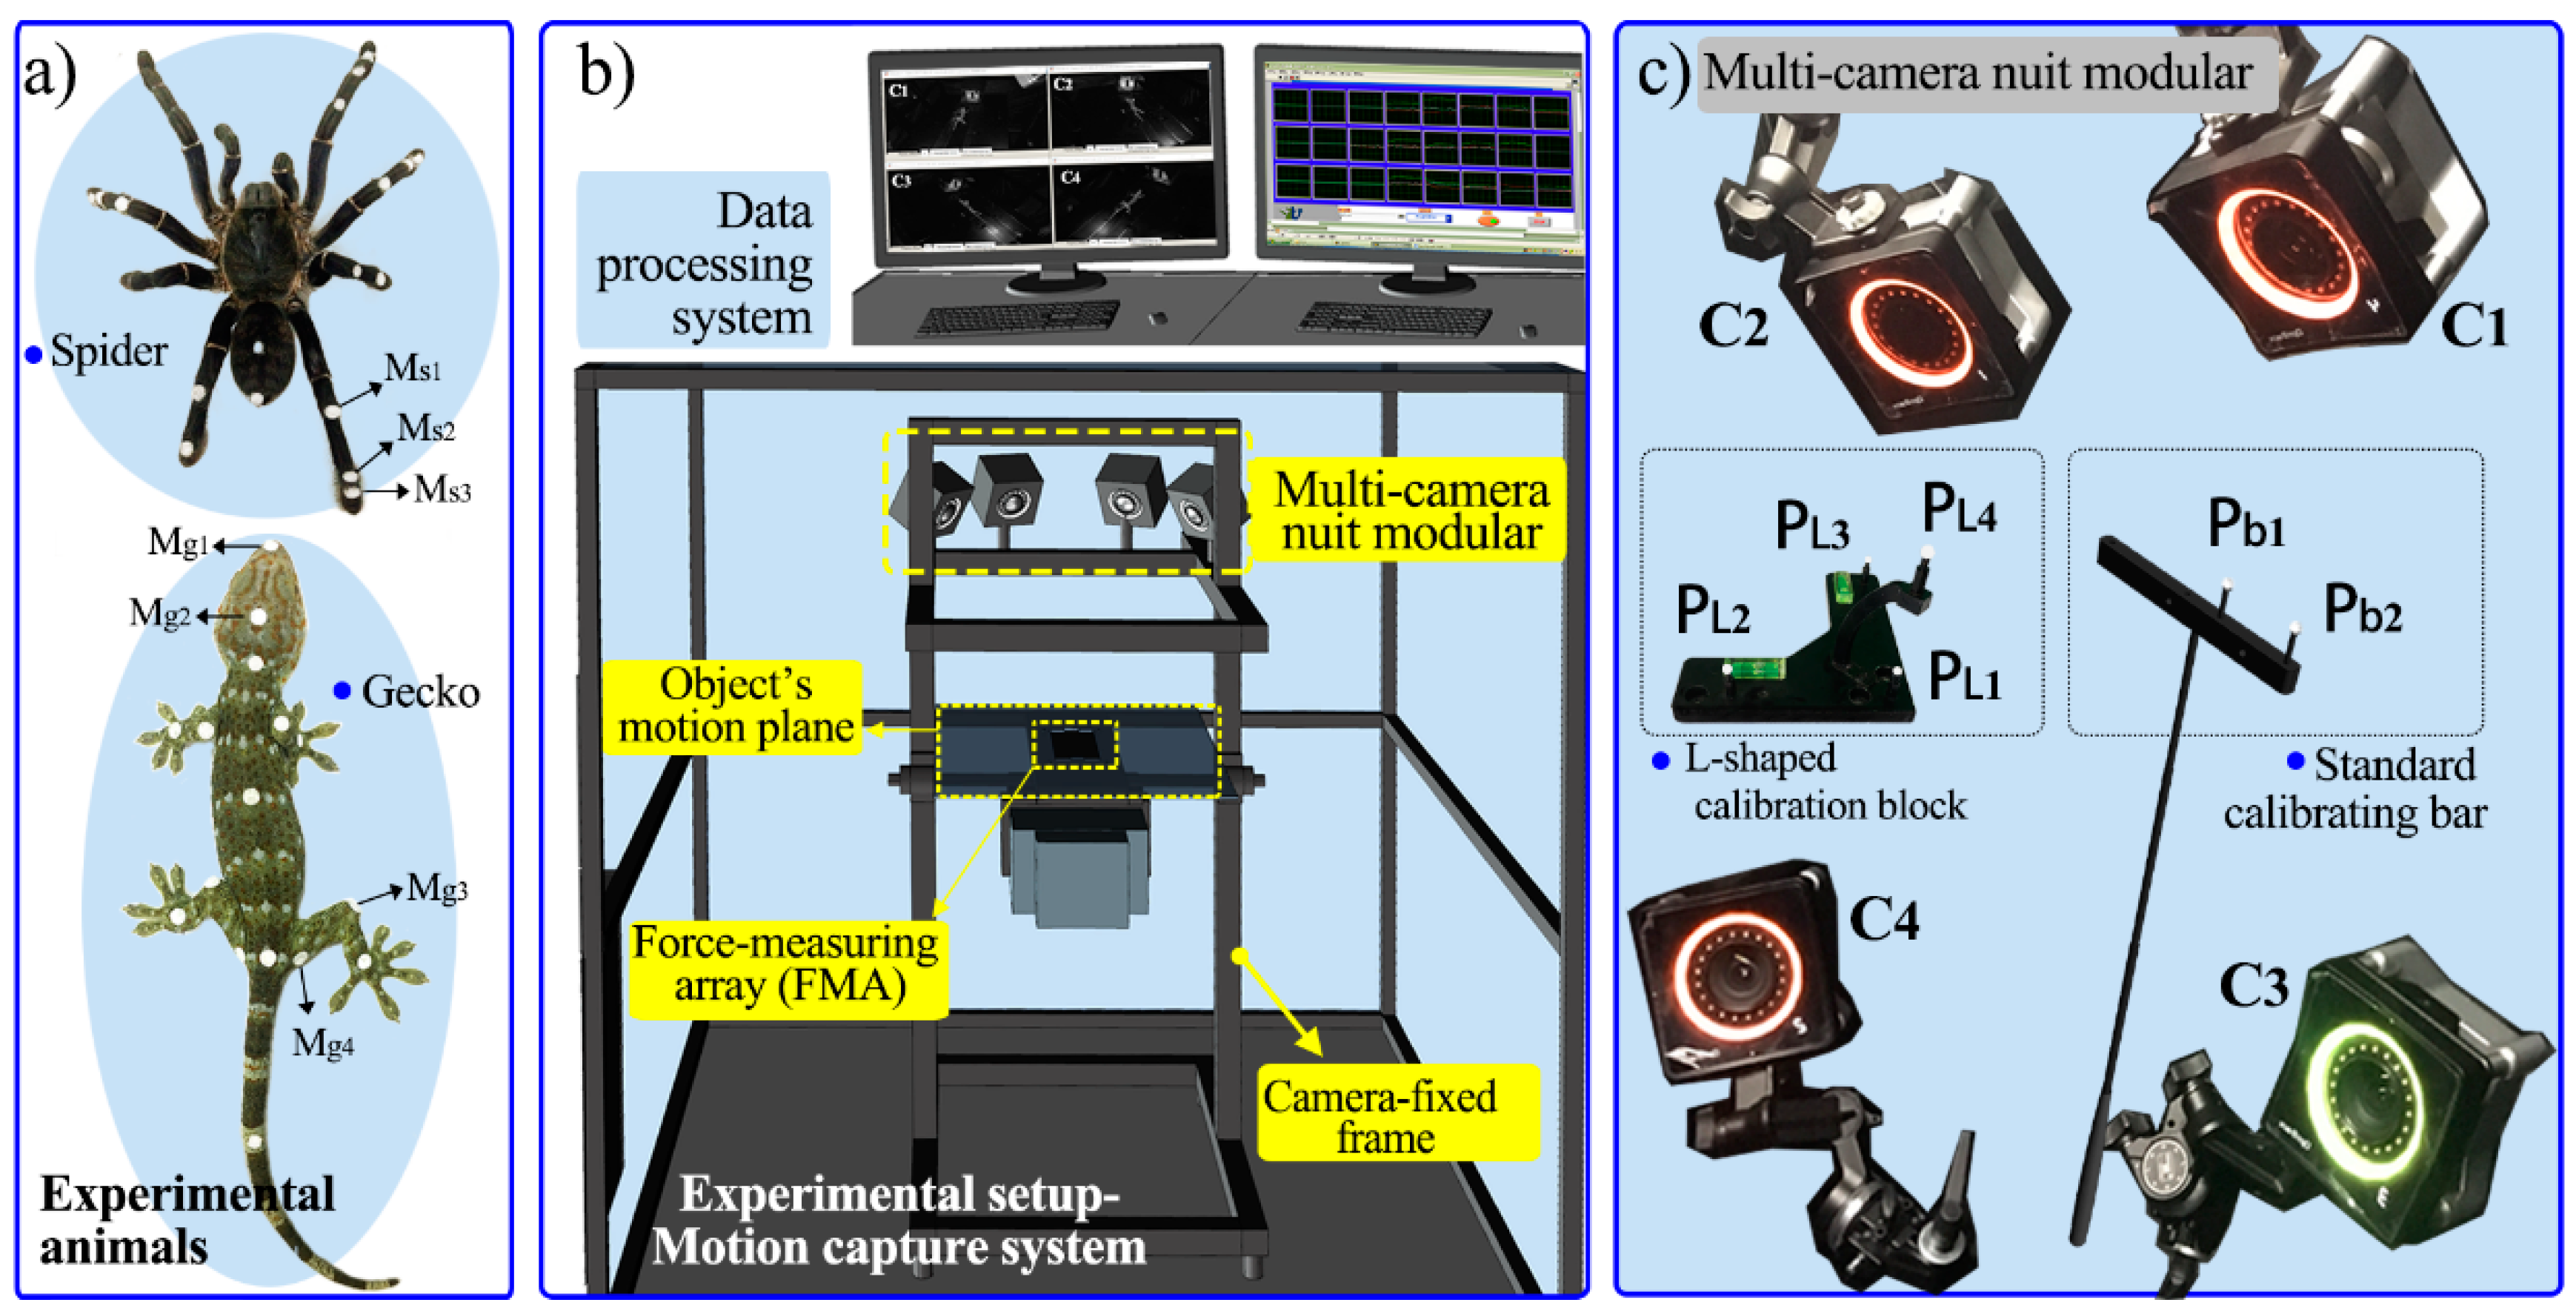
3.1.1. Experimental Animals

One to two years old adult geckos taken from Guangxi Autonomous Region, China (G. gecko, Linnaeus) (53.3 ± 1.1 g mass, mean ± s.d., snout-vent length: 146.6 ± 3.8 mm, N = 3) and adult spiders from Hainan tarantula (Haplopelma hainanum, Ornithoctoninae) (11 ± 1.8 g mass, body length: 90 ± 10 mm, N = 3) were used to do the experimental verification. These animals were kept in a special room which simulates the natural environment of gecko habitat, maintaining an indoor temperature of 25 ± 2 °C and humidity of 70~85%.
Before the experiments, the reflective sticker with uniform shape (circular shape), size (diameter of 5 mm) and material was used as markers, which were pasted on the back of the gecko and spider’s body and the joints of the legs (Figure 5a). Since the size, the motion range and the exercise frequency of the gecko body was pretty different that of the legs, we selected two sets of sample markers for statistical analysis and one set of the markers were on the head (snout-Mg1 and head vertex-Mg2), another set of markers were on the leg (hip joint-Mg3 and wrist joint-Mg4) [33]. The distances between the two markers on the head and on the leg were Lh and Ll respectively. Spiders are a typical kind of exoskeleton animals with multiple joints on the feet and three markers on the right rear leg (Ms1, Ms2, Ms3) on the tibia, the metatarsus and the tips of the legs [26] were selected to measure two kinds of lengths (LT and LPT).

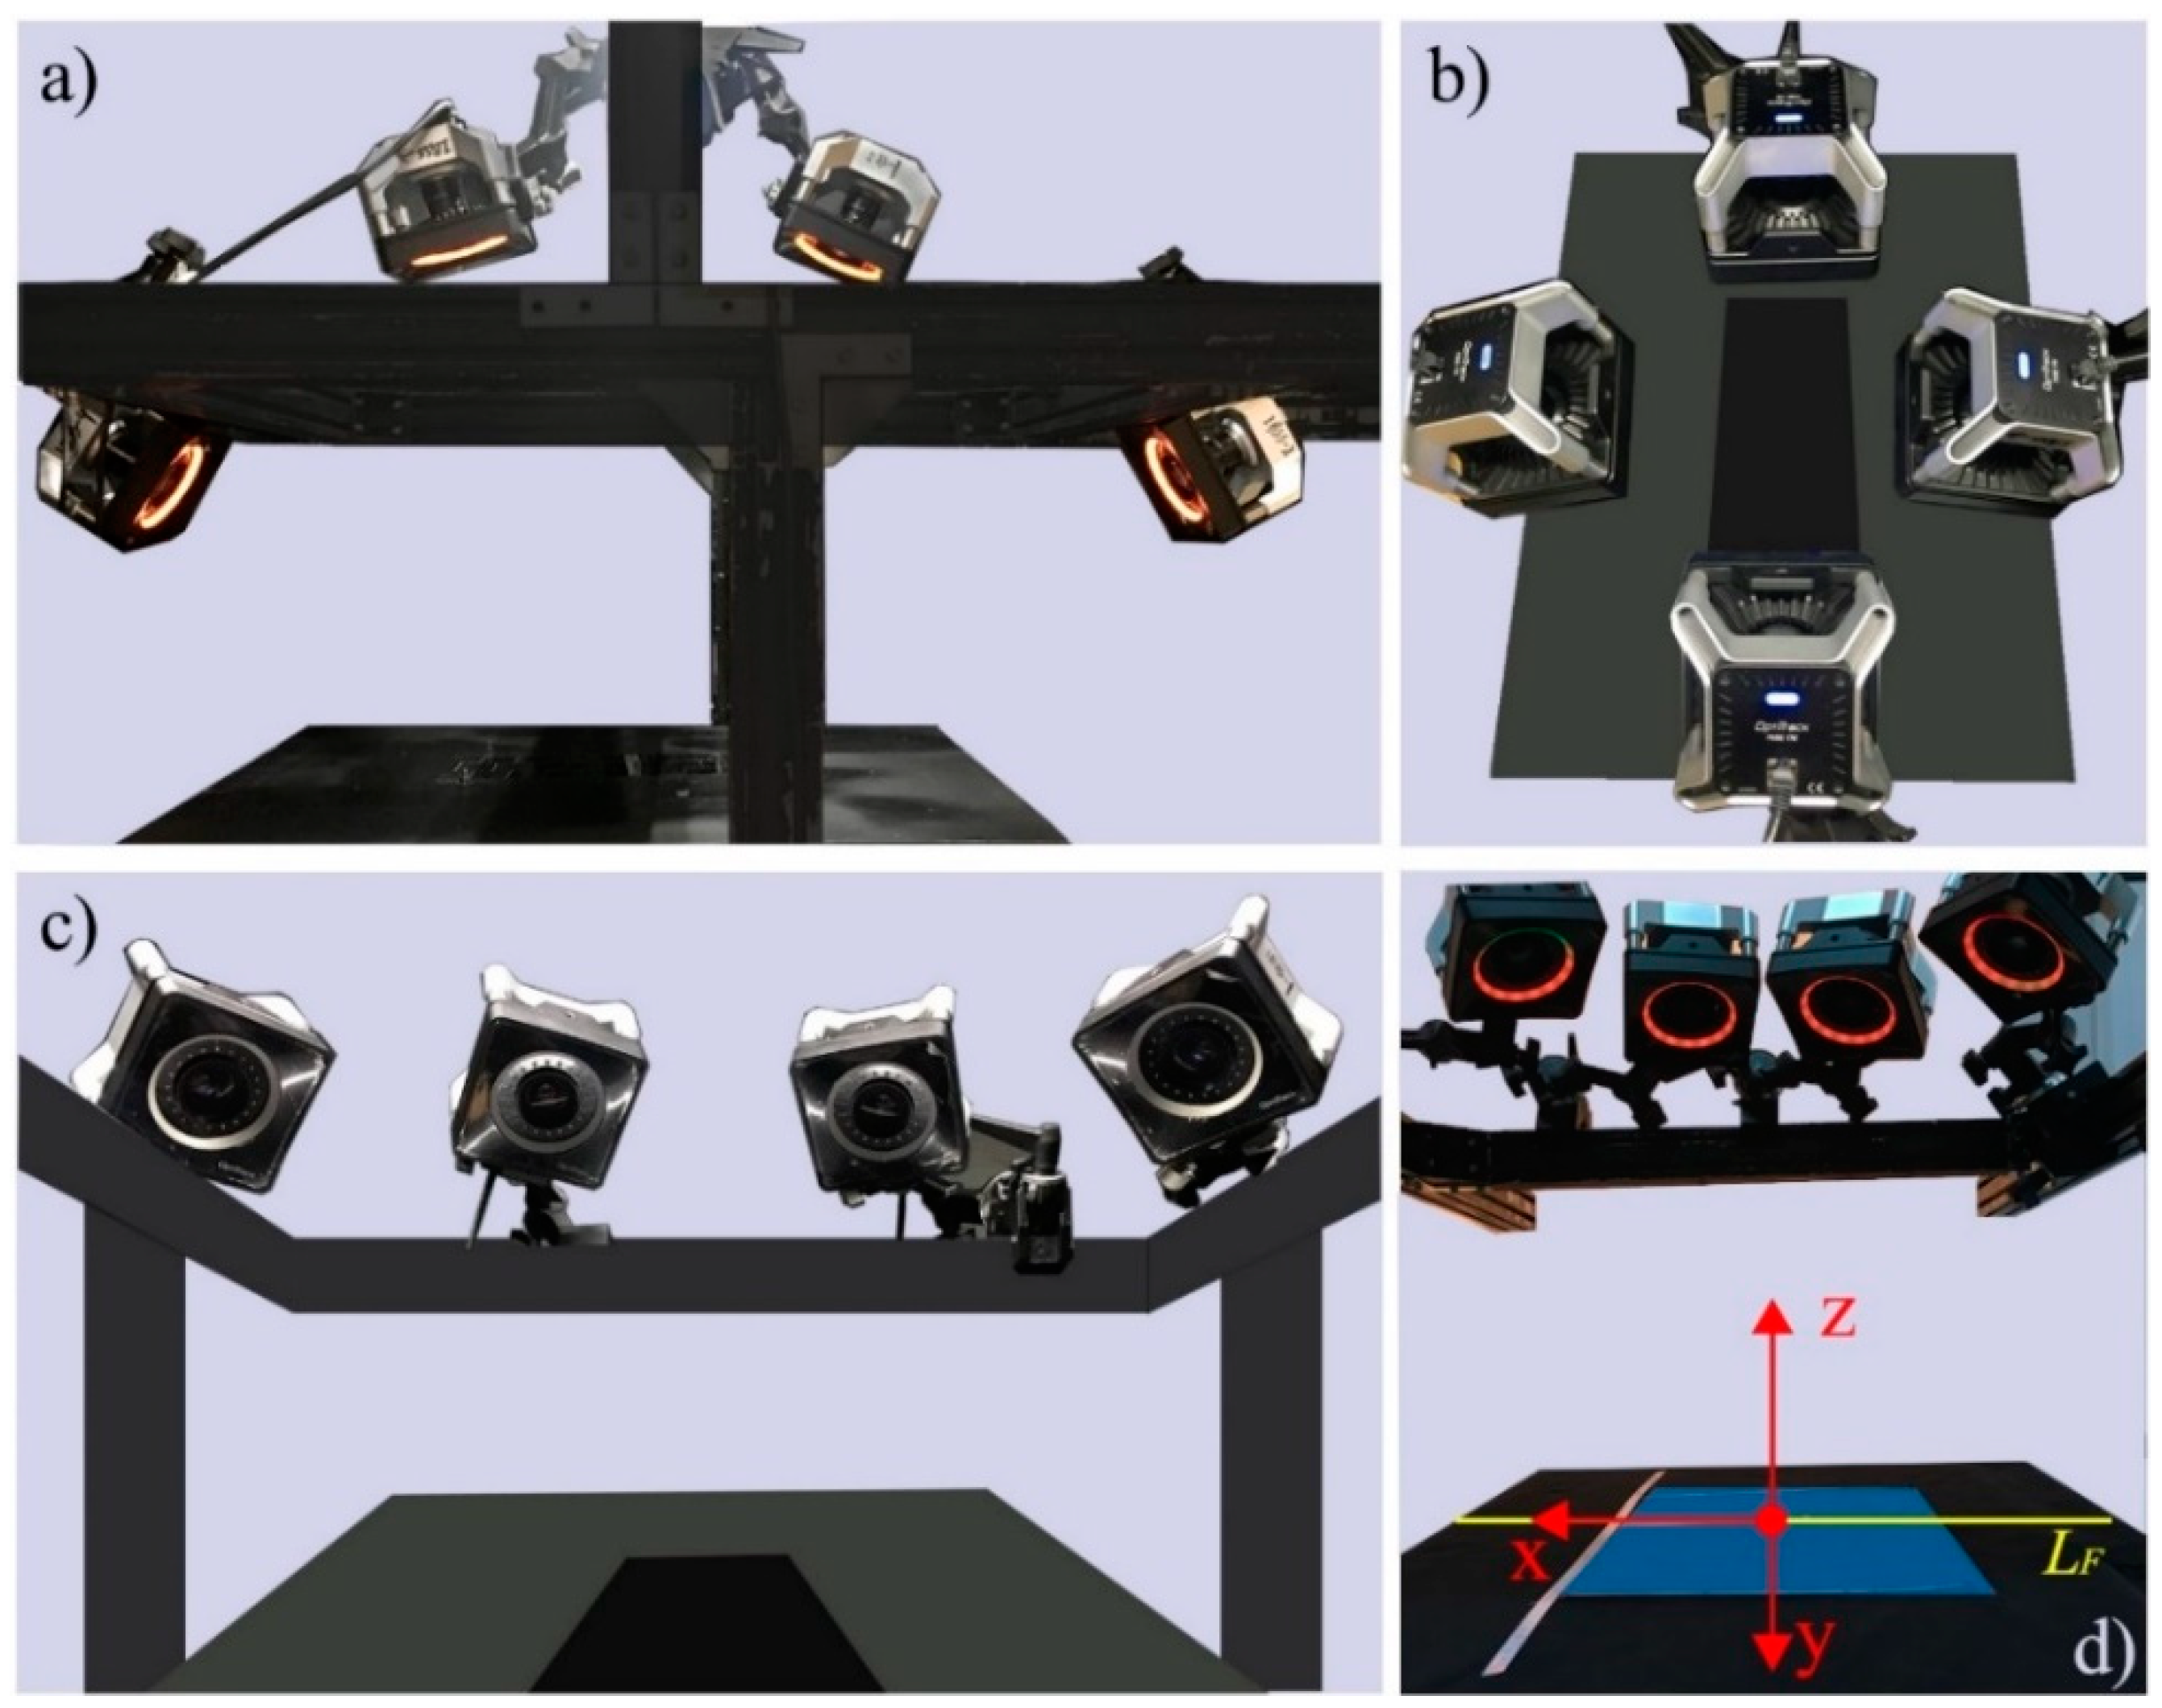
3.1.2. Experimental Equipment and Procedure

A motion capture system has been utilized including cameras (four cameras, specific performance parameters shown in Supporting Documents S1), objects’ motion plane, data processing system, signal transmission equipment and a camera-fixed frame (Figure 5b,c). The objects’ motion plane was 700 × 550 mm, having a three-dimensional force measuring platform (300 × 100 mm) in the middle position. The size of camera-fixed frame was about 820 × 900 × 400 mm. A standard calibration bar (A black link device with two markers Pb1, Pb2 fixed) and an L-shaped calibration block (Installed with 4 vertical markers PL1, PL2, PL3, PL4) were used as the calibration tools (Figure 5c). The calibration method combined 1-D and 2-D with high accuracy and flexibility was used to calibrate the multi-camera system [34,35].

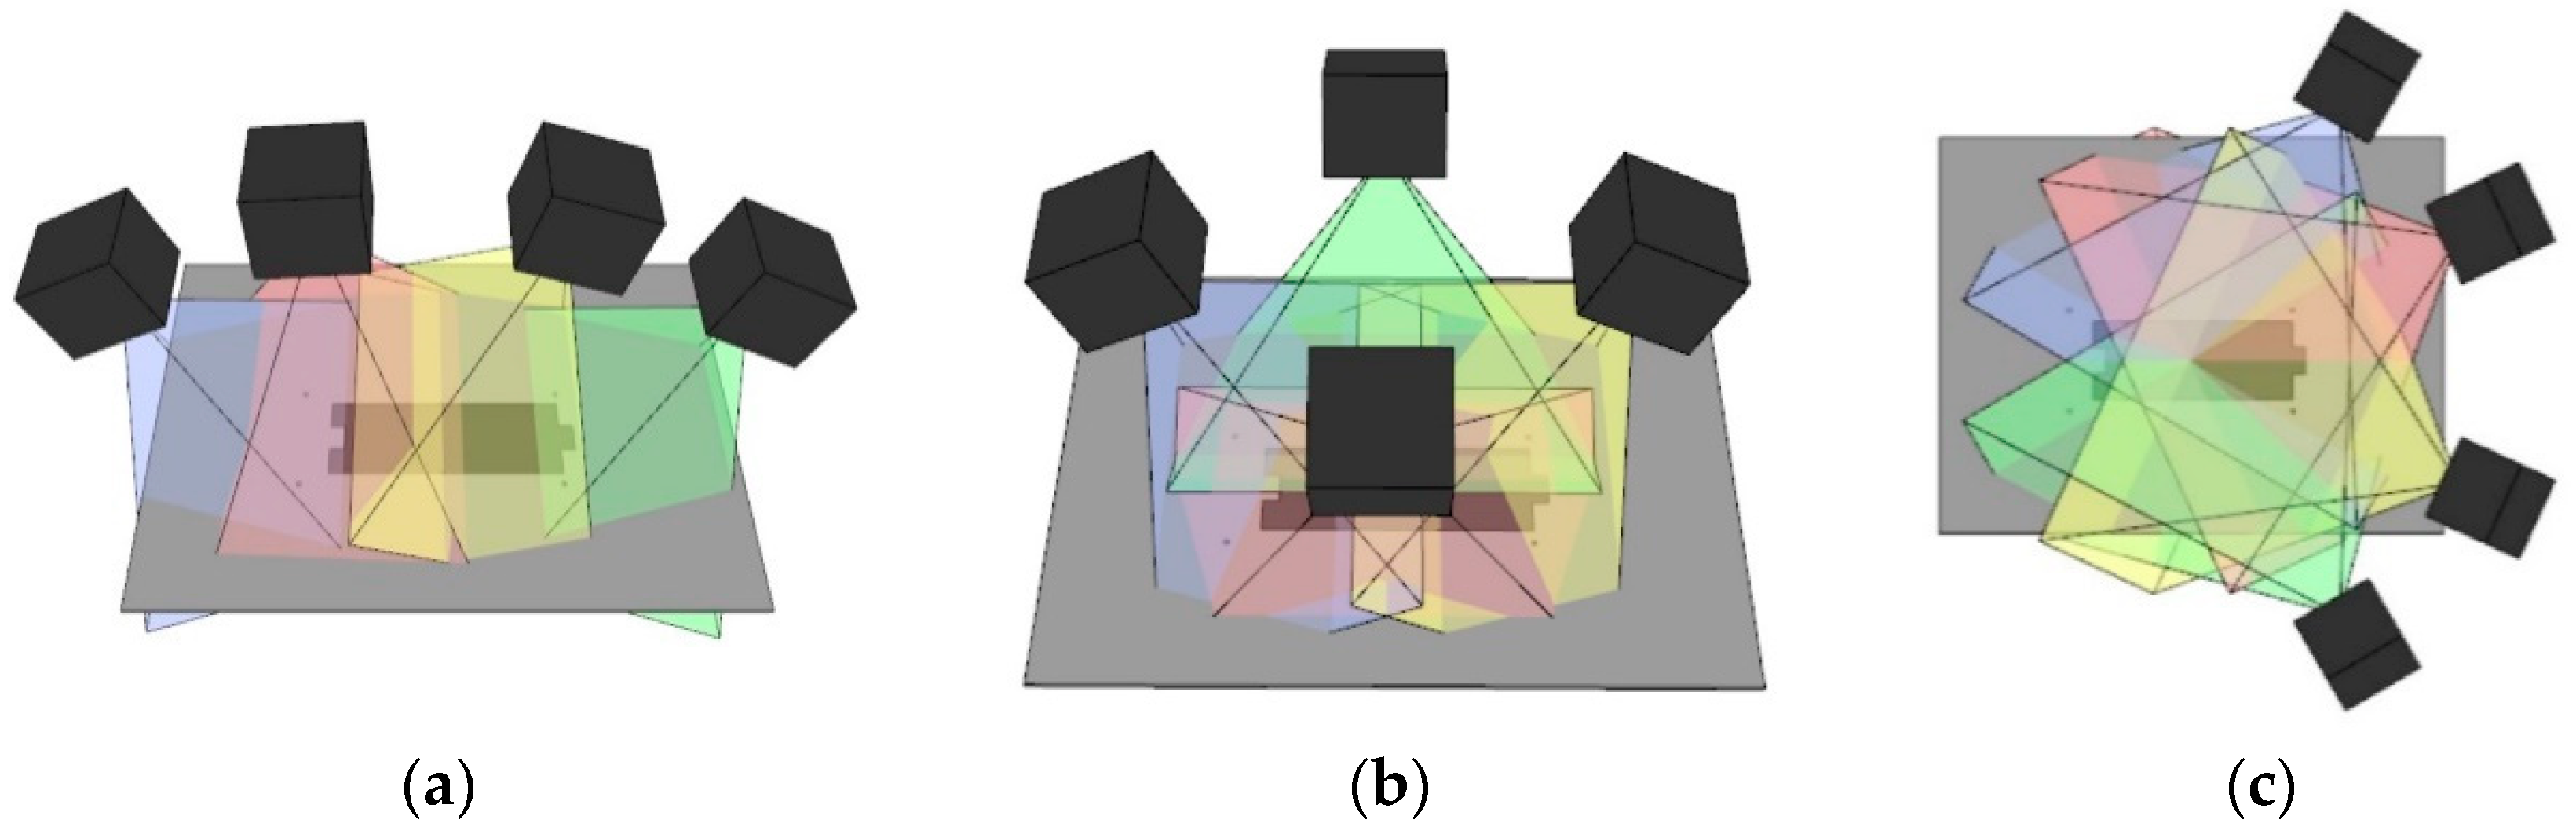
3.1.3. The Calibration Experiments of the Multi-Camera Layout Patterns

A. Calibration experiments for different layout patterns
Four cameras were deployed in three forms: arched, annular and half-annular (The layout parameters are detailed in Supporting Documents S1—Table S2, camera’s working distance error does not exceed 30 mm, the angle error was smaller than 5°. Figure 6a–c). The standard calibration bars were shaken separately for each of the three layouts. The markers moved near the surface of the FMA; the motion area of each experiment was guaranteed to cover the entire range of the platform and the movement posture, speed, acceleration and movement amplitude were basically the same.
B. Calibration experiments for different layout patterns and depth of field
The three layout patterns of arched, annular and half-annular (The layout parameters are detailed in Supporting Documents S1—Table S3, camera’s working distance error does not exceed 30 mm, the angle error was smaller than 5°) were respectively used to carry out the tests under three different sampling areas. The experimental procedure was the same as that of Experiment A. Each experiment must ensure that the range of motion of the calibration bar is strictly controlled within the length of sampling area L defined in Table S3.
C. Experiments for testing the effect of the depth of field (in the half-annular layout)
In the half-annular layout, the pitch angles α were set to 30°, 45° and 60° (Figure 6d) respectively and the camera angle θ was set to 30° (in line with its definition). The length (300 mm) of the force-measuring array (FMA) in the middle of the motion platform was divided by the ratio of 1:2, which produced the dividing line called the alignment line (LF) (Figure 6d). The position of each camera was fixed so that its working distance (WD) was 390 mm (specific calculation shown in Support Material S5) and the center point of the dividing line was set to be the camera focus. The coordinate axis was defined on the objects’ motion plane (the alignment line (LF) was the X-axis, the Z-axis was perpendicular to the object plane and intersecting to the midpoint of the alignment line (LF) and the Y-axis could be obtained by the corkscrew rule, as shown in Figure 6d). Then, the motion capture of the calibration bar was carried out the same as the experiment A and the motion range of the calibration bar did not exceed 300 mm during the motion capture.

3.1.4. Experiments of Animals’ Motion Capture

According to the theoretical calculations and preliminary experimental verification of different multi-camera layout patterns, we selected the suitable pattern for the appearance and locomotion characteristics of the gecko and spider. Because the FMA was used as the acquisition area, it is necessary to ensure that the focus of all cameras was on one-third position of the platform near to the cameras themselves and the field of view of the multi-camera system covered the entire area of the FMA. A transparent channel with the size of 600 × 140 × 90 mm was built by some acrylic plate to limit the animals’ locomotion. The cameras’ frame rate was set to 200 FPS; and the brightness and exposure degree of the cameras’ LED light were adjusted to ensure that the brightness of the markers in the video is enough to be identified and there were no reflective areas and noise in the acquisition area. During the motion capture process, a black box was placed at one end of the channel to allow animals to enter from the other side of the channel.

3.1.5. Data Filtering

There were 144 sets of calibration experiments for 12 kinds of system configuration performed in this work and 6 sets of sampling experiments were selected for each configuration for statistical analysis, accounting for 50% of the total, in line with statistical analysis. In addition, 60 test trials of small animal were completed and 8 trials of geckos and 8 trials of spiders were selected for statistical analysis. Only those recordings satisfied the conditions below were going to be selected for further analyses: (1) the moving velocity of the calibration bar is relatively uniform and the range of motion covers the assigned sampling area; (2) the small animal moves along the line in the channel and the animal moved with near-steady velocity which must not exceed or below than 15% of the average velocity of the animal.
The image sequence analysis program (DLTdv6) was used to obtain the three-dimensional space coordinates of the sample markers. Windolf reported that accuracy and precision should be determined for an individual laboratory installation [36]. Therefore, we also calculated the precision of the system, which is the average standard deviation rate (ASDR) of the calibration bar and it is the percentage of the standard deviation as the average value. The ASDR can indicate the stability and repeatability of the calibration result. For the data obtained from animal experiments, the precision and accuracy of the sample points were calculated. The accuracy is the average capture deviation rate (ACDR), which is the percentage of the mean deviation (ACD, the average value of the marker point distance error) to the true value. Accuracy describes the deviation between the measured value and the true value and can indicate the systematic deviation. The calculation equations can be found in Supporting Document S6.

3.1.6. Statistics

The SPSS software (SPSS 22.0, Inc., Chicago, IL, USA) was used to analyze statistically measured data from all individuals. Comparisons were made among data for different camera layout patterns using the co-variance analyses (ANCOVA) with a p value of 5% [20]. For the ANCOVA analysis, the dependent variables were the accuracy (ACDR) and the precision (ASDR), the multi-camera layout patterns, the depths of field, the species of animals and the body segments of captured animals were used as covariate variables for statistical analysis. Differences were considered statistically significant when p < 0.05.

3.2. Experimental Results

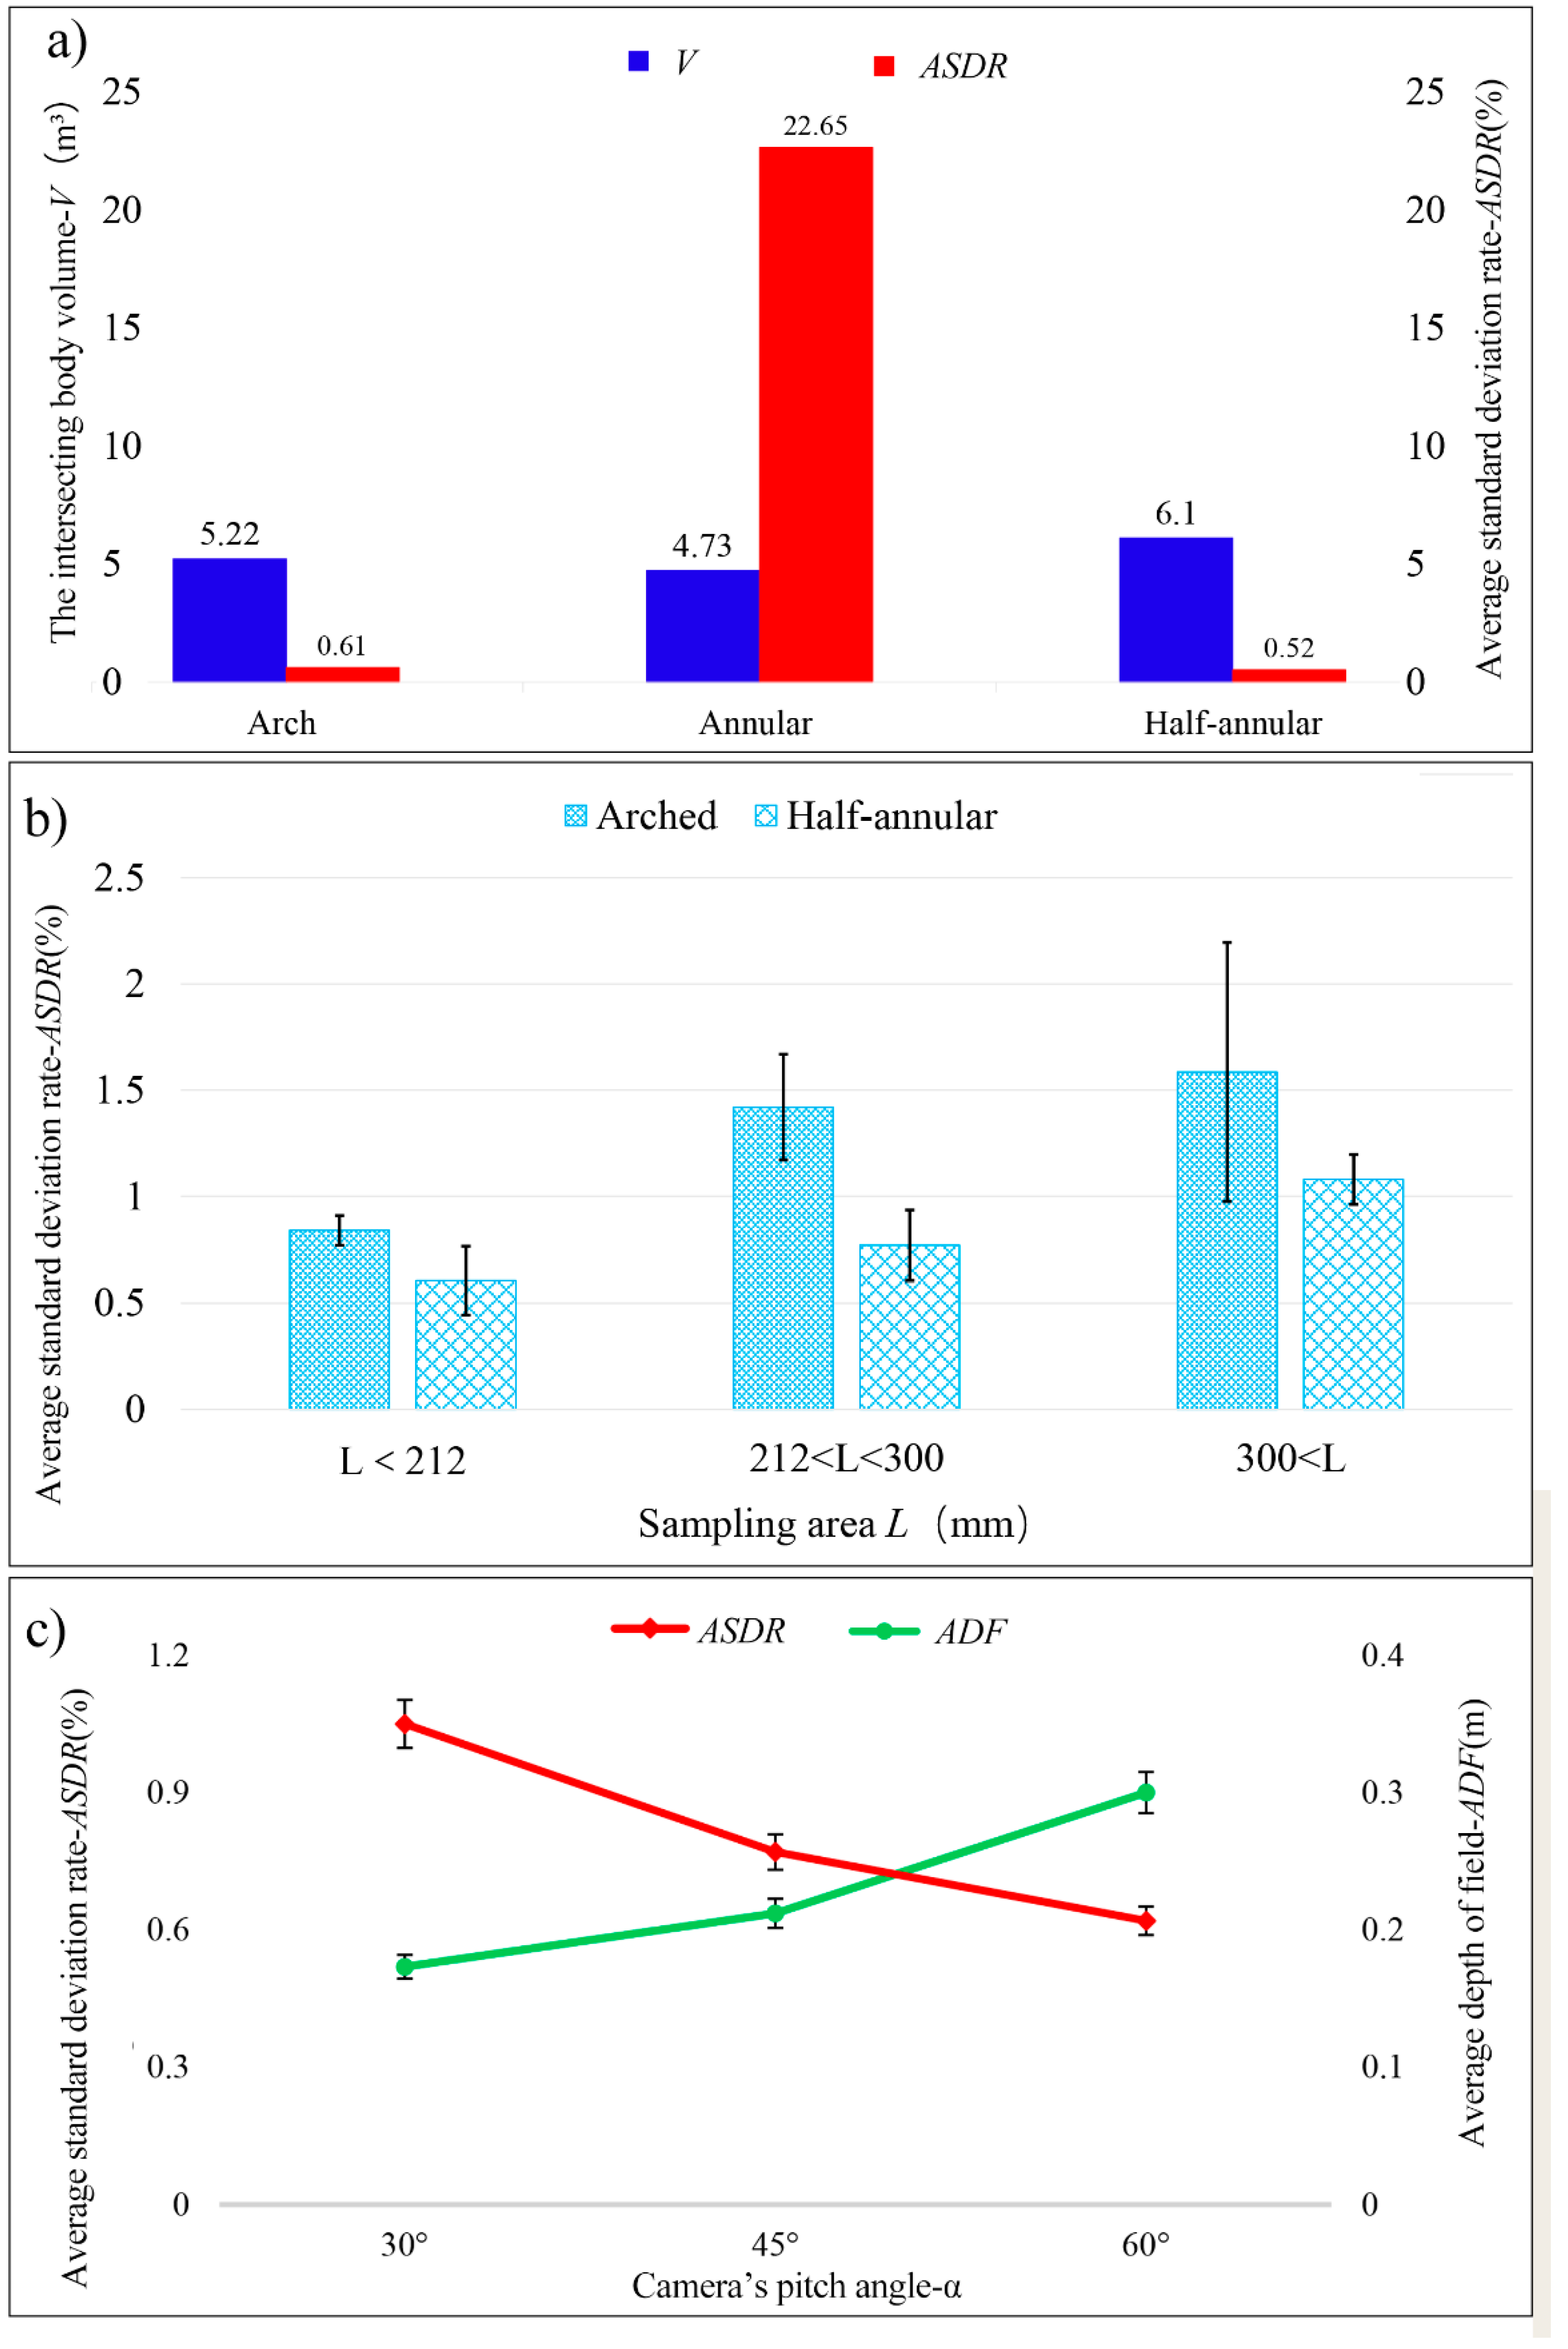
3.2.1. Intersection Volume and Standard Deviation Rate for Different Layout Patterns

Theoretical calculations (Supporting Documents S4 for details) of the field of view intersection volume for the three layouts of the multi-camera system yielded the largest intersecting volume for a half-annular layout, approximately 1.56 times the arch layout and 2.66 times the annular layout (Figure 7a, Table S2); while the half-annular layout had the smallest standard deviation rate, the arched layout and the half-annular layout had a smaller standard deviation rate than the annular layout by approximately 22%; and the standard deviation rate of the arch layout was 1.2 times a half-annular layout.

3.2.2. The Precision for Different Layout Patterns under Different Depth of Field

(1) Calibration test of different sampling areas under different layouts
In the arched, annual and half-annular layout patterns, the values of ASDR raised with the increase of the length of sampling area (L). The ASDR of the annular layout was significantly larger than that of the half-annular layout (Table S3 for details). When the sampling area was guaranteed to be within the depth of field (L < ADF), the arched layout and the half-annular layout achieved the highest precision. In addition, the precision of the half-annular layout was higher than that of the arched layout in the same sampling area (Figure 7b).
(2) Calibration test of different pitch angles in a semi-annular layout
When the pitch angles α were 30°, 45° and 60° respectively, the working distance WD and the camera angle θ were set to the same. The actual depth range DF of the system were 173.2 mm, 212.1 mm and 300 mm, respectively (Table S4 for details). The corresponding ASDR of calibration bar were 1.05%, 0.77% and 0.62%, respectively, which decreased with the increase of depth of field. The ASDR was the highest when α was 30° and it was 26.7% larger than that at 45° and it was even about 41% larger than that at 60° (Figure 7c and Table S4). As shown in the Figure 7, the intersecting volume at the pitch angles of 30° and 45° in the half-annular layout was the same, about 0.063 m3, which was 42.8% larger than the intersecting volume (0.036 m3) at 60°; however, when the pitch angle was 30°, the actual depth of field was 324 mm, while it was 377 mm when the pitch angle was 45° the same as 60°. The sampling area length L in all three cases was greater than the length (300 mm) of the FMA in order to ensure that the motion range was within the depth of field range; the result showed that the ASDR was about 0.82% at the α of 60°, which was 25% higher than that at 30° and about 35% higher than that at 45° and it was found that the ASDR at α of 30° was 13.3% higher than that at 45°.

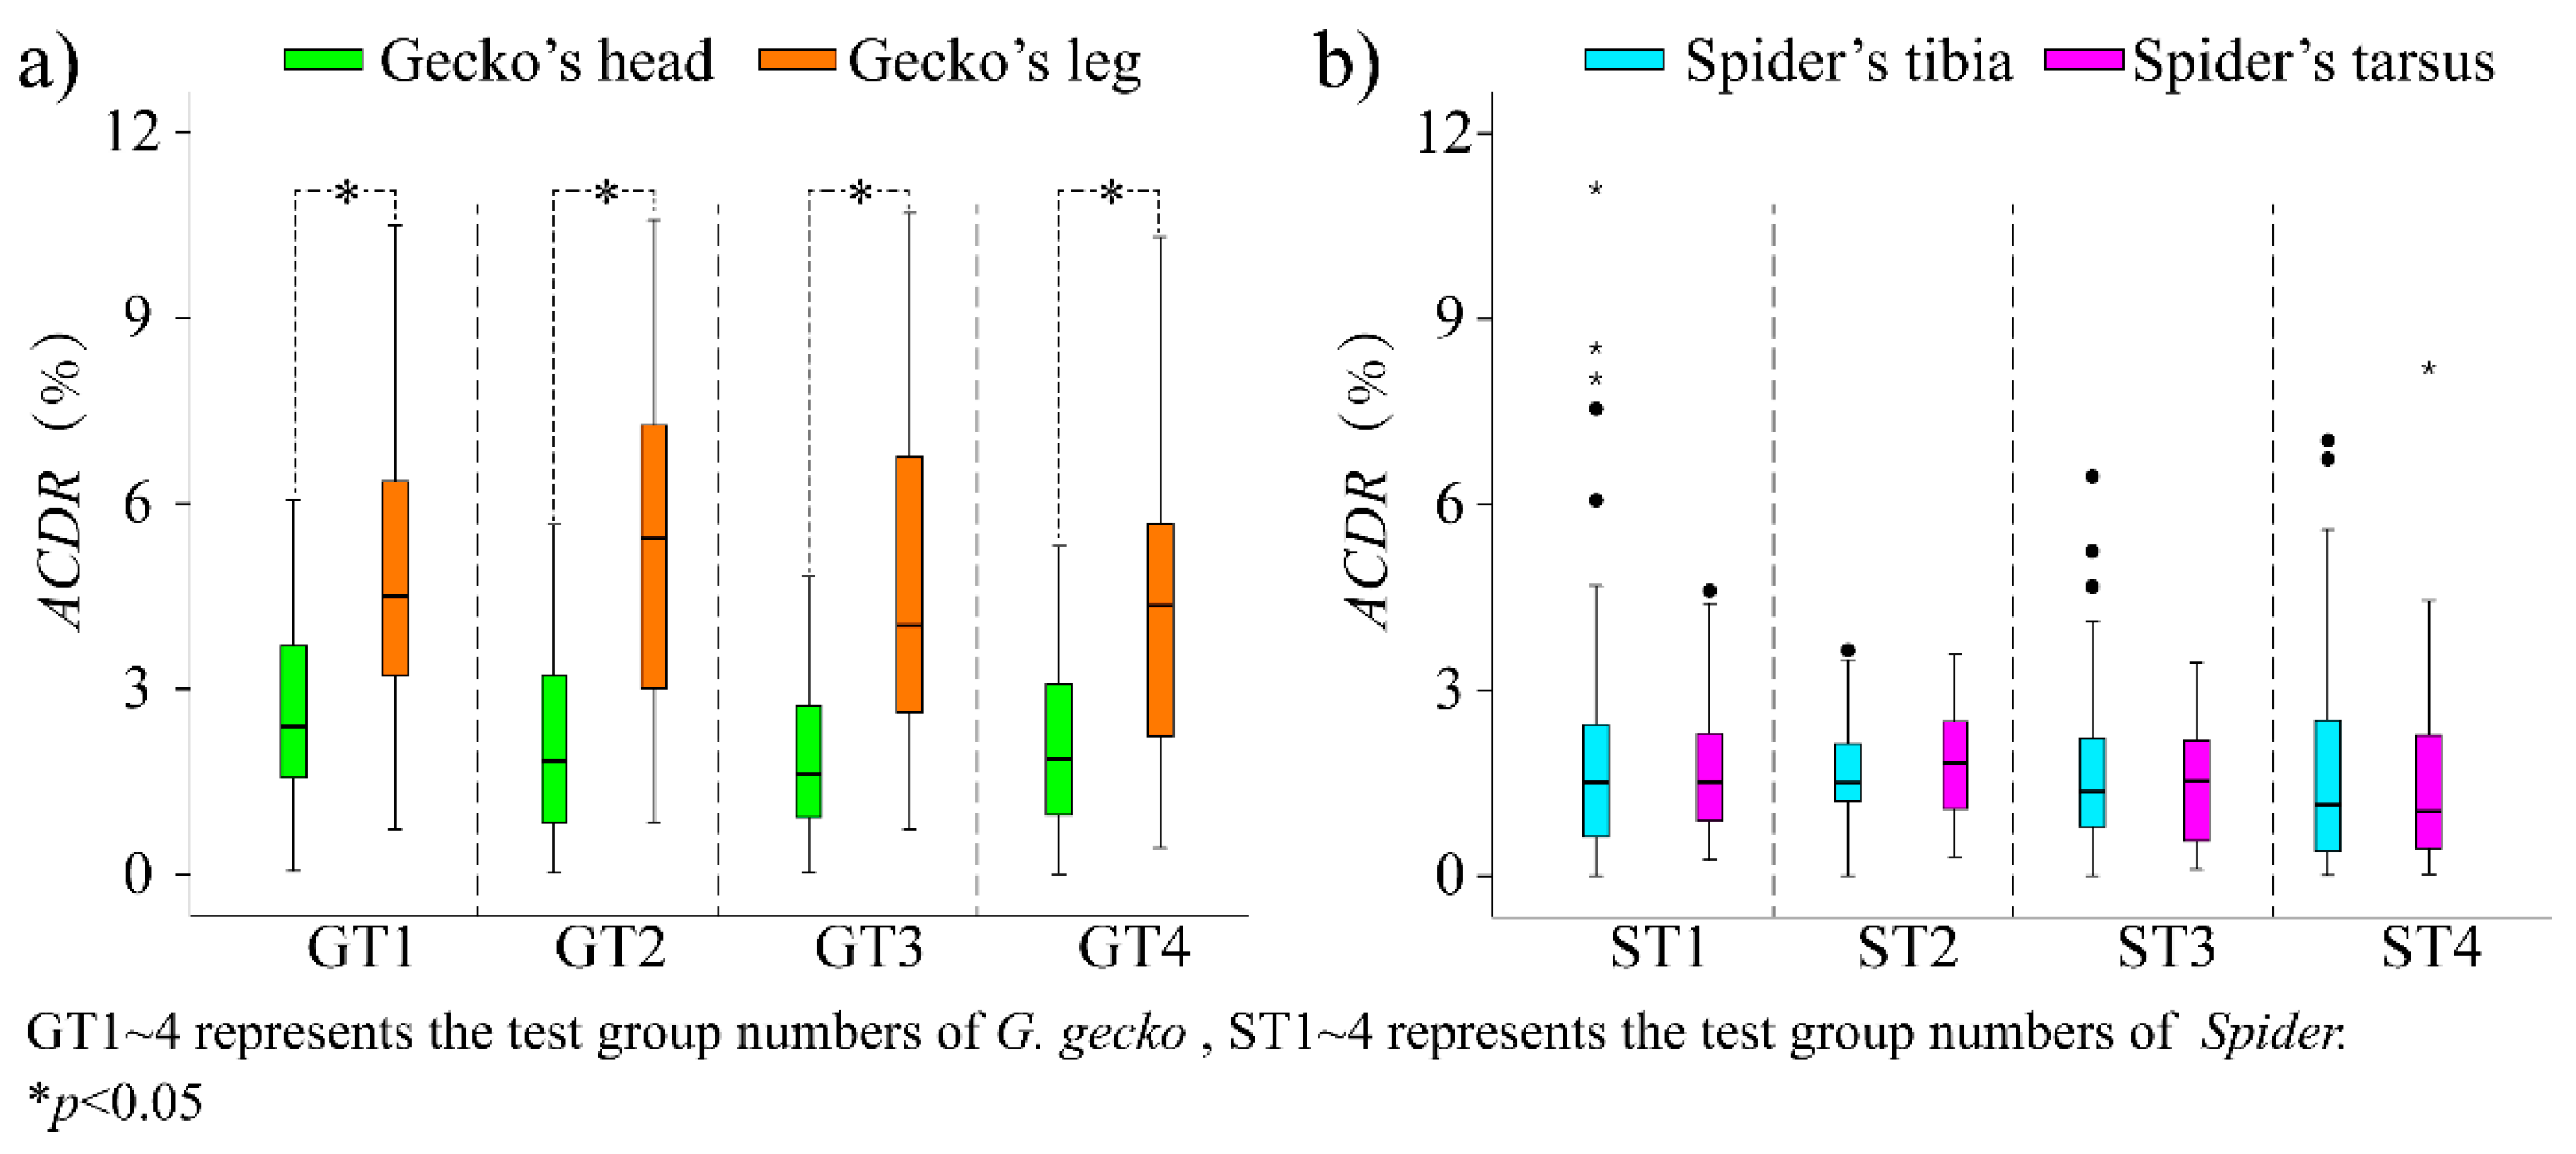
3.2.3. The Accuracy of Small Animals in Half-Annular Layout

The ratio of body width to body length (w/l) of gecko was about 0.37 ± 0.03 and its body height to body length ratio (h/l) was about 0.13 ± 0.01, so its body shape was close to a flat rectangular. The body width to body length ratio of the spider was about 0.9 ± 0.03 and it is the body height to body length ratio was about 0.5 ± 0.01, so its shape was close to a slightly flat square. According to the matching relationship between the body shape and the intersection volume of the multi-camera system, the gecko was suitable for half-annular layout, while the spider was suitable for arch layout. However, they are required to perform motion capture experiments on the FMA with a rectangular plane, which required that the viewing intersecting volume must have an inner envelope that was significantly longer than the width. Therefore, the half-annular layout was most apposite. In addition, due to the influence of the depth of field on the standard deviation rate, the working distance of the camera was selected to be 560 mm and the pitch angle was 45° and the angle between the cameras θ was 30° (Supporting Document S5 for details).
The ACD of the geckos was approximately 1.36 ± 0.40 mm (ACDR: 3.43 ± 1.46%) and the ASDR was 3.67 ± 1.33%. There was no significant difference between the head length and the leg length in each group (ANOVA, F = 0.537; d.f. = 3,4; p = 0.682); the ACDR of the head length was 2.1 ± 0.28% and the ACDR of the leg length was 4.77 ± 0.40%, there was also no significant difference in the head length and leg length between groups (ANOVA, F = 2.205; d.f. = 3,304; p = 0.11); but the ACDR of the head and the leg was different in each group (ANOVA, GT1:F = 8.042; d.f. = 1,208; p = 0.005; GT2:F = 370.971; d.f. = 1,487; p = 0.000; GT3:F = 280.534; d.f. = 1,162; p = 0.000; GT4:F = 12.065; d.f. = 1,191; p = 0.001) (Table S5).
The ACD of the spider was about 0.66 ± 0.33 mm (ACDR: 1.74 ± 0.13%). Meanwhile the ASDR was 3.76 ± 0.98%. There was no significant difference in the length of posterior segment and tarsal length between experimental groups (ANOVA, F = 0789; d.f. = 3,540; p = 0.501), which was statistically significant; and there was no significant difference between the ACDR of the tibia segment and the posterior tarsus segment in each group (ANOVA, ST1:F = 0.512; d.f. = 1,191; p = 0.475 ST2:F = 0.642; d.f. = 1,179; p = 0.424; ST3:F = 0.114; d.f. = 1,208; p = 0.736; ST4:F = 0.904; d.f. = 2,236; p = 0.406) (Table S6).

4. Discussion

Experimental results demonstrate that the average standard deviation rate of motion capture for multi-camera unit modules in a half-annular layout is significantly smaller than that for arched and annular layouts. The intersecting volume of the field of view and depth of the field have a certain impact on the capture accuracy. Moreover, in a half-annular layout under the motion capture experiments of geckos and spiders, the standard deviation rate and catching deviation rate of were obtained.

4.1. The Effect of Intersecting Volume and Depth of Field on the Motion Capture

The comparison between intersection volume size of different layout patterns of multi-cameras and corresponding motion capture standard deviation rate, meanwhile through the comparison between the intersection volume size of three kinds of pitch angle (30°, 45°and 60°) in a half-annular layout of multi-camera unit module and the corresponding average standard deviation rate (Table 1), both prove that the enlargement of vision intersection volume of multi-camera helps to reduce the standard deviation rate of motion capture (Figure 7a, Table S3). The maximum coverage theory [37] of cameras’ layout used in human body motion capture and the object visibility maximization principle [19] applied in a large-scale environment, both have consistency with the theory of this paper that the maximization of vision intersection volume of multi-camera helps increase motion capture accuracy rate. Moreover, since currently the influence of the depth of field on motion capture is still not detailed. This paper explores the effect of the selection depth of field range on the accuracy of motion capture (shown in Figure 7b and Table S4) and preliminary validates the enlarged depth of field of multi-camera cameras which is beneficial to the reduction of the motion capture standard deviation rate, it is because the depth of field is a critical factor affecting image resolution and the image is the main source of kinematics parameters. Whether it is depended on computer identification or human recognition, the clearer the images, the greater the accuracy of marker selection.
In addition, by keeping that the depth of field range is greater than the required motion area length (300 mm) in different angles (30°, 45° and 60°) to ensure a better clarity of the images and the actual scope of depth of field and intersection volume (Table S1) were calculated. As we can see, the view intersection volume in the pitch angle of 30° and 45° are the same and it is about 43% larger than that of 60° and the actual scope of the depth of field increases with the increase of pitch angle and that of 60° is larger by about 54% than that of 30°. The experiment result shows that the standard deviation rate of pitch angle 60° is significantly greater than that of 30° and 45° but the standard deviation rate under 30° is higher than when that of 45°. Therefore, despite the actual scope of depth of field under 60° is larger, the intersection volume is the smallest, which leads to its standard deviation rate the largest. Intersection volume under 30° and 45° is the same but the actual scope of the depth of field under 45° is about 35% larger than that of 30°. Such a wide range of the depth of field may be the reason for the motion capture standard deviation rate. Therefore, under the constant volume camera layout, increasing the depth of field range is also one way to reduce the standard deviation rate. To increase the view intersection volume of multi-camera or to increase the depth of field range are both beneficial to the improvement of capture accuracy. Furthermore, the experimental results also show that the view intersection volume of multi-camera has a larger influence on capture accuracy compared with the depth of field range.

4.2. The Performances of the Motion Capture System for Different Objects

In spite of the researches on motion capture systems for human motion, large/medium animal, for example, Jenny et al. have compared different algorithms of motion capture for horses and obtained the capture deviation rate of the horse during continuous walking (fore limb: 4.1% and hind limb: 4.8%) [38] and Miller et al. have measured the average capture deviation about −0.23 ± 0.35 mm (−0.24 ± 0.36%) of the human motion capture system (Cameras: Vicon Bonita, 200 Hz, Vicon Motion Systems, Ltd., Oxford, UK; Measurement volume of 5.5 × 1.2 × 2.0 m3) [39], there are few studies in the motion capture system for diverse small animals whose structure and movement characteristics are quite different from those of the human or large/medium animals, resulting in the relatively small experimental space and the requirement for higher accuracy and precision of the capture system. The performance of the motion capture system depends on various influencing factors. It is revealed that the layout pattern of the multi-camera has an important effect on the ACDR (p < 0.001) as well as the ASDR (p < 0.001). The results of calibration experiments on different multi-camera layout patterns show that the ACD of the rigid object is −0.10 ± 0.015 mm (ACDR: 0.23 ± 0.03%) and the ASDR is 0.34 ± 0.13% (The optimal system configuration: half-annular layout, α = 45°, θ = 30°; V = 0.061 m3). This is of great value for accurate motion capture for specific small animals in small experimental set.
The ASDR of the arched layout and the half-annular layout is significantly smaller than that of the annular layout and the ASDR of the arch layout is 1.2 times larger than that of the half-annular (Figure 7). Body shape and locomotion characteristics of the geckos and spiders have also been taken into account. Therefore, the half-annular layout is selected to perform the motion capture experiments. Results show that the ACDR of geckos and spiders are 1~2 mm and 0.32~1.22 mm, which are both smaller than that of rigid body (1~4 mm, OptiTrack motion capture system) [40] as well as human motion (0.82~3.47 mm, Vicon8 motion capture system) [41]. The ASDR between geckos and spiders are close to 3.7% which are slightly larger than 2.28% of the rigid body [38]. It is resulted from the much more complicated body shape and movement characteristics of gecko and spider, which also lead to the great challenge for stable and accurate motion capture. There are studies on the kinematics and kinetics of spiders by introducing the virtual hip and knee joints for modeling analysis [26], it is because that the motion capture for spiders with eight small multi-joints legs attached a large number of markers is too difficult to capture all of the markers completely. Through the matching mechanism between the multi-camera layout patterns with diverse animals, the accuracy and reliability of the experimental data could be improved by increasing the capturing volume and avoiding occlusion, improving the success rate and accuracy of the capture, more can be introduced in the legs.
In addition, the ASDR of gecko and spider are very similar but the ACDR of gecko is larger than that of spiders (Tables S5 and S6). The ACDR of the head distance of gecko is 2.1 ± 0.28% and that of the leg length is 4.77 ± 0.40%, so the ACDR of the leg is more than twice that of the head (Figure 8a). The ACDR between the tibia and the metatarsus of spiders are small (Figure 8b), since they have a typical exoskeleton structure. Therefore, researchers prefer to study the legs’ movement of spider relative to its body. The metatarsi of spider are very close to the ground, which is similar to the leg movement of gecko. Locomotion characteristics of tibia is analogous to the metatarsus, so there is no significant difference between them. As we known that the intuition of markers on gecko head achieve good results because the locations of markers are at the top of the body (back and tail of the body) [33]. However, the range of leg motion and speed variability is so large that the motion capture for the leg is much more difficult than the head. To solve the motion capture of a small animal such as gecko, which has rigid-flexible coupling body and complex movement characteristics and the accuracy, reliability and stability of motion capture must be improved from more aspects. From the above discussion, it is revealed that the motion capture for different parts of the gecko can adopt different capturing strategies, such as changing the shape of the markers. Therefore, this report focuses on the multi-camera layout methods for different small animal with diverse shapes and locomotor behaviors. However, there are still many difficulties in the movement capture of undersized animals, such as the rigid-flexible body of animals, the appropriate markers, data processing methods and so on.

4.3. Scalability of Multi-Camera System

In order to obtain a higher motion capture accuracy rate for small animals with great complexity and uncertainty, it is necessary to increase the number of cameras. Although this paper only conducted theoretical research and experimental verification on a unit modular consisting of 4 cameras, this system is theoretically extensible. According to the principle of 3-D imaging technology and geometrical optics, it can be known that a greater number of cameras can be regarded as a combination of some unit modules. When faced with captured objects that have a large body and a wide range of motion, or the objects that have a small volume but a large area of motion, it is necessary to ensure that the complete movement of the objects in the entire movement space is fully recorded. This can be achieved by increasing the number of cameras, because a multi-camera system composed of four cameras could accomplish the motion capture mode of “scratch capture of specific areas”, that means the capture object could be captured by at least one camera unit module when it moves in a certain area. A multi-camera system composed of N (N >= 4) cameras could be divided into some module units. The union of intersecting volumes of each unit module forms a motion capture sampling area. For example, to capture the movement of a mosquito whose motion range is much larger than its own size, eight cameras had been adopted using two half-ring layouts. When the captured objects enter a certain area, there are specific intersecting fields of view of four cameras to envelop them for effective capture [16]. Nowadays, the low-cost and high-efficiency of small-animal-oriented multi-camera systems have attracted more and more attention. Although it is very difficult to achieve high capture accuracy with a small number of cameras, a reasonable optimization of the camera layout is a priority, which could reduce the occlusion, ensure the scope of observation and obtain high-definition images by appropriately setting parameters such as the position and observation direction of each camera [4]. Therefore, multi-camera layout methods that we established based on the matching of the demand-boundary of animal movements and the capture characteristics of the multi-camera system have great universality, versatility and extensibility.

5. Conclusions

In the study of animal locomotor behavior with significantly different demand boundaries, a fair match of the shape and locomotion of diverse small animals with the capturing performances of various multi-camera layout patterns is a key to accurately determine the movement mechanism of an animal. We have established a multi-camera layout method for the motion capture system that adapts to diverse animal locomotion characteristics by theoretical calculations and experimental verifications. The motion capture system adopted this method can reduce not only the calibration difficulty caused by non-ideal layout of the multi-camera but also the capture difficulty and the error rate. Therefore, this method can be used to improve the accuracy and precision of motion capture and it provides a basic guarantee in regard to the quantification of the locomotor behaviors of small animals. What’s more, this method has achieved relatively low capture deviation rates in motion capture experiments with geckos (flexible body structure) and spiders (rigid exoskeleton structure) which indicate that it has wide applicability for animals with different body shapes and locomotion characteristics.
Quantification of animal locomotor behaviors involves the layout patterns of multi-camera system, the selection of markers and the acquisition of quantitative data. The accuracy and stability of the motion capture system for the quantification are affected by multiple factors, such as the analysis of the demand boundaries of animals’ locomotion and the optimization of multi-camera layout patterns focused on this work. So, a systematic method of motion capture for small animals needs to be established. This method should include the following important components: (a) analysis of the demand boundaries of motion capture for diverse animal locomotor behavior with rigid or flexible bodies, (b) layout patterns of the multi-camera system, (c) selection of markers matched with different capturing objects, (d) self-identification of the locomotion characteristics of rigid or flexible bodies, (e) quantitative characterization of animals’ locomotion. This investigation can serve as a foundation for determining the optimized the configuration and layout of motion capture systems that satisfy a wide range of objects of different sizes in areas such as kinematic analysis of small animals and also in other industrial fields.

Supplementary Materials

The following are available online at https://www.mdpi.com/2076-3417/8/9/1562/s1. There were seven documents (S1–S7) in the Supporting Documents including 8 figures (Figures S1–S8), 5 tables (Tables S1–S6) and 35 Equations (Equations (S1)–(S35)).

Author Contributions

Z.W. and Z.D. conceived and designed the experiments; W.Z. and L.W. co-performed the experiments; J.Z. and W.Z. analyzed data; W.Z. and Z.W. wrote the paper; Q.X., M.Y. and H.B. supervised the research and commented on the manuscript writing.

Funding

This work was funded by the National Natural Science Foundation of China (Grant No. 31601870 and 51435008) and the Natural Science Foundation of Jiangsu Province (Grant No. BK20160800 to Zhouyi Wang and BK20150407 to Qiang Xing).

Acknowledgments

The experimental animal—spider- was provided by Professor Liu of Jilin University. We would also like to thank Bingcheng Wang, Zhenlong Qu and Jian Chen for helping to translate and modify this manuscript. And we also need to thank the Department of Biology of University of North Carolina at Chapel Hill for the opening the software system for video processing.

Conflicts of Interest

The authors declare no competing financial interests.

Appendix A

Table A1. Parameter definition table.
NameSymbolValueUnitInterpretation
Camera numbersN4StationIn this study N = 4
Working distance/focus distanceWD/mmDistance between the lens and the focus on the experimental platform
Camera’s pitch angleα/DegreeThe angle between camera and capture platform in a side view
The angle between camerasθ/DegreeThe angle between two cameras
The length of working fieldL/mmLength of the area able to capture on the experimental platform
Working field’s widthW/mmWidth of capture able area on experimental platform
Camera focal lengthf6mmIntrinsic camera parameters
CCD widthv8.8mmThe height of the CCD chip
CCD heighth6.6mmThe width of the CCD chip
Depth of field
Back depth of field, Front depth of field
ΔZ
ΔZ1, ΔZ2
/mmThere is an allowable circle of confusion before and after the focus. The distance between these two circles of confusion is called the depth of field. That is, before and after the subject (focal point), the image still has a clear range, that is, the depth of field.
Camera apertureF1.6mm
Circle of confusionδ/mmBefore and after the focus, the light begins to gather and spread and the image of the point becomes blurred, forming an enlarged circle.
Calibrating markers’ distanced43.4mmThe distance of two markers on the calibrating bar.
The standard deviation rateSDR/%Standard deviation as a percentage of the mean value.
The average standard deviation rateASDR/%The mean value of all the SDR resulting from multiple experiments as a quantitative form reflecting the discreteness of the data captured during the capture process.
The capture deviation rateCDR/%The deviation value as a percentage of the true value.
The average capture deviation rateACDR/%The mean value of all the CDR resulting from multiple experiments as a reflection of the degree of dispersion between the measured value and the actual value.

References

  1. Hutchinson, J.R.; Schwerda, D.; Famini, D.J.; Dale, R.H.; Fischer, M.S.; Kram, R. The locomotor kinematics of Asian and African elephants: Changes with speed and size. J. Exp. Biol. 2006, 209, 3812–3827. [Google Scholar] [CrossRef] [PubMed]
  2. Xiang, Z.R.; Zhi, J.Y.; Xu, B.-C.; Li, J. Survey on motion capture technique and its applications. Appl. Res. Comput. 2013, 30, 2241–2245. [Google Scholar]
  3. Huang, B. Sequence Frame-based Optical Motion Capture System and Its Realization. Comput. Eng. Appl. 2004, 40, 36–39. [Google Scholar]
  4. Erdem, U.M.; Sclaroff, S. Automated camera layout to satisfy task-specific and floor plan-specific coverage requirements. Comput. Vis. Image Underst. 2004, 103, 156–169. [Google Scholar] [CrossRef]
  5. Xu, G.; Tian, G.; Pan, H.; Su, J.; Li, X. Precision Evaluation of Three-dimensional Feature Points Measurement by Binocular Vision. J. Opt. Soc. Korea 2011, 15, 30–37. [Google Scholar] [CrossRef] [Green Version]
  6. Katz, S.L.; Syme, D.A.; Shadwick, R.E. High-speed swimming: Enhanced power in yellowfin tuna. Nature 2001, 410, 770–771. [Google Scholar] [CrossRef] [PubMed]
  7. Webb, P.W. Form and Function in Fish Swimming. Sci. Am. 1984, 251, 72–82. [Google Scholar] [CrossRef]
  8. Donley, J.M.; Sepulveda, C.A.; Konstantinidis, P.; Gemballa, S.; Shadwick, R.E. Convergent evolution in mechanical design of lamnid sharks and tunas. Nature 2004, 429, 61–65. [Google Scholar] [CrossRef] [PubMed]
  9. Ren, L.; Hutchinson, J.; Schwerda, D.; Fischer, M. Basic limb kinematics of the locomotion in African elephants (Loxodonta africana). Comp. Biochem. Physiol. Part A Mol. Integr. Physiol. 2006, 143, S89. [Google Scholar]
  10. Muybridge, E. Horses and Other Animals in Motion: 45 Classic Photographic Sequences; Dover Publications: Mineola, NY, USA, 1985. [Google Scholar]
  11. Nauwelaerts, S.; Clayton, H.M. Trunk deformation in the trotting horse. Equine Vet. J. 2009, 41, 203–206. [Google Scholar] [CrossRef] [PubMed]
  12. Dickinson, M.H.; Farley, C.T.; Full, R.J.; Koehl, M.A.R.; Kram, R.; Lehman, S. How animals move: An integrative view. Science 2000, 288, 100–106. [Google Scholar] [CrossRef] [PubMed]
  13. Wang, Z.; Wang, Z.; Dai, Z.; Gorb, S.N. Bio-Inspired Adhesive Footpad for Legged Robot Climbing under Reduced Gravity: Multiple Toes Facilitate Stable Attachment. Appl. Sci. 2018, 8, 114. [Google Scholar] [CrossRef]
  14. Deetjen, M.E.; Biewener, A.A.; Lentink, D. High-speed surface reconstruction of a flying bird using structured-light. J. Exp. Biol. 2017, 220, 1956–1961. [Google Scholar] [CrossRef] [PubMed]
  15. Zheng, L.; Hedrick, T.L.; Mittal, R. A multi-fidelity modelling approach for evaluation and optimization of wing stroke aerodynamics in flapping flight. J. Fluid Mech. 2013, 721, 118–154. [Google Scholar] [CrossRef]
  16. Miller, L.A. Biomechanics: The aerodynamics buzz from mosquitoes. Nature 2017, 544, 40–41. [Google Scholar] [CrossRef] [PubMed] [Green Version]
  17. Bomphrey, R.J.; Nakata, T.; Phillips, N.; Walker, S.M. Smart wing rotation and trailing-edge vortices enable high frequency mosquito flight. Nature 2017, 544, 92–95. [Google Scholar] [CrossRef] [PubMed] [Green Version]
  18. David, J.S. A Brief History of Motion Capture for Computer Character Animation. In Proceedings of the ACM SIGGRAPH Computer Graphics, Course 9, Orlando, FL, USA, 24–29 July 1994. [Google Scholar]
  19. Mittal, A.; Davis, L.S. Visibility Analysis and Sensor Planning in Dynamic Environments. In Proceedings of the Computer Vision—ECCV 2004, European Conference on Computer Vision, Prague, Czech Republic, 11–14 May 2004; pp. 175–189. [Google Scholar]
  20. Wang, Z.; Dai, Z.; Ji, A.; Ren, L.; Xing, Q.; Dai, L. Biomechanics of gecko locomotion: The patterns of reaction forces on inverted, vertical and horizontal substrates. Bioinspir. Biomim. 2015, 10, 16019. [Google Scholar] [CrossRef] [PubMed]
  21. Wang, Z.; Dai, Z.; Li, W.; Ji, A.; Wang, W. How do the substrate reaction forces acting on a gecko’s limbs respond to inclines? Naturwissenschaften 2015, 102, 7. [Google Scholar] [CrossRef] [PubMed]
  22. Autumn, K.; Liang, Y.A.; Hsieh, S.T.; Zesch, W.; Chan, W.P.; Kenny, T.W.; Fearing, R.; Full, R.J. Adhesive force of a single gecko foot-hair. Nature 2000, 405, 681–685. [Google Scholar] [CrossRef] [PubMed]
  23. Endlein, T.; Ji, A.; Samuel, D.; Yao, N.; Wang, Z.; Barnes, W.J.P.; Federle, W.; Kappl, M.; Dai, Z. Sticking like sticky tape: Tree frogs use friction forces to enhance attachment on overhanging surfaces. J. R. Soc. Interface 2013, 10. [Google Scholar] [CrossRef] [PubMed]
  24. Wang, Z.; Ji, A.; Endlein, T.; Samuel, D.; Yao, N.; Wang, Z.; Dai, Z. The role of fore- and hindlimbs during jumping in the Dybowski’s frog (Rana dybowskii). J. Exp. Zool. A Ecol. Genet. Physiol. 2014, 321, 324–333. [Google Scholar] [CrossRef] [PubMed]
  25. Endlein, T.; Ji, A.; Yuan, S.; Hill, I.; Wang, H.; Barnes, W.J.; Dai, Z.; Sitti, M. The use of clamping grips and friction pads by tree frogs for climbing curved surfaces. Proc. Biol. Sci. 2017, 284. [Google Scholar] [CrossRef] [PubMed]
  26. Biancardi, C.M.; Fabrica, C.G.; Polero, P.; Loss, J.F.; Minetti, A.E. Biomechanics of octopedal locomotion: Kinematic and kinetic analysis of the spider Grammostola mollicoma. J. Exp. Biol. 2011, 214, 3433–3442. [Google Scholar] [CrossRef] [PubMed]
  27. Han, L.; Wang, Z.; Ji, A.; Dai, Z. Grip and detachment of locusts on inverted sandpaper substrates. Bioinspir. Biomim. 2011, 6, 46005. [Google Scholar] [CrossRef] [PubMed]
  28. Webb, A.A.; Kerr, B.; Neville, T.; Ngan, S.; Assem, H. Kinematics and Ground Reaction Force Determination: A Demonstration Quantifying Locomotor Abilities of Young Adult, Middle-aged, and Geriatric Rats. J. Vis. Exp. JoVE 2011, e2138. [Google Scholar] [CrossRef] [PubMed]
  29. Dai, Z.; Wang, Z.; Ji, A. Dynamics of gecko locomotion: A force-measuring array to measure 3D reaction forces. J. Exp. Biol. 2011, 214, 703–708. [Google Scholar] [CrossRef] [PubMed]
  30. Menache, A. Understanding Motion Capture for Computer Animation and Video Games; Morgan Kaufmann Publishers Inc.: Burlington, MA, USA, 1999. [Google Scholar]
  31. Kim, W.S.; Ansar, A.I.; Steele, R.D.; Steinke, R.C. Performance Analysis and Validation of a Stereo Vision System. In Proceedings of the IEEE International Conference on Systems, Man and Cybernetics, Waikoloa, HI, USA, 12 October 2005; pp. 1409–1416. [Google Scholar]
  32. Hausler, G.; Maul, M. Triangulation with Expanded Range of Depth. Opt. Eng. 1985, 24, 246975. [Google Scholar] [CrossRef]
  33. Autumn, K.; Hsieh, S.T.; Dudek, D.M.; Chen, J.; Chitaphan, C.; Full, R.J. Dynamics of geckos running vertically. J. Exp. Biol. 2006, 209, 260–272. [Google Scholar] [CrossRef] [PubMed] [Green Version]
  34. Svoboda, T.; Martinec, D.; Pajdla, T. A Convenient Multicamera Self-Calibration for Virtual Environments. Presence 2005, 14, 407–422. [Google Scholar] [CrossRef]
  35. Heikkila, J.; Silvén, O. A four-step camera calibration procedure with implicit image correction. In Proceedings of the IEEE Computer Society Conference on Computer Vision and Pattern Recognition, San Juan, Puerto Rico, USA, 17–19 June 1997; pp. 1106–1112. [Google Scholar] [Green Version]
  36. Windolf, M.; Götzen, N.; Morlock, M. Systematic accuracy and precision analysis of video motion capturing systems—Exemplified on the Vicon-460 system. J. Biomech. 2008, 41, 2776–2780. [Google Scholar] [CrossRef] [PubMed]
  37. Yuan, J.G.; Zhang, Y.N.; Zheng, J.B.; Run-Ping, X.I. Multi-Camera Layout Optimization Method for Motion Capture System. Microprocessors 2009, 3, 90–94. [Google Scholar]
  38. Boye, J.K.; Thomsen, M.H.; Pfau, T.; Olsen, E. Accuracy and precision of gait events derived from motion capture in horses during walk and trot. J. Biomech. 2014, 47, 1220–1224. [Google Scholar] [CrossRef] [PubMed] [Green Version]
  39. Miller, C.; Mulavara, A.; Bloomberg, J. A quasi-static method for determining the characteristics of a motion capture camera system in a “split-volume” configuration. Gait Posture 2002, 16, 283–287. [Google Scholar] [CrossRef] [Green Version]
  40. Carse, B.; Meadows, B.; Bowers, R.; Rowe, P. Affordable clinical gait analysis: An assessment of the marker tracking accuracy of a new low-cost optical 3D motion analysis system. Physiotherapy 2013, 99, 347–351. [Google Scholar] [CrossRef] [PubMed]
  41. Qin, H.U. Human Gait Tracking Method Based on Multiple Cameras. Comput. Eng. 2008, 34, 220–222. [Google Scholar]
Figure 1. The smallest outer enveloping cuboids (length—l, width—w, height—h) that completely envelop the animals’ body (the ratio of the width to the length and the ratio of the height to the length of the smallest outer enveloping cuboids of the small animal are in the northwestern corner of the figure).
Applsci 08 01562 g001
Figure 2. Typical layout patterns of the unit module of multi-camera (a) The arched layout pattern; (b) The annular layout pattern; (c) The half-annular layout pattern.
Applsci 08 01562 g002
Figure 3. (a) Projections of three typical camera layouts and their field of view intersection areas in the horizontal and vertical planes; (b) Volumetric representations of the intersections of three typical camera layouts in the field of view are the simplest cubic representations (in units of length L), the width W and the height H are proportional to the long L, respectively) and their shape matching with the typical capture object.
Applsci 08 01562 g003
Figure 4. Relationship between camera depth of field and remaining work planes (a) Depth of camera area; (b) Depth of field area in the form of three camera layouts; (c) With the same depth of field, the intersection of the field of view of two cameras with different pitch angles and the working plane.
Applsci 08 01562 g004
Figure 5. Experimental animals and setup (a) Experimental animals with markers on the body and legs (above: a spider; lower: gecko;) and the markers defined need data processing. for data processing; (b) Experimental equipment (including multi-camera unit modules), object motion plane, 3D motion reaction test platform, camera fixed frame and data transmission and processor); (c) Partial enlargement of the multi-camera unit module (including 4 cameras: C1, C2, C3 and C4) and a standard calibration bar (A black link device with two markers Pb1, Pb2 fixed) and an L-shaped calibration block (Installed with 4 vertical markers PL1, PL2, PL3, PL4) used as the calibration tools in the middle of the picture.
Applsci 08 01562 g005
Figure 6. Typical layouts diagram of a multi-camera unit modular (a) Arched layout; (b) Annular layout; (c) Half-annular layout; (d) A multi-camera motion-capture platform in a half-annular layout (pitch angle of 60°) with its coordinates to the middle point of the alignment line (LF).
Applsci 08 01562 g006
Figure 7. (a) Contrast between the viewing volume of the three types of camera layouts and the average deviation ratio (in order to compare the viewing volume and the capture deviation ratio together and increase the volume value to 100 times); (b) The ASDR of three lengths of sampling area (L) in the arched and half-annular layout patterns; (c) Three pitches in a half-annular layout Comparison of Actual Depth of Field and Standard Deviation Rate at Angles (30°, 45°, 60°).
Applsci 08 01562 g007
Figure 8. Statistical analysis of ACDR in Motion Capture of Gecko and Spider (a) Average deviation of gecko motion capture; (b) Average deviation of spider motion capture.
Applsci 08 01562 g008
Table 1. Comparison of three pitching angles for four-camera half-annular layout.
Camera LayoutHalf-Annular
Pitch angle α (°)30°45°60°
Camera angle θ (°)30°
Working distance WD (mm)540.5 ± 22.5606.75 ± 28.5604.25 ± 30.5
Intersecting volume V (m3)0.0630.0630.036
Depth of field Z (mm)324377377
Actual depth of field ADF (mm)346.4533.16754
ACD (mm)0.008 ± 0.0012−0.12 ± 0.003−0.02 ± 0.004
ASDR (%)0.61 ± 0.120.52 ± 0.080.82 ± 0.15
The measurement data, including WD, ACD and ASDR, are presented in Table 1 as mean ± standard deviation (mean ± s.d.).

