1. Introduction
The economic role of the road infrastructure and the huge amount of money invested in its construction and maintenance indicate the importance of good pavement design and management procedures. Poorly designed road pavements will cause premature failure, which will lead to high reconstruction costs as well as to great economical loss, due to traffic stagnation. Over designed pavements, on the other hand, will involve a waste of limited funds.
A good pavement design procedures should use the beneficial strength and stiffness characteristics of all the materials employed in their fullest extent. Concerning the granular materials applied in pavements, the knowledge of these materials properties is still relatively limited. The tests methods used to determine their engineering characteristics are mostly based on empiricism [
1]. In addition, the parameters obtained from these tests cannot be used as input to today’s mechanistic pavement design procedures [
2]. Therefore, the granular materials are not being used to their full structural capacity, and attribute only a limited structural role to the granular layers [
3].
Despite emerging laboratory equipment allowing better characterization techniques, tests on granular materials for pavement foundations is still based on traditional methods. In this sense, the California Bearing Ratio (CBR) test [
4] is frequently used in the assessment of granular materials in base and subbase layers of road pavements. The significance of the CBR tests emerged from the fact that, for almost all pavement design projects, unbound materials are basically characterized in terms of their CBR values when they are compacted in pavement layers. Deep examination of some fundamental principles involved during CBR tests is required in order to assess the functionality of pavement systems [
5].
This work aims at providing more insight into testing and analysis of granular materials for use in pavement structures. The main objective is to develop analytical and numerical models that can be used to investigate relationships between basic material characteristics and boundary conditions that can be used to develop a mechanistic-based correlation between different types of granular materials tests. The study primarily focuses on laboratory preparation and testing techniques for unbound granular road base materials. To assess the laboratory procedure and analyze the material behavior, a wide range of granular materials were laboratory prepared and investigated. We have constrained our efforts on temperate zone unbound granular conventional materials, such as natural graded aggregates and granular materials based on sand and clays. Due to its relatively small particle size, the mechanical parameters of these materials can be determined using fairly small test specimens. Moreover, some coarse graded base granular materials were also under study in this work.
Due to the subjective nature of the validity of a material to be used for road foundation, especially given the limited understanding on the effect of material characteristics and process variables on the lay-up quality, we have considered putting this subjective judgment into a framework that makes use of both objective data and qualitative criteria. Therefore, a Matlab (R2017b, MathWorkrs, Natick, Massachusetts 01760 USA, 2017) based Analytical Hierarchy Process (AHP) was used, which is a widely applied tool from the field multi-criteria decision-making [
6]. As a way to evaluate the potential strength of subgrade, subbase, and base course materials, analytical correlations between the CBR value and the maximum dry density of soil are obtained. The results are then included in the AHP approach to determine the ranking of the alternatives and the CBR index is estimated.
1.1. Soil Classification
The so-called PG-3,
General Technical Specifications for Works on Roads and Bridges in Spain [
7], specifies three types of road foundations to be used in pavement design: embankments, back-fills, and quarry-run fills. The technical requirements also include a soil classification system, which defines five levels of soil quality, depending on its organic matter content. This scheme involves testing for water-soluble salts and gypsum content, particle size distribution, liquid limit, plasticity index, normal Proctor test and free swelling. These five soil quality groups, from the highest to lowest quality are the following: (i) Selected Soils; (ii) Suitable Soils; (iii) Tolerable Soils; and (iv) Marginal Soils.
1.1.1. Selected Soils
Selected soils meet the following conditions:
Content in organic matter lower than 0.2%, according to UNE 103204.
Content in water-soluble salts, including gypsum, 0.2%, according to NLT 114.
Maximum particle size not greater than 100 mm.
Particles passing sieve No.0.40 UNE <15% or otherwise satisfies each and every one of the following conditions:
- -
Particles passing sieve No.2 UNE less than 80%.
- -
Particles passing sieve No.0.40 UNE less than 75%
- -
Particles passing sieve No.0.080 UNE less than 25%.
- -
Liquid limit less than thirty (LL < 30), according to UNE 103103.
- -
Plasticity index lower than ten (IP < 10), according to UNE 103103 and UNE 103104.
1.1.2. Suitable Soil
Suitable soils meet the following conditions:
Content in organic matter lower than 1%, according to UNE 103204.
Content of soluble salts, including gypsum, lower than 0.2%, according to NLT 114.
Maximum size not exceeding 100 mm.
Sifted by the 2 UNE sieve, less than 80
Particles passing sieve No.0.080 UNE lower 35%.
Liquid limit less than 40, according to UNE 103103.
If the liquid limit is greater than thirty (LL > 30), the plasticity index will be higher than four (IP > 4), according to UNE 103103 and UNE 103104.
1.1.3. Tolerable Soil
Tolerable soils meet the following conditions:
Content in organic matter lower than 2%, according to UNE 103204.
Gypsum content less than 5%, according to NLT 115.
Content in other soluble salts other than gypsum below 1%, according to NLT 114.
Liquid limit less than 65, according to UNE 103103.
If the liquid limit is greater than forty (LL > 40), the plasticity index will be greater than seventy-three percent of the value resulting from subtracting twenty from the liquid limit (IP > 0.73 (LL-20)).
In situ collapse test lower than 1%, according to NLT 254, for remolded sample according to the normal Proctor UNE 103500, and test pressure of two tenths of megapascal (0.2 MPa).
Free swelling according to UNE 103601 of less than 3%, for remolded sample according to the Normal Proctor UNE 103500.
1.1.4. Marginal Soil
Marginal soils will be considered as such those that cannot be classified as selected, nor suitable soils, nor as tolerable soils, due to the non-fulfillment of any of the conditions indicated for these. Marginal soils meet the following conditions:
Content in organic matter lower than 5%, according to UNE 103204.
Free swelling according to UNE 103601 of less than 5%, for a sample that has been remolded according to the normal Proctor UNE 103500 test.
If the liquid limit is greater than 90, the plasticity index will be less than seventy-three percent of the value resulting from subtracting twenty from the liquid limit (IP < 0.73 (LL-20)).
1.1.5. Graded Aggregates
Concerning the materials to be used for road structural layers, graded aggregates are the most suitable material offering optimum structural support [
8]. Graded aggregate can be defined as inert continuous granular material used in pavement layers. PG-3 distinguishes two types of aggregate: artificial graded aggregate (AGA) and natural graded aggregate (NGA). Both materials can compose structural soils, featuring continuous granularity, a certain grade of plasticity and erosion index less than 40.
Table 1 summarizes the technical requirements for classified soil quality according to the Spanish PG-3 specifications. Marginal soils are those not included in any of the above categories. In this sense, emerging works are progressing with the aims to propose constructive procedures that allow the reuse and implementation of marginal materials, improving their geotechnical properties [
9].
1.2. Soil Stabilization
In order to avoid damages or deformations caused by liquefaction of foundations soils, and to improve their stability, stabilization techniques are commonly applied. Soil stabilization is defined in the PG-3 specification as a process that improves the resistance of a soil against deformation and durability, decreasing its susceptibility to water. The stabilization mechanism can be chemical or mechanical, such as dry jet mixing, in which a dry hardening agent, as cement or quicklime powder, is injected into the granular material and is mixed in situ with soft soil to strengthen the ground condition. The technical requirements for stabilized soils regarding plasticity, organic matter content, and total soluble sulfates content are shown in
Table 2.
2. Materials and Methods
Specimen Preparation
Initially, some natural graded unbound material (NGA), frequently used as a sub-base for road pavements in Spain, was progressively mixed with different proportions of gravel, clay, silt and sand. A number of samples of seven granular soils were then prepared. Four of them—selected, suitable, tolerable and marginal soil—were produced and sampled following the Spanish Standard UNE-EN 932-1 [
10]. Since the objective was to obtain a representative bulk sample, a stack sampling procedure was used. Accordingly, sample fractions of similar size were taken from different points, heights, and depths of the stack. Following the procedure described in the UNE-EN 932-2 [
11], a laboratory 50 mm sample divider was used to reduce samples and obtain coarse aggregate, as well as medium and fine fractions.
Additionally, three more samples of stabilized soils (STS) were prepared by mixing certain classified soils with a filler chosen from several fine-sized fractions of lime, micro-cement and cement. Extra samples of artificial crushed graded soil made of crushed granitic stone (designated as ZA25 in the PG-3) were also prepared as control specimens for comparison.
Table 3 summarizes the sample preparation used in this work.
3. Results and Discussion
Firstly, characterization tests were conducted on all of the specimens: (i) particle size distribution, (ii) Atterberg limit and (iii) modified Proctor test. Secondly, the California Bearing Ratio (CBR) tests were performed with a significant four-day period of immersion days.
3.1. Particle Size Distribution
Grading tests were performed according to UNE-EN 933-1/A1 [
12]. The procedure followed involved sequential sieving using ISO-standard sieves. The samples were oven-dried at
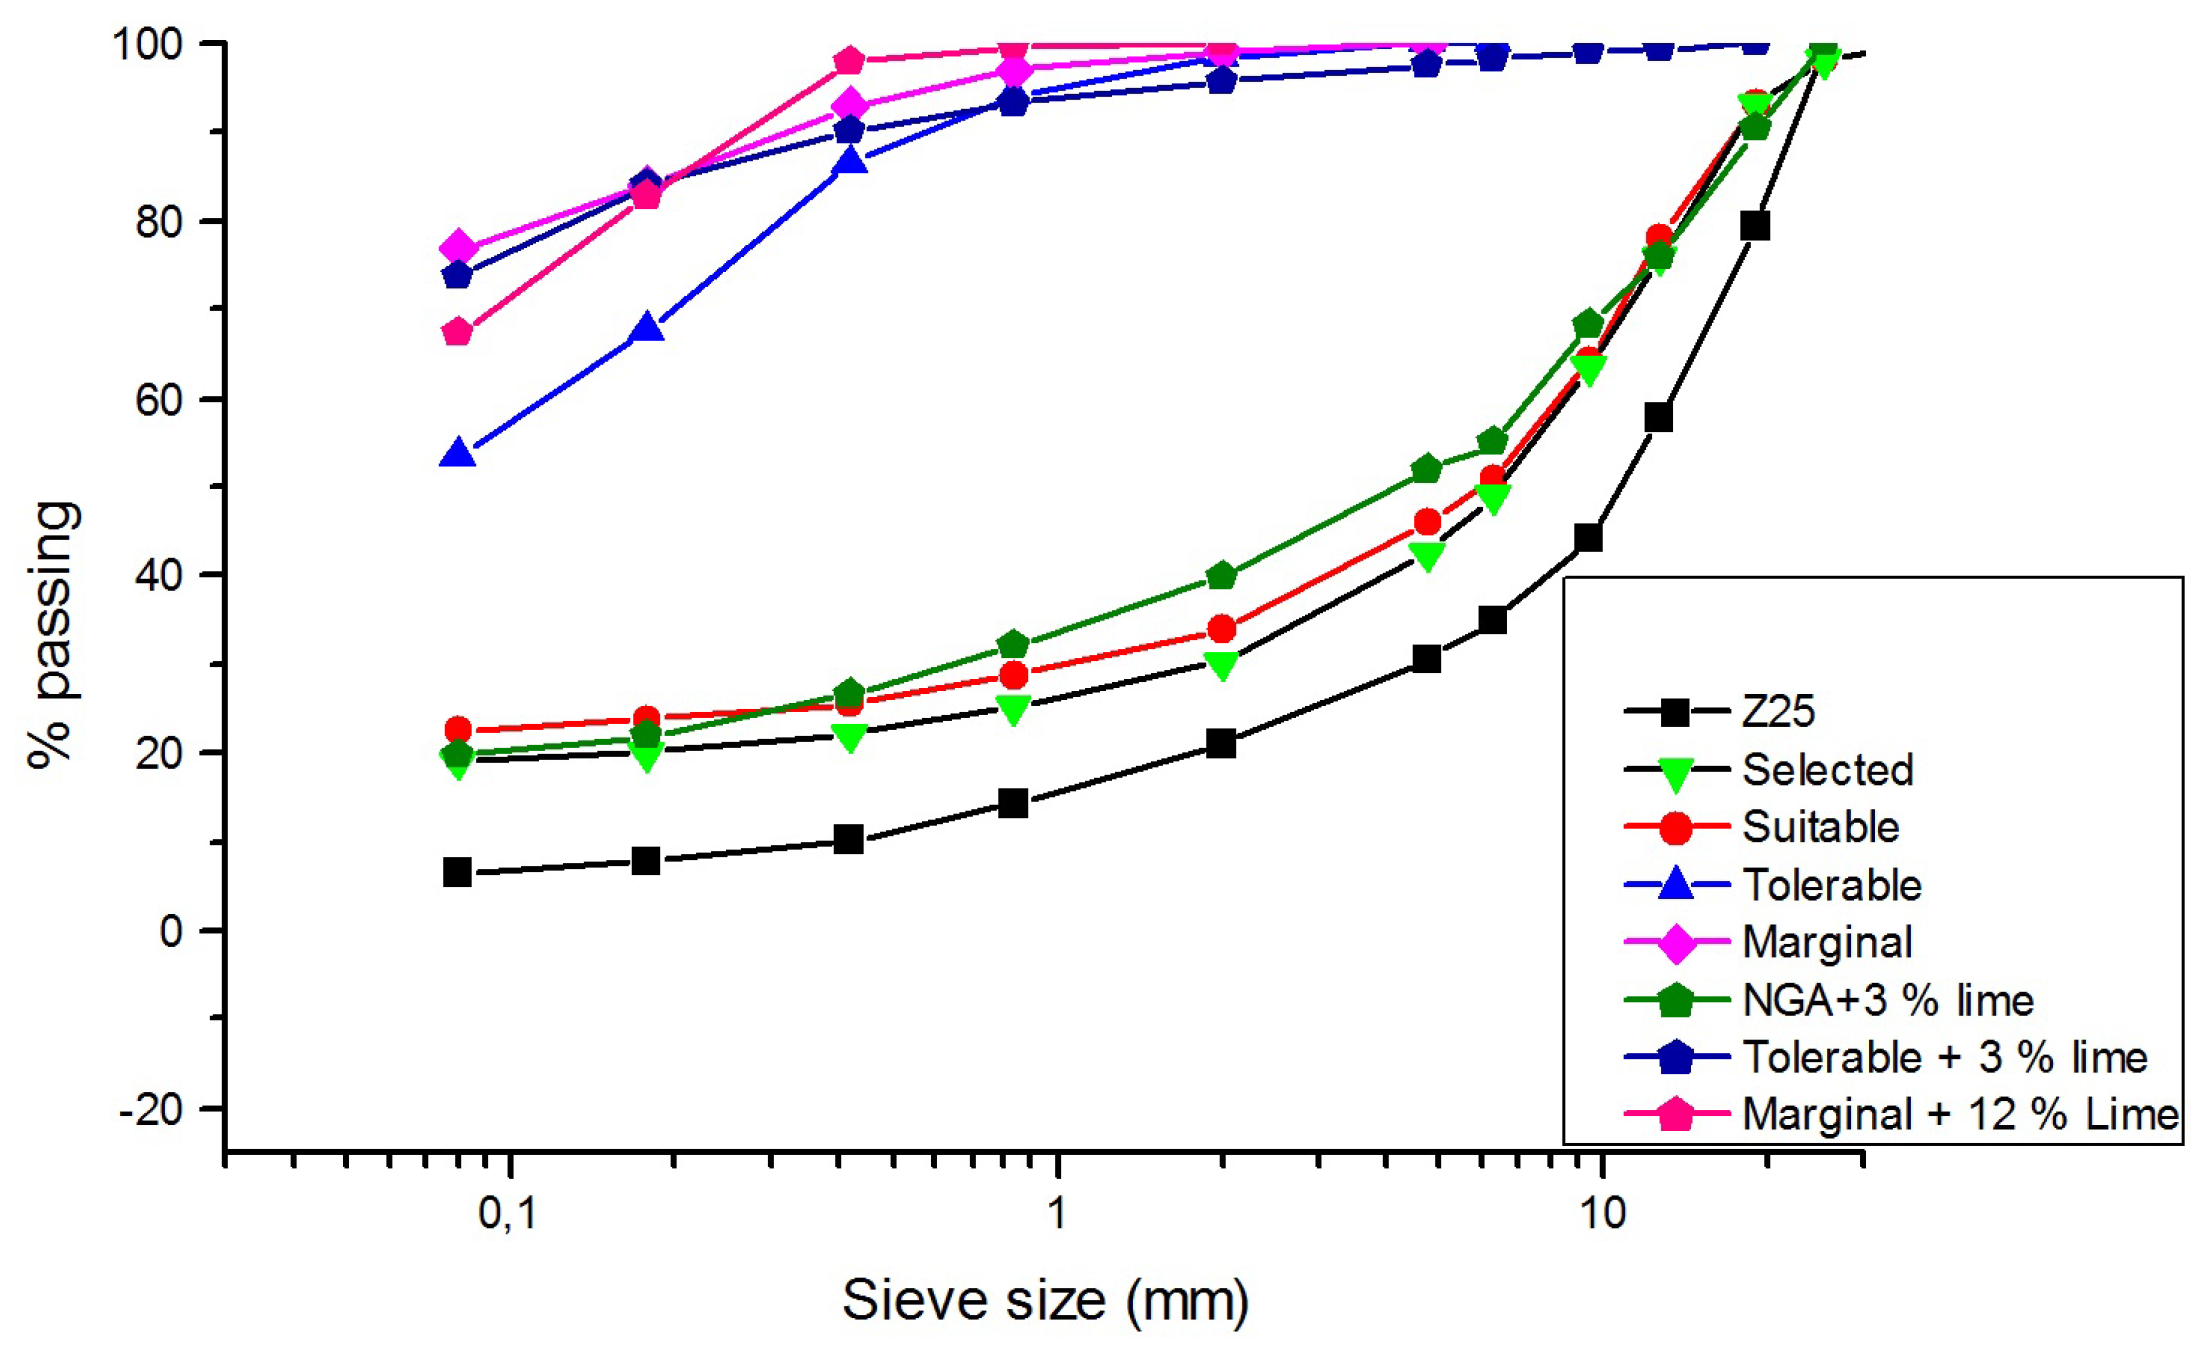
°C prior to the sieving process. The grading curves for the classified soils and some of the stabilized soils prepared are shown in
Figure 1. All samples fall within the limits corresponding to their specific range, as defined in the PG-3. The samples representing Z25, selected, suitable and NGA stabilized with
lime can be considered as continuous distribution of course grained unbound materials (more than
retained on or above No.200 (0.075 mm) sieve), whereas the tolerable and marginal soils, with or without filler, are considered to be fine grained soils (more than
passes No.200 sieve), as expected.
3.2. The Atterberg Limits
The Atterberg Limits are used primarily in classifying cohesive soil materials for engineering purposes. As the water content is increased, the consistency of a fine-grained soil changes from a semi-solid state to a plastic state and finally to a liquid state. The plastic limit (PL) is the point at which the consistency, caused by the soil water content, is transformed from a semi-solid state to a plastic state. The liquid limit (LL) is the point at which the consistency is transformed from a plastic state to a liquid state. In these studies, the Casagrande Liquid Limit Device was used for determining the liquid limit of the sample soils, according to UNE-EN 103103 [
13]. The plastic limit was measured by the moisture content (%) at which the soil, when rolled into threads of 3 mm in diameter, will crumble. The results from the Atterberg Limits test are shown in
Table 4.
Soil stabilization by lime or hydraulic binder immediately produce a variation of the water content and modification of the geotechnical characteristics of the fine fraction, as due to the flocculation of the clayey fraction of the soil [
14,
15].
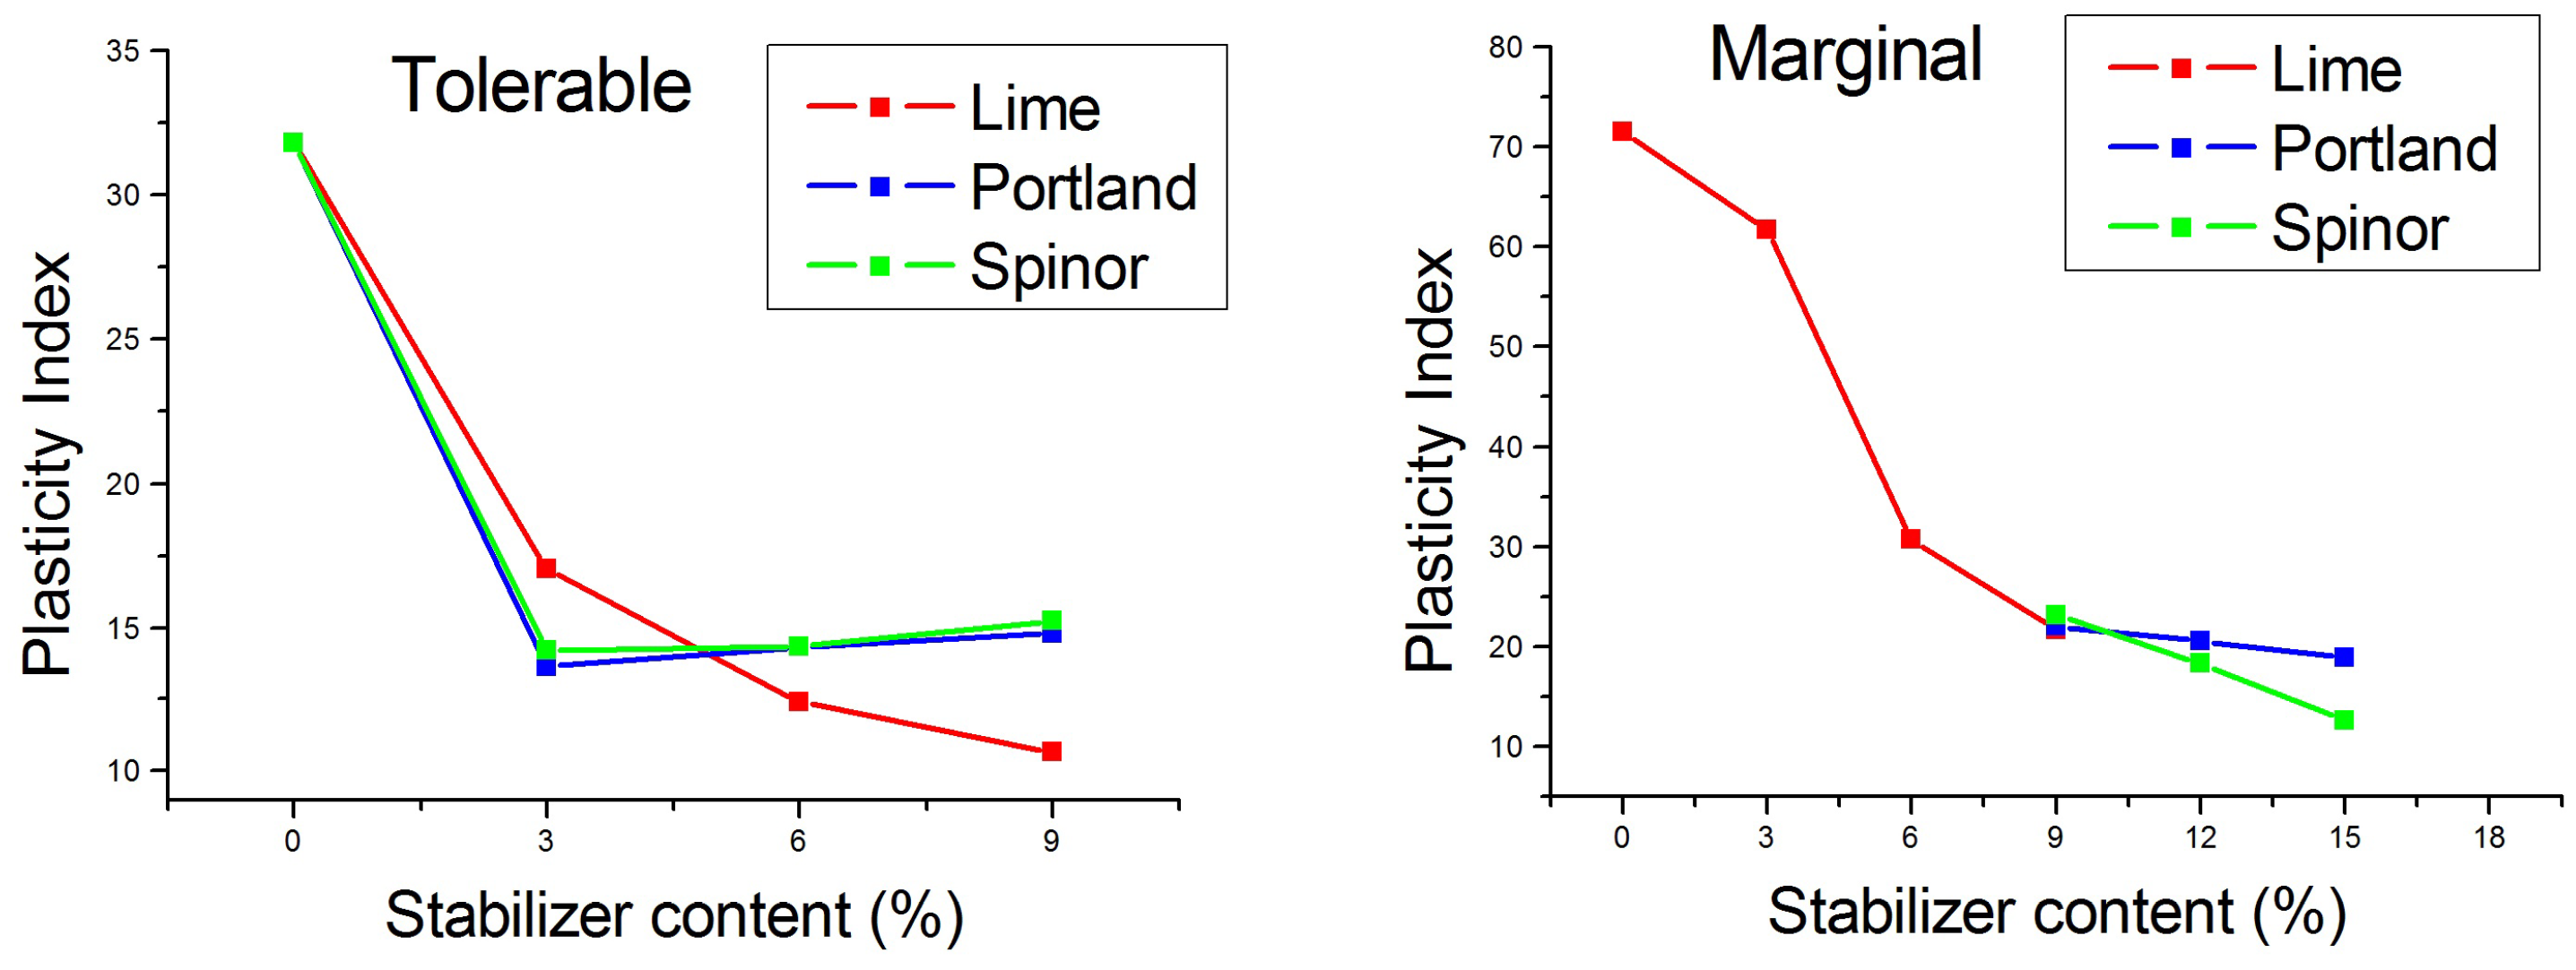
Figure 2 displays the plasticity index for different filler proportions in the stabilized soils prepared in this study. With the addition of lime, the plasticity of both tolerable and marginal soil was reduced, as previously reported by Croft [
16]. The addition of cement and microcement produced similar effects in the marginal soils tested: the plasticity index was reduced. However, both hydraulic binders caused an appreciable decrease in plasticity index (from
to
at the addition of
stabilizer in tolerable soil) followed by gradual increase with further additions (
and
).
3.3. Proctor Test
The Proctor test is the most widely used test to determine moisture–density relations of soils and unbound granular materials. Originally, the test involved compaction of soils in a 4 inch (101.6 mm) mould, using a drop hammer to apply the compaction effort. In the work presented here, the modified Proctor test have been according to UNE 103501/94, using a compaction energy of 2.632 J/cm. The laboratory samples were compacted at the optimum moisture content to reach the maximum dry density. After compaction was completed and before implementing the actual dynamic tests, the specimens were held for 24 h in a humid chamber at a temperature of 20 °C with a relative humidity of .
Proctor test results were used to produce the conventional convex moisture–dry density curves. The moisture–density plots are in fact an indication of the sensitivity of the density with respect to the variations of moisture content for the materials [
17,
18]. Materials with flat curves can tolerate a greater amount of variations in the moisture content without compromising much of the achieved density from compaction. Conversely, materials with sharp curves are very sensitive to the change in the moisture content and there is a need to ensure that the moisture content is close to the optimum value during compaction.
The moisture and dry density relationships for four lab-prepared subbase mixtures (non-stabilized soils) and the control mixture (Z25) are shown in
Figure 3A. The tolerable soil prepared with highest clay content displays a significant different behavior. It was found that the incorporation of large amount of fine clay increased the optimum moisture content and decreased the maximum dry density as a result of the high water absorption and the low particle density of the clay particles.
Figure 3B shows the proctor test results performed on stabilized soils specimens.
3.4. The California Bearing Ratio (CBR)
The CBR test is a penetration test for evaluation of the mechanical strength of road subgrades and base courses [
19]. The CBR test performed on the specimens was carried out according to UNE 103-502/95 [
20], with significant modifications described as follows: the specimen is first selected taking into account that 20 UNE sieve has been passed at >
of the sample weight. The chosen samples for this studies weighted 6 kg, considering the CBR mould capacity of 5 kg. A plunger with a circular cross-section of 20 mm
is driven at a specified rate into the specimen compacted in the 152.4 mm diameter CBR steel mould. The forces required to cause a penetration of
and 5.08 mm are then expressed as percentages of the standard forces of
and 20.3 kN, respectively. In these studies, a standard piston was used to penetrate the soil at a standard rate. The pressure up to a penetration of 10 mm and its ratio to the bearing value of a standard crushed rock is termed as the CBR.
To simulate the “in situ” condition of moisture content in the laboratory, the CBR-test can be performed “unsoaked” (at the compaction moisture content) or “soaked”: the specimen after compaction having been immersed in water for four days before the actual CBR-testing. The “soaked” procedure has been carried out for this work, measuring penetration under load conditions after one, two, three and four days of immersion. The photograph of mould and penetration device are shown in
Figure 4.
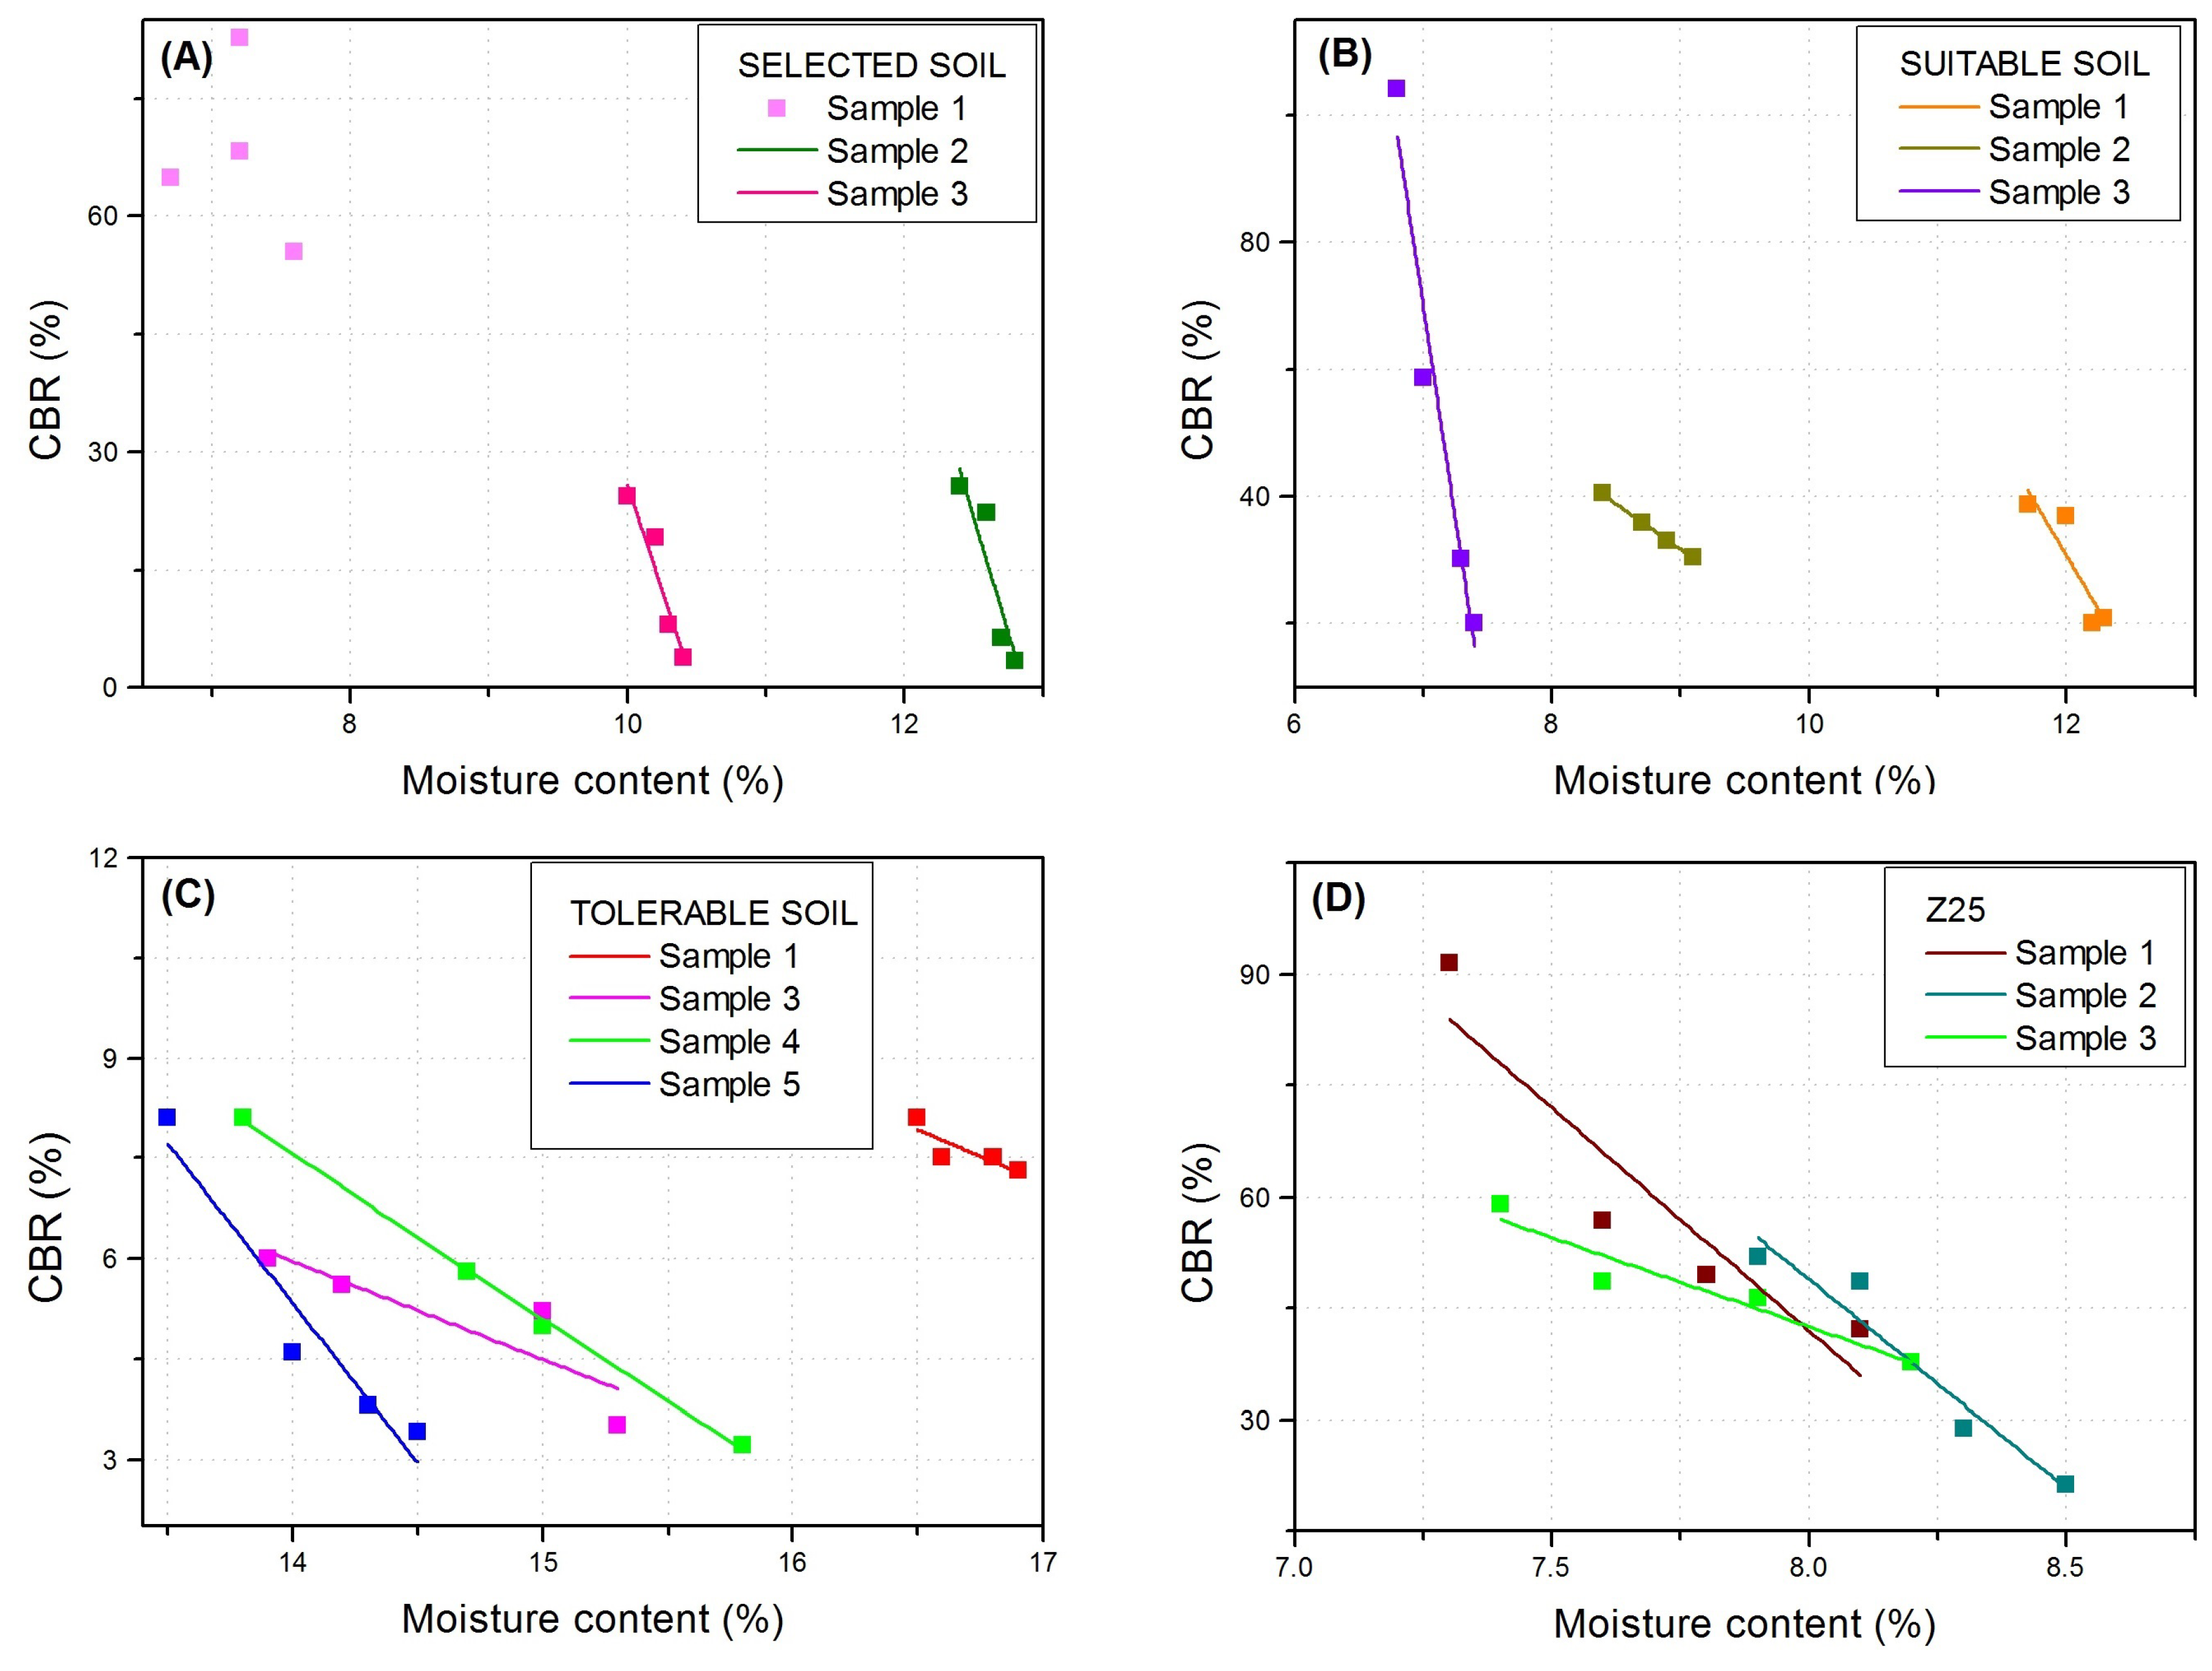
Graphical analysis has been performed through the representation of the CBR versus moisture content for all samples of the lab-prepared soils.
Figure 5 displays the results of the classified soil specimens after four days of immersion. The CBR exhibits clearly decreasing linear behavior, which indicates loss of stability of the soils when high moisture content exists, as expected. Concerning the stabilized soils,
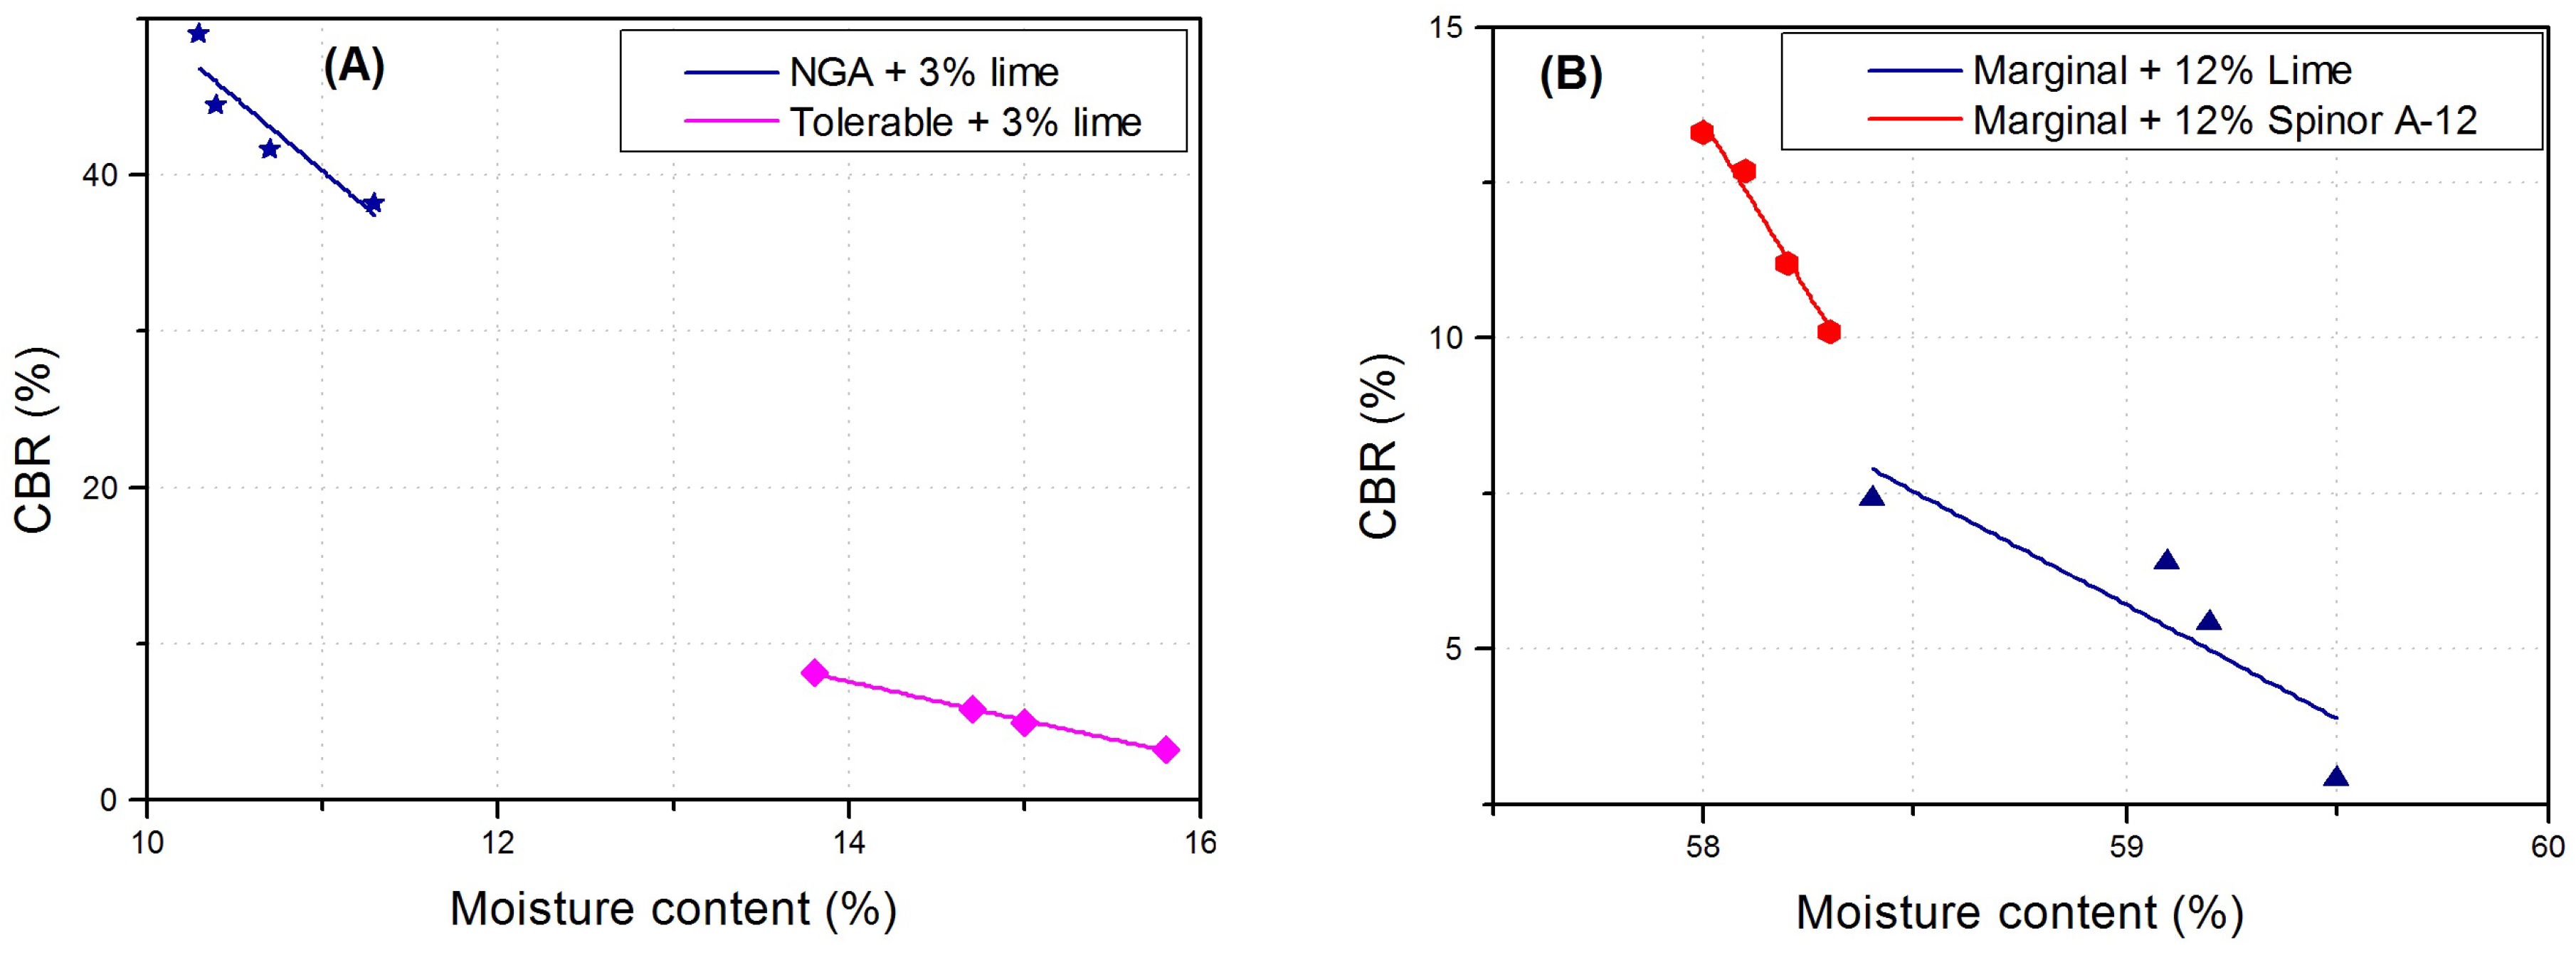
Figure 6 displays the graphical behavior of the CBR index for marginal soil, natural graded aggregate and tolerable soil samples stabilized with lime and micro-cement, as indicated. The values corresponding to physical properties are in agreement with PG-3 requirements, which highlights the fact that the laboratory preparation procedure of these soils have been carried out with accuracy.
CBR values of marginal soil stabilized with lime and micro-cement (
Figure 6B) show high sensitivity of these samples upon humidity changes, but good stability otherwise. Increasing CBR with microcement filler is due to filling the voids between soil particles. The stabilized soils prepared with natural graded aggregate and tolerable soil both stabilized with 3% lime (
Figure 6A) present higher sensitively to moisture content increase than stabilized soils prepared with marginal base. The sample fabricated with natural graded aggregate stabilized with 3% lime filler features a remarkably high CBR index, which slightly decreases when the sample acquires moisture.
3.5. Estimation of CBR from Maximum Dry Density
Finer investigations were conducted in order to analyze the performance of empirical correlation equations developed from the experimental data collected herein for the sampled soils. An attempt has been made in this study to correlate CBR value analytically with the maximum dry density of soil, as a way to evaluate the potential strength of subgrade, subbase, and base course materials. Polynomial curve fitting approximations were performed on the moisture–density data collected in this study. As shown in
Table 5, all models exhibit a strong correlation coefficient when fitting to the following equation:
where
is the maximum dry density (g/cm
),
in the optimum moisture content (%),
is the
Y-intercept and
and
are the slopes associated with OMC and
, respectively.
Each soil was first analyzed separately by soil functional groupings. Subsets started with classified soils (selected, suitable, tolerable and Z25), and then proceeded to lime-stabilized soils (tolerable + 3% lime and NGA + 3% lime).
Table 5 resumes the coefficients (
) and
values for the curves generated using the lineal regression.
3.6. Analytical Hierarchy Process Approach
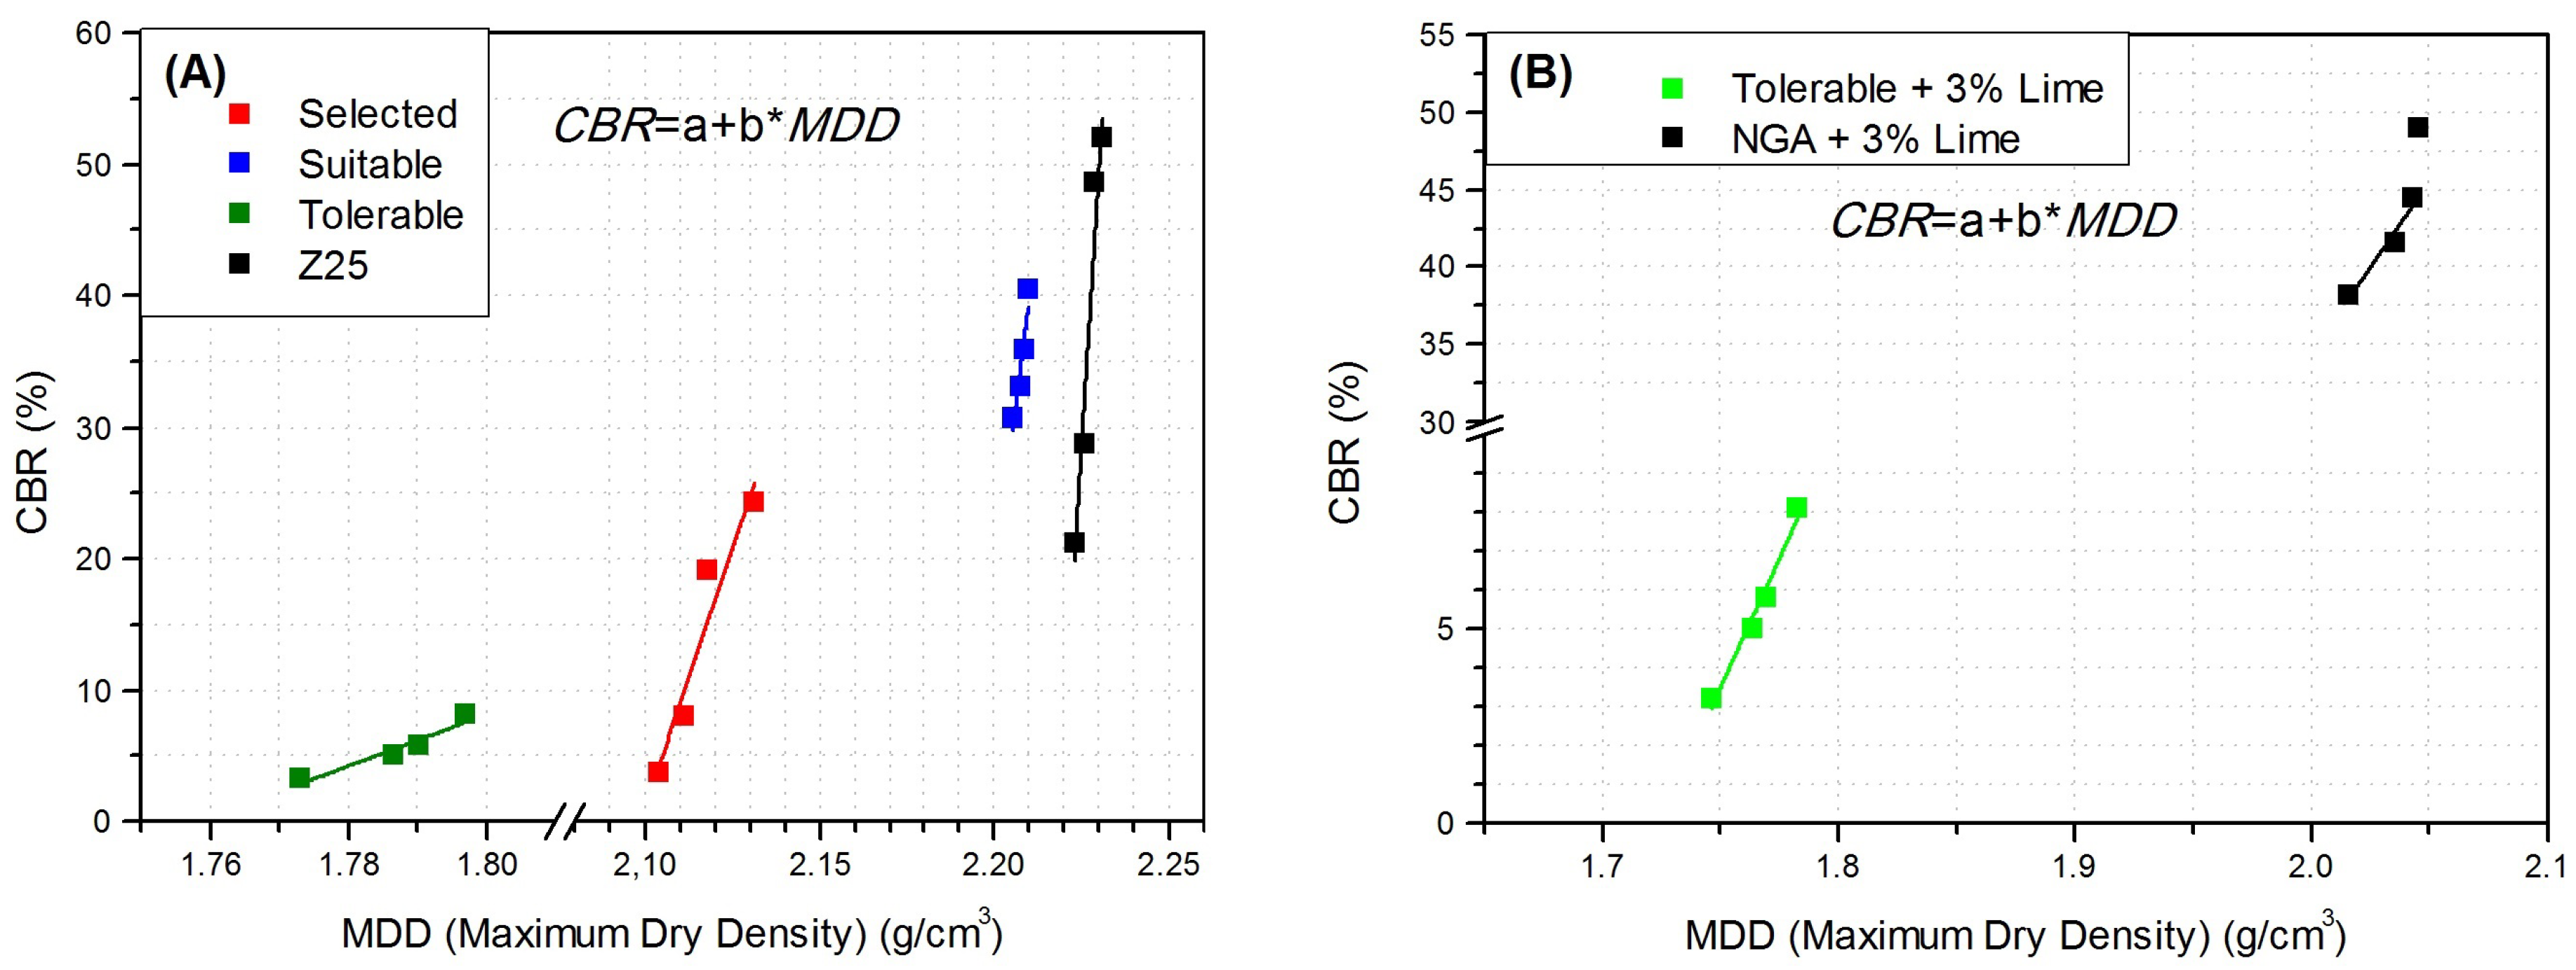
To compute a suitable predictive model for CBR versus maximum dry density, we have used Matlab AHP Analytical Hierarchy Process in solving the key issue of the CBR estimation. The model has been developed herein, consisting of an interconnected assembly of simple processing elements, which are organized in a layered fashion. Our model comprised three layers with a set of input nodes and a set of output nodes. The empirically obtained relationships between moisture and density were inserted as input nodes that the processing elements computed in order to estimate an output, according with the CBR-moisture data collected in this work. Because an universal equation relating CBR to MDD regardless of soil type was not evident, AHP was used due to its advantages in determining evaluation objectives. The process involved proceeding by soil type using first-, second-, and third-order equations, as well as allometric fitting. Confirmation of the model (CBR) was done by considering correlation coefficient and the
F test. Regression analysis indicated the strongest correlations (
) between maximum dry density (MDD) and California bearing ratio (CBR). The data plots are provided in
Figure 7A,B for all of the soil types analyzed. Experimental data are also shown in the plots. It can be noted that the correlation equations obtained as a result of regression analysis are in satisfactory agreement with the test results.
4. Conclusions
The main objective of this study is to investigate the applicability of the testing laboratory procedure presented to characterize classified and stabilized soils. A wide range of granular soils has been laboratory prepared as base and subbase materials in flexible pavements technology. The samples are produced accordingly to the requirements defined in the Spanish General Technical Specifications for Roads and Bridge Works (PG-3).
The lab-prepared granular soils have been characterized by means of particle size distribution, Atterberg limits, modified proctor test and California bearing ratio test (CBR). Results show that all samples fulfill PG-3 requirements according to their specific classification.
The determination of CBR has been performed according to the European regulation UNE 103502/95, considering the evolution of the swelling and penetrability up to one, two, three and four days of immersion. The results show that repeatable values within an acceptable degree of accuracy can be obtained, which indicates good quality laboratory testing conditions.
An empirical relationship between dry density and moisture content conduct further analysis in order to find a good correlation model between maximum dry density and CBR index, which can be used to evaluate the potential strength of subgrade, subbase, and base course material. The analysis led to the development of a predictive model based on a Matlab AHP hierarchical structure, which has been used to estimate California bearing ratio value (CBR). The model proves to be reliable and capable of estimating the CBR values from MDD results. It is beyond the scope of this study to elaborate further on the CBR-MDD correlations by using the data reported by other authors, with the aim of statistically analyzing such sets in a similar way to the data reported in this paper. This is a topic for future study.
It is important to highlight that the established relationship between maximum dry density and CBR analysis was conducted within a very controlled test framework. Practical applications are not likely to provide expected results due to significant material variations that may occur depending on material site. Therefore, the authors would like to transmit that the issue presented herein is not closed and that variability at construction sites could be difficult to be modeled.
Author Contributions
Conceptualization, F.V.; Data curation, F.E.; Formal analysis, F.E.; Investigation, E.C.-P.; Methodology, F.V. and E.C.-P.; Resources, F.E.; Supervision, E.C.-P.; Validation, F.V. and E.C.-P.; Matlab implementation, E.C.-P. Writing—Original draft, E.C.-P.
Funding
This research received no external funding.
Conflicts of Interest
The authors declare no conflict of interest. The founding sponsors had no role in the design of the study; in the collection, analyses, or interpretation of data; in the writing of the manuscript, and in the decision to publish the results.
Abbreviations
The following abbreviations are used in this manuscript:
| AGA | Artificial graded aggregate |
| AHP | Analytical hierarchy process |
| CBR | California bearing ratio |
| IP | Plasticity index |
| LL | Liquid limit |
| MDD | Maximum dried density |
| NGA | Natural graded aggregate |
| NLT | Testing standards of the Transport and Soil Mechanics Laboratory of the Public Works Ministry |
| PG-3 | Spanish General Technical Specifications for Roads and Bridge Works |
| PL | Plastic limit |
| STS | Stabilized soils |
| UNE | A Spanish Standard: International Organization for Standardization |
| USCS | American Unified Soil Classification System |
References
- Cetin, A.; Kaya, Z.; Cetin, B.; Aydilek, A.H. Influence of laboratory compaction method on mechanical and hydraulic characteristics of unbound granular base materials. Road Mater. Pavement Des. 2014, 15, 220–235. [Google Scholar] [CrossRef]
- Werkmeister, S.; Dawson, A.R.; Wellner, F. Pavement design model for unbound granular materials. J. Transp. Eng. 2004, 130, 665–674. [Google Scholar] [CrossRef]
- Bilodeau, J.; Dore, G.; Pierre, P. Pavement base unbound granular materials gradation optimization. In Proceedings of the Bearing Capacity of Roads, Railways and Airfields, (BCR2A’09), Champaign, IL, USA, 29 June–2 July 2009. [Google Scholar]
- ASTM, D. Standard Test Method for California Bearing Ratio ( CBR ) of Laboratory-Compacted. ASTM Int. 2014, 1, 1–9. [Google Scholar] [CrossRef]
- Nguyen, B.T.; Mohajerani, A. Prediction of California Bearing Ratio from Physical Properties of Fine-Grained Soils. Int. J. Civ. Struct. Construct. Arch. Eng. 2015, 9, 136–141. [Google Scholar]
- Saaty, T.L. Decision making with the analytic hierarchy process. Int. J. Serv. Sci. 2008, 1, 83–98. [Google Scholar] [CrossRef]
- Pretel, G.B. PG-3: Pliego de Prescripciones Técnicas Generales Para Obras de Carreteras y Puentes; Ediciones Liteam SL: Madrid, Spain, 2001. [Google Scholar]
- Chaddock, B. The Structural Performance of Stabilised Soil in Road Foundations; Thomas Telford: London, UK, 1996. [Google Scholar]
- Escolano, F.; Sánchez, J.R.; Pacheco-Torres, R.; Cerro-Prada, E. Strategies on Reuse of Clayey Expansive Soils as Embankment Material in Urban Development Areas: A Case Study in New Urbanized Zones. Appl. Sci. 2018, 8, 764. [Google Scholar] [CrossRef]
- UNE-EN-932-1. Spanish Standard UNE-EN 932-1. Test for General Properties of Aggregates. Part 1: Methods for Sampling; AENOR: Madrid, Spain, 1997. [Google Scholar]
- UNE-EN-932-2. Spanish Standard UNE-EN 932-2. Test for General Properties of Aggregates. Part 2. Methods for Reducing Laboratory Samples; AENOR: Madrid, Spain, 1999. [Google Scholar]
- UNE-EN-933-1-A1. Spanish Standard UNE-EN 933-1/A1. Test of Geometrical Properties of Aggregates. Part 1: Determination of Particle Size Distribution. Sieving Method; AENOR: Madrid, Spain, 2006. [Google Scholar]
- UNE-EN-103-103. Spanish Standard UNE-EN 103103. Determination of the Liquid Limit of a Soil by the Casagrande Apparatus Method; AENOR: Madrid, Spain, 1994. [Google Scholar]
- Celauro, B.; Bevilacqua, A.; Bosco, D.L.; Celauro, C. Design Procedures for Soil-Lime Stabilization for Road and Railway Embankments. Part 1-Review of Design Methods. Procedia Soc. Behav. Sci. 2012, 53, 754–763. [Google Scholar] [CrossRef]
- Sherwood, P. Soil Stabilization with Cement and Lime. State of the Art Review; Transport Research Laboratory: Wokingham, UK, 1993. [Google Scholar]
- Croft, J. The influence of soil mineralogical composition on cement stabilization. Geotechnique 1967, 17, 119–135. [Google Scholar] [CrossRef]
- Paige-Green, P. Strength and behavior of materials for low-volume roads as affected by moisture and density. Transp. Res. Rec. 2003, 1819, 104–109. [Google Scholar] [CrossRef]
- Pasetto, M.; Baldo, N. Recycling of steel slags in road foundations. Environ. Eng. Manag. J. 2010, 9, 773–777. [Google Scholar] [CrossRef]
- Pasetto, M.; Baldo, N. Experimental analysis of hydraulically bound mixtures made with waste foundry sand and steel slag. Mater. Struct. 2015, 48, 2489–2503. [Google Scholar] [CrossRef]
- UNE-EN-103-502. Spanish Standard UNE-EN 103502. Test Laboratory Method for Determining in a Soil the CBR Index; AENOR: Madrid, Spain, 1995. [Google Scholar]
© 2018 by the authors. Licensee MDPI, Basel, Switzerland. This article is an open access article distributed under the terms and conditions of the Creative Commons Attribution (CC BY) license (http://creativecommons.org/licenses/by/4.0/).


