Article

Experimental Study of Extracting Weak Infrared Signals of Rock Induced by Cyclic Loading under the Strong Interference Background

1
Key Laboratory of Ministry of Education on Safe Mining of Deep Metal Mines, Northeastern University, Shenyang 110819, China
2
School of Resources and Civil Engineering, Northeastern University, Shenyang 110819, China
*
Author to whom correspondence should be addressed.
Appl. Sci. 2018, 8(9), 1458; https://doi.org/10.3390/app8091458
Submission received: 1 June 2018 / Revised: 22 July 2018 / Accepted: 18 August 2018 / Published: 24 August 2018

Abstract

:
To understand the possibility of monitoring the crustal stress and tectonic activities via satellite remote sensing technology, an experimental study focused on the thermal infrared variation was performed for cyclic loaded rock in the outdoor condition with two types of strong interference background. The stress-induced infrared radiation was extracted using wavelet analysis. The results showed that due to the significant effect of the ambient temperature, the weak stress-induced infrared signal was indistinguishable from the original infrared radiation. However, after wavelet decomposition, the infrared radiation concurrent with the change in stress became clear, and the correlation coefficient with the stress increased significantly with the value of 0.91 after decomposition. Additionally, the amplitude of the extracted stress-induced infrared signal was close to the theoretical result, indicating that the wavelet analysis method can extract the weak infrared signals induced by cyclic loading in the background of strong interference to some degree. The results provide an experimental basis and ideas for monitoring crustal stress and tectonic activities using thermal infrared remote sensing.

Graphical Abstract

1. Introduction

Crustal stress is one of the most important properties of the crust, and it is closely related to various geological tectonic phenomena (including shallow earthquakes) as well as the accompanying physical phenomena in the surface and internal crust. Detecting the crustal stress condition and distribution is the basis for solving scientific problems relevant to geodynamics. Currently, most crustal stress monitoring methods adopted are contact-type and scattered, which are not usable for monitoring the crustal stress field in a large area, and the identification of potential catastrophes is limited. Since the 1980s, the rapid development of satellite technology has led to significant developments in seismic monitoring and geological disaster research. The satellite technology, including Global Navigation Satellite System (GNSS) [1], Synthetic Aperture Radar Interferometry (InSAR) [2,3], Gravimetry [4], and Remote Sensing (RS), has been used to detect crustal activity and to identify the relationship between anomalies and fault activities. In 1988, Gorny et al. observed thermal infrared radiation (TIR) anomaly phenomena before a strong earthquake in Central Asia and set the stage for using satellite thermal infrared remote sensing to detect pre-earthquake thermal anomalies [5]. Since then, this phenomenon has been repeatedly verified all over the world [6,7,8,9,10,11,12,13,14]. The positive temperature anomaly has become well known because of the frictional heating that occurs during earthquake faulting [15,16]. Using not only the frictional heat, Ma et al. [17,18,19,20] proposed a new method of using TIR data from satellites to investigate fault activities and performed experimental studies on the evolution characteristics of TIR in response to stress changes on fault-bearing samples. The use of thermal infrared remote sensing for monitoring pre-earthquake anomalies has become a popular topic in seismic research.
The temperature response properties associated with stress changes in rocks are key to improving understanding of temperature anomalies. To reveal the internal mechanisms of this phenomenon, the TIR observation experiments for loading rocks were conducted. Geng et al. [21] performed TIR observations of 34 rock samples with 26 types of lithology under uniaxial compression. They found that the infrared radiant temperature changes with stress during the rock-loading process and proposed a new method of detecting the stress state and rock stability with the concept of remote sensing rock mechanics (RSRM). Wu et al. [22,23,24] conducted wide research on the spatiotemporal evolution characteristics and anomalous precursors of TIR for loaded rocks under different stress conditions; two main thermal effects were proposed for explaining the experimental phenomenon. One is the thermoelastic effect, which is present throughout the entire loading process [20,25]; the other one is the frictional–thermal effect, which only occurs during microfracturing and fracturing stage [26,27,28,29]. Therefore, the stress condition and fracture process of loaded rock can be monitored in the experimental condition. The infrared thermography has been widely employed for the analysis of the instability process for rock engineering [30,31,32].
However, studies have shown that the TIR changes induced by the thermoelastic effect during loading are relatively small with the increasing temperature rate of approximately 3 mK/MPa under the normal temperature and pressure conditions [22,23,24,25]. Additionally, the wavelength features in the spectral radiance change for loaded rocks were observed and can be used for stress monitoring [33,34,35,36,37]. The TIR change in the loading process is caused by both the physical temperature and emissivity change. The crustal stress condition could be evaluated by the emissivity change based on the accurate acquisition of stress-related TIR information [38]. However, for satellite-based TIR observations, the stress-induced thermal radiation intensity is relatively weak compared with weather-induced changes and influenced by multiple factors. Therefore, it remains a challenge to extract the stress-induced TIR information under a strong interference background and detect crustal tectonic activity.
Based on the above purpose, the study was performed to explore the possibility of extracting stress-induced weak TIR signals under a strong interference background in the experimental condition. We also considered the periodic stresses that are commonly encountered in crustal and rock engineering, including periodic changes in the tidal forces due to celestial bodies [39,40,41], the effects of repeated loading and unloading of the dam basement during drainage [42], and the effects of cyclic loading due to explosions on open mine slopes and reserved pillars [43]. In addition, studies have shown that seismic activities are periodic [44,45,46]. Therefore, the cyclic loading method is adopted to observe the TIR changes for the rock using an infrared thermal imager and to extract the relationship between the TIR change and stress. Considering the temporal features of stress change, the wavelet analysis method is performed to decompose the original TIR signals and to extract the relatively weak TIR related to stress in the strong interference background. The results could provide an experimental basis for monitoring crustal stress, mining, and rock engineering via thermal infrared remote sensing.

2. Materials and Methods

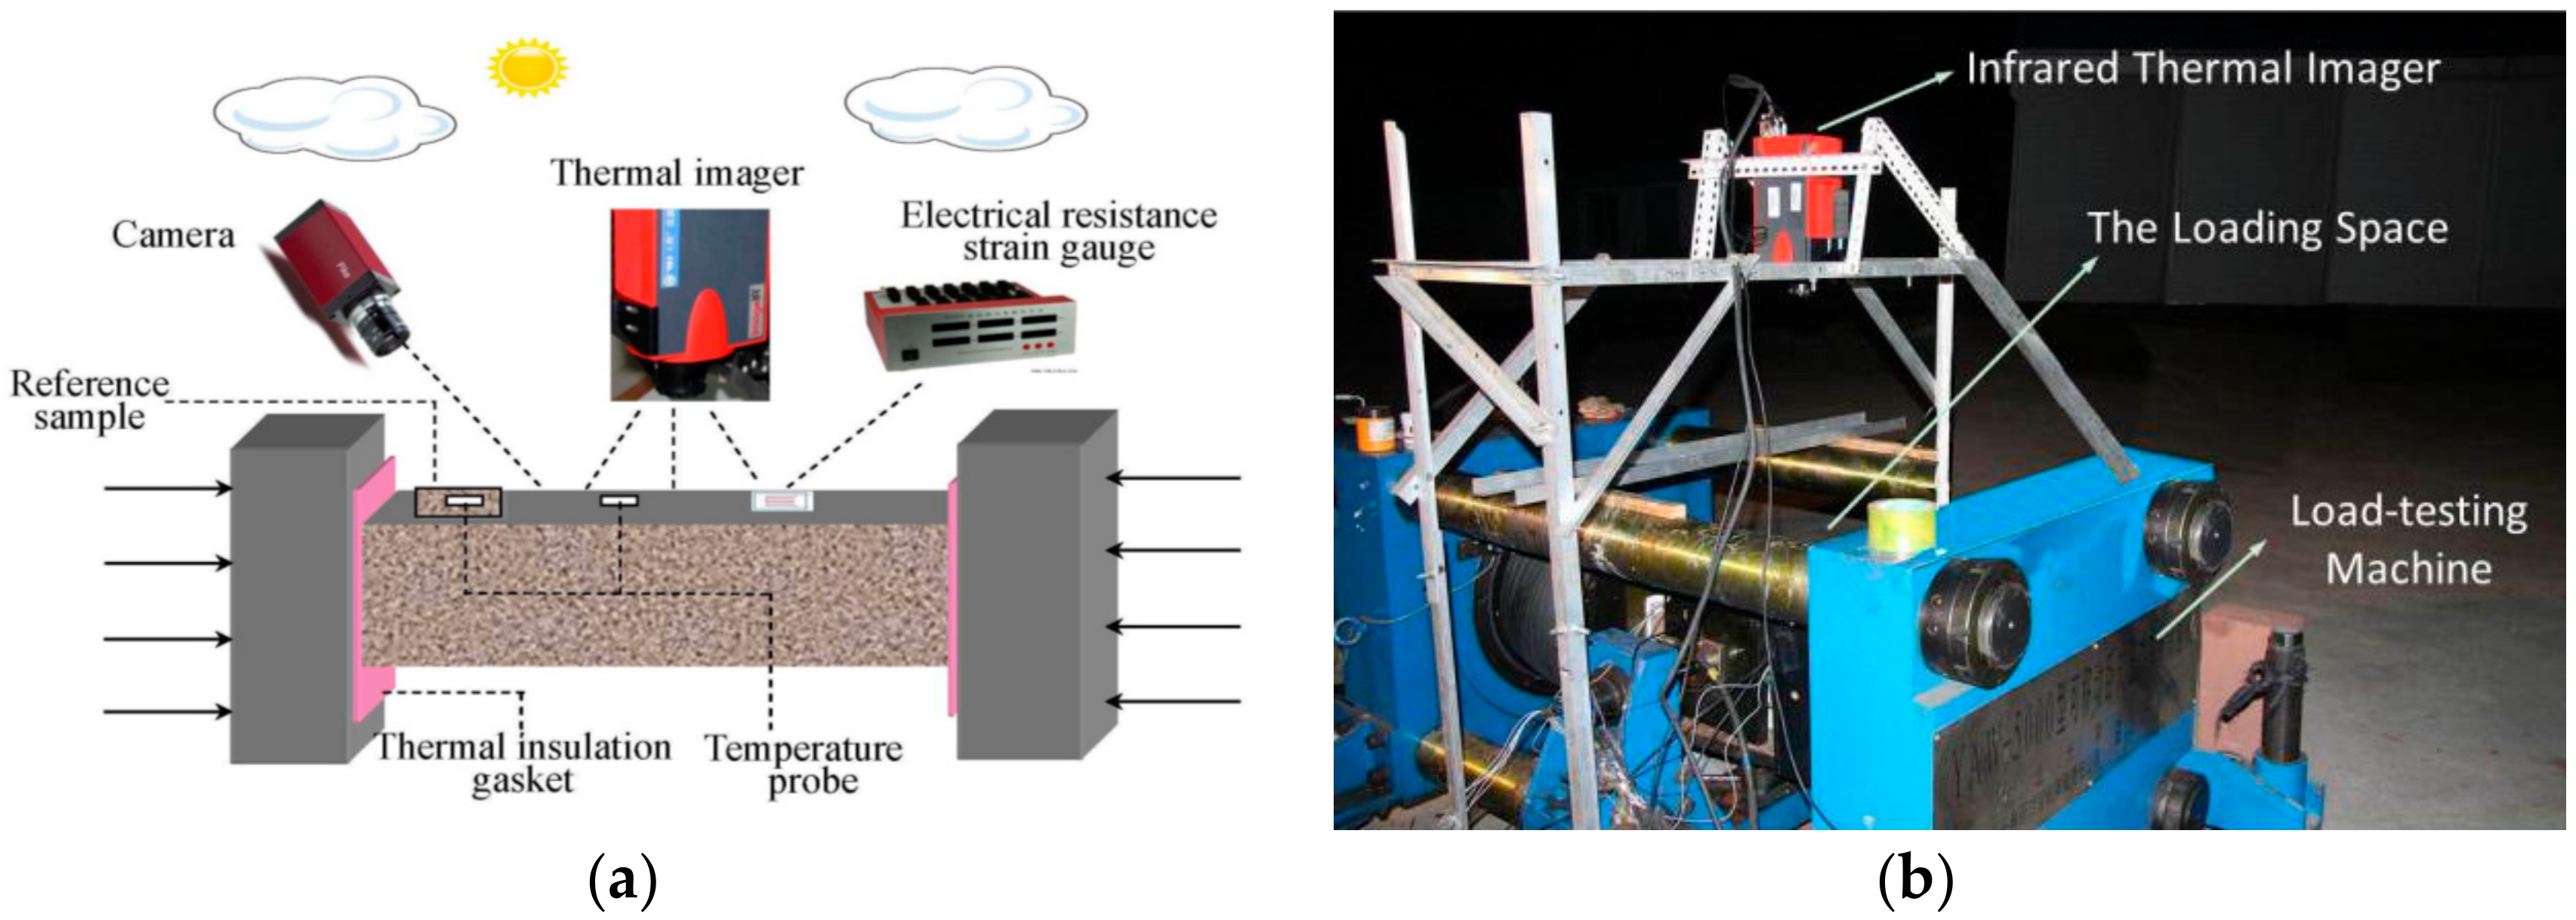
2.1. Experimental System

To simulate the actual satellite-based observations, it is necessary to observe the TIR change from the loaded rock in the outdoor condition. The experimental system for microwave and thermal infrared spectral radiation observations for horizontal loaded rock has been established in the outdoor condition [37,38,47]. Apart from the moveable load-testing machine, the multichannel temperature tester with Pt1000 probes, and the video camera in the system, an infrared thermal imager and an electrical resistance strain gauge were added.
The infrared thermal imager ImageIR 3350, designed by the InfraTec Company, Germany, was used to detect the TIR variation of the sample surface during the loading process. The thermal infrared radiant energy of the target can be transferred into the electronic signal and recorded by the infrared thermal imager. Then, the spatial distribution field of the thermal radiant energy can be shown on the thermal infrared image [26,48]. The images were recorded over the range of 3.7–5.0 μm at a spatial resolution of 320 × 240 pixels with an Indium Antimonide (InSb) detector. The noise equivalent temperature difference (NETD) was better than 25 mK at ambient temperature condition of 25 °C, and the acquisition rate was 10 frames per second (fps).
An electrical resistance strain gauge was used to detect the strain data in the cyclic loading process. The strain measuring range was 0–±38,000 με with the resolution of 1 με, and the accuracy was better than 0.1%.

2.2. Experimental Environment

In this paper, the change in ambient temperature was considered in both the daytime and the nighttime for three days from ’Day 1’ to ‘Day 3’. To confirm the influence of the water vapor, the relative humidity of the atmosphere during the experiment was measured with the value in the range of 25–45% in the daytime and at night. Two types of observational conditions were designed.

2.2.1. Monotonic Changes in the Ambient Temperature

In this condition, the experiments were conducted at night and the weather chosen was breezy. The ambient temperature change was in the range of 18–21 °C and there was a monotonic ambient temperature change. This type of environmental condition was briefly named as ‘EM1’.

2.2.2. Fluctuations in Ambient Temperature

The experiments were conducted during both the day and night when the air temperature fluctuates. The fluctuation at night is mainly affected by the wind, whereas the fluctuation in the daytime is mainly due to intermittent sunshine caused by discontinuous clouds. The ambient temperature change in the daytime was in the range of 22–26 °C. This type of environmental condition was briefly named as ‘EF2’.
The experimental environments corresponding to the specific samples are listed in Table 1.

2.3. Experimental Method

Granite and quartz sandstone are widely distributed on the ground, and they belong to igneous rock and sedimentary rock, respectively. Therefore, both of these types of rocks were selected as the representative experimental samples. All the samples were cut into cuboids with the dimensions of 10 × 10 × 20 cm3 and the top and bottom faces of each sample were parallel within an error of 0.1 mm. The specific processing parameters of the samples are shown in Table 1.
Firstly, the cyclic loading mode was adopted for three times. The parameters of the loading process are listed in Table 1. The infrared thermal imager was placed perpendicular to the sample to observe the TIR changes at a distance of 80 cm. In addition, a small piece of similar rock was placed near the loaded sample as a reference sample to record the ambient temperature [49,50]. The temperature probes were attached to the rock surface with adhesive material to record temperature data during the loading process. Both of the two temperature probes were placed on the left and right side at the distance of 6 cm to the centre of the sample surface. As the environment changed in the daytime, the digital camera was arranged around the loading sample to record the changes in the sunlight irradiation over the sample’s surface. To reduce heat conduction from the loading ends to the sample, two 1-mm-thick sheets of polytetrafluoroethylene (PTFE) pads were placed between both the loading ends and the sample. Static observations (more than 5 min) were performed to ensure that all the instruments were stable and the data were recorded simultaneously. The outdoor experimental scene and the schematic of the instrument arrangement are shown in Figure 1a,b.

2.4. Data-Processing Method

2.4.1. Difference Processing

The TIR change caused by stress is an energy conversion process in which part of the mechanical energy is converted to infrared radiation. The average infrared radiant temperature (AIRT) can reflect the overall TIR intensity of the loaded sample surface. To extract the changes in TIR intensity related to the stress accurately and to reduce the influence of the environmental and instrumental noise, the difference method was performed firstly [38,47,49]. The thermal infrared image at the initial moment was selected as the reference image, and the entire thermal images during the loading process were subtracted from the reference image. Then, the AIRT difference (ΔAIRT) at each moment could be calculated during the loading process.

2.4.2. Wavelet Analysis

Wavelet analysis is a time–frequency analysis method developed from the Fourier transform in the 1980s, with the significant features of self-adaptivity and mathematical microscopy. It essentially splits signals into multiple scales via shifting and scaling of the wavelet basis function [51,52]. A given wavelet function h(x) is transformed to the following after expansion and shifting:
h j , k   ( x ) = 2 j / 2 h ( 2 j x k )
where j is the scale coefficient and k is the shift coefficient. The smaller scale corresponds to the higher frequency and vice versa. At an arbitrary scale, the wavelet transformation can be expressed as follows:
C ( j , k ) = h j , k   ( x ) , f = 2 j / 2 h j , k ( x ) ¯ f ( x ) d x
where C(j, k) is the wavelet coefficient and h j , k ( x ) ¯ is the complex conjugate of hj,k(x).
For a square-integrable function L2(R), any given signal f(x) ∈ L2(R) can be decomposed into different frequency bands by scale as follows:
f ( x ) = j , k =   C ( j , k ) h j , k ( x ) = + g 1 ( x ) + g 0 ( x ) + g 1 ( x ) + + g j ( x ) +
where gj(x) is the component of f(x) at scale j. If h is an orthogonal wavelet, the components of Equation (3) are orthogonal, i.e.,
g i ( x ) , g j ( x )   = 0 ( i j )
where <gi(x), gj(x)> denotes the inner product of the two components gi(x) and gj(x). If it is 0, then the components are not related and can be arbitrarily combined without being affected by other components. The wavelet analysis method has been a common signal-processing method to extract weak signals from strong noisy backgrounds, and it is applied to many practical applications [53].
During the experiment, the TIR from the rock surface is affected by the atmosphere, the sun, and stress, etc. In terms of frequency, there are three main, significant components [17,18,19]: (1) high frequency: the frequency of TIR changes in this component is larger than that of the stress, which is mainly related to the fluctuant change of the environment and the instrumental noise; (2) middle frequency: the frequency of TIR changes is consistent with that of the stress, which indicates that the TIR changes are induced by stress; (3) low frequency: the frequency of TIR changes is smaller than that of the stress, and the TIR changes are mainly in response to the continuous and slow changes in the environment in a relatively long period [53,54]. Considering the above frequency characteristics, the ΔAIRT signals during rock loading can be divided into three components, as shown in Equation (5):
Δ AIRT = Δ AIRT   high + Δ AIRT mid + Δ AIRT low
where ΔAIRT is the original AIRT change and ΔAIRThigh, ΔAIRTmid, and ΔAIRTlow denote the components in high, middle, and low frequency, respectively. The orthogonal Coiflet 5 wavelet basis was selected to decompose ΔAIRT. According to the loading period and the sampling frequency of AIRT, the suitable decomposition level for the wavelets is 11. ΔAIRTmid belonged to the detailed component at level 11, and the ΔAIRTlow belonged to the approximation component at level 11. The remaining detailed components from level 1 to 10 belonged to ΔAIRThigh. The absolute error of the postdecomposition synthesis is on the order of 10−9.

2.4.3. Statistical Analysis

Based on the theoretical analysis, it can be inferred that the ΔAIRTmid is the component which is most related to the stress change because the influence of the background and the noise has been removed. To evaluate the effect and accuracy of extracted weak infrared radiation signals induced by stress from the strong interference environment, the following two aspects in temporal and amplitude were taken into consideration:
(1) For the temporal characteristic, as the stress was designed as periodical, the overall trend of ΔAIRTmid should be consistent with that of the stress [47]. Therefore, both the correlation between the ΔAIRT and the stress, and the correlation between the ΔAIRTmid and the stress were analyzed.
(2) For the amplitude characteristic, if the extracted TIR signal was caused by the stress change completely, the amplitude of ΔAIRTmid was consistent with the calculated theoretical result. Therefore, both the maximum amplitudes of ΔAIRT and ΔAIRTmid were analyzed.

3. Results

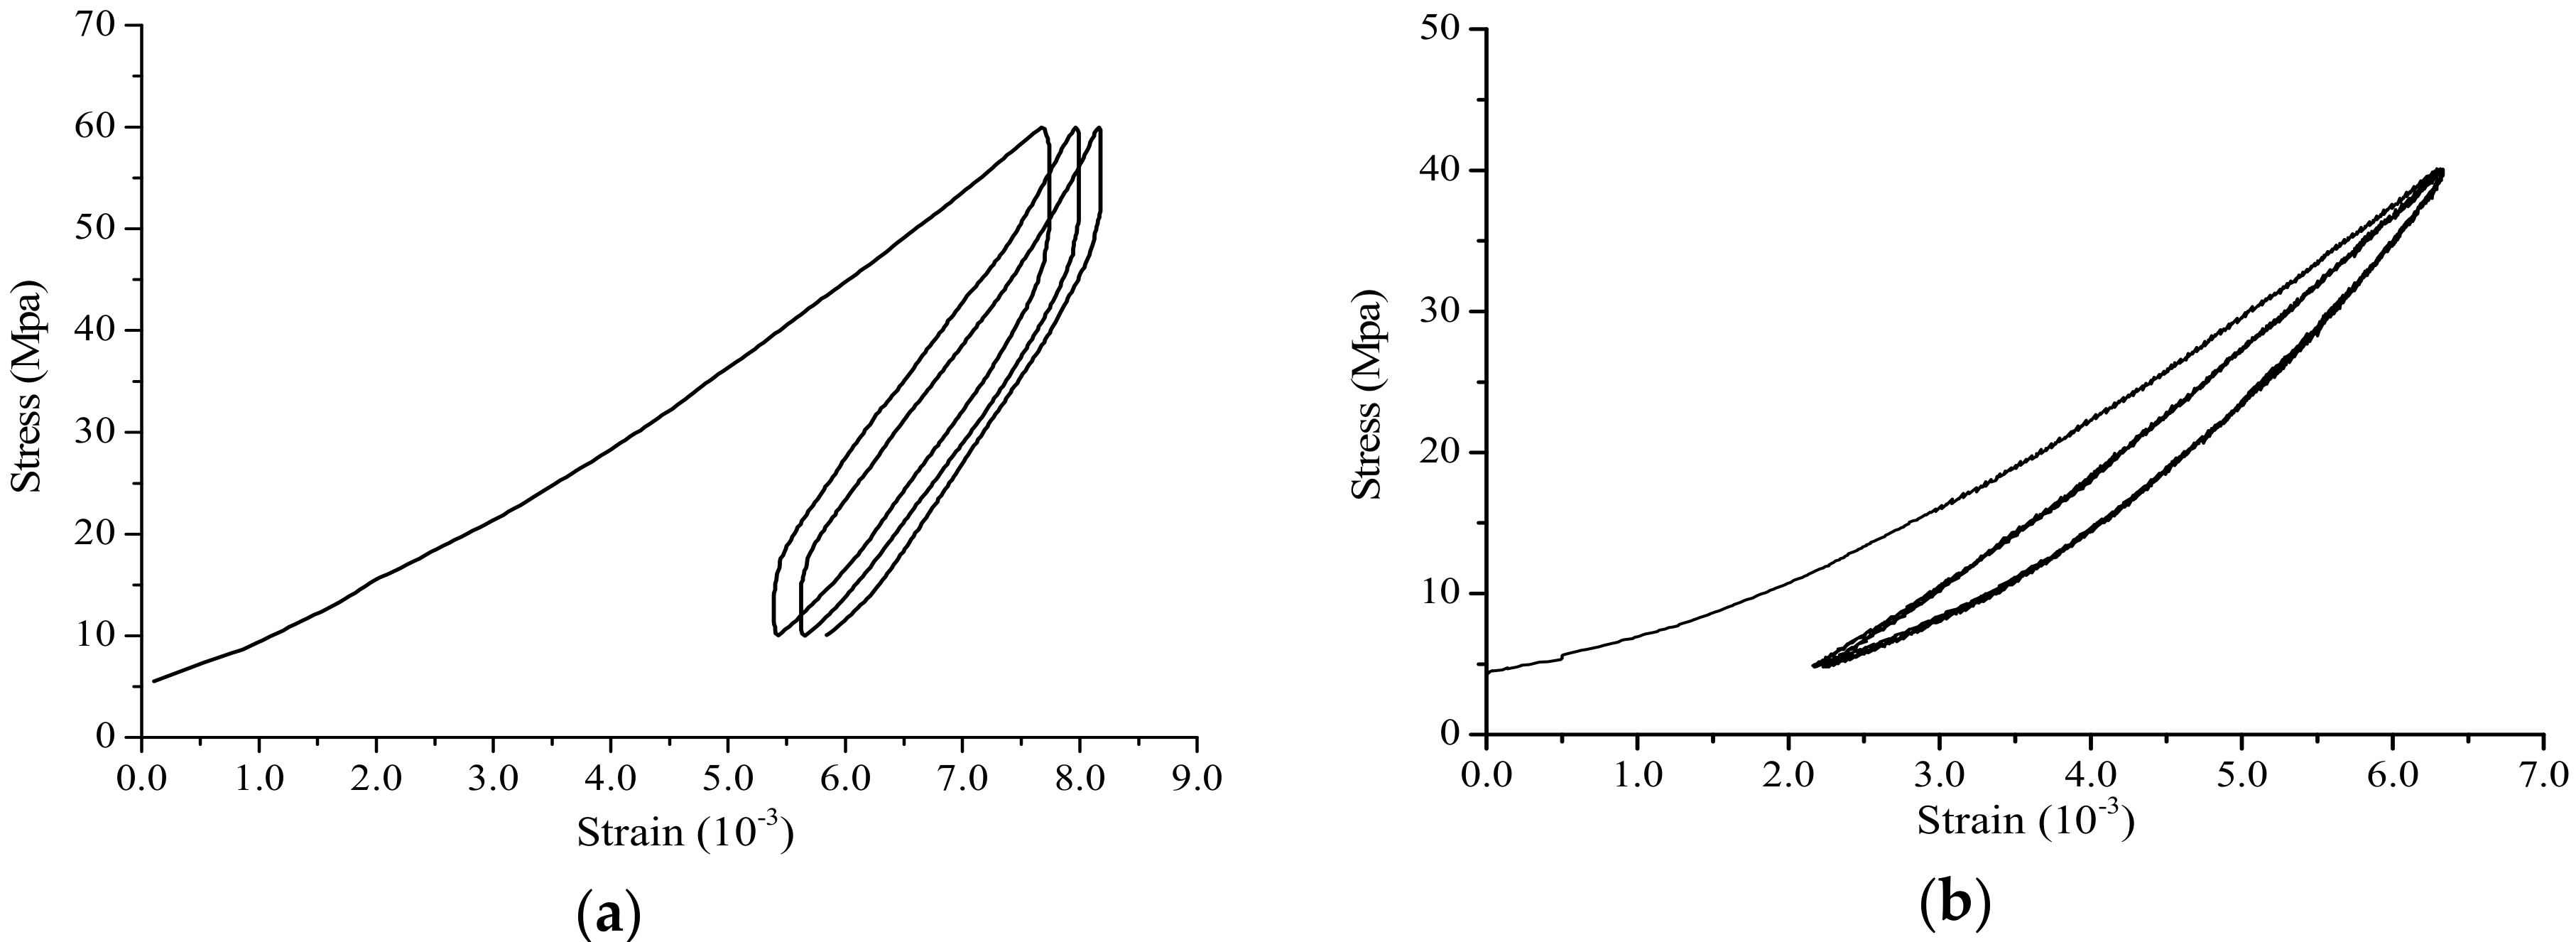
3.1. Stress-Strain Analysis

As the loading processes of samples with the same lithology were similar in the experiment, the typical samples of HG-1 and SY-1 were selected as the examples to describe the stress–strain curves throughout the entire cyclic loading process in Figure 2a,b. The different lithology between the granite and sandstone led to the different shapes in Figure 2. It was found that the paths of rock loading and unloading did not overlap completely. There was a plastic hysteresis loop between the loading and unloading curves. However, except for the first cycle, the area of the hysteresis loop decreased gradually from the second cycle and reached a steady state. This suggested that as the number of cycles increased, the rock’s deformation became more elastic. Therefore, it is more reasonable to select and analyse the experimental results of the last two cycles to get the robust relationship between the ΔAIRT and stress change.

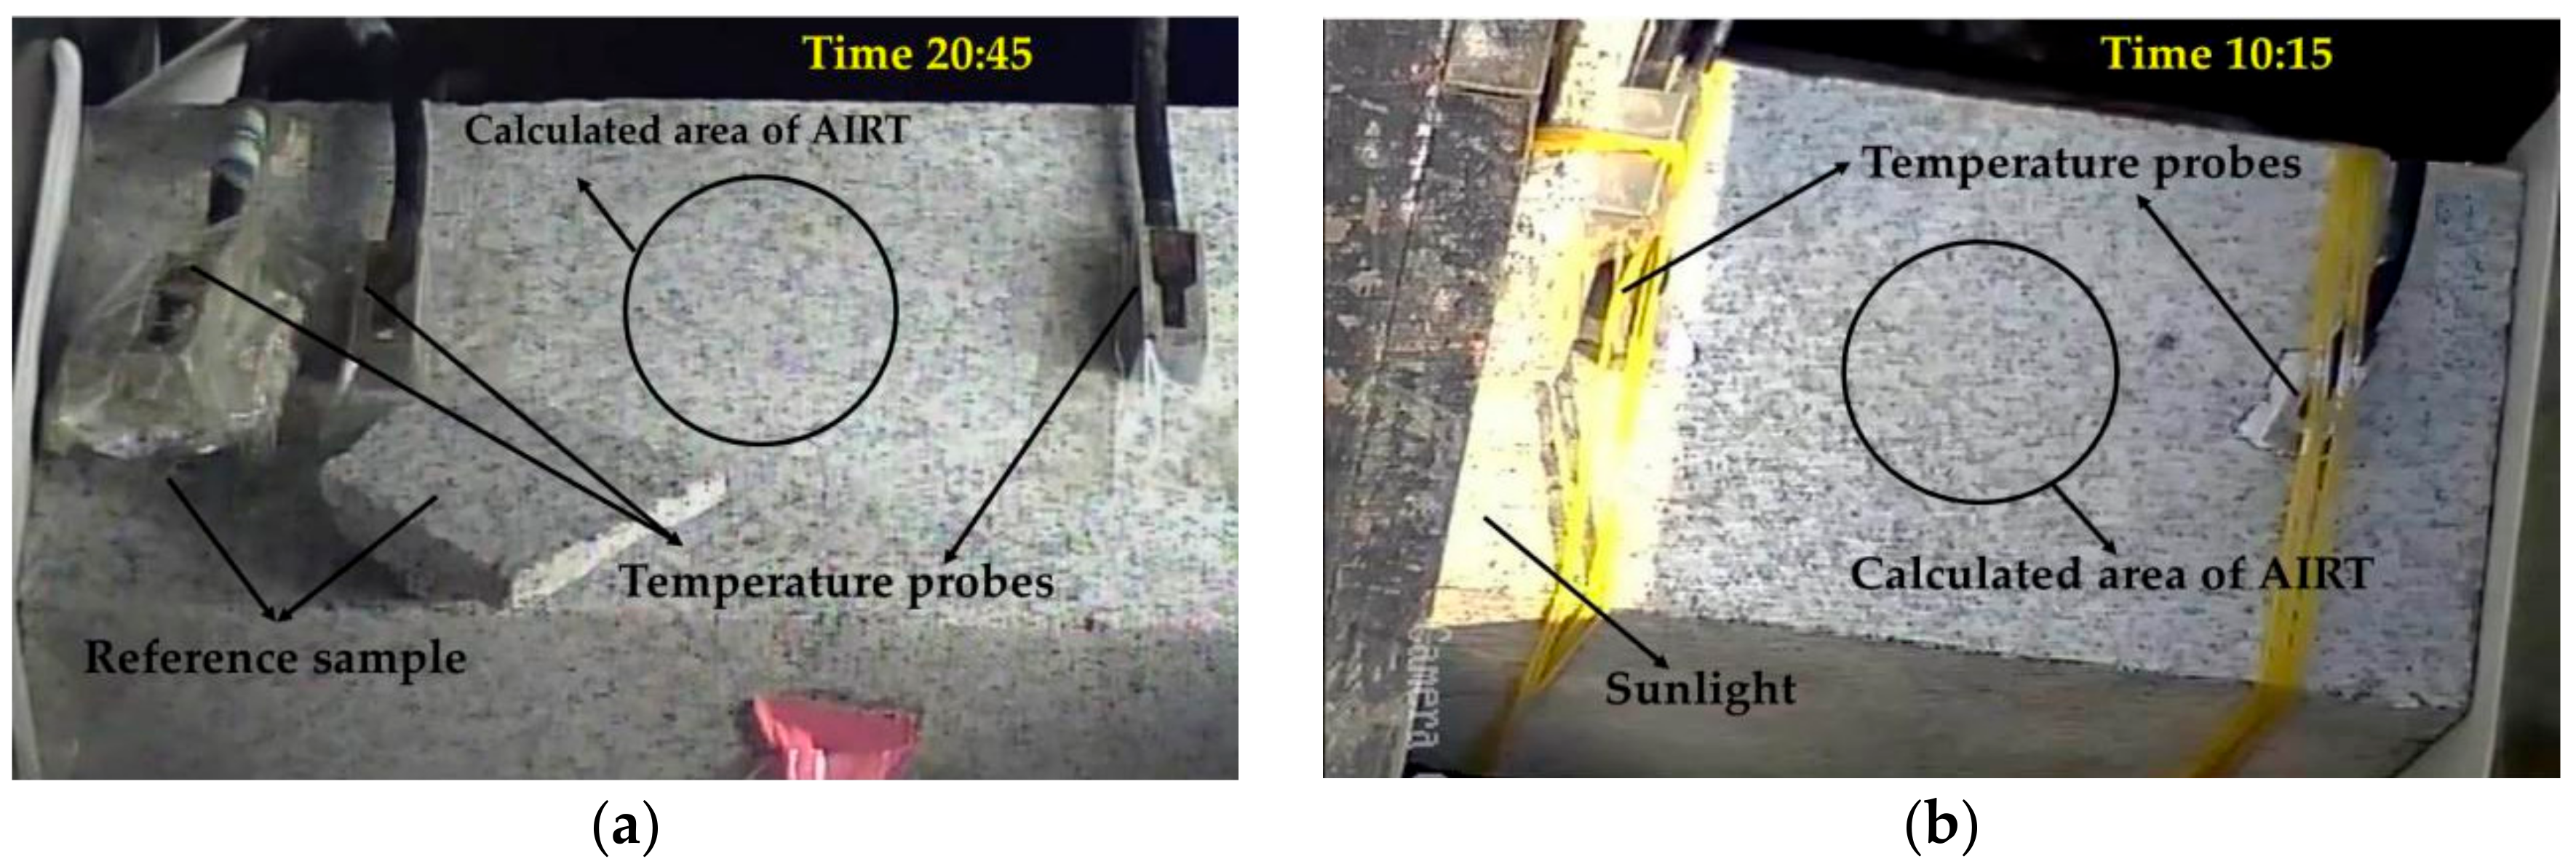
3.2. Photos for Experimental Conditions

The same environmental conditions could lead to similar experimental results. Therefore, the typical sample of HG-1 was selected as the example in ‘EM1’ and the sample of HG-4 was selected to analyze in ‘EF2’. The photos of the samples in the loading space and the arrangement of the temperature probes in these two types of conditions are shown in Figure 3. The observation time in yellow (20:45 in Figure 3a and 10:15 in Figure 3b) indicated the nighttime and daytime with sunlight during the loading process, respectively. The temperature of the reference sample indicated the ambient temperature. The AIRT variation in the black circle area in the middle of the sample surface was selected to extract and calculate without the influence of the temperature probes and the reference sample.

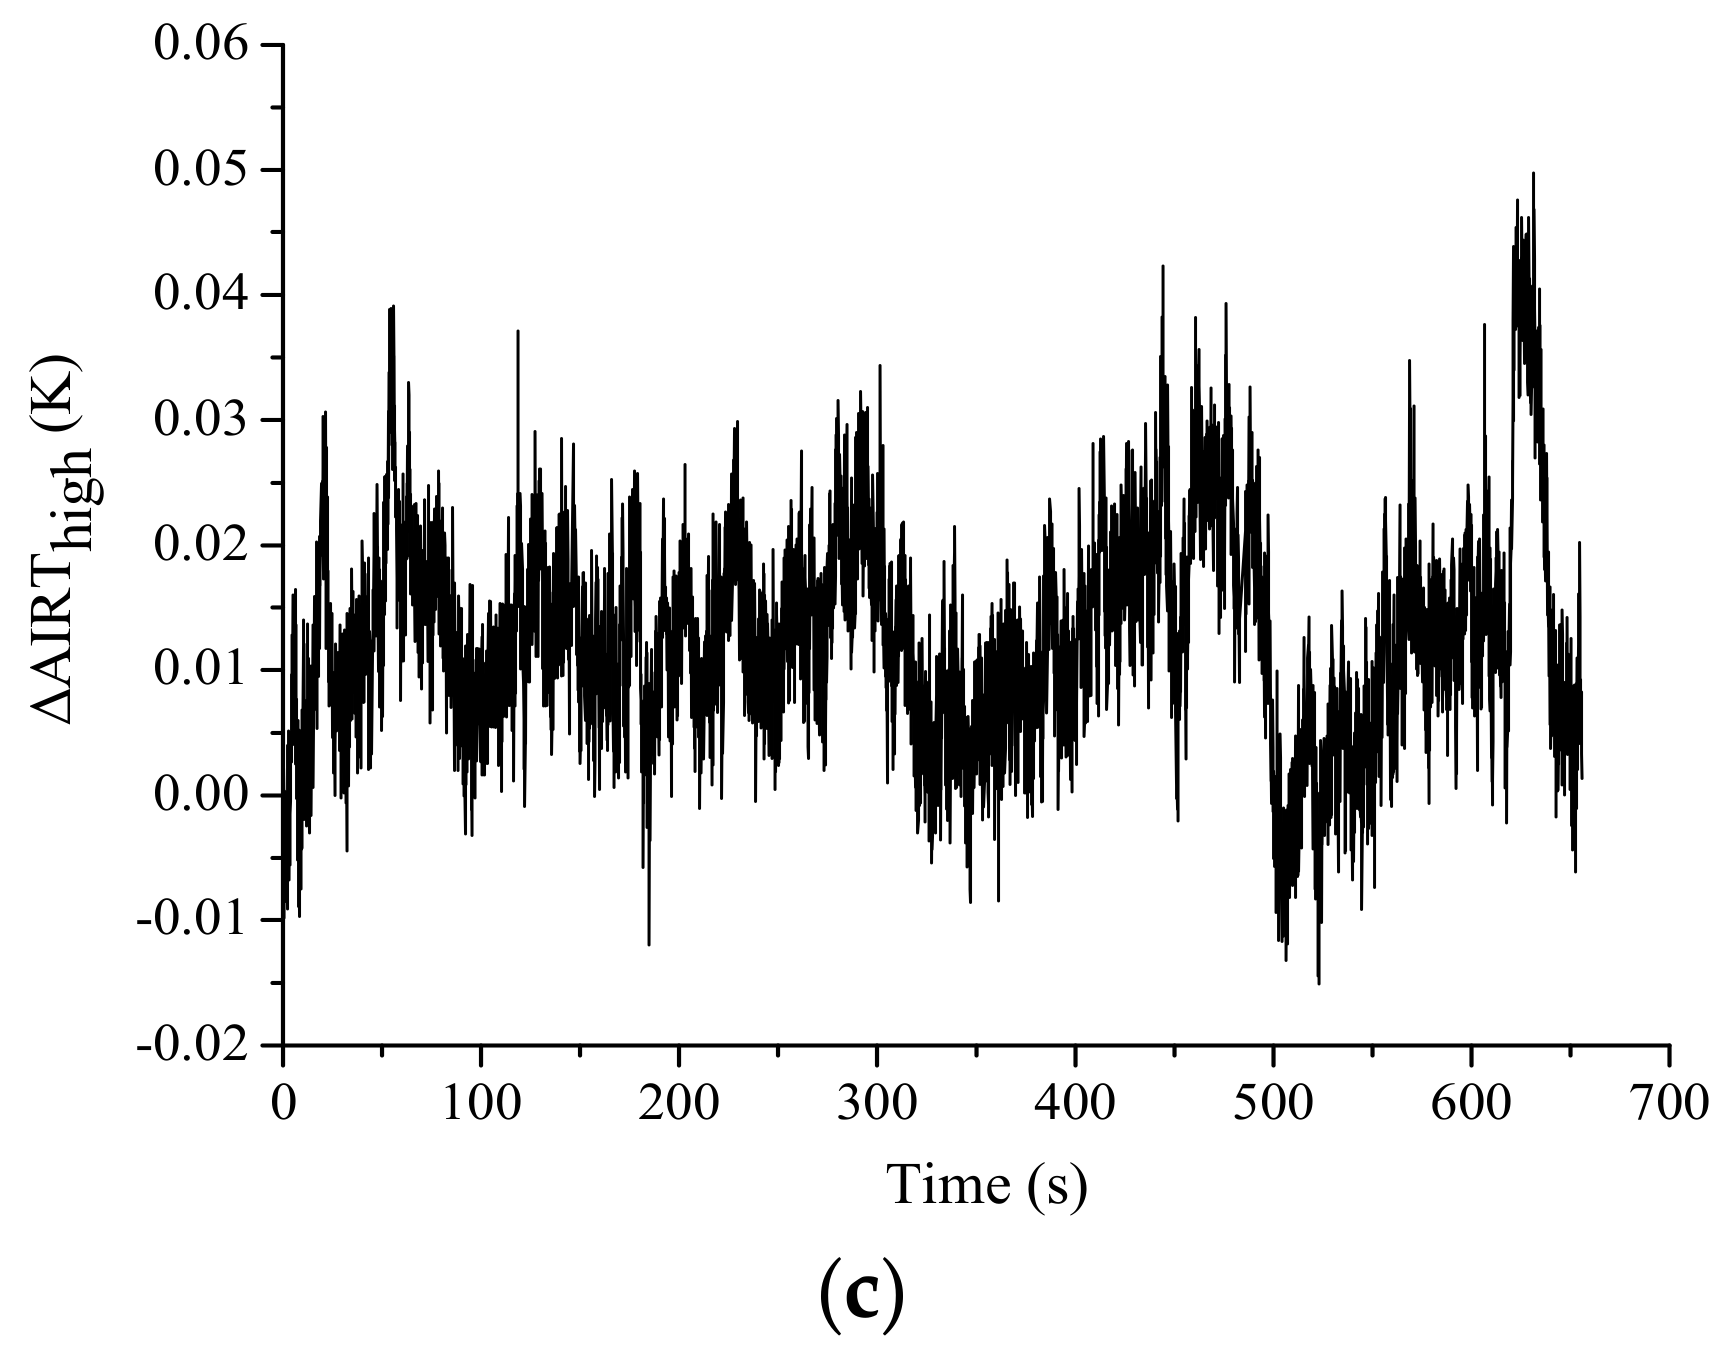
3.3. Temperature Variation and ΔAIRT

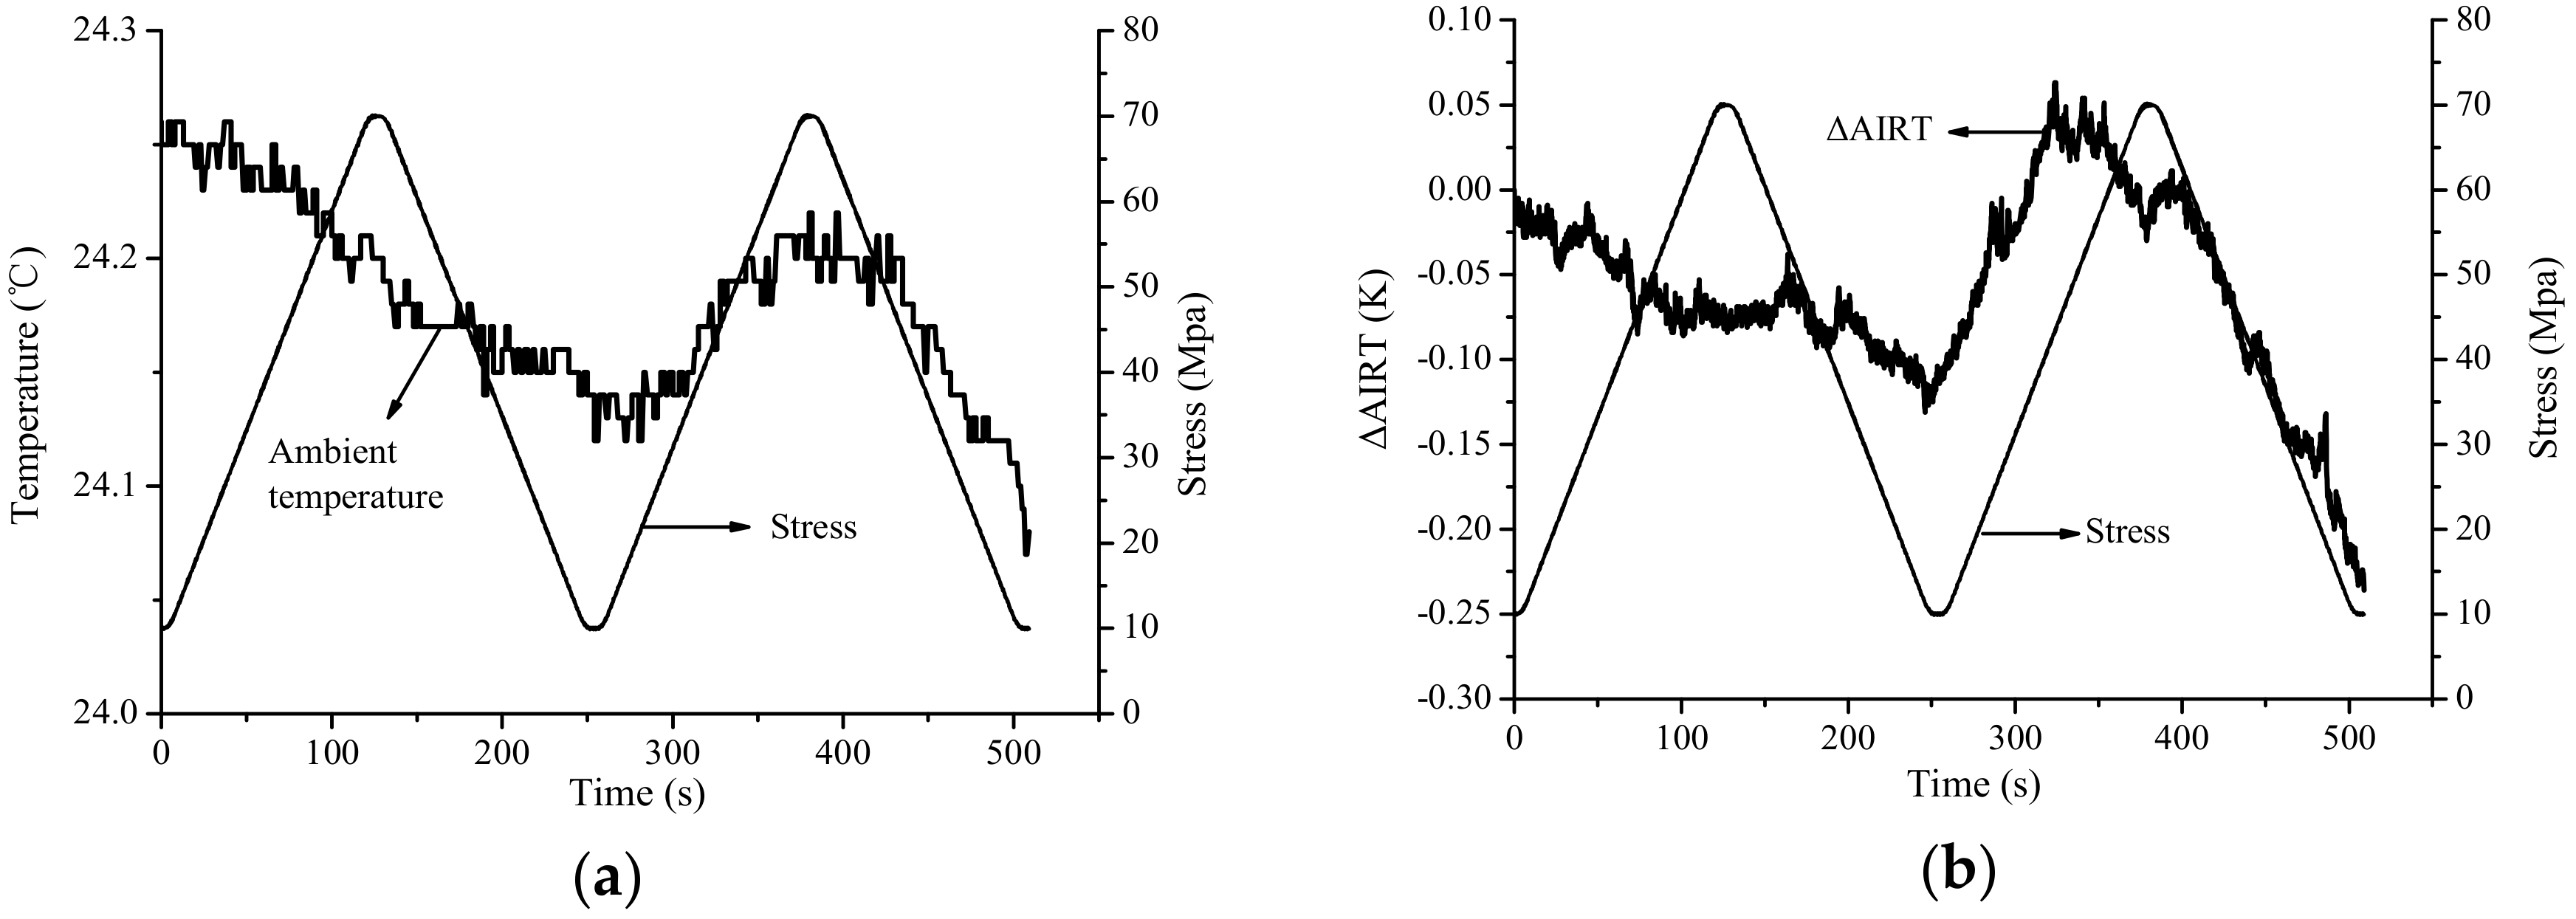
3.3.1. Results in ‘EM1’

The sequences of thermal images for each sample during the loading process were recorded and the ΔAIRT in the black area was calculated. Figure 4a,b illustrates the measured temperature and ΔAIRT results for HG-1. The ambient temperature decreased monotonically throughout the cyclic loading process from 20.35 °C to 20.02 °C at nighttime, with an approximate value of 0.33 °C. The ΔAIRT decreased with fluctuations at a value of approximately 0.27 K as well (in Figure 4b). It was found that there was an approximate cyclic trend on the ΔAIRT curve. In order to extract the cyclic variation trend clearly, the decomposed results denote the ΔAIRTlow, ΔAIRTmid, and ΔAIRThigh plotted in Figure 5a–c, respectively.
Figure 5a shows that the ΔAIRTlow decreased monotonically with a value of 0.27 K, which was consistent with the change in the ambient temperature (Figure 4a). The ΔAIRTlow could be used to represent the change in the ambient temperature. Figure 5b shows that the ΔAIRTmid was consistent with the stress curve with temporal cyclic changes. The maximum amplitude of ΔAIRTmid was 0.05 K, which was only approximately 15% of the change amplitude in the ambient temperature. Figure 5c shows that the ΔAIRThigh changed drastically with large fluctuations. Apart from the influence of the background and stress, the fluctuations of ΔAIRThigh were mainly due to instrumental noise and wind in the range of 0.05 K. The standard error of ΔAIRThigh is about 8 mK, indicating that the experimental condition was relatively stable in ‘EM1’.

3.3.2. Results in ‘EF2’

Figure 6a,b illustrates the ambient temperature curve and ΔAIRT change curve of HG-4 in ‘EF2’. As the experiment was conducted during the cloudy daytime with sunlight on the sample surface (Figure 3b), the intermittent sunshine caused by discontinuous clouds led to the decrease–increase–decrease trend on the curve with a maximum change of up to 0.19 °C.
It is noted that the sunlight could lead to the temperature and ΔAIRT change in two aspects: one is the ambient temperature change directly; the other one is the heat conduction from the left irradiated side (with sunlight in Figure 3b) to the central calculated area. Therefore, the ΔAIRT fluctuated with the similar trend of temperature change. The maximum amplitude of ΔAIRT was 0.29 K and there was no visible cyclic characteristic. The weak stress-induced infrared radiation signal was completely submerged by the ambient temperature change.
The decomposed results of ΔAIRT in each frequency component are plotted in Figure 7a–c, respectively, as well. The ΔAIRTlow shows a similar trend with that of the ambient temperature. The trend of ΔAIRTmid was consistent with the stress curve in period as well with the maximum amplitude of 0.076 K in Figure 7b, which is approximately 40% of the amplitude of the ambient temperature change (0.19 K). Figure 7c shows that the ΔAIRThigh changed with large fluctuations due to instrumental noise, wind, and sunlight in the range of 0.1 K. The standard error of ΔAIRThigh is about 15 mK, indicating that the experimental condition was relatively more complex than that in ‘EM1’.

3.4. Statistical Results

The correlation coefficients and the maximum amplitudes of ΔAIRT and ΔAIRTmid were calculated and are listed in Table 2. It is found that the correlation coefficients between original ΔAIRT and the stress were poor with the maximum value less than 0.6. However, the correlation coefficients between the decomposed ΔAIRTmid and the stress increased significantly with the minimum value larger than 0.8. The average values of correlation coefficient in ‘EM1’ and ‘EF2’ were 0.93 and 0.90, respectively.
According to the maximum amplitude results, the rates of ΔAIRTmid were approximately 0.2–1.6 mK/MPa during the elastic deformation stage in the two experimental environments. This is similar to the results obtained in a stable indoor experimental condition without obvious ambient temperature change [22,23,24,27,28,29].
Therefore, taking both the temporal and amplitude analyses into consideration, the results suggest that it is feasible to extract the infrared radiation signals induced by cyclic stress using wavelet analysis in a strong interference environment.

4. Discussion

4.1. The Relationship between the Change in the TIR and Stress

According to Kelvin’s law [55], there is a thermoelastic effect in response to the elastic stress condition for solid material. The temperature increases as the stress increases and vice versa. The temperature change is proportional to the sum of the principal stress:
Δ T = α T   ρ C p Δ σ
where ΔT is the temperature change (K), Δσ is the change in the sum of the principal stress (MPa), α is the thermal expansion coefficient for solid material (°C−1), ρ is the density (kg/m3), Cp is the specific heat capacity (J/kg·°C), and T is the absolute temperature of a unit object (K). According to the literature [47,54], the values of thermal parameters for sandstone are as follows: α = 7.8 × 10⁻⁶ °C −1, ρ = 2230 kg/m3, and Cp = 710 J/kg·°C. Those for granite are: α = 7.5 × 10⁻⁶ °C−1, ρ = 2640 kg/m3, and Cp = 820 J/kg·°C. According to Equation (6), when the initial temperature of the granite was 20.3 °C, and the main stress variation was 60 MPa, the temperature increase can be calculated as 0.061 K. For sandstone, when the main stress variation was 35 Mpa, the temperature increased by 0.051 K. The increasing rate of ΔAIRTmid for sandstone is higher than that for granite. Figure 4a and Figure 6a show that the amplitude of ambient temperature change was about 0.2 K, and that the amplitude of ΔAIRTmid was only 15–40% of the ambient temperature. It was relatively weak compared to the ambient temperature.
Equation (6) shows that the TIR intensity variation is inferred to be linearly correlated with the change in stress. The experimental results showed that the ΔAIRTmid changed consistently with the change in stress with the average correlation coefficient larger than 0.9. As there was no cyclic component with the same period of stress change during the loading process, it can be inferred that the ΔAIRTmid was caused by the stress change.

4.2. The Relationship between AIRT and Physical Temperature

According to the Stefan–Boltzmann’s law, the object’s radiant energy can be expressed as:
M ( T ) = ε e T 4  
where M(T) is the radiant exitance (W·m−2), ε is the emissivity in the range of 0–1, e is the Stefan–Boltzmann constant, and T is the physical temperature (K). For blackbody, the radiant temperature is equal to T. For an actual object, the relationship between the two temperatures is:
T s = ε 1 / 4   T
where Ts is the radiant temperature (K). Based on the TIR theory, the TIR intensity changes linearly with the physical temperature change with the correlation coefficient greater than 0.99, and it was confirmed by the experimental results in the laboratory condition with slight changes in ambient temperature [35,36]. As the emissivity is less than 1, the value of radiant temperature change is lower than that of the physical temperature, though both of the temperatures could be used to represent the thermal change. Figure 4a shows that the ambient temperature change was 0.33 K, whereas the ΔAIRTlow was 0.27 K (Figure 5a). Similarly, the ambient temperature change in Figure 6a was 0.19 K, whereas the ΔAIRTlow was 0.17 K (Figure 7a). When taking the emissivity of the rock samples (ε ≈ 0.9) into consideration, the two temperatures were generally consistent according to Equation (8). It is noted that the emissivity of the rock was changed obviously in the stress condition in the range of 8.0–10.0 μm [38]. However, as the AIRT was obtained in the range of 3.7–5.0 μm, the emissivity change was not considered here.

4.3. Significance of the Experimental Results

The experimental results indicated that the amplitude of ambient temperature changes is probably several times or even ten times greater than that of the stress-induced ΔAIRT. The stress-induced infrared signal is completely submerged by the change in ambient temperature. If the stress changes periodically and there are no background radiation signals that are consistent with the period of the stress, the stress-induced TIR signal can be extracted using wavelet analysis. This problem has been investigated by some scholars. Zhang et al. [56] divided the TIR of the land surface into low, medium, and high frequency components when monitoring seismic TIR anomalies before earthquakes. The low and high frequency components represent the radiation due to the Earth’s basic temperature field and the radiation due to rain, clouds, and cold or hot air currents, respectively. Apart from these two components, the medium-frequency component may be related to the crustal tectonic stress. Their studies on the cases of earthquakes showed that TIR anomalies often occur prior to earthquakes with different characteristic periods based on the medium-frequency data in different cases [57,58,59]. Chen et al. [18,19,20] found that the TIR of land surface was closely related to strain on a drilling measured data. Based on long-term monitoring of the bedrock temperature in the Kangding area, the bedrock temperature was strongly correlated with low-level seismic activity and suggested that the drastic change in the bedrock temperature is caused by the stress adjustment. Properties that affect the temperature response of rocks to changes in stress are critical for understanding temperature anomalies in the crust [60,61,62].
Based on the experimental results in this paper, it is possible to extract the stress-induced TIR information using reasonable signal processing methods in the areas with intense neotectonic movement. Additionally, the microwave brightness temperature changes with stress change synchronously [47]. Therefore, the experimental results could provide the foundation for the monitoring of stress and tectonic activity in the crust via remote sensing.

4.4. The Difficulty and Further Improvement

However, it remains difficult to extend the experimental results to the wider scale for satellite RS purposes. The following aspects should be considered:
(1)
The cyclic loading mode and the relatively high loading rate in this study are just one type of crustal stress condition. However, the actual crustal stress conditions are complex and variable, and the loading rate is uncontrollable in reality. Additionally, the wavelet method is not suitable for extracting the TIR signal related to the aperiodic crustal stress from a relatively strong background.
(2)
In addition, most of IR radiation recorded by satellite sensors is emitted by vegetation, soil, and unconsolidated sediments on the Earth’s surface. Moreover, the received radiation is influenced by many nonseismic factors including climate, topography and landscape, geophysics, and geography. It is difficult to observe the TIR signal from the loaded rock on the ground directly.
(3)
The distance between the spectrometer and the specimen is at the level of meters in the experimental condition, which is much less than the orbit height at the level of hundreds of kilometres for satellite observations. The influence of the atmosphere effect is inevitable.
Therefore, it remains challenging to detect the crustal stress from satellite RS observations. The following additional exploration and investigations in the experimental condition and method are considered:
(1)
For the experimental design, the cyclic loading mode at a relative slow rate can be considered to simulate the actual crustal stress condition [46]. In addition, more types of rock samples can be selected to confirm the magnitude of the stress-related TIR signal.
(2)
For the TIR observations, the wavelength features in the spectral radiance change and the emissivity change for loaded rocks were observed [33,34,35,36,37,38]. It is reasonable to conduct the experimental studies based on the TIR signal at different wavebands.
(3)
Considering the limitations of the wavelet method, the new methods for weak signal extraction from strong backgrounds can be adopted in further studies [63,64].

5. Conclusions

To understand the possibility of extracting weak TIR signals from loaded rock in a strong interference background under outdoor conditions, the AIRT signals from the cyclic loaded rock surface in both the monotonic and fluctuant conditions were obtained and analyzed. The study shows the following conclusions:
(1)
The AIRT is strongly influenced by the ambient temperature and environmental radiation. The AIRT related to stress is relatively weak and submerged by the ambient temperature, which cannot be identified directly.
(2)
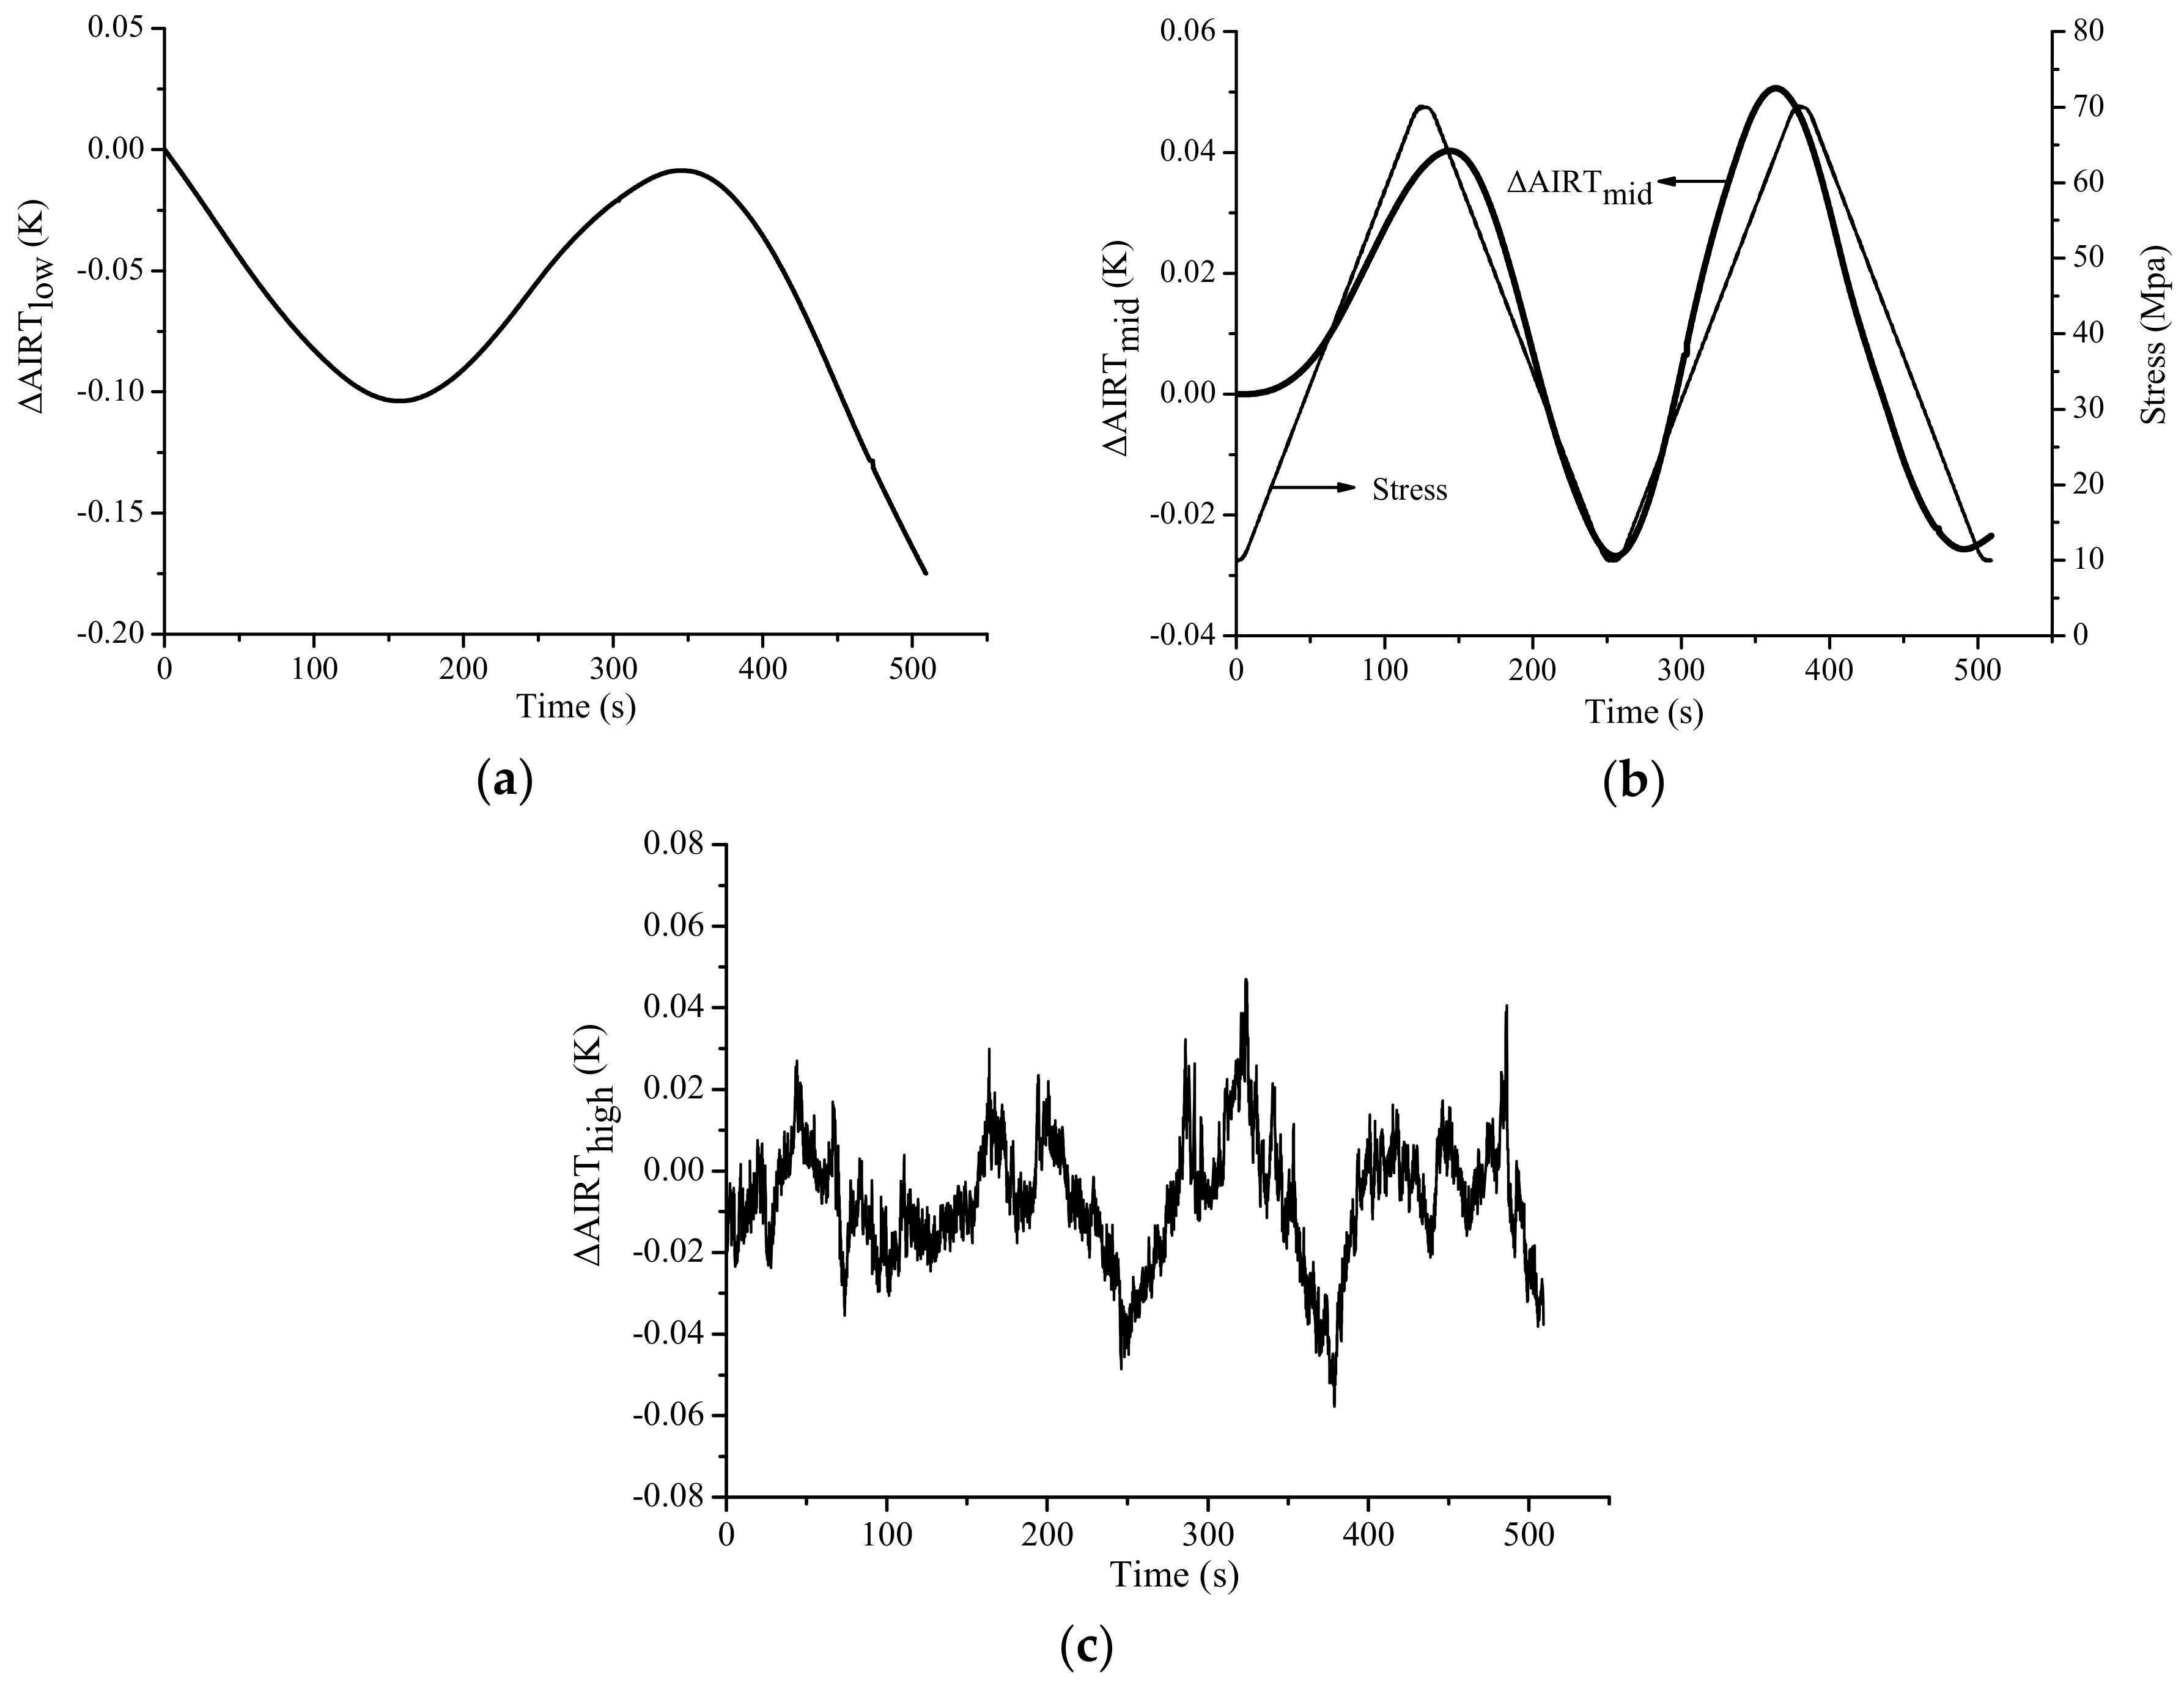
The stress-induced infrared radiation signal from the cyclic loaded rock can be extracted via wavelet analysis method. The correlation coefficient between the decomposed ΔAIRT and stress is larger than 0.8, and the amplitude of the extracted stress-induced infrared radiation is close to the theoretical result. Therefore, it is feasible to extract the weak TIR signals induced by stress in a strong interference background.
The experimental results provide an experimental foundation for crustal stress field monitoring in the strong background and has impact for science. Although the crustal stress monitoring via RS remains difficult and challenging, this work is still worthy of exploration.

Author Contributions

All of the authors contributed extensively to the present paper. S.L. conceived and designed the experiments; Q.N., W.M., and X.G. helped perform the experiments; J.H., S.L., and Q.N. processed and analyzed the data; Q.N. wrote the first draft; S.L. and J.H. revised the manuscript extensively.

Funding

This research was funded by the [National Natural Science Foundation of China] grant number [41,440,032] and [41,771,404].

Acknowledgments

The authors thank K. Zhao, Northeast Institute of Geography and Agro-ecology, Chinese Academy of Sciences, for his help on the experimental design and field.

Conflicts of Interest

The authors declare no conflict of interest.

References

  1. Shi, C.; Lou, Y.; Zhang, H.; Zhao, Q.; Geng, J.; Wang, R.; Fang, R. Seismic deformation of the 8.0 Wenchuan earthquake from high-rate GPS observations. Adv. Space Res. 2010, 46, 228–235. [Google Scholar] [CrossRef]
  2. Chen, S.W.; Wang, X.S.; Sato, M. Urban Damage Level Mapping Based on Scattering Mechanism Investigation Using Fully Polarimetric SAR Data for the 3.11 East Japan Earthquake. IEEE Trans. Geosci. Remote Sens. 2016, 54, 6919–6929. [Google Scholar] [CrossRef]
  3. Luo, H.P.; Chen, T. Three-Dimensional Surface Displacement Field Associated with the 25 April 2015 Gorkha, Nepal, Earthquake: Solution from Integrated InSAR and GPS Measurements with an Extended SISTEM Approach. Remote Sens. 2016, 8, 559. [Google Scholar] [CrossRef]
  4. Sun, W.; Miura, S.; Sato, T.; Sugano, T.; Freymueller, J.; Kaufman, M.; Larsen, C.F.; Cross, R.; Inazu, D. Gravity changes during the Alaska earthquake. J. Geophys. Res. 2010, 115, B12406–B12423. [Google Scholar] [CrossRef]
  5. Gorny, V.I.; Sal’Man, A.G.; Tronin, A.A.; Shilin, B.V. Outgoing infrared radiation of the earth as an indicator of seismic activity. Proc. Acad. Sci. USSR 1988, 301, 67–69. [Google Scholar]
  6. Ouzounov, D.; Bryant, N.; Logan, T.; Pulinets, S.; Taylor, P. Satellite thermal IR phenomena associated with some of the major earthquakes in 1999–2003. Phys. Chem. Earth 2006, 31, 154–163. [Google Scholar] [CrossRef]
  7. Ouzounov, D.; Liu, D.F.; Kang, C.L.; Cervone, G.; Kafatos, M.; Taylor, P. Outgoing long wave radiation variability from IR satellite data prior to major earthquakes. Tectonophysics 2007, 431, 211–220. [Google Scholar] [CrossRef]
  8. Saraf, A.K.; Rawat, V.; Banerjee, P.; Choudhury, S.; Panda, S.K.; Das, J.D. Satellite detection of earthquake thermal infrared precursors in Iran. Nat. Hazards 2008, 47, 119–135. [Google Scholar] [CrossRef]
  9. Saraf, A.K.; Rawat, V.; Das, J.; Zia, M.; Sharma, K. Satellite detection of thermal precursors of Yamnotri, Ravar and Dalbandin earthquakes. Nat. Hazards 2012, 61, 861–872. [Google Scholar] [CrossRef]
  10. Tronin, A.A. Satellite remote sensing in seismology. A review. Remote Sens. 2010, 2, 124–150. [Google Scholar] [CrossRef]
  11. Piroddi, L.; Ranieri, G. Night Thermal Gradient: A New Potential Tool for Earthquake Precursors Studies. An Application to the Seismic Area of L’Aquila (Central Italy). IEEE J. Sel. Top. Appl. Earth Obs. Remote Sens. 2012, 5, 307–312. [Google Scholar] [CrossRef]
  12. Wu, L.X.; Qin, K.; Liu, S.J. GEOSS-based thermal parameters analysis for earthquake anomaly recognition. Proc. IEEE 2012, 100, 2891–2907. [Google Scholar] [CrossRef]
  13. Qin, K.; Wu, L.X.; Zheng, S.; Liu, S.J. A Deviation-Time-Space-Thermal (DTS-T) method for Global Earth Observation System Of Systems (GEOSS)-based earthquake anomaly recognition: Criterions and quantify indices. Remote Sens. 2013, 5, 5143–5151. [Google Scholar] [CrossRef]
  14. Eleftheriou, A.; Filizzola, C.; Genzano, N.; Lacava, T.; Lisi, M.; Paciello, R.; Pergola, N.; Vallianatos, F.; Tramutoli, V. Long-term RST analysis of anomalous TIR sequences in relation with earthquakes occurred in Greece in the period 2004–2013. Pure Appl. Geophys. 2016, 173, 285–303. [Google Scholar] [CrossRef]
  15. Fulton, P.M.; Brodsky, E.E.; Kano, Y.; Mori, J.; Chester, F.; Ishikawa, T.; Harris, R.N.; Lin, W.; Eguchi, N.; Toczko, S. Low coseismic friction on the Tohoku-Oki fault determined from temperature measurements. Science 2013, 342, 1214–1217. [Google Scholar] [CrossRef] [PubMed] [Green Version]
  16. Li, H.B.; Xue, L.; Brodsky, E.E.; Mori, J.J.; Fulton, P.M.; Wang, H.; Kano, Y.; Yun, K.; Harris, R.N.; Gong, Z. Long-term temperature records following the Mw 7.9 Wenchuan (China) earthquake are consistent with low friction. Geology 2015, 43, 163–166. [Google Scholar] [CrossRef] [Green Version]
  17. Ma, J.; Wang, Y.P.; Chen, S.Y.; Liu, P.X.; Liu, L.Q. Insights into correlation between satellite infrared information and fault activities. Prog. Nat. Sci. 2006, 16, 1467–1475. [Google Scholar] [CrossRef]
  18. Chen, S.Y.; Ma, J.; Liu, P.X.; Liu, L.Q.; Hu, X.Y. Exploring co-seismic thermal response of Wenchuan earthquake by using Land Surface Temperatures of Terra and Aqua Satellites. Chin. J. Geophys. 2013, 56, 3788–3799. (In Chinese) [Google Scholar] [CrossRef]
  19. Chen, S.Y.; Liu, P.X.; Liu, L.Q.; Ma, J. A phenomenon of ground temperature change prior to LuShan earthquake observed in KangDing. Seismol. Geol. 2013, 35, 634–640. (In Chinese) [Google Scholar] [CrossRef]
  20. Chen, S.Y.; Liu, P.X.; Liu, L.Q.; Ma, J. Bedrock temperature as a potential method for monitoring change in crustal stress: Theory, in situ measurement, and a case history. J. Asian Earth Sci. 2016, 123, 22–33. [Google Scholar] [CrossRef]
  21. Geng, N.G.; Cui, C.Y.; Deng, M.D. Remote sensing detection in rock fracture experiment and the beginning of remote sensing rock mechanics. Acta Seismol. Sin. 1992, 14, 645–652. (In Chinese) [Google Scholar]
  22. Wu, L.X.; Cui, C.Y.; Geng, N.G.; Wang, J.Z. Remote sensing rock mechanics (RSRM) and associated experimental studies. Int. J. Rock Mech. Min. Sci. 2000, 37, 879–888. [Google Scholar] [CrossRef]
  23. Wu, L.X.; Liu, S.J.; Wu, Y.H.; Wang, C.Y. Precursors for rock fracturing and failure-part I: IRR image abnormalities. Int. J. Rock Mech. Min. Sci. 2006, 43, 473–482. [Google Scholar] [CrossRef]
  24. Wu, L.X.; Liu, S.J.; Wu, Y.H.; Wang, C.Y. Precursors for rock fracturing and failure-part II: IRRT-curve abnormalities. Int. J. Rock Mech. Min. Sci. 2006, 43, 483–493. [Google Scholar] [CrossRef]
  25. Yang, X.Q.; Lin, W.R.; Tadai, O.; Zeng, X.; Yu, C.H.; Ye, H.C.; Li, H.B.; Wang, H. Experimental and numerical investigation of the temperature response to stress changes of rocks. J. Geophys. Res. Solid Earth 2017, 122, 5101–5117. [Google Scholar] [CrossRef] [Green Version]
  26. Wang, C.L.; Lu, Z.J.; Liu, L.; Chuai, X.S.; Lu, H. Predicting points of the infrared precursor for limestone failure under uniaxial compression. Int. J. Rock Mech. Min. Sci. 2016, 88, 34–43. [Google Scholar] [CrossRef]
  27. Sun, X.M.; Xu, H.C.; He, M.C.; Zhang, F. Experimental investigation of the occurrence of rockburst in a rock specimen through infrared thermography and acoustic emission. Int. J. Rock Mech. Min. Sci. 2017, 93, 250–259. [Google Scholar] [CrossRef]
  28. Ma, J.; Sherman, S.I.; Guo, Y. Identification of meta-instable stress state based on experimental study of evolution of the temperature field during stick-slip instability on a 5° bending fault. Sci. Chin. Earth Sci. 2012, 55, 869–881. [Google Scholar] [CrossRef]
  29. Ren, Y.Q.; Liu, P.X.; Ma, J.; Chen, S.Y. Experimental study on evolution of thermal field of en echelon fault during the meta-instability stage. Chin. J. Geophys. 2013, 56, 2348–2357. (In Chinese) [Google Scholar] [CrossRef]
  30. He, M.C. Physical modeling of an underground roadway excavation in geologically 45° inclined rock using infrared thermography. Eng. Geol. 2011, 121, 165–176. [Google Scholar] [CrossRef]
  31. Mineo, S.; Pappalardo, G.; Rapisarda, F.; Cubito, A.; Maria, G.D. Integrated geostructural, seismic and infrared thermography surveys for the study of an unstable rock slope in the peloritani chain (ne sicily). Eng. Geol. 2015, 195, 225–235. [Google Scholar] [CrossRef]
  32. Pappalardo, G.; Mineo, S.; Calcaterra, D. Geomechanical analysis of unstable rock wedges by means of geostructural and infrared thermography surveys. Ital. J. Eng. Geol. Environ. 2017, 1, 93–101. [Google Scholar] [CrossRef]
  33. Freund, F.T.; Takeuchi, A.; Lau, B.W.S.; Al-Manaseer, A.; Fu, C.C.; Bryant, N.A.; Ouzounov, D. Stimulated infrared emission from rocks: Assessing a stress indicator. eEarth 2007, 2, 7–16. [Google Scholar] [CrossRef]
  34. Freund, F.T. Pre-earthquake signals: Underlying physical processes. J. Asian Earth Sci. 2011, 41, 383–400. [Google Scholar] [CrossRef]
  35. Liu, S.J.; Wu, L.X.; Feng, Z.; Xu, Z.Y. Thermal infrared spectral variation and sensitive waveband of quartzy sandstone under pressure. Spectrosc. Spectr. Anal. 2012, 32, 78–82. (In Chinese) [Google Scholar] [CrossRef]
  36. Xu, Z.Y.; Liu, S.J.; Wu, L.X.; Feng, Z. Stress-related thermal infrared spectral variation and sensitive waveband of granite. J. Infrared Millim. Waves 2013, 32, 44–49. [Google Scholar] [CrossRef]
  37. Huang, J.W.; Liu, S.J.; Xu, Z.Y.; Ma, C.Y.; Wu, L.X. Experimental study on the influence of the radiation background on the variation in thermal infrared radiance of loaded rock. Spectrosc. Spectr. Anal. 2018, 38, 4222–4225. (In Chinese) [Google Scholar] [CrossRef]
  38. Huang, J.W.; Liu, S.J.; Gao, X.; Yang, Z.C.; Ni, Q.; Wu, L.X. Experimental Study of the Thermal Infrared Emissivity Variation of Loaded Rock and Its Significance. Remote Sens. 2018, 10, 818. [Google Scholar] [CrossRef]
  39. Tanaka, S. Tidal triggering of earthquakes prior to the 2011 Tohoku-Oki earthquake. Geophys. Res. Lett. 2012, 39, 7. [Google Scholar] [CrossRef]
  40. Ma, W.Y.; Kong, X.Z.; Kang, C.L.; Zhong, X.H.; Wu, H.Y.; Zhan, X.S.; Joshi, M. Research on the changes of the tidal force and the air temperature in the atmosphere of Lushan (China) MS7.0 earthquake. Therm. Sci. 2015, 19, S487–S493. [Google Scholar] [CrossRef]
  41. Kilston, S.; Knopoff, L. Lunar-solar periodicities of large earthquakes in southern California. Nature 1983, 304, 21–25. [Google Scholar] [CrossRef]
  42. Li, F.; Zhang, Y.G.; Liu, J.R.; Zhang, L.; Fang, S.H. The dynamical response characteristics of elastic–plastic coal under dynamic load. J. Nat. Gas Sci. Eng. 2016, 29, 497–505. [Google Scholar] [CrossRef]
  43. Herrendörfer, R.; Dinther, Y.V.; Gerya, T.; Dalguer, L.A. Earthquake supercycle in subduction zones controlled by the width of the seismogenic zone. Nat. Geosci. 2015, 8, 471–473. [Google Scholar] [CrossRef]
  44. Nadeau, R.M.; Foxall, W.; Mcevilly, T.V. Clustering and periodic recurrence of micro-earthquakes on the San Andreas fault at Park field California. Science 1995, 267, 503–507. [Google Scholar] [CrossRef] [PubMed]
  45. Perfettini, H.; Avouac, J.P.; Tavera, H.; Kositsky, A.; Nocquet, J.M.; Bondoux, F.; Chlieh, M.; Sladen, A.; Audin, L.; Farber, D.L.; et al. Seismic and aseismic slip on the central Peru megathrust. Nature 2010, 465, 78–81. [Google Scholar] [CrossRef] [PubMed]
  46. Song, Z.P.; Yin, J.Y.; Xue, Y.; Zhang, G.M.; Liu, J.; Zhu, Y.Q.; Zhang, Y.X. The global and sub-zone period characteristics for large earthquakes. Chin. J. Geophys. 2013, 56, 1868–1876. (In Chinese) [Google Scholar] [CrossRef]
  47. Liu, S.J.; Xu, Z.Y.; Wei, J.L.; Huang, J.W.; Wu, L.X. Experimental Study on Microwave Radiation from Deforming and Fracturing Rock under Loading Outdoor. IEEE Trans. Geosci. Remote Sens. 2016, 54, 5578–5587. [Google Scholar] [CrossRef]
  48. Kylili, A.; Fokaides, P.A.; Christou, P.; Kalogirou, S.A. Infrared thermography (IRT) applications for building diagnostics: A review. Appl. Energy 2014, 134, 531–549. [Google Scholar] [CrossRef]
  49. Ma, L.Q.; Sun, H.; Zhang, Y.; Zhou, T.; Li, K.; Guo, J.S. Characteristics of Infrared Radiation of Coal Specimens under Uniaxial Loading. Rock Mech. Rock Eng. 2016, 49, 1567–1572. [Google Scholar] [CrossRef]
  50. Sun, H.; Ma, L.Q.; Adeleke, N.; Zhang, Y. Background Thermal Noise Correction Methodology for Average Infrared Radiation Temperature of Coal under Uniaxial Loading. Infrared Phys. Technol. 2017, 81, 157–165. [Google Scholar] [CrossRef]
  51. Wang, J.X.; Tang, X.B. Wavelet denoise method applied in load spectrum analysis of engineering vehicles. Adv. Mater. Res. 2010, 108–111, 1320–1325. [Google Scholar] [CrossRef]
  52. Karamzadeh, N.; Doloei, G.J.; Reza, A.M. Automatic Earthquake Signal Onset Picking Based on the Continuous Wavelet Transform. IEEE Trans. Geosci. Remote Sens. 2013, 51, 2666–2674. [Google Scholar] [CrossRef]
  53. Chen, S.Y.; Liu, P.X.; Liu, L.Q.; Ma, J.; Chen, G.Q. Wavelet Analysis of Thermal Infrared Radiation of Land Surface and Its Implication in the Study of Current Tectonic Activities. Chin. J. Geophys. 2006, 49, 717–723. (In Chinese) [Google Scholar] [CrossRef]
  54. Chen, S.Y.; Liu, P.X.; Guo, Y.S.; Liu, L.Q.; Ma, J. An experiment on temperature variations in sandstone during biaxial loading. Phys. Chem. Earth 2015, 85–86, 3–8. [Google Scholar] [CrossRef]
  55. Thomson, W. On dynamical theory of heat. Philos. Mag. 1852, 4, 424–434. [Google Scholar] [CrossRef]
  56. Zhang, Y.S.; Guo, X.; Zhong, M.J.; Shen, W.R.; Li, W.; He, B. Wenchuan earthquake: Brightness temperature changes from satellite infrared information. Chin. Sci. Bull. 2010, 55, 1917–1924. [Google Scholar] [CrossRef]
  57. Zhang, Y.S.; Guo, X.; Wei, C.X.; Shen, W.R.; Hui, S.X. The characteristics of seismic thermal radiation of Japan Ms 9.0 and Myanmar Ms 7.2 earthquake. Chin. J. Geophys. 2011, 54, 2575–2580. [Google Scholar] [CrossRef]
  58. Guo, X.; Zhang, Y.S.; Wei, C.X.; Zhong, M.J.; Zhang, X. Medium wave infrared brightness anomalies of Wenchuan 8.0 and Zhongba 6.8 earthquakes. Acta Geosci. Sin. 2014, 35, 338–344. [Google Scholar] [CrossRef]
  59. Zhang, X.; Zhang, Y.S.; Guo, X.; Wei, C.X.; Zhang, L.F. Analysis of thermal infrared anomaly in the Nepal Ms 8.1 earthquake. Earth Sci. Front. 2017, 24, 227–233. (In Chinese) [Google Scholar] [CrossRef]
  60. Xie, T.; Kang, C.L.; Ma, W.Y. Thermal infrared brightness temperature anomalies associated with the Yushu (China) Ms = 7.1 earthquake on 14 April 2010. Nat. Hazards Earth Syst. Sci. 2013, 13, 1105–1111. [Google Scholar] [CrossRef] [Green Version]
  61. Zoran, M.A.; Savastru, R.S.; Savastru, D.M. Satellite thermal infrared anomalies associated with strong earthquakes in the Vrancea area of Romania. Open Geosci. 2015, 7, 606–617. [Google Scholar] [CrossRef]
  62. Lu, X.; Meng, Q.Y.; Gu, X.F.; Zhang, X.D.; Xie, T.; Geng, F. Thermal infrared anomalies associated with multi-year earthquakes in the Tibet region based on China’s FY-2E satellite data. Adv. Space Res. 2016, 58, 989–1001. [Google Scholar] [CrossRef]
  63. Meganem, I.; Deville, Y.; Hosseini, S.; Deliot, P.; Briottet, X. Linear-Quadratic Blind Source Separation Using NMF to Unmix Urban Hyperspectral Images. IEEE Trans. Signal Process. 2014, 62, 1822–1833. [Google Scholar] [CrossRef]
  64. Zhong, Y.F.; Wang, X.Y.; Zhao, L.; Feng, R.Y.; Zhang, L.P.; Xu, Y.Y. Blind spectral unmixing based on sparse component analysis for hyperspectral remote sensing imagery. ISPRS J. Photogramm. Remote Sens. 2016, 119, 49–63. [Google Scholar] [CrossRef]
Figure 1. Experimental scene: (a) schematic of the instrument arrangement, (b) photo of the experimental system under outdoor conditions at night.
Applsci 08 01458 g001
Figure 2. Stress–strain curves for samples: (a) HG-1; (b) SY-1.
Applsci 08 01458 g002
Figure 3. The photos of the samples and the arrangement of the temperature probes in these two types of environments: (a) HG-1 in the ‘EM1’; (b) HG-4 in the ‘EF2’.
Applsci 08 01458 g003
Figure 4. The measured results of sample HG-1 in the cyclic loading process: (a) The ambient temperature change; (b) ΔAIRT change.
Applsci 08 01458 g004
Figure 5. Results of decomposed ΔAIRT using wavelet analysis in the cyclic loading process of sample HG-1: (a) ΔAIRTlow; (b) ΔAIRTmid; (c) ΔAIRThigh.
Applsci 08 01458 g005aApplsci 08 01458 g005b
Figure 6. The measured results of sample HG-4 in the cyclic loading process: (a) The ambient temperature change; (b) ΔAIRT change.
Applsci 08 01458 g006
Figure 7. Results of decomposed ΔAIRT using wavelet analysis in the cyclic loading process of sample HG-4: (a) ΔAIRTlow; (b) ΔAIRTmid; (c) ΔAIRThigh.
Applsci 08 01458 g007
Table 1. The experimental parameters and conditions of the samples.
Sample No.Rock TypeCyclic Loading Range (MPa)Loading Rate (MPa/s)Environmental Conditions
HG-1Granite10–600.3Night, ‘EM1’, Day 1
HG-210–700.4Night, ‘EM1’, Day 2
HG-310–700.4Night, ‘EF2’, Day 3
HG-410–700.5Daytime, ‘EF2’, Day 3
SY-1Sandstone5–400.4Daytime, ‘EF2’, Day 1
SY-25–400.4Daytime, ‘EF2’, Day 2
Table 2. Statistical results of the correlation coefficients between both of ΔAIRT and ΔAIRTmid and stress and the maximum amplitude.
Sample No.Correlation CoefficientMaximum Amplitude (K)
ΔAIRTΔAIRTmidΔAIRTΔAIRTmid
HG-10.180.910.270.05
HG-20.120.940.090.03
HG-30.590.930.110.04
HG-40.450.910.290.08
SY-10.240.900.330.06
SY-20.090.840.230.06

