Acoustic Scene Classification Using Efficient Summary Statistics and Multiple Spectro-Temporal Descriptor Fusion


Abstract
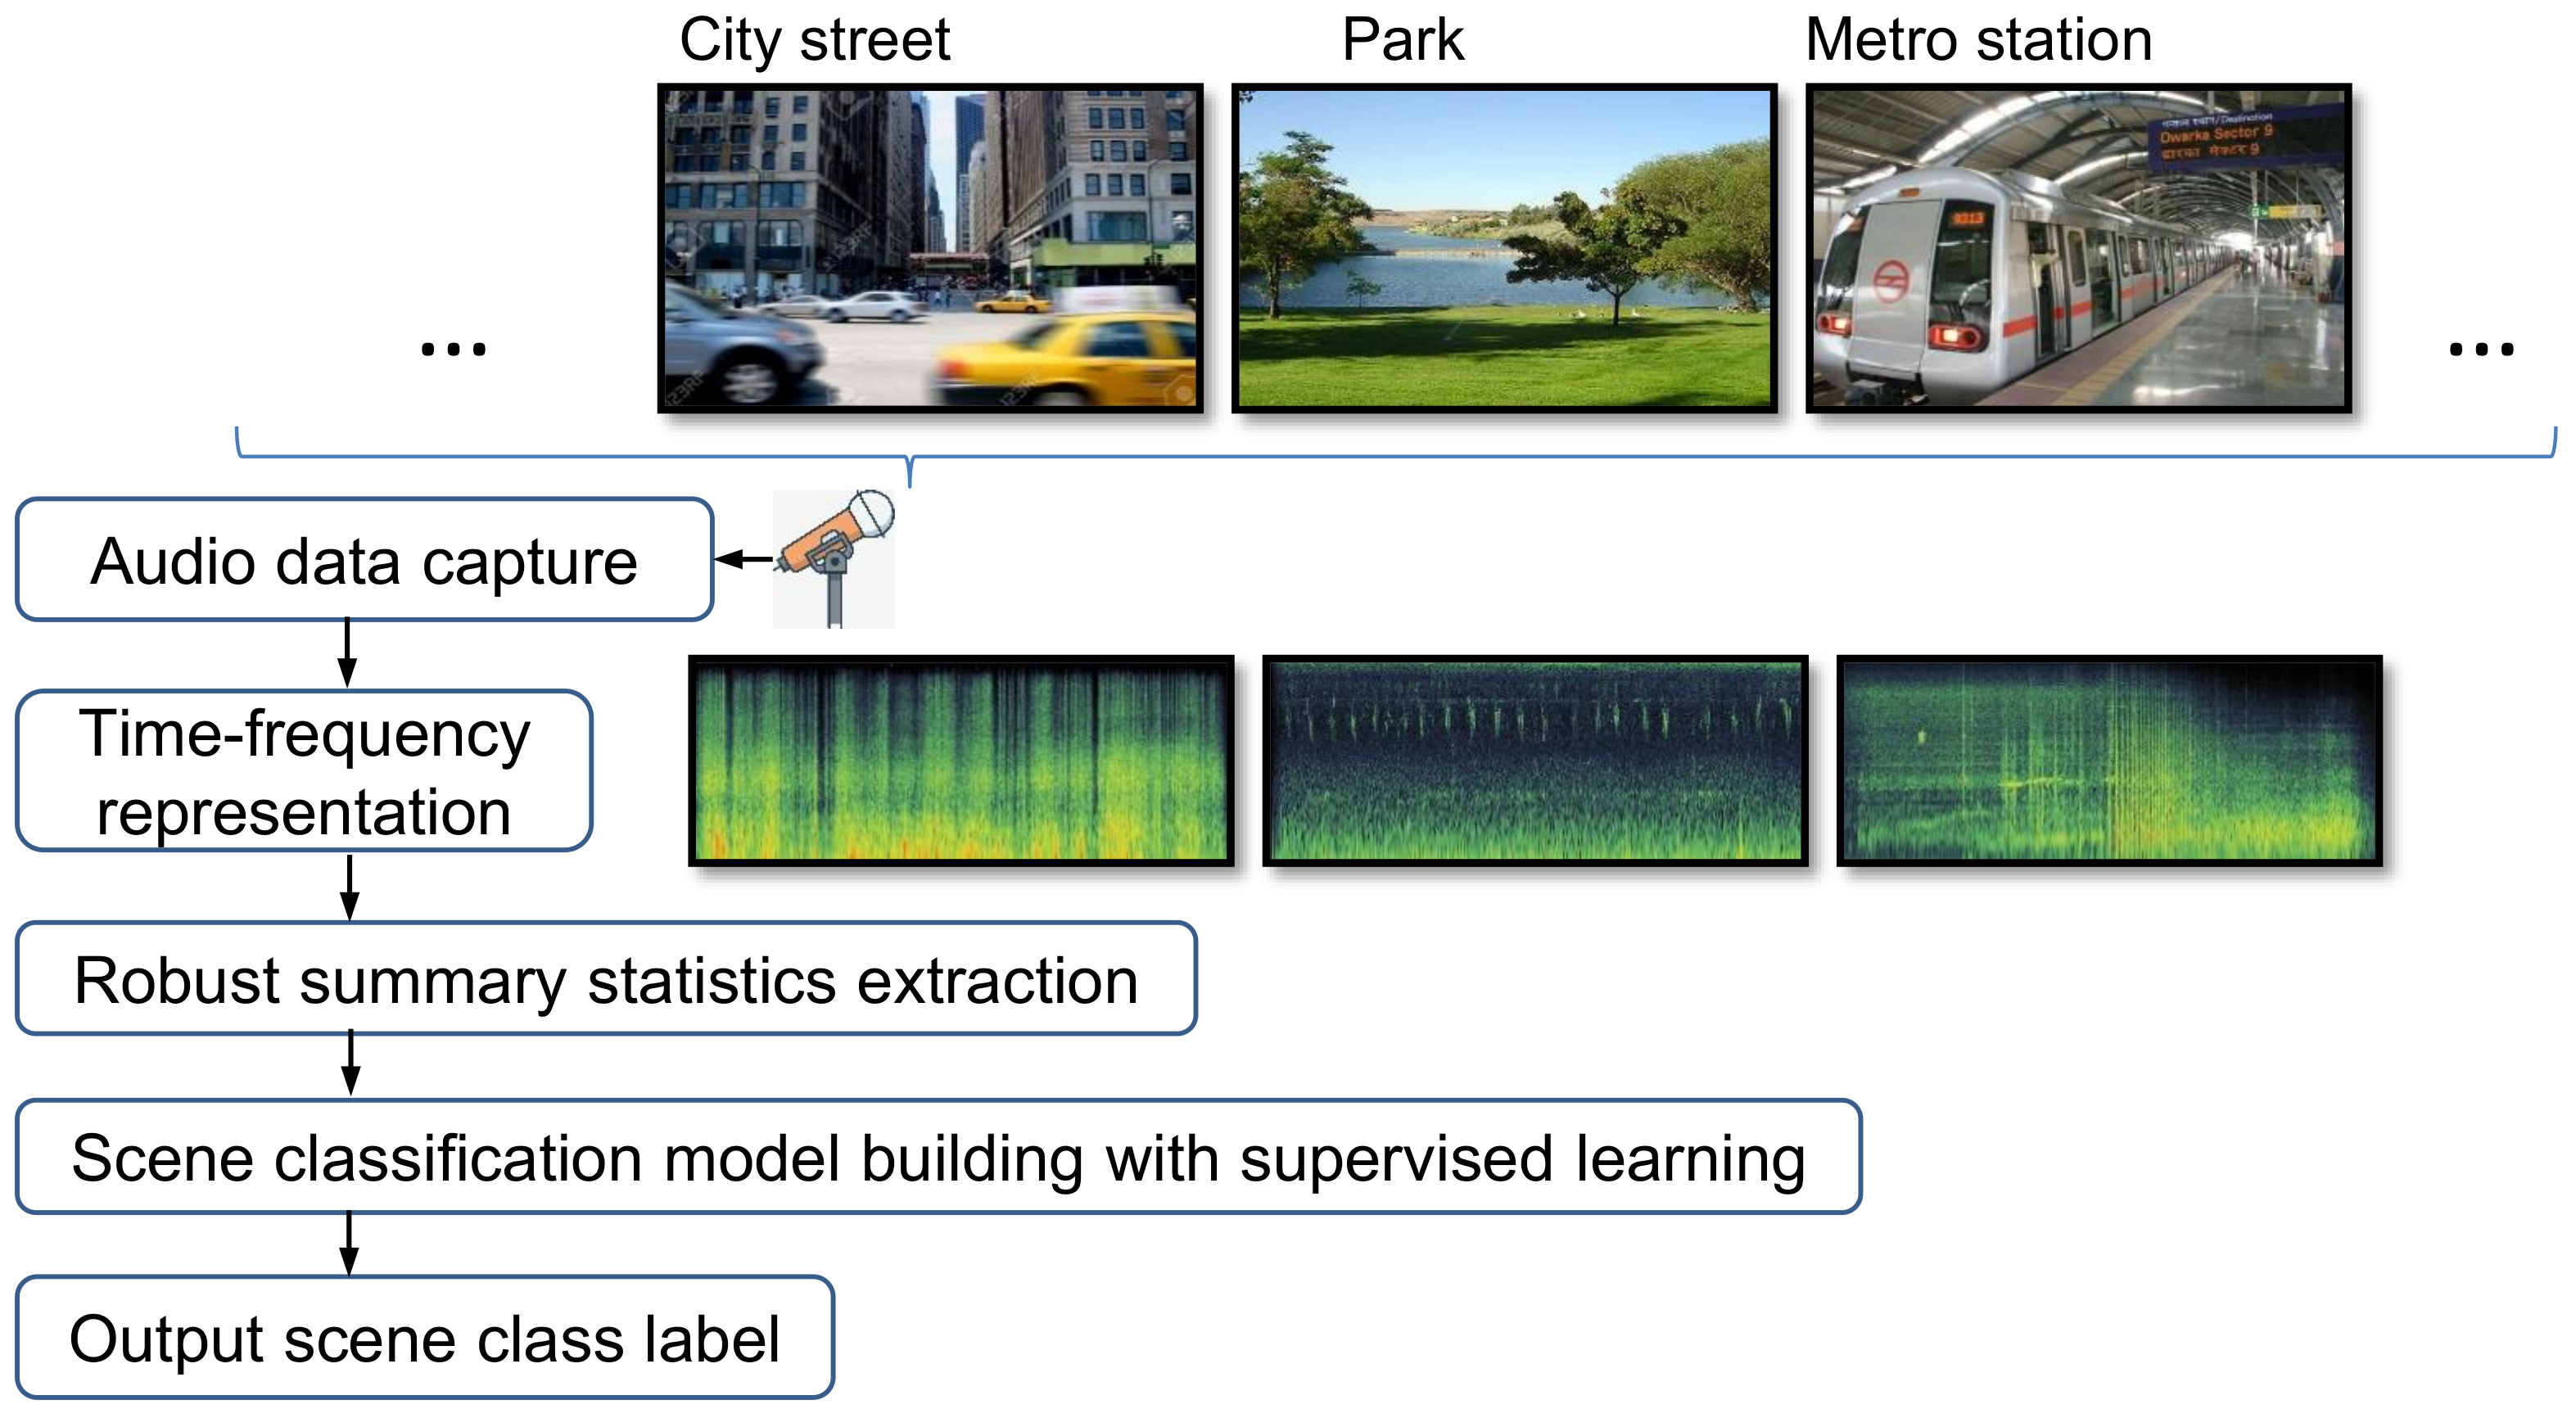
1. Introduction
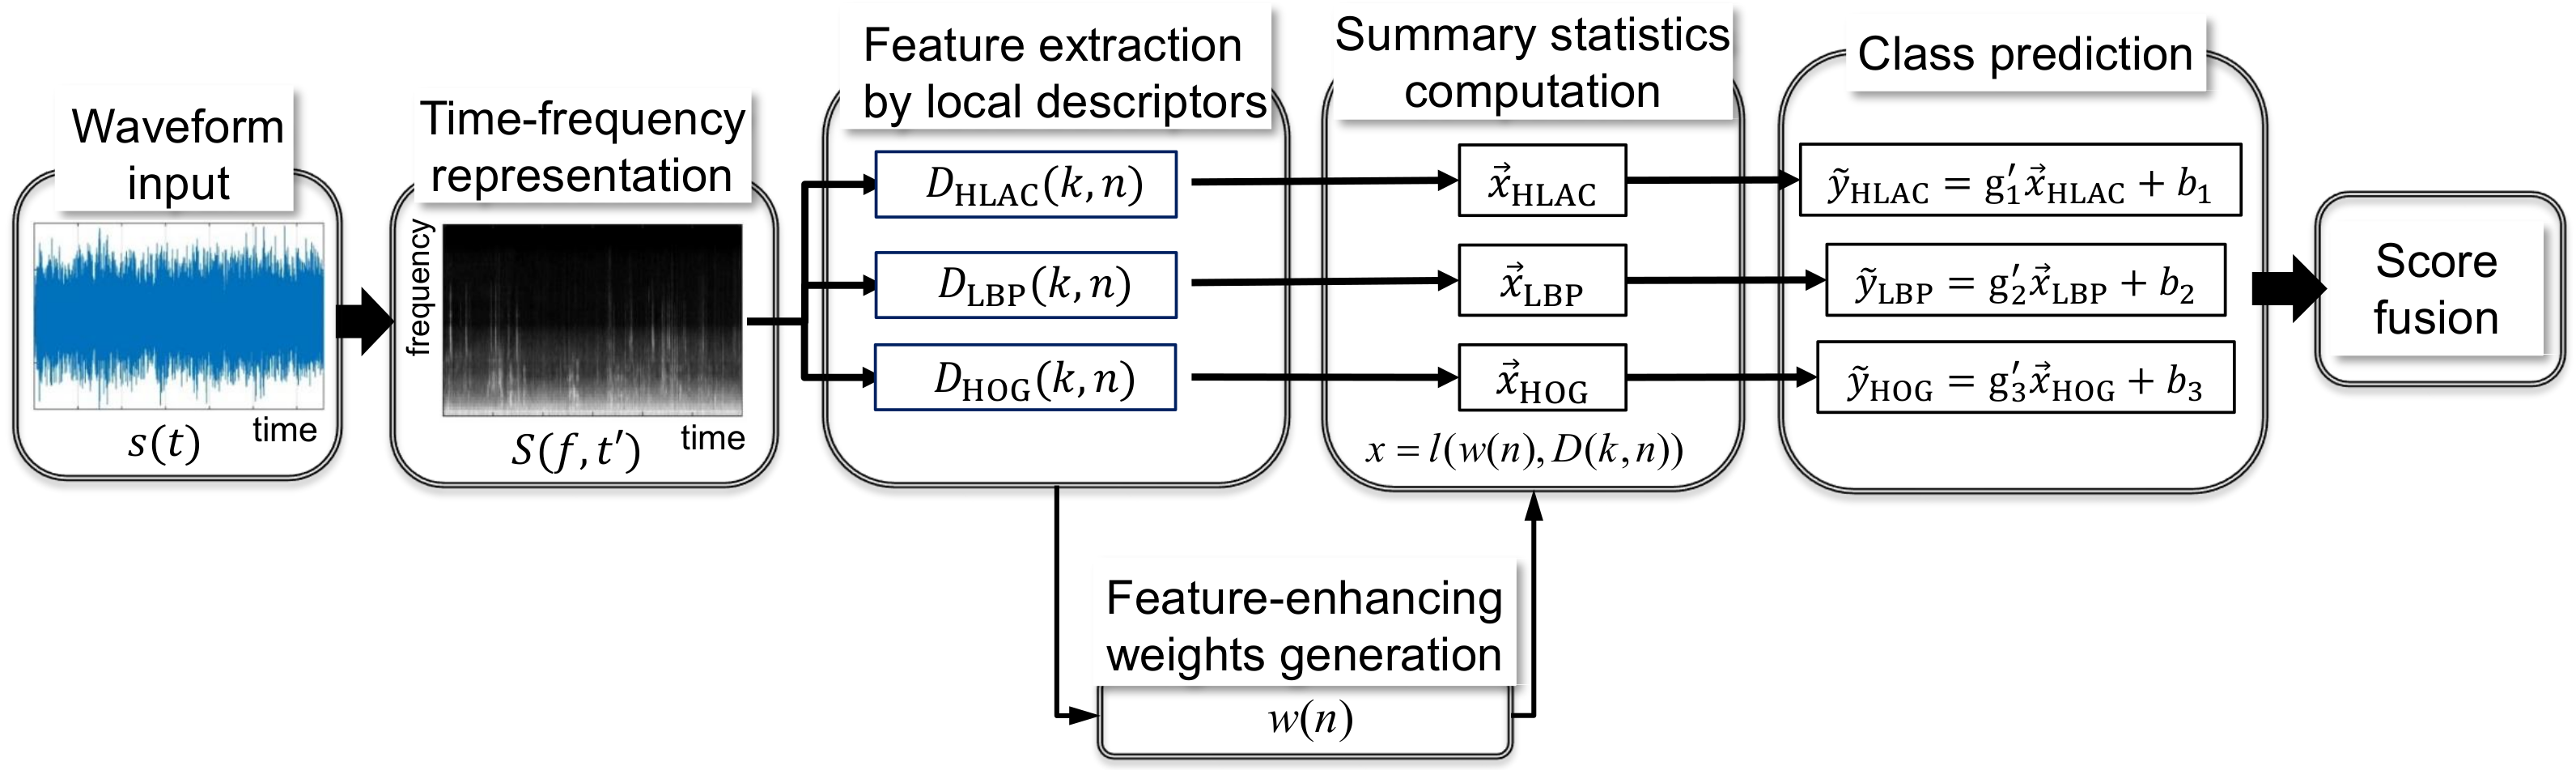
- Latest research towards ASC manifested that 2-dimensional (2D) local descriptors are efficient for describing environmental sounds, such as using local Binary patterns (LBP) [12] and histograms of oriented gradients (HOG) [13]. We perform intensive tests to evaluate various local descriptors for ASC. Furthermore, we proposed a framework to aggregate multiple 2D descriptors for ASC.
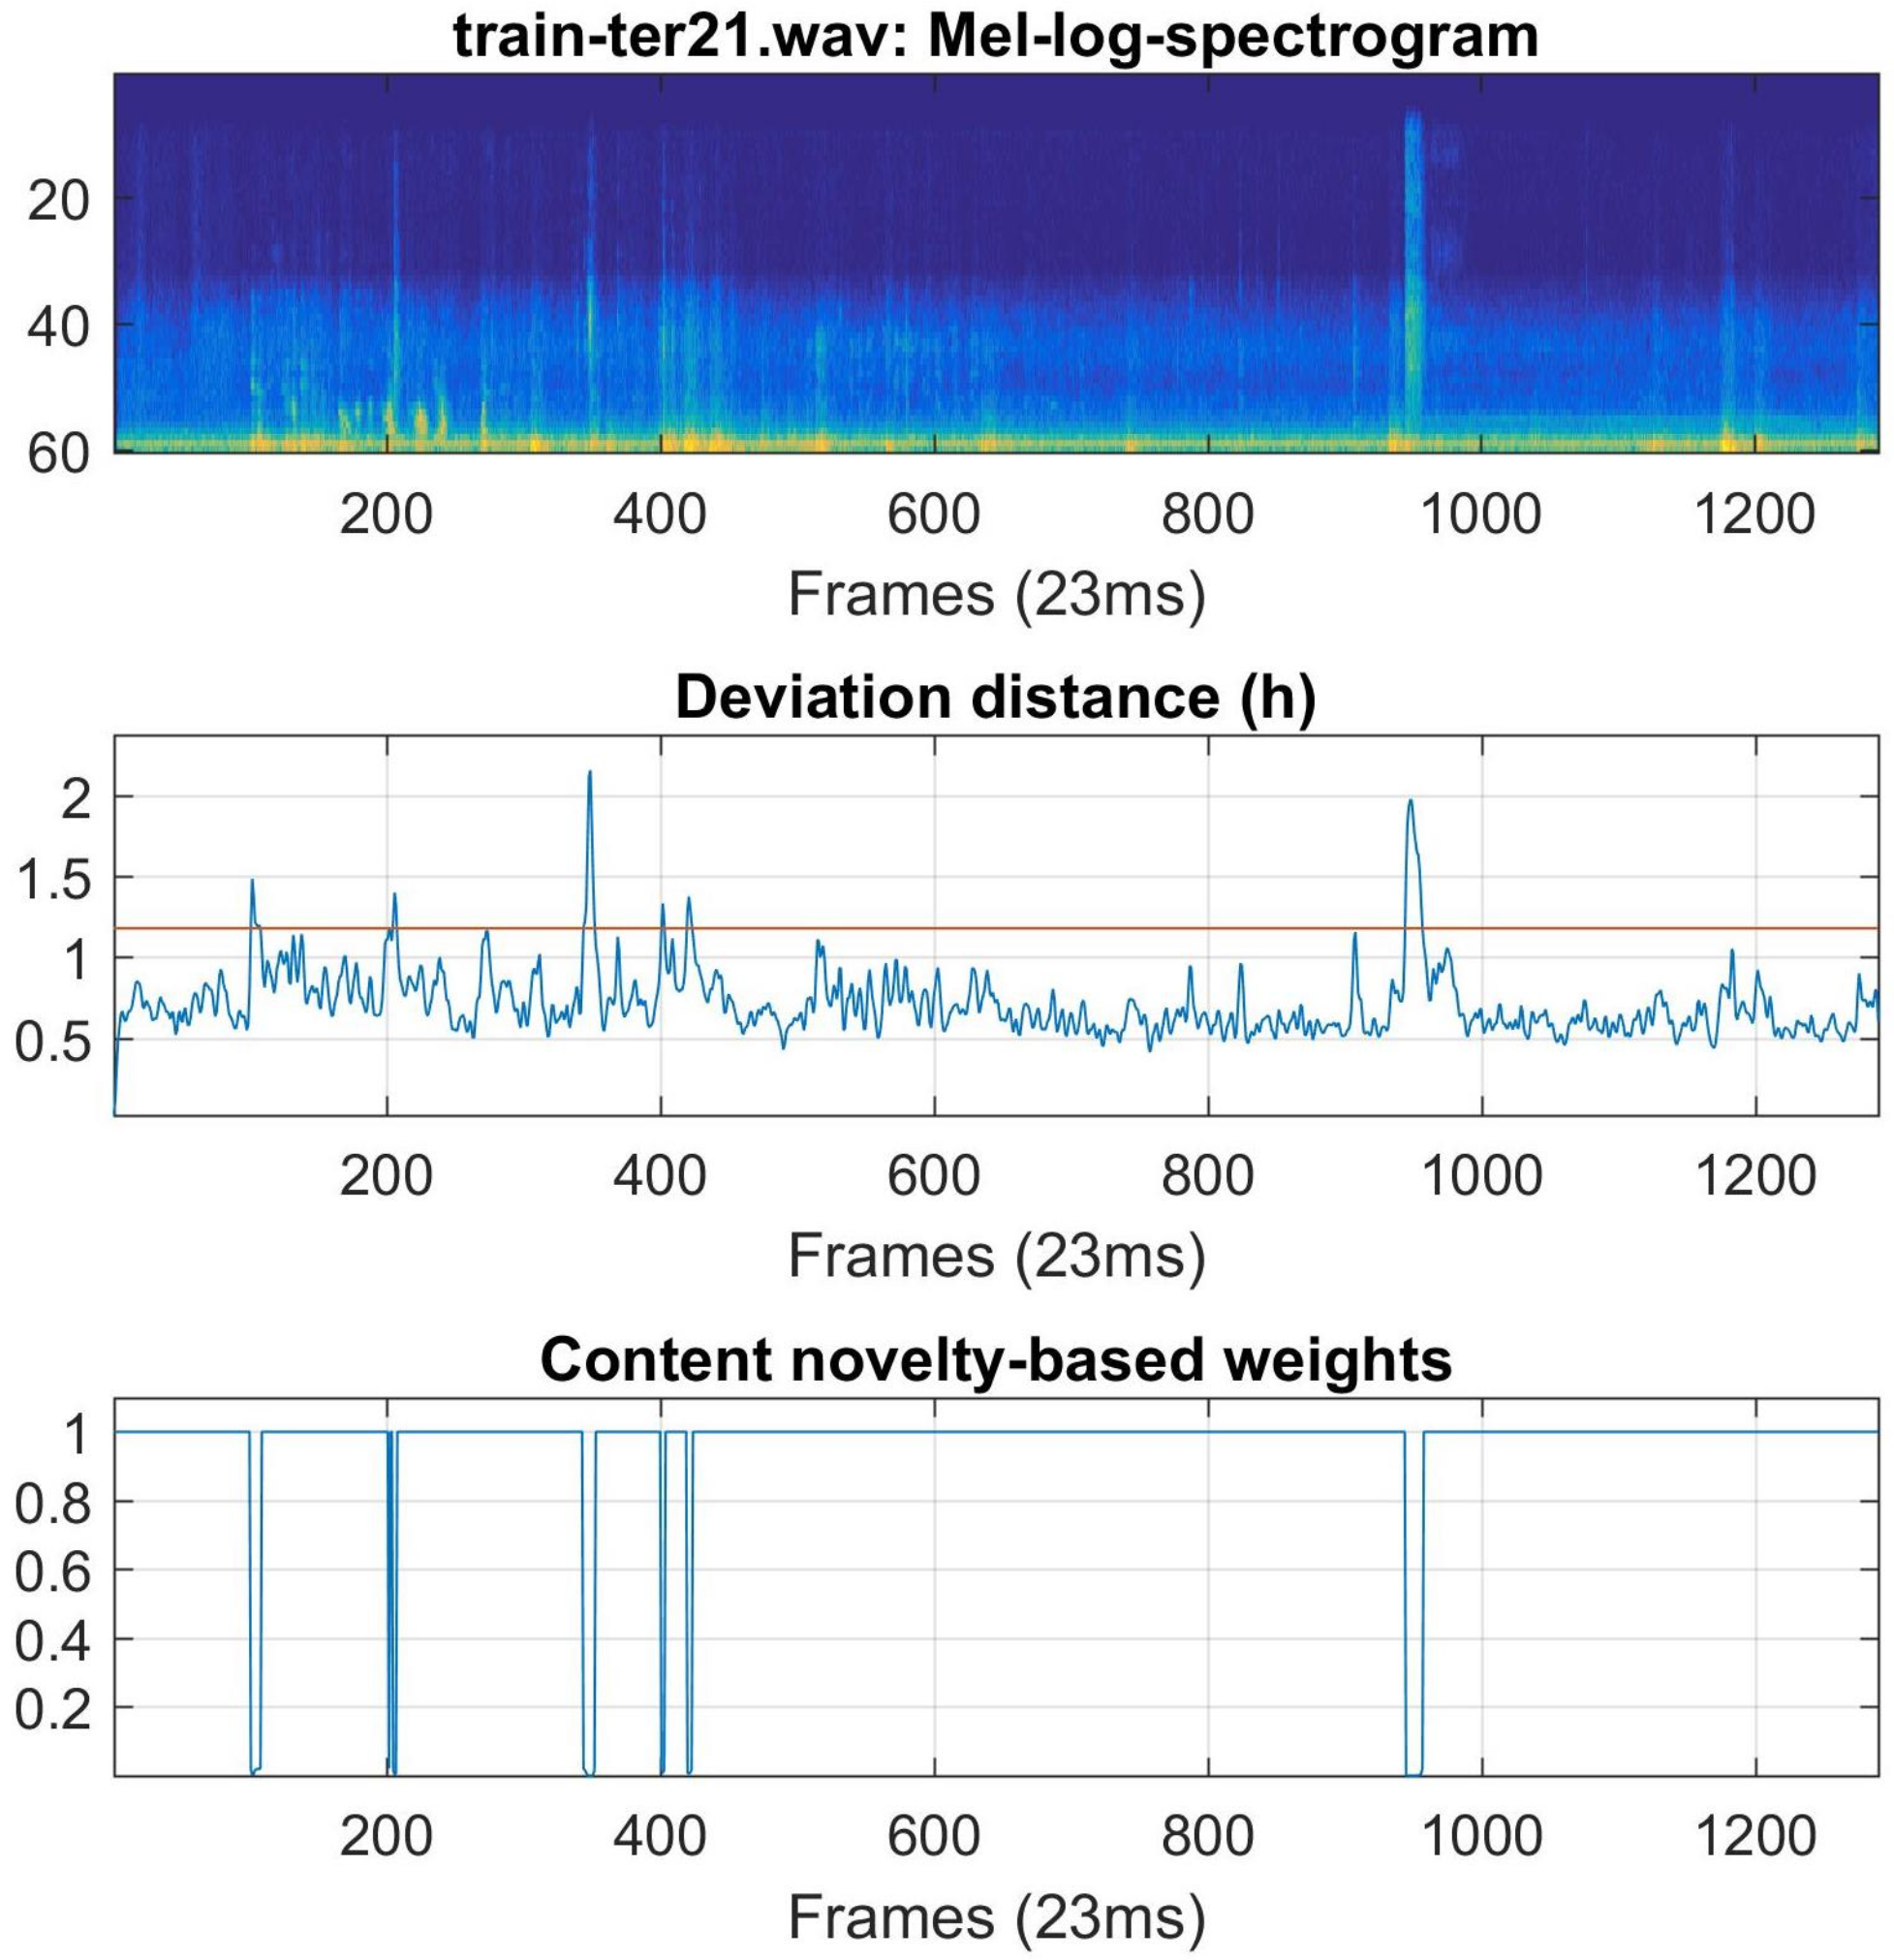
- To enhance scene-specific sound patterns, we conduct novelty detection over the audio clip. Both sound textures and super-positioned scene-relevant events would reside in the subspace due to high temporal homogeneity. On the contrary, scene-irrelevant sounds will generate distinct deviations to the subspace. According to above analysis, a series of weights can be derived which indicate the importance of representing the scene.
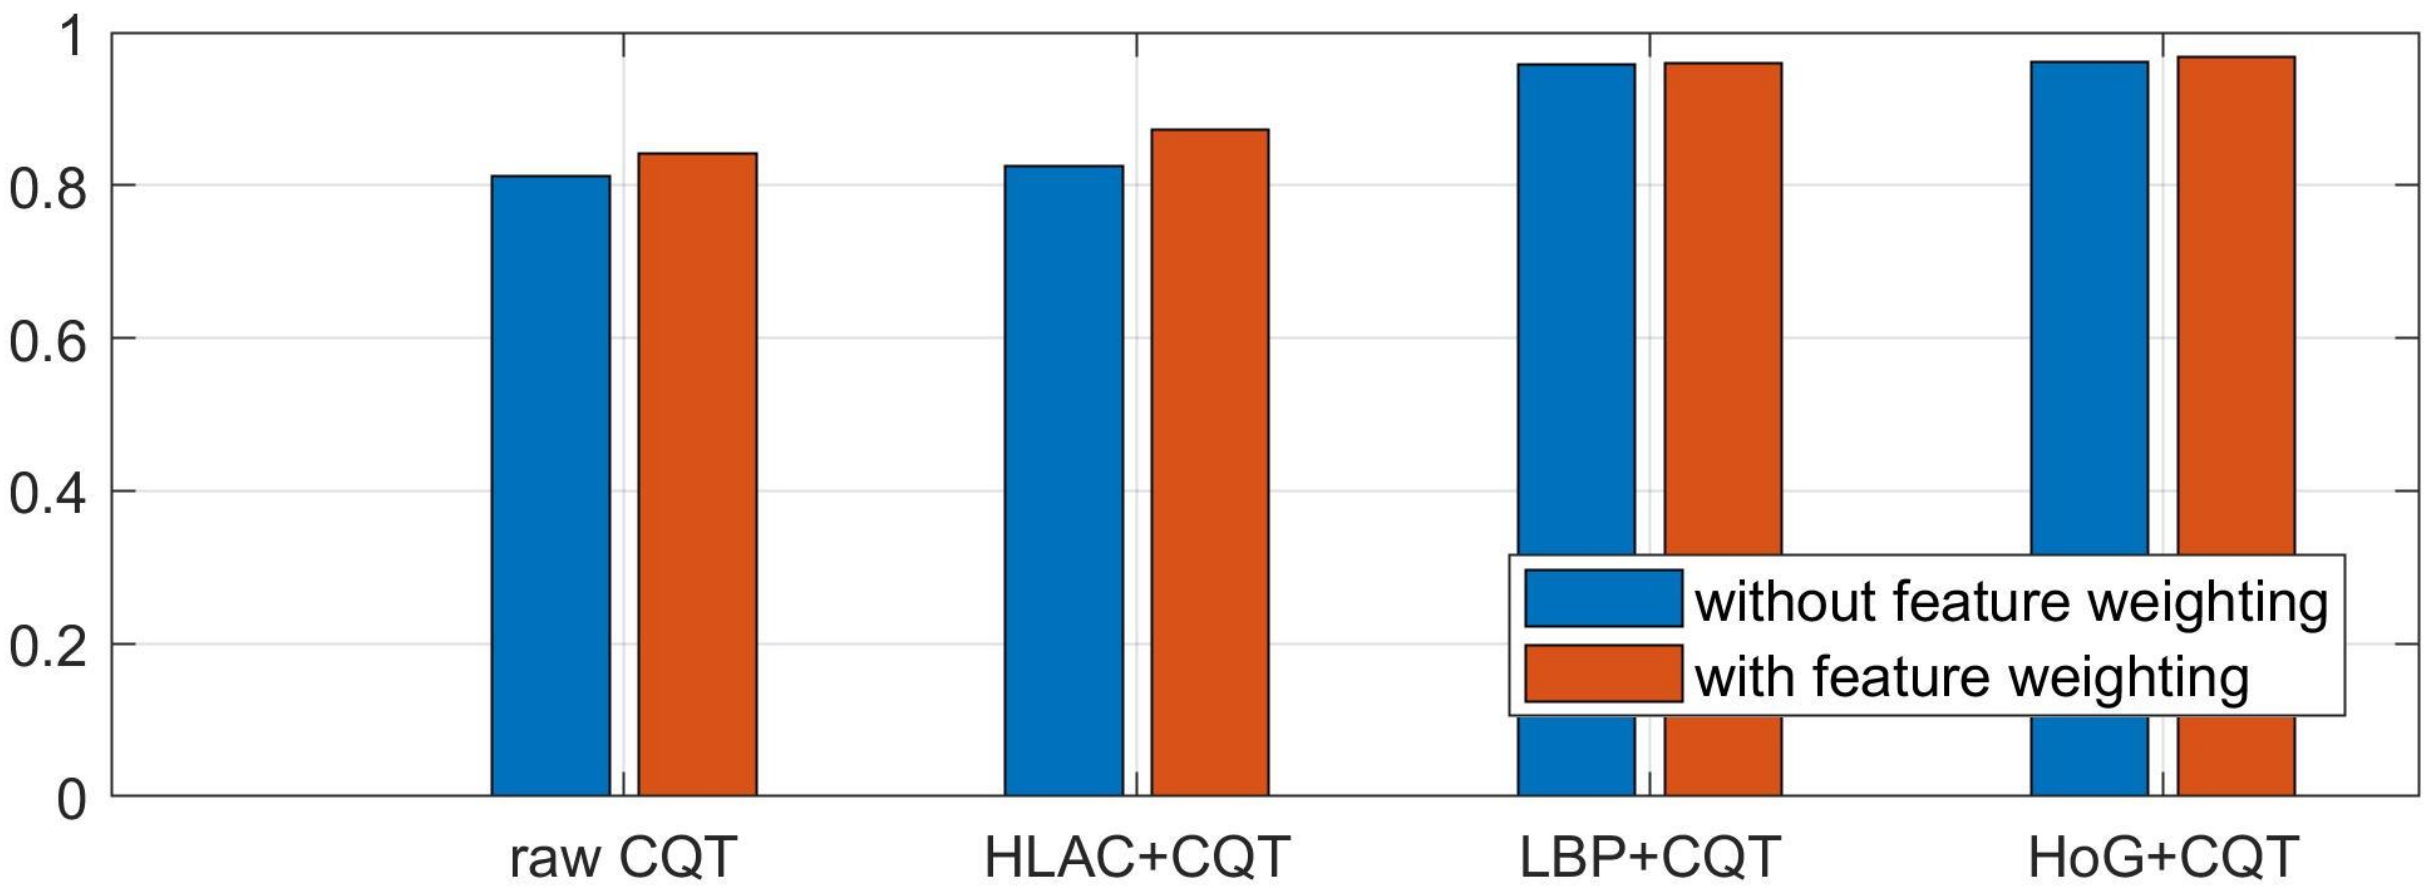
- To efficiently summarize local acoustic patterns, we employ a weighted averaging scheme which converts spectro-temporal distribution (matrix) to a compact vector. A multi-feature aggregation scheme had been further applied to fuse the discriminant information conveyed by local descriptors. According to the validation studies on real data, the proposed approach achieved superior performance comparing to other recent results.
2. Related Works
3. Proposed Method
3.1. Time-Frequency Representation (TFR)
3.2. Spectro-Temporal Descriptors
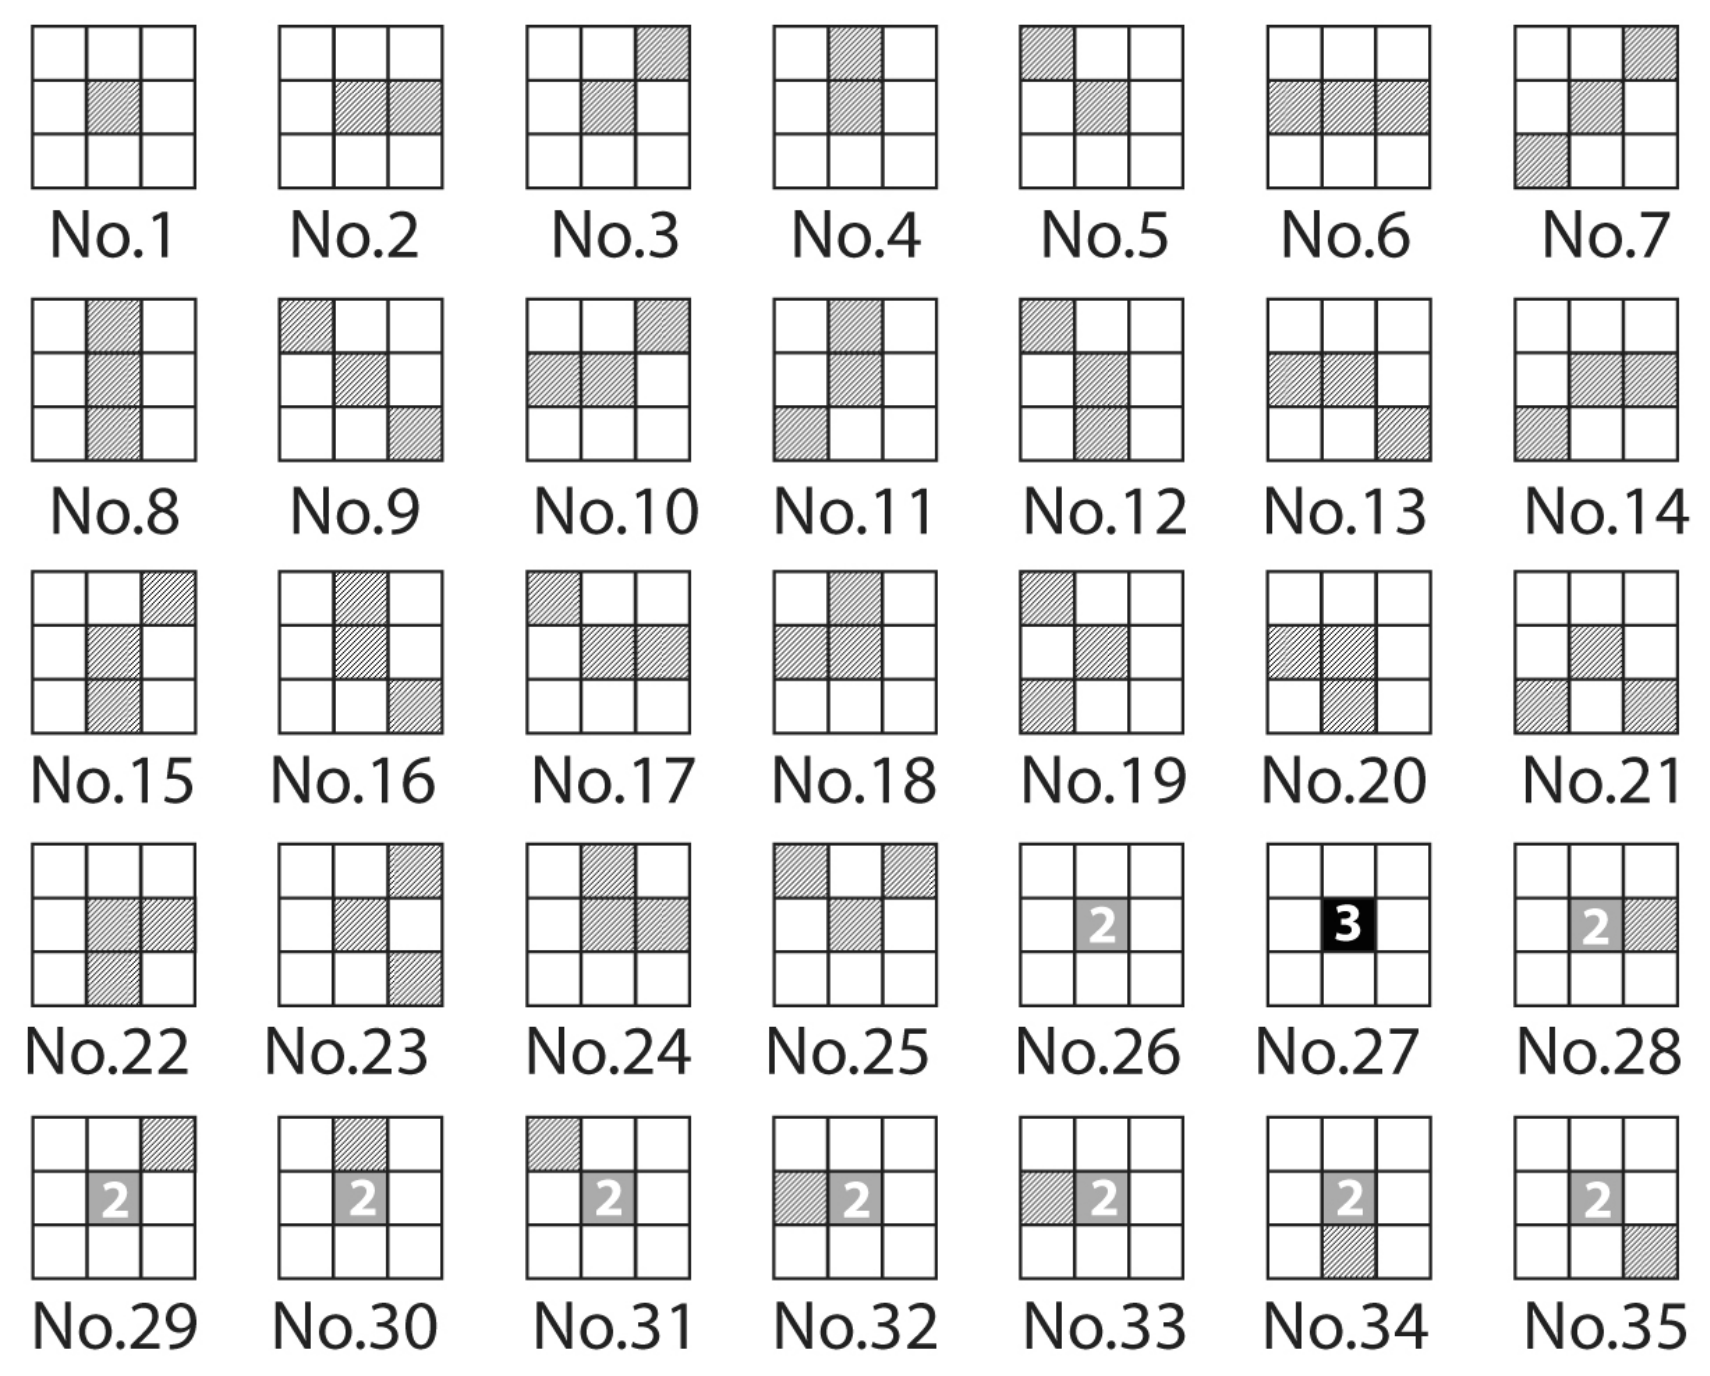
3.2.1. Higher-Order Local Auto-Correlation (HLAC)
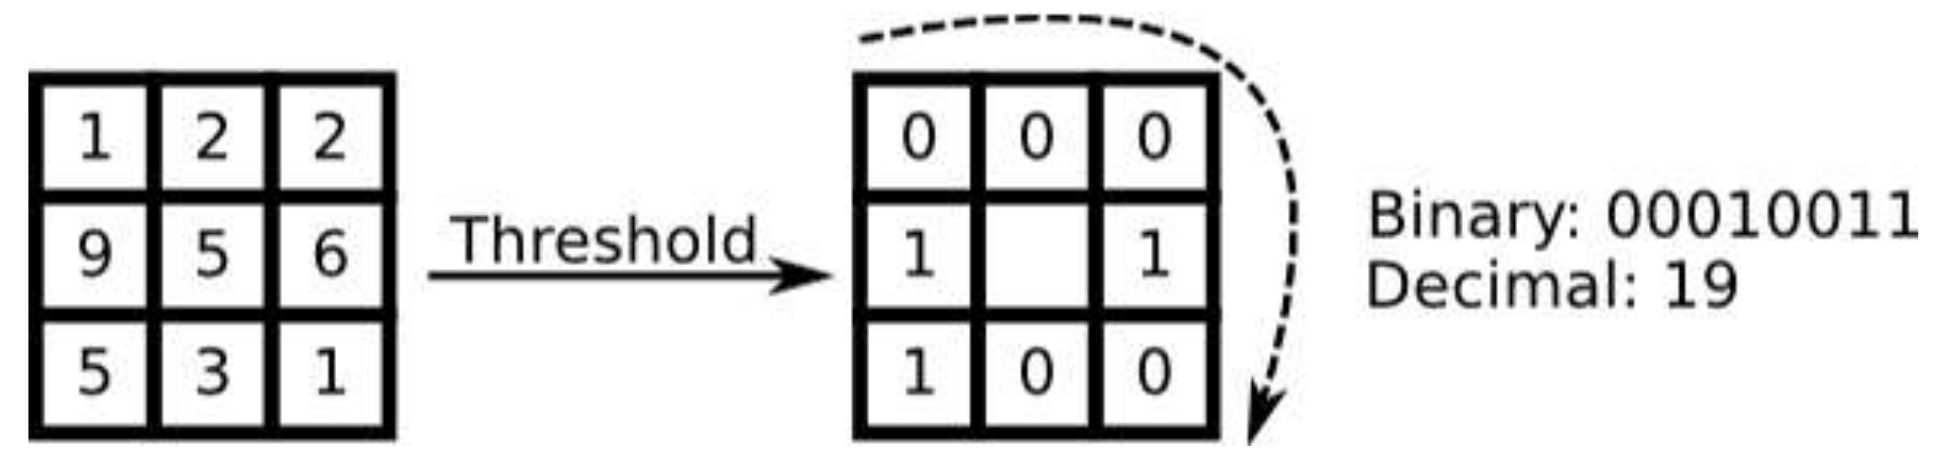
3.2.2. Local Binary Patterns (LBP)
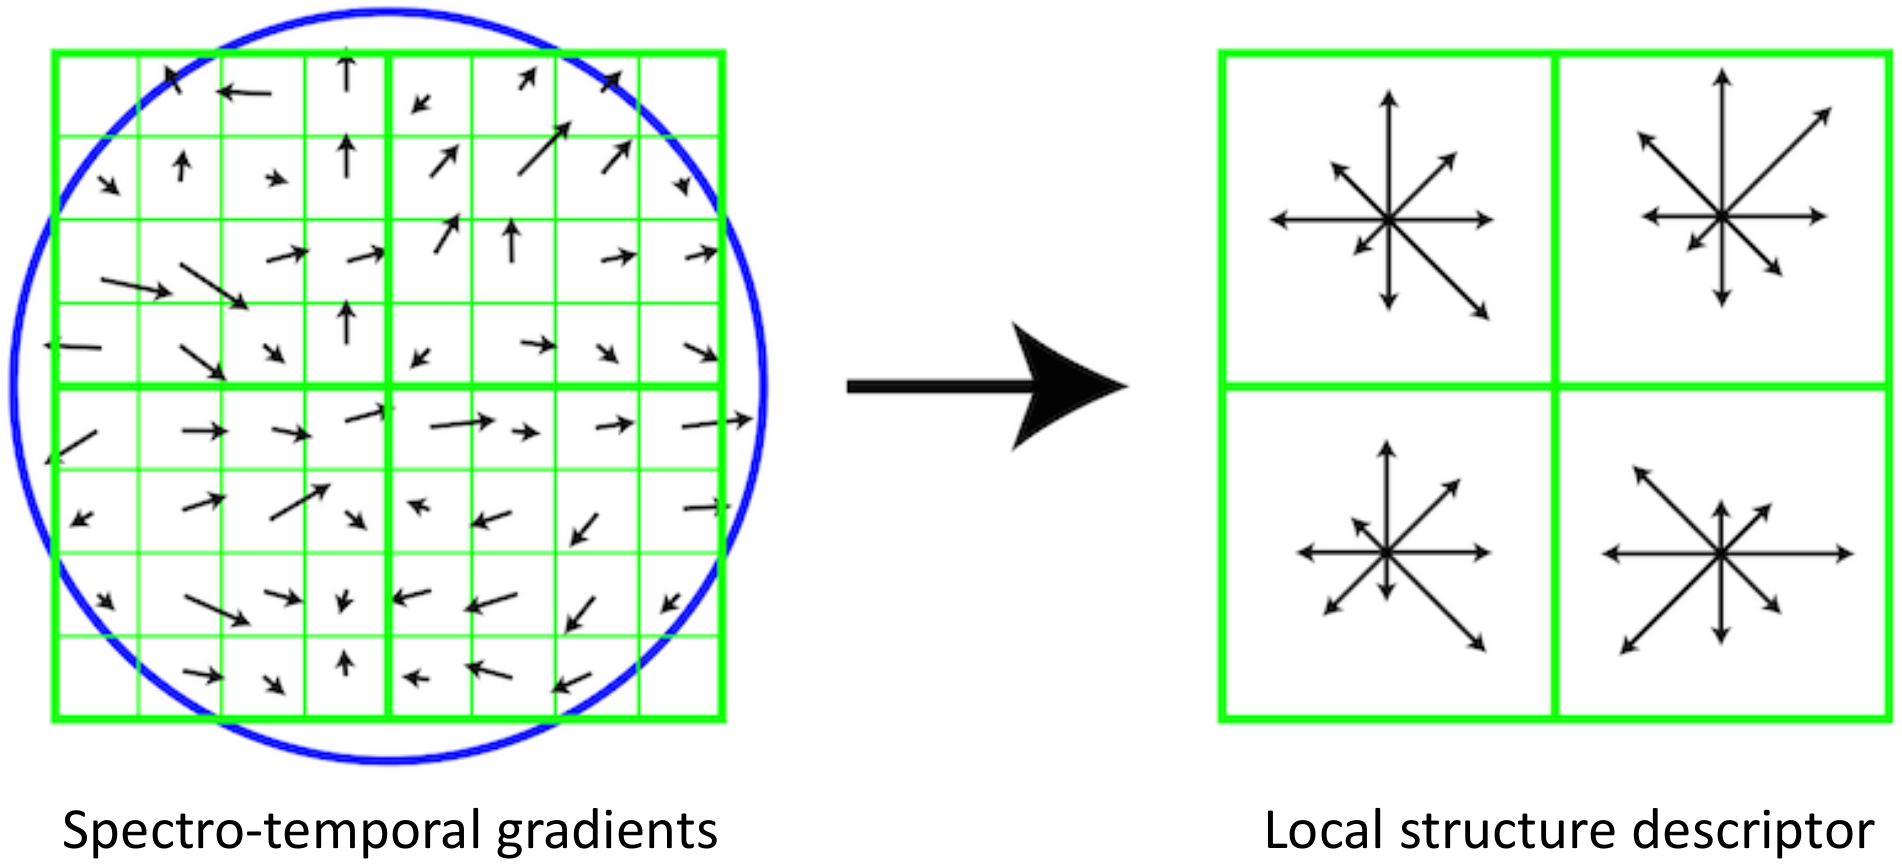
3.2.3. Histogram of Oriented Gradients (HOG)
3.3. Acoustic Summary Statistics Extraction for ASC
| Algorithm 1 Texture-enhancing weights generation algorithm |
|
3.3.1. Unsupervised Novelty Analysis of Acoustic Scene
3.3.2. Textures-Enhancing Weights Generation
3.3.3. Summary Statistics Computation
3.4. Class Score Fusion for Classification
4. Experiments
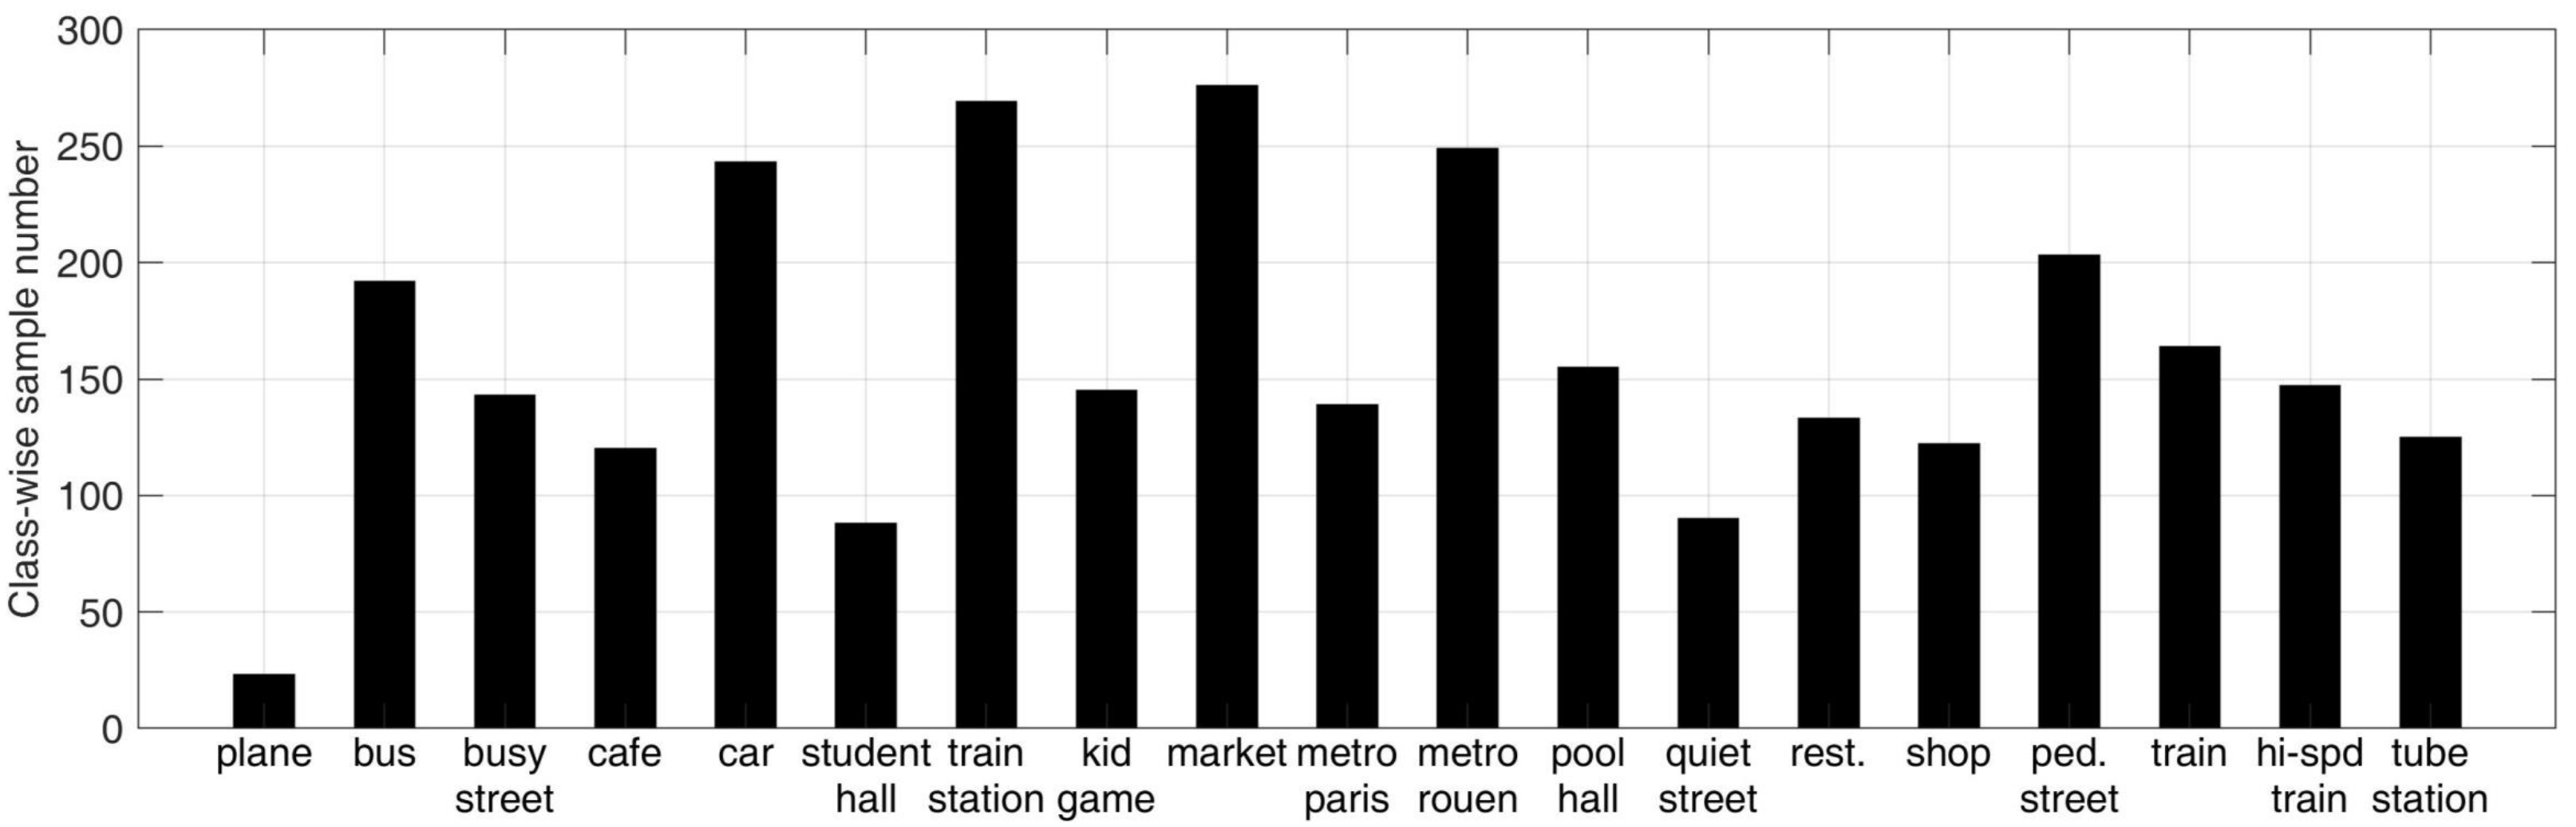
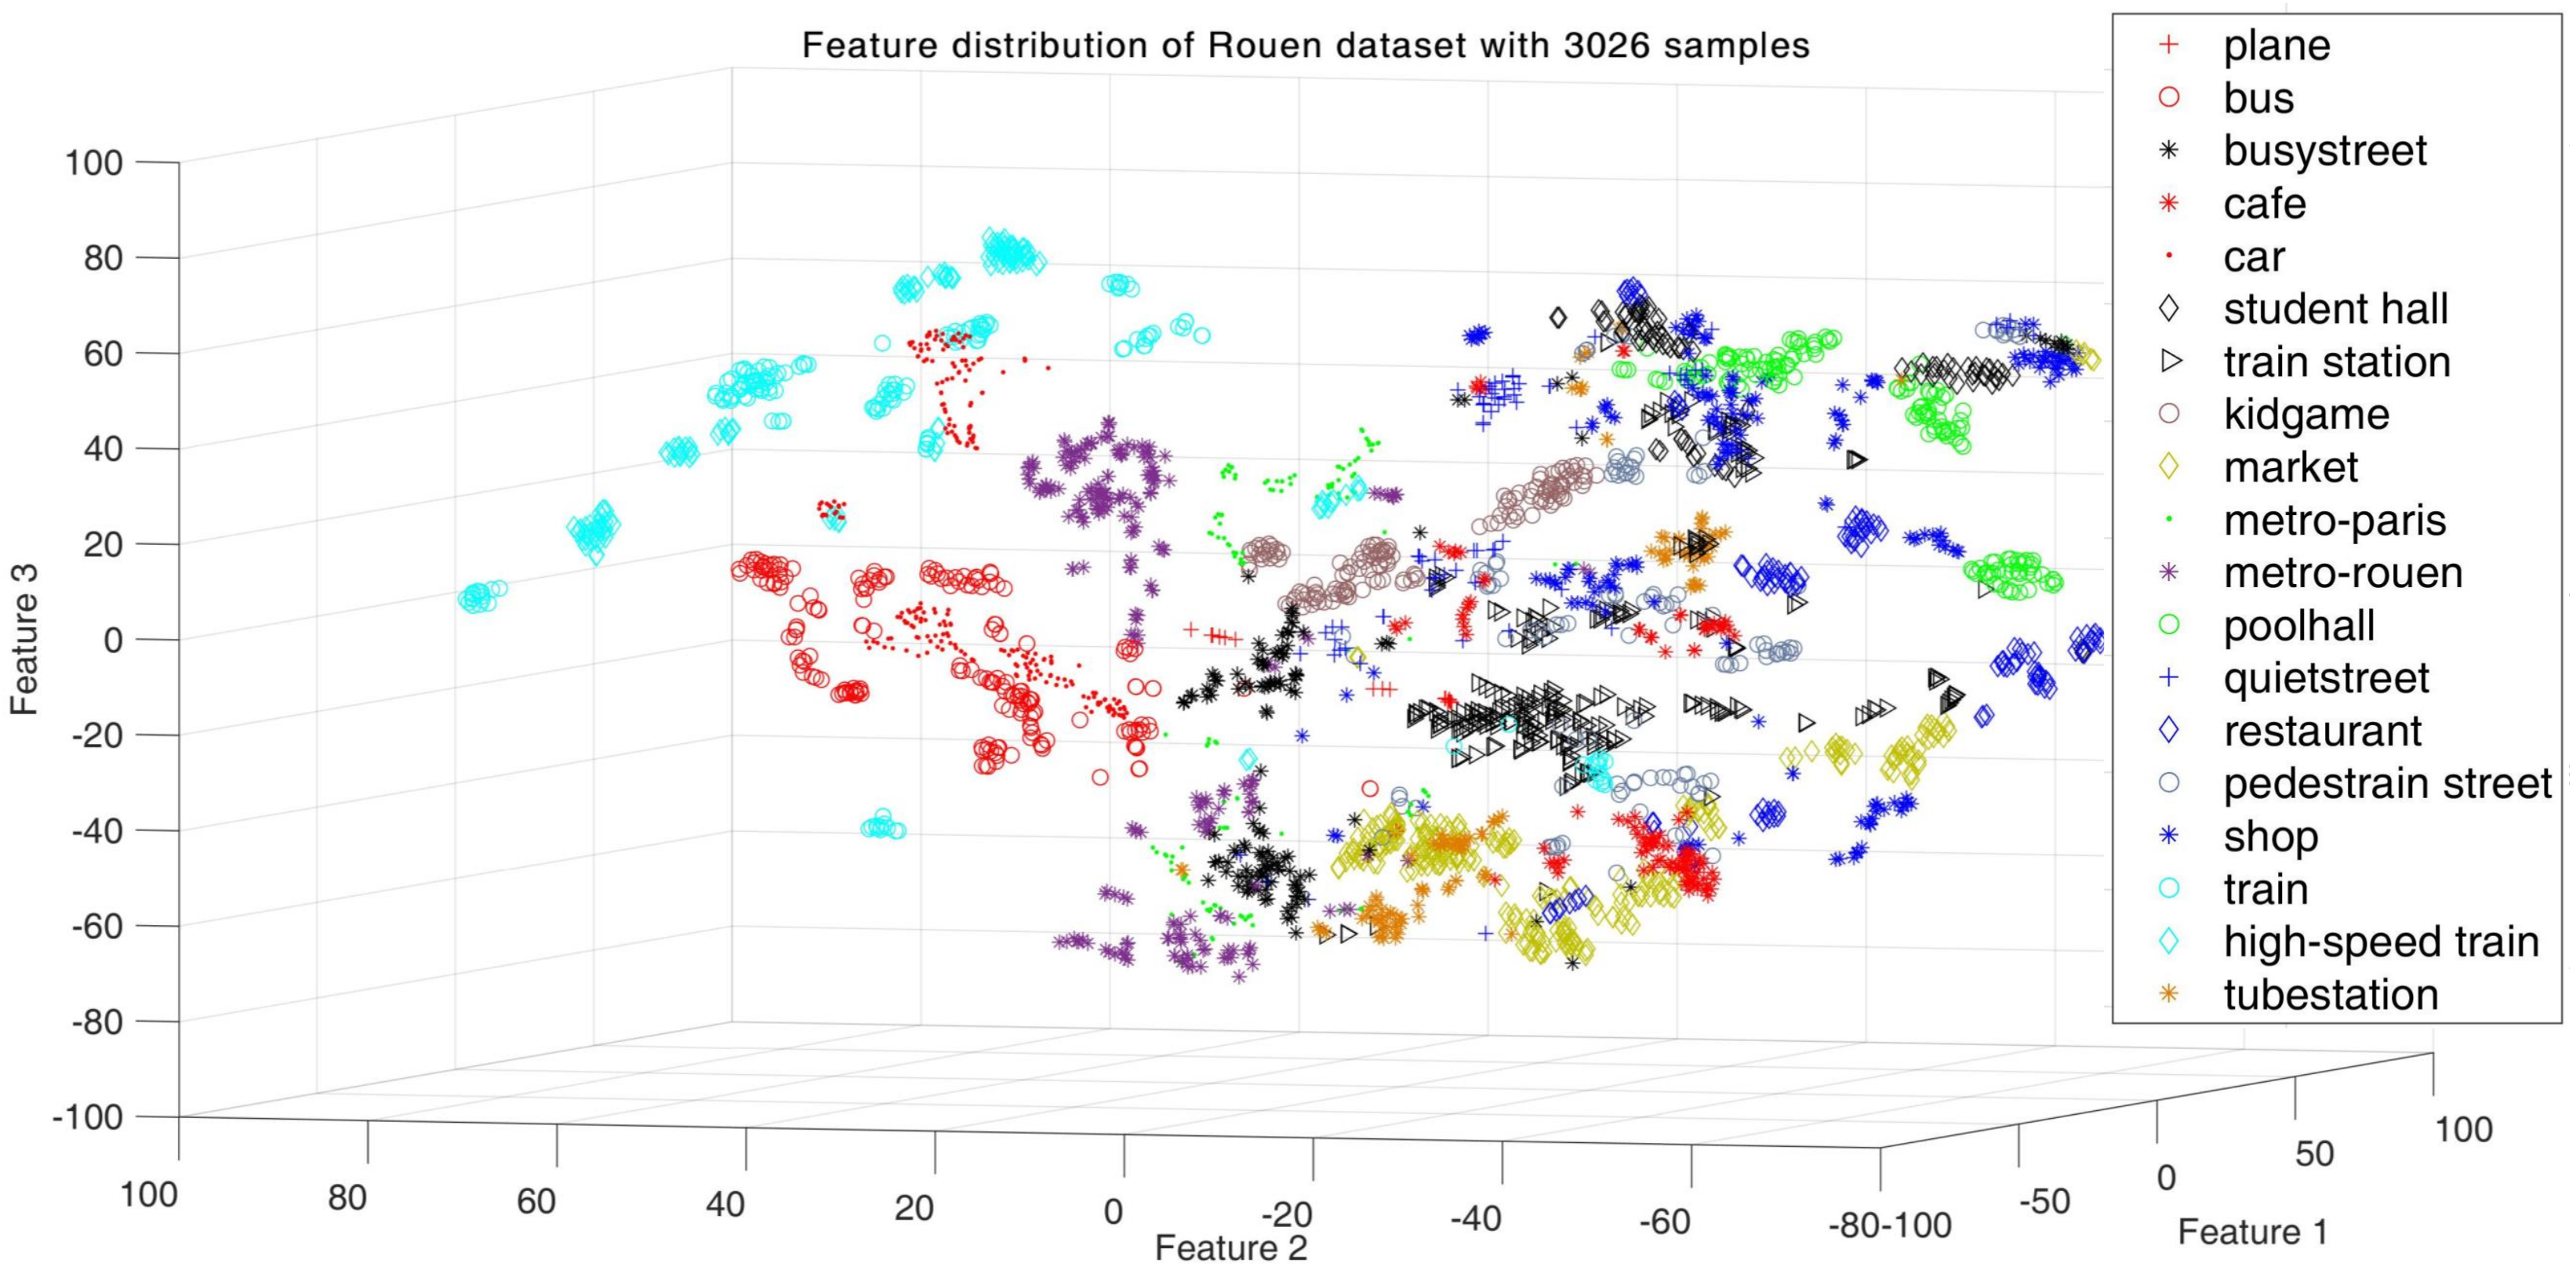
4.1. Dataset and Parameters
4.2. Evaluation of TFRs with Local Descriptors
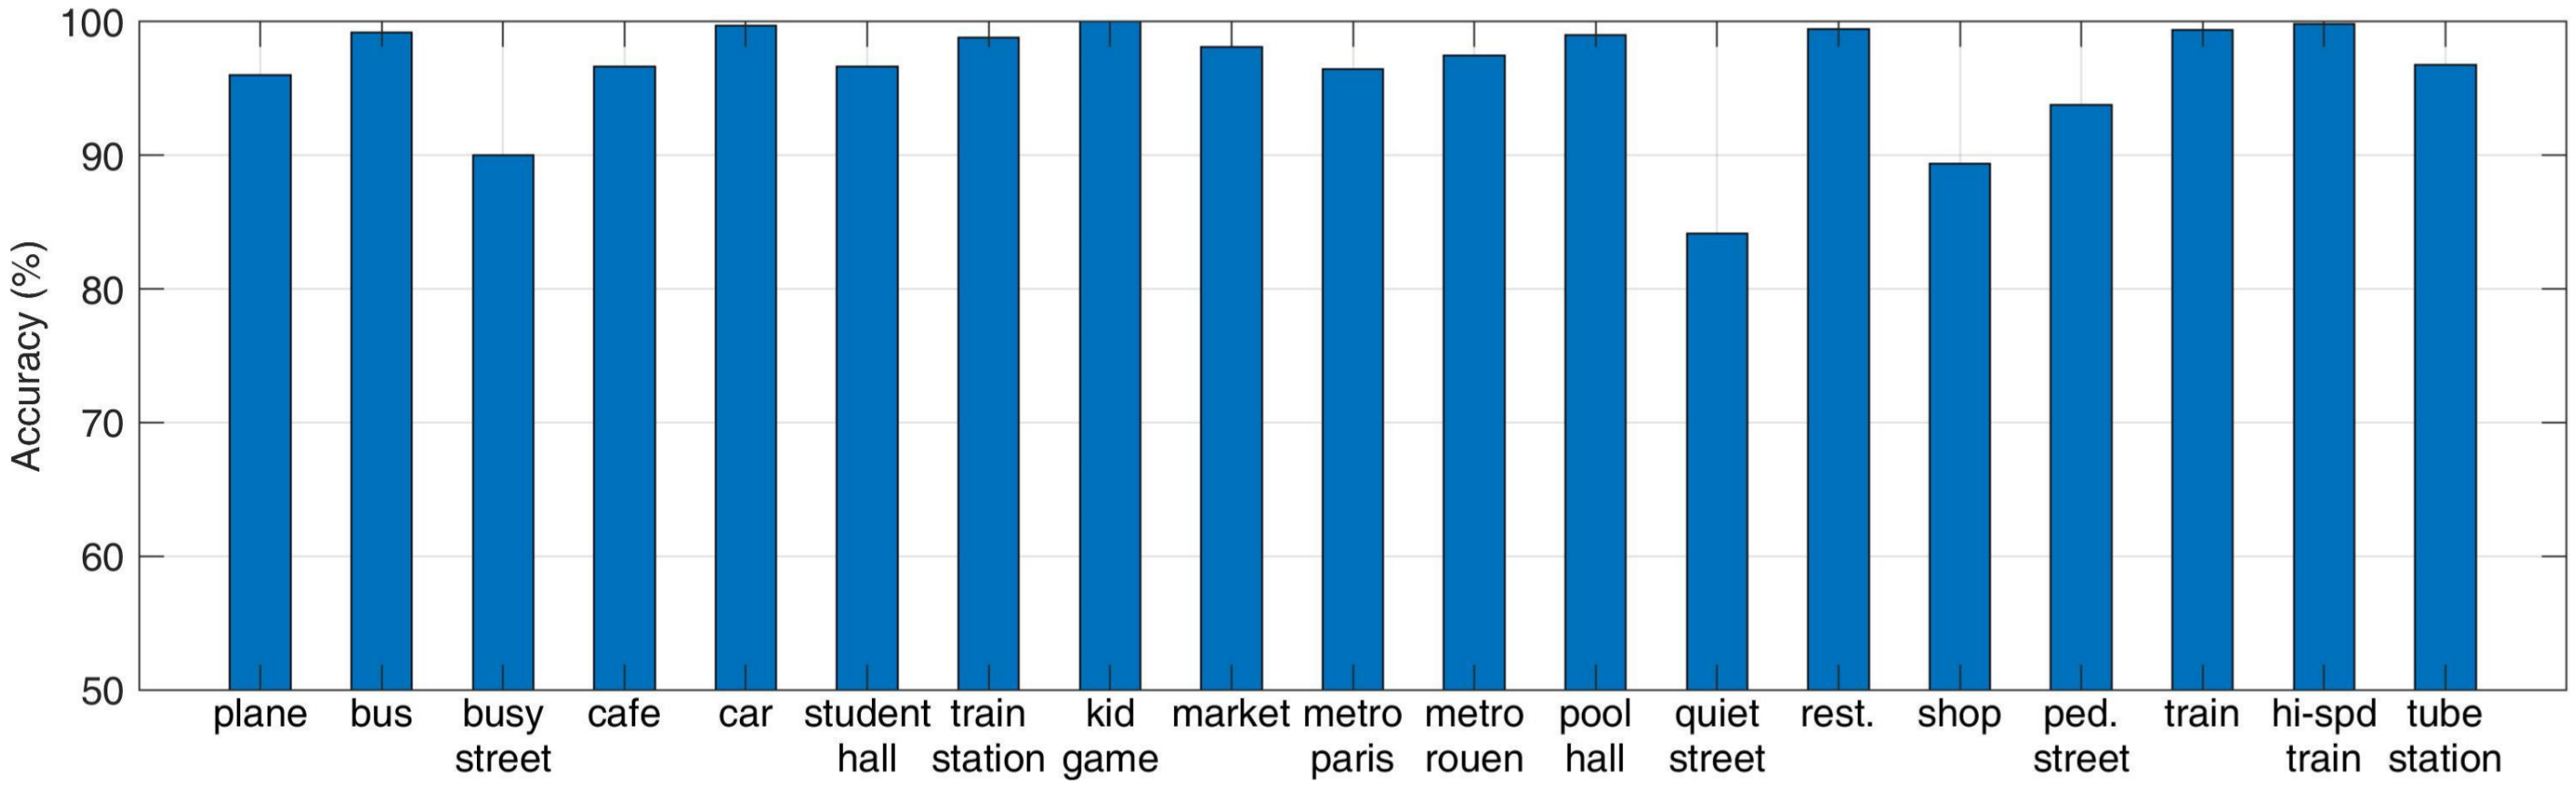
4.3. Evaluation of Acoustic Summary Statistics Extraction Scheme
5. Conclusions
Author Contributions
Funding
Conflicts of Interest
References
- Chu, S.; Narayanan, S.; Jay Kuo, C.C. Environmental sound recognition with time-frequency audio features. IEEE Trans. Audio Speech Lang. Process. 2009, 17, 1142–1158. [Google Scholar] [CrossRef]
- Barchiesi, D.; Giannoulis, D.; Stowell, D.; Plumbley, M.D. Acoustic scene classification: Classifying environments from the sounds they produce. IEEE Signal Process. Mag. 2015, 32, 16–34. [Google Scholar] [CrossRef]
- Wang, W. Machine Audition: Principles, Algorithms and Systems; IGI Global Press: Hershey, PA, USA, 2011. [Google Scholar]
- McDermott, J.H.; Simoncelli, E.P. Sound texture perception via statistics of the auditory periphery: Evidence from sound synthesis. Neuron 2011, 71, 926–940. [Google Scholar] [CrossRef] [PubMed]
- McDermott, J.H.; Schemitsch, M.; Simoncelli, E.P. Summary statistics in auditory perception. Nat. Neurosci. 2013, 16, 493–498. [Google Scholar] [CrossRef] [PubMed]
- Jrgen, T.; Geiger, B.S.; Rigoll, G. Recognising acoustic scenes with large-scale audio feature extraction and svm. Tech. Rep. 2013. [Google Scholar]
- Ellis, D.P.W.; Zeng, X.; Mcdermott, J.H. Classifying soundtracks with audio texture features. In Proceedings of the 2011 IEEE International Conference on Acoustics, Speech and Signal Processing (ICASSP), Prague, Czech Republic, 22–27 May 2011. [Google Scholar]
- Salamon, J.; Jacoby, C.; Bello, J.P. A dataset and taxonomy for urban sound research. In Proceedings of the 22nd ACM international conference on Multimedia, Orlando, FL, USA, 3–7 November 2014. [Google Scholar]
- Krijnders, J.D.; Ten Holt, G. A tone-fit feature representation for scene classification. Energy 2013, 400, 500. [Google Scholar]
- Nelken, I.; de Cheveigne, A. An ear for statistics. Nat. Neurosci. 2013, 16, 381–382. [Google Scholar] [CrossRef] [PubMed]
- Yu, G.; Slotine, J.J. Audio classification from timefrequency texture. arXiv, 2008; arXiv:0809.4501. [Google Scholar]
- Kobayashi, T.; Ye, J. Acoustic feature extraction by statistics based local binary pattern for environmental sound classification. In Proceedings of the 2014 IEEE International Conference on Acoustics, Speech and Signal Processing (ICASSP), Florence, Italy, 4–9 May 2014. [Google Scholar]
- Ye, J.; Kobayashi, T.; Murakawa, M.; Higuchi, T. Acoustic scene classification based on sound textures and events. In Proceedings of the 23rd ACM international conference on Multimedia, Brisbane, Australia, 26–30 October 2015. [Google Scholar]
- Rakotomamonjy, A.; Gasso, G. Histogram of gradients of time-frequency representations for audio scene classification. IEEE/ACM Trans. Audio Speech Lang. Process. 2015, 23, 142–153. [Google Scholar]
- Virtanen, T.; Mesaros, A.; Heittola, T.; Diment, A.; Vincent, E.; Benetos, E.; Elizalde, B. DCASE2017 Challenge Setup: Tasks, Datasets and Baseline System. In Proceedings of the Detection and Classification of Acoustic Scenes and Events 2017 Workshop (DCASE2017), Munich, Germany, 16–17 November 2017. [Google Scholar]
- Hershey, S.; Chaudhuri, S.; Ellis, D.P.; Gemmeke, J.F.; Jansen, A.; Moore, R.C.; Plakal, M.; Platt, D.; Saurous, R.A.; Seybold, B.; et al. CNN architectures for large-scale audio classification. In Proceedings of the 2017 IEEE International Conference on Acoustics, Speech and Signal Processing (ICASSP), New Orleans, LA, USA, 5–9 March 2017. [Google Scholar]
- Valenti, M.; Squartini, S.; Diment, A.; Giambattista Parascandolo, G.; Virtanen, T. A convolutional neural network approach for acoustic scene classification. In Proceedings of the 2017 International Joint Conference on Neural Networks (IJCNN), Anchorage, AK, USA, 14–19 May 2017. [Google Scholar]
- Mun, S.; Park, S.; Han, D.K.; Ko, H. Generative adversarial network based acoustic scene training set augmentation and selection using SVM hyper-plane. In Proceedings of the Detection and Classification of Acoustic Scenes and Events, Munich, Germany, 16 November 2017. [Google Scholar]
- Brown, J.C. Calculation of a constant q spectral transform. J. Acoust. Soc. Am. 1991, 89, 1. [Google Scholar] [CrossRef]
- Shinohara, Y.; Otsu, N. Facial expression recognition using fisher weight maps. In Proceedings of the Sixth IEEE International Conference on Automatic Face and Gesture Recognition, Seoul, South Korea, 19 May 2004. [Google Scholar]
- He, D.-C.; Wang, L. Texture unit, texture spectrum, and texture analysis. IEEE Trans. Geosci. Remote Sens. 1990, 28, 509–512. [Google Scholar]
- Christopher, M.; Bishop, P.R.; Learning, M. Information Science and Statistics; Springer: Secaucus, NJ, USA, 2006. [Google Scholar]
- Maaten, L.; Hinton, G. Visualizing data using t-SNE. J. Mach. Learn. Res. 2008, 9, 2579–2605. [Google Scholar]
- Phan, H.; Hertel, L.; Maass, M.; Koch, P.; Mazur, R.; Mertins, A. Improved audio scene classification based on label-tree embeddings and convolutional neural networks. IIEEE/ACM Trans. Audio Speech Lang. Process. 2017, 25, 1278–1290. [Google Scholar] [CrossRef]
- Kobayashi, T.; Ye, J. Discriminatively learned filter bank for acoustic features. In Proceedings of the 2016 IEEE International Conference on Acoustics, Speech and Signal Processing (ICASSP), Shanghai, China, 20–25 March 2016. [Google Scholar]
- Bisot, V.; Essid, S.; Richard, G. HOG and subband power distribution image features for acoustic scene classification. In Proceedings of the 2015 23rd European Signal Processing Conference (EUSIPCO), Nice, France, 31 August–4 September 2015. [Google Scholar]


| Spectro. | Mel-Spectro. | CQT | MFCC | |
|---|---|---|---|---|
| raw | 77.38% | 84.48% | 81.13% | 71.14% |
| w/HLAC | 37.84% | 85.20% | 82.58% | 86.58% |
| w/LBP | 94.21% | 88.98% | 95.79% | 73.13% |
| w/HOG | 91.61% | 74.68% | 96.13% | 64.31% |
© 2018 by the authors. Licensee MDPI, Basel, Switzerland. This article is an open access article distributed under the terms and conditions of the Creative Commons Attribution (CC BY) license (http://creativecommons.org/licenses/by/4.0/).
Share and Cite
Ye, J.; Kobayashi, T.; Toyama, N.; Tsuda, H.; Murakawa, M. Acoustic Scene Classification Using Efficient Summary Statistics and Multiple Spectro-Temporal Descriptor Fusion. Appl. Sci. 2018, 8, 1363. https://doi.org/10.3390/app8081363
Ye J, Kobayashi T, Toyama N, Tsuda H, Murakawa M. Acoustic Scene Classification Using Efficient Summary Statistics and Multiple Spectro-Temporal Descriptor Fusion. Applied Sciences. 2018; 8(8):1363. https://doi.org/10.3390/app8081363
Chicago/Turabian StyleYe, Jiaxing, Takumi Kobayashi, Nobuyuki Toyama, Hiroshi Tsuda, and Masahiro Murakawa. 2018. "Acoustic Scene Classification Using Efficient Summary Statistics and Multiple Spectro-Temporal Descriptor Fusion" Applied Sciences 8, no. 8: 1363. https://doi.org/10.3390/app8081363
APA StyleYe, J., Kobayashi, T., Toyama, N., Tsuda, H., & Murakawa, M. (2018). Acoustic Scene Classification Using Efficient Summary Statistics and Multiple Spectro-Temporal Descriptor Fusion. Applied Sciences, 8(8), 1363. https://doi.org/10.3390/app8081363