Article

Classification of Children’s Sitting Postures Using Machine Learning Algorithms

1
Department of Industrial Engineering & Institute for Industrial System Innovation, Seoul National University, Seoul 08826, Korea
2
Department of Industrial and Systems Engineering, Dongguk University—Seoul, Seoul 04620, Korea
*
Author to whom correspondence should be addressed.
Appl. Sci. 2018, 8(8), 1280; https://doi.org/10.3390/app8081280
Submission received: 11 July 2018 / Revised: 28 July 2018 / Accepted: 30 July 2018 / Published: 1 August 2018
(This article belongs to the Special Issue Deep Learning and Big Data in Healthcare)

Abstract

:
Sitting on a chair in an awkward posture or sitting for a long period of time is a risk factor for musculoskeletal disorders. A postural habit that has been formed cannot be changed easily. It is important to form a proper postural habit from childhood as the lumbar disease during childhood caused by their improper posture is most likely to recur. Thus, there is a need for a monitoring system that classifies children’s sitting postures. The purpose of this paper is to develop a system for classifying sitting postures for children using machine learning algorithms. The convolutional neural network (CNN) algorithm was used in addition to the conventional algorithms: Naïve Bayes classifier (NB), decision tree (DT), neural network (NN), multinomial logistic regression (MLR), and support vector machine (SVM). To collect data for classifying sitting postures, a sensing cushion was developed by mounting a pressure sensor mat (8 × 8) inside children’s chair seat cushion. Ten children participated, and sensor data was collected by taking a static posture for the five prescribed postures. The accuracy of CNN was found to be the highest as compared with those of the other algorithms. It is expected that the comprehensive posture monitoring system would be established through future research on enhancing the classification algorithm and providing an effective feedback system.

1. Introduction

The sedentary lifestyle is prevalent in modern society. Among the sedentary behaviors, sitting in a chair is a routine behavior of office workers and students in their work environment. However, prolonged sitting behavior and awkward sitting postures have been reported to act as negative factors affecting health. Prolonged sitting has been known to be associated with premature mortality [1], chronic illness [2], metabolic syndrome [3], and obesity [4]. Moreover, sitting with poor posture could have a negative influence on the lumbar health [5]. An excessive flexion and extension of the lumbar are representative patterns of poor sitting postures, which cause high compression in the lumbar [6]. In particular, back pain in childhood caused by improper sitting posture can be a risk factor for lumbar disease in adulthood [7]. Therefore, it is important to form correct postural habits from childhood. To prevent the occurrence of these illnesses, one should maintain a good sitting posture and take a break at the appropriate time intervals when performing tasks. However, it is difficult for people to maintain a correct posture with constant awareness or to change one’s incorrect postural habits by oneself.
On this basis, researches have been conducted for developing a posture monitoring system that helps people to maintain a correct posture. The dominant approach is to use pressure distribution data obtained from pressure sensors attached to chair structures such as a seat and backrest. To realize this system, it is necessary for the process of classifying the sitting posture accurately in real time to precede the development of the posture monitoring system. Previous studies have adopted several conventional algorithms for classifying sitting postures such as the Hidden Markov Models (HMM), Naïve Bayes (NB) classifier and k-nearest neighbor (kNN) classifier [8,9,10]. Conventional machine learning algorithms including neural network, support vector machine (SVM), and kNN are still being adopted in various research objectives such as fault diagnosis, wind speed prediction, and thermal anomalies identification [11,12,13,14]. Recently, it has been proven that high performance can be obtained by using deep learning in various research fields such as image processing, and speech recognition. The convolutional neural network (CNN) is a prevalent type of deep learning algorithm, and it has a structure that can fully utilize two-dimensional input data. Thus, it has been widely applied to various image recognition fields such as motor fault diagnosis, vision-based mobile robot navigation, physiological signal analysis in medical assessment and human emotion recognition [15,16,17,18]. To our best knowledge, however, the CNN algorithm has not been used for research on the classification of sitting postures for children. As the pressure distribution data has two-dimensional of image structure, it is reasonable to assume that the sitting posture presented based on the pressure distribution could be classified using a CNN algorithm.
Previous studies on the classification of sitting postures were not focused on a particular algorithm. The reason for applying various algorithms is that the classification performance is affected by both the characteristics of the algorithm and the data set. It can be inferred that it is necessary to identify the optimal classification algorithm for various experimental environments. Most of the previous studies have focused on adults only, not children. However, as children have different physical characteristics from adults and as children in the growth phase exhibit large variations within a group, the results of previous experiments may differ from those obtained in studies comprising adult participants [19]. Furthermore, in studies that perform postural classification, it is important to target children since the habit of sitting in the right posture in childhood is more important when compared with adulthood. First of all, inappropriate sitting postural habits formed in childhood are not easily corrected when they become adults [20]. It implies that it is most likely that the wrong posture habit will be maintained even after becoming an adult. In addition, back pain caused by inappropriate posture in childhood is likely to develop again [21]. Thus, the posture classification study for children can help to prevent lumbar disease in the long term by encouraging the correct postural habit formation during childhood.
Therefore, the objective of this study is to classify the sitting postures of children via conventional algorithms and deep learning-based algorithm using the body pressure distribution data from pressure sensors. The conventional machine learning algorithms used in this study are Naïve Bayes classifier (NB), decision tree (DT), neural network (NN), and SVM. Through a comparison of the application of CNN and conventional machine learning algorithms on the data set obtained from the pressure distribution data for children, we investigate the effectiveness of our approach wherein the CNN algorithm is applied while ensuring reliability through a validation analyses (average value of accuracy = 0.953). The remainder of this study is organized as follows. Section 2 contains a literature review of the related studies and machine learning algorithms. Section 3 describes the methods of the experiment and data processing. Section 4 presents the results of the validation analysis for each machine learning algorithm and the further analysis results of the CNN algorithm are presented. Section 5 discusses the results of the machine learning algorithms used in this study and compares them with the results of the previous studies. Finally, the conclusions are summarized in Section 6 along with the applications of this study and the scope for future study.

2. Related Work

2.1. Sitting Posture Classification

Several methods have been adopted to measure sitting posture and classify it. Camera, is one of the method used to identify and capture sitting postures [22]. Sensors can also be used by being attached to the user’s back to recognize sitting postures based on motion data [23,24,25]. However, the former introduces issues with respect to privacy and unnatural behavior owing to negative feelings caused by being monitored [26], and the latter has drawbacks of the possibility of inducing unnatural movements owing to the attached sensors [27]. The use of pressure sensors mounted on the parts of a chair (e.g., seat and backrest) has been employed to classify sitting postures to overcome these issues. Previous studies have been performed for classifying sitting postures of users by attaching pressure sensors to chair structures such as the seat and backrest as a method to overcome the aforementioned issues. Table 1 shows the previous studies in which posture classification was performed, including the number of pressure sensors used, the locations in which they were installed, participant information, the number of predicted sitting conditions, the algorithm used, and the overall accuracy.
Although the number of sensors used in previous studies varied, these studies can be largely divided into two types depending on the location of installation of the sensor. In one type, the sensor was attached to the seat only [26,28,29], and in the other type the sensor was attached to both the seat and backrest [9,30,31,32]. In addition to the pressure sensor, Benocci et al. [8] used additional sensors such as kinetic related and temperature sensors to classify the sitting postures. Most of the previous studies attempted to classify the sitting upright posture in which the waist is straight, and the feet are placed flat on the floor, the postures in which the upper body is tilted forward, backward, left, or right, and the postures in which the left or right leg is crossed. In the case of the classification of various other postures, the postures in which the legs are crossed were segmented (e.g., one leg over the other, one leg over the other with one foot on the other, one foot on the seat under the other leg’s thigh) [32]. In addition, there were also cases wherein the movement pattern of the upper body and whether the user was seated were predicted [28,31]. Various methods have been adopted for classifying the sitting postures, and they include the use of PCA [32], Naïve Bayes classifier [10], hybrid cascade sitting posture classifier [30], SVM [29,33], kNN [9], dynamic time warping-based classification [26], and density-based methods [28]. Ma et al. [30] have compared the classification performance obtained on applying DT, SVM, and multilayer perception.

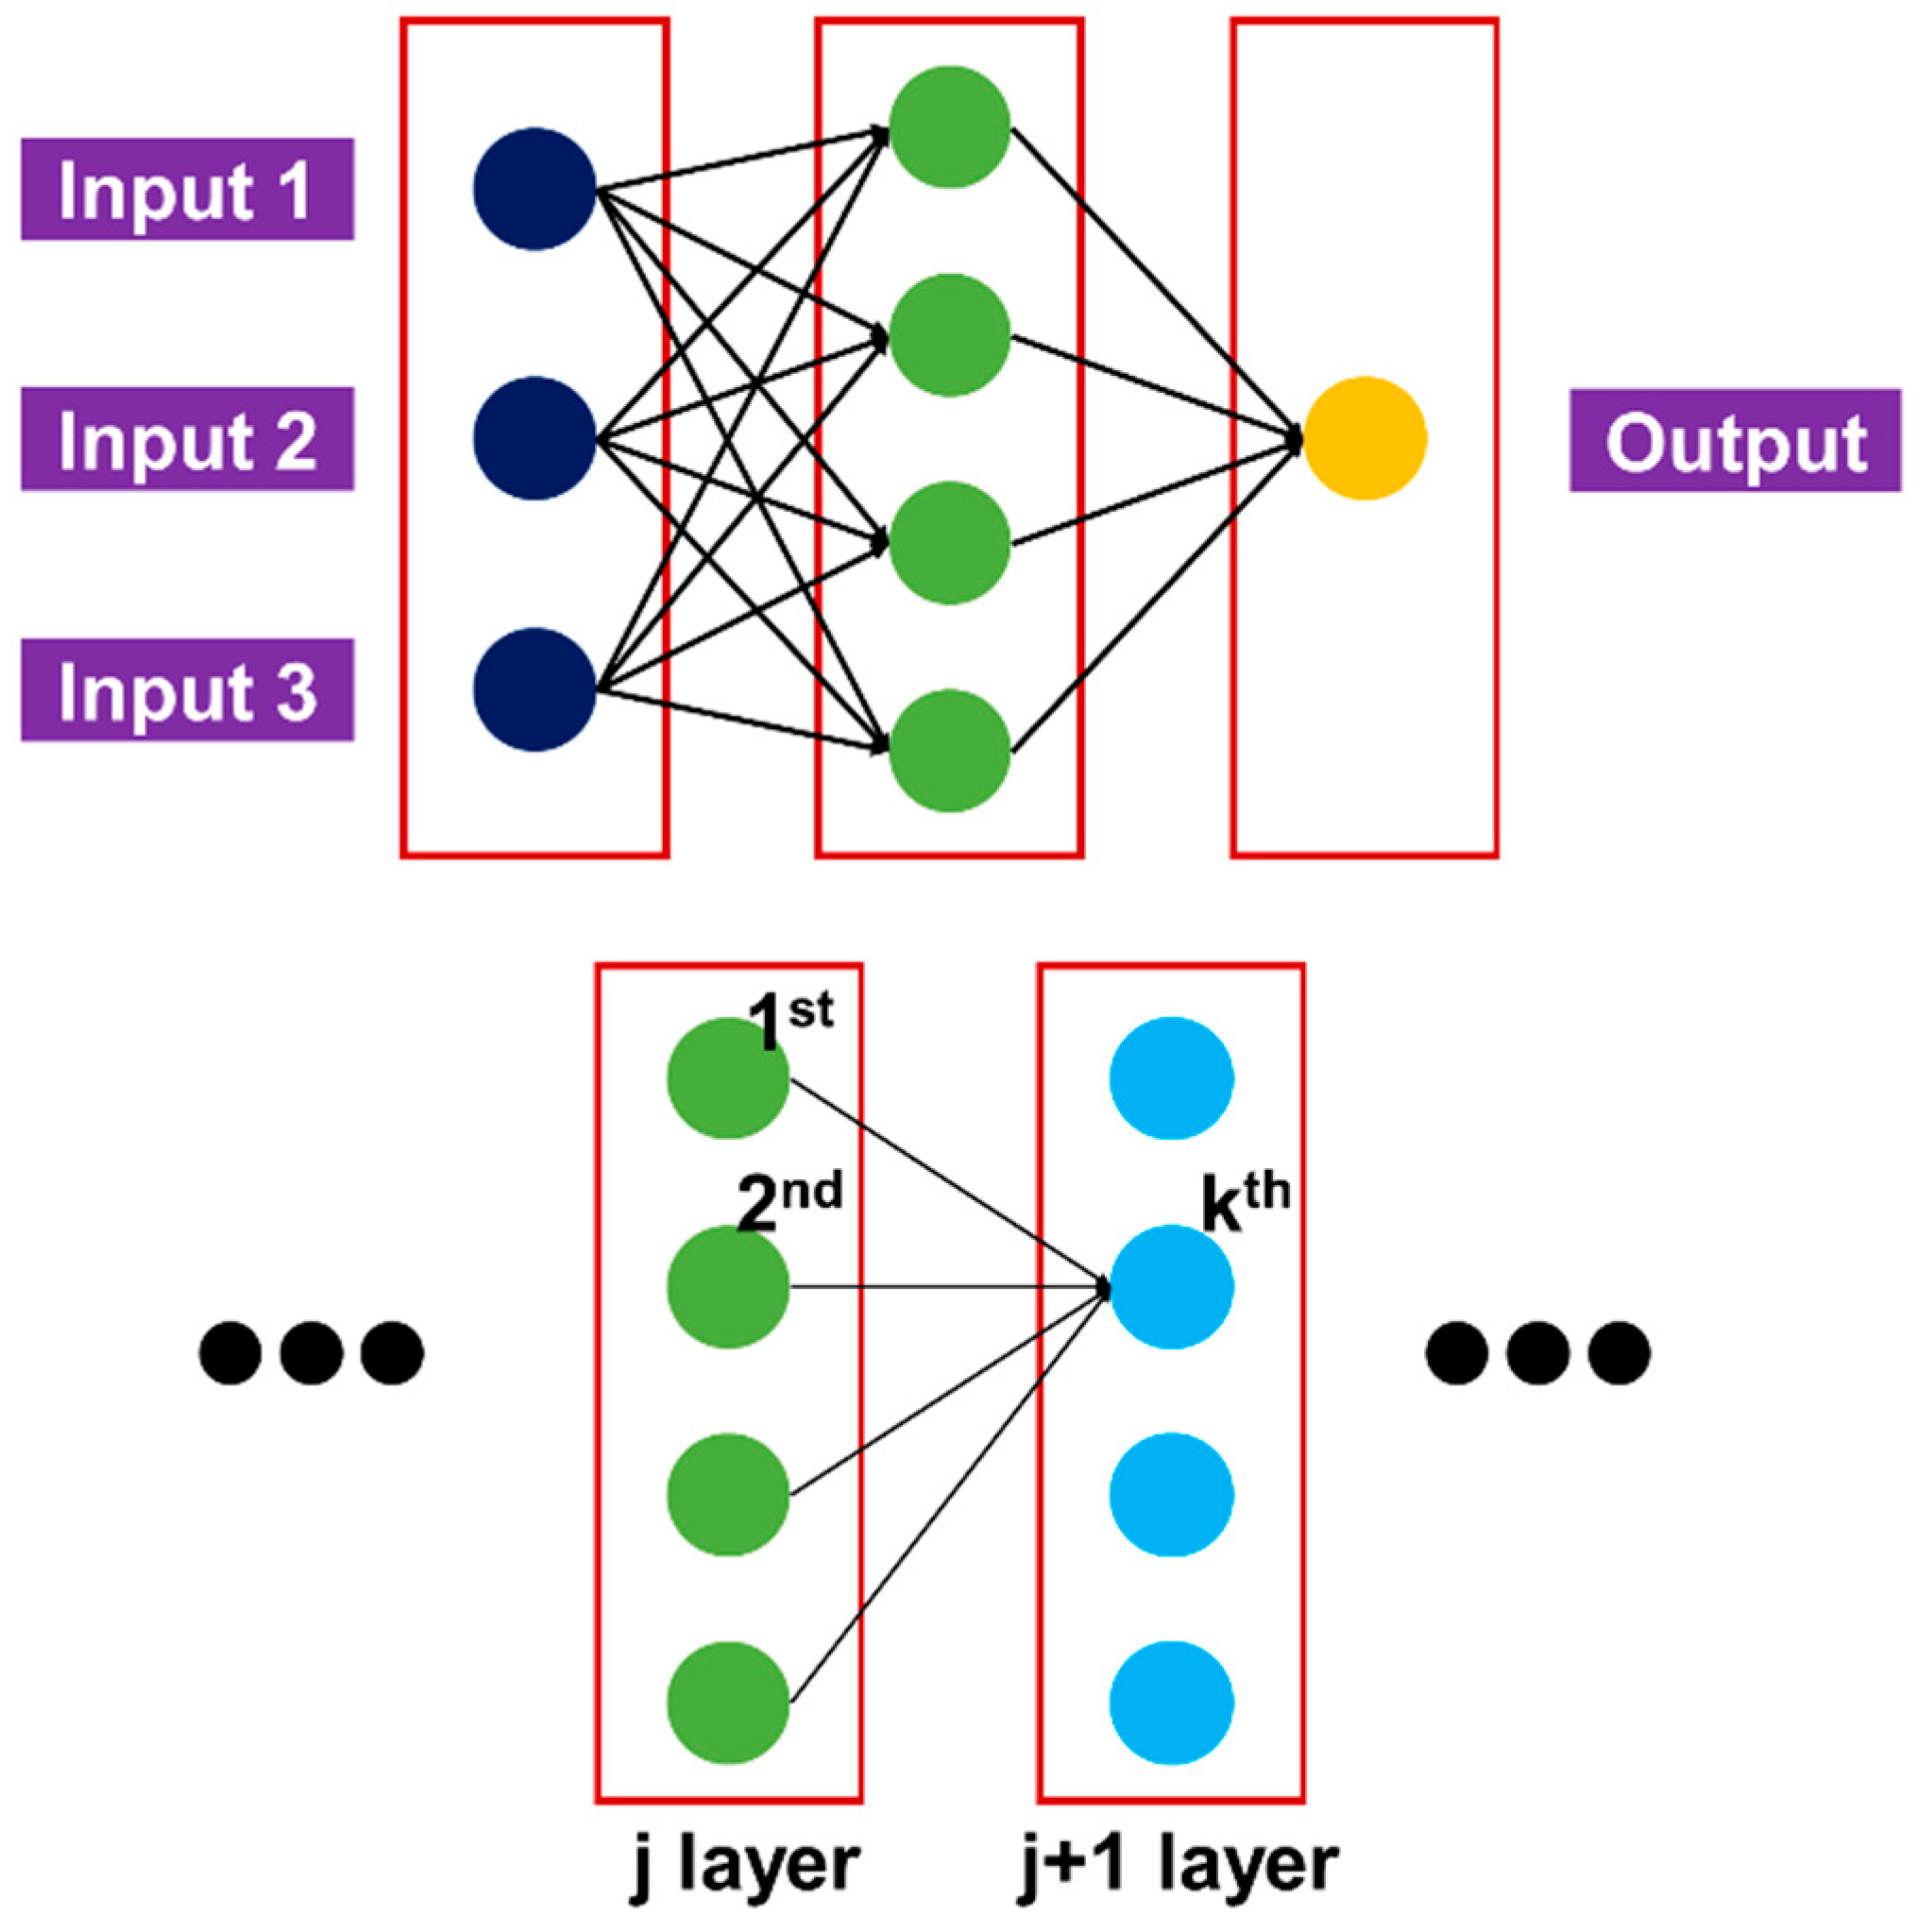
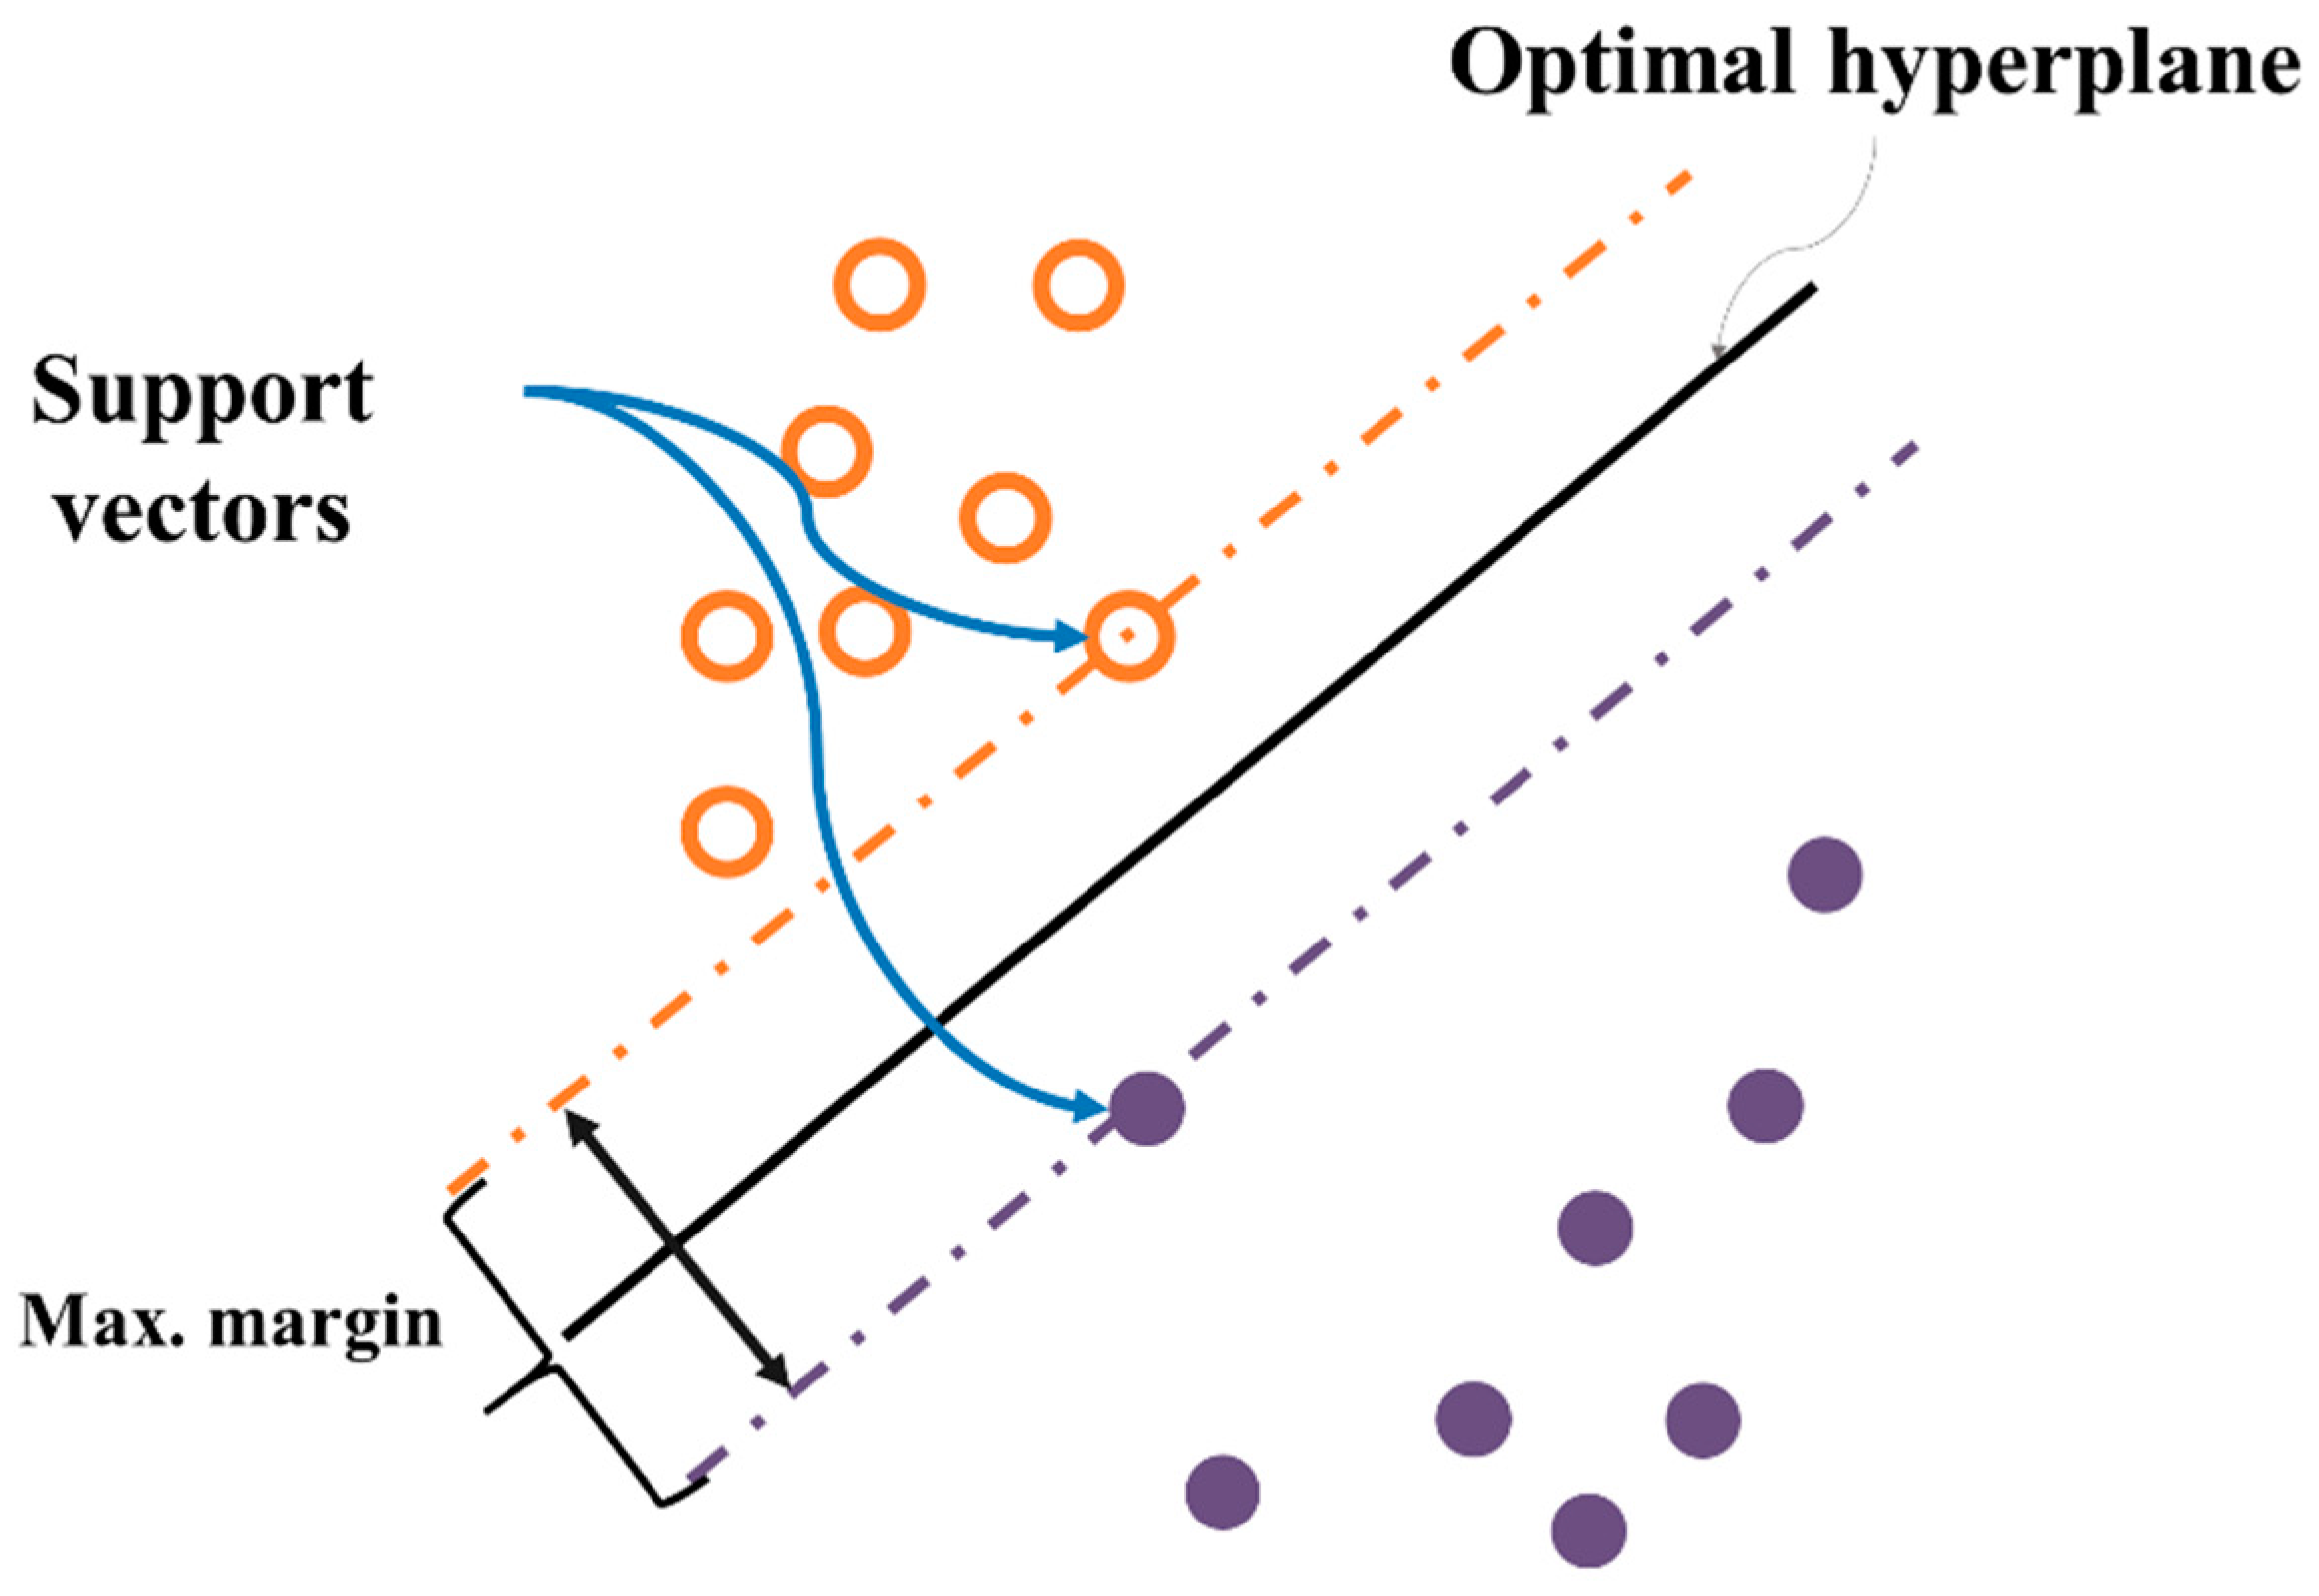
2.2. Learning Algorithm
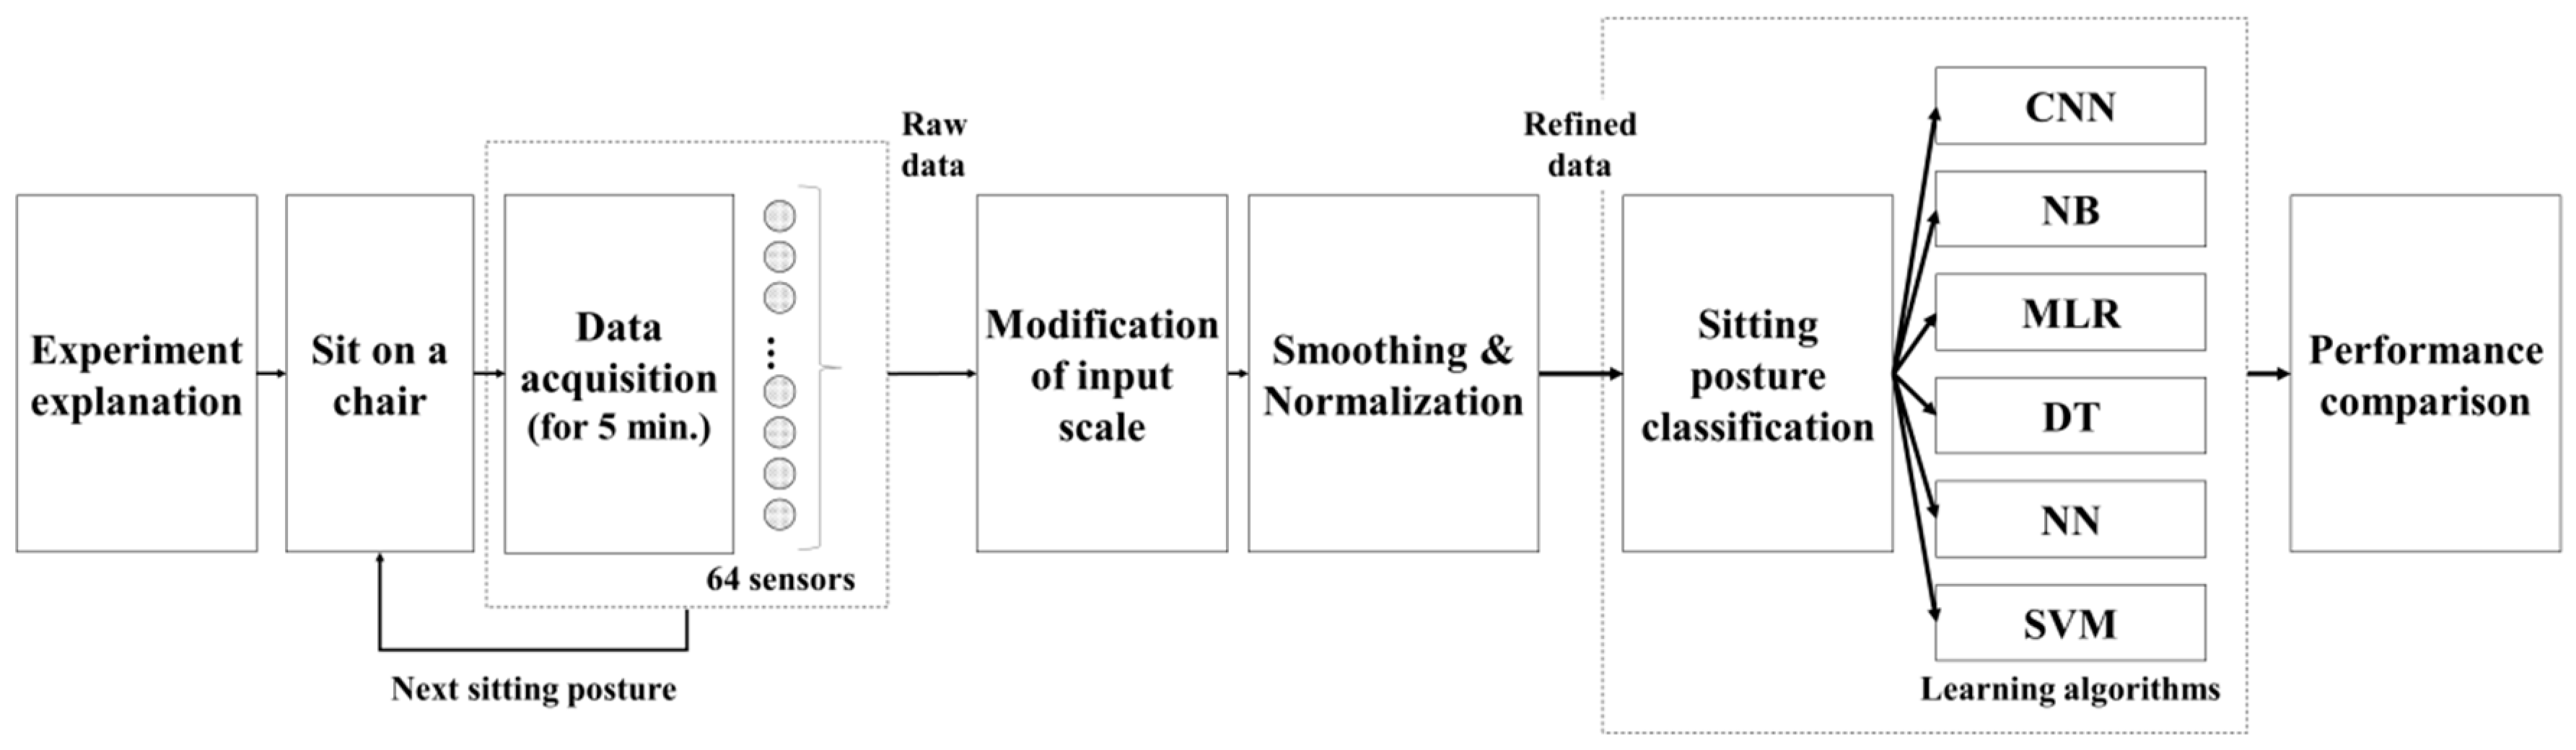
The LeNet-5 which is one of the early CNN model proposed by LeCun for use in character recognition is specialized in adaptive image processing [34]. CNN is easier to train than other types of feedforward artificial neural network techniques and has the advantage of using fewer parameters. For this reason, CNN has been applied in various fields [35,36,37]. The structure of a common CNN is shown in Figure 1. It consists of a series of layers. Each layer contains one or more planes. Each plane receives inputs from a small neighborhood in the plane of the previous layer. Each plane can be viewed as a feature map with a fixed feature detector that is convolved to a local window that retrieves the plane from the previous layer. Multiple layers are used on each layer to detect multiple features. The layer is called the convolutional layer. Once the feature is detected, the exact location becomes less important. As a result, the convolutional layer typically follows a different layer that typically performs local averages and sub-samples operations. These layers are referred to as sub-sample layers. Finally, the network has a fully connected network that performs cataloguing operations using features extracted from the previous layer. The network was uniformly trained by a backpropagation algorithm.
The NB classifier is a supervised machine learning classifier, and it is a probabilistic classification algorithm based on the Bayes theorem. In this model, it is generally assumed that all attributes are independent of each other, given the class [38] and it is widely adopted to reduce the number of parameters. Equations (1)–(3) represent the Bayes rule, assumption of conditional independence, and classification rule for the new input data. According to Zhang [39], less training data is required to accurately estimate the parameters required for the classification as compared to other complex graphical models.
P ( Y = y k | x 1 , X n ) = P ( Y = y k ) P ( X 1 X n | Y = y k ) Σ j P ( y = y k ) P ( X 1 X n | y = y j )
p ( y = y K | X 1 X n ) = p ( Y = y k ) Π i P ( x i | Y = y k ) Σ j p ( Y = y i ) Π i p ( x i | Y = y j )
X n e w = ( X 1 X n ) , Y n e w arg max y k P ( Y = y k ) i P ( x i | y = y k )  
The multinomial logistic regression (MLR) classifier was introduced by McFadden, and it is a classification method that can be used to predict more than two possible discrete variables [40]. Similar to binary logistic regression, the probability of categorical membership is evaluated based on the maximum likelihood estimation. In addition, this model does not assume normality, linearity, or homoscedasticity [41].
The DT method is a regression analysis or classification method depending on whether the response variable is continuous or categorical. The DT learning algorithm was developed by Quinlan to construct decision tree from an obtained data set [42]. This model divides the space of the predictive variables and predicts the values of the dependent variables in the divided parts. The formation process of this model mainly consists of growth, pruning, feasibility assessment, interpretation, and forecasting. This algorithm forms a tree-like structure based on separation criterion concerning an impurity index such as entropy and the Gini index. According to Kamiński [43], this model consists of three types of nodes, which are the decision, chance, and end nodes. An example of a typical structure of this model is presented in Figure 2.
The NN is a statistical learning algorithm that is inspired by neural networks of the brain, which is an animal’s central nervous system [44]. To realize an acceptable performance, this model requires the use of a large number of interconnected neurons [45]. Generally, models of NNs are divided into feed forward NNs and recurrent NNs in terms of signaling schemes. The representative structure of this model is presented in Figure 3.
The output value of each node is calculated as follows:
O u t p u t = σ ( i N X i W i )
where N is a dimension of the input vector, X is a value of the input, and W is the weight value. A function σ (∙) is a sigmoid activation function, which facilitates expansion to a nonlinear model. A logistic function, hyperbolic tangent function, or probit function is commonly used as the activation function. In the training process, this algorithm determines the optimization weight value Wi. In a typical NN model consisting of multiple layers, the output value of the kth node in the nth layer is described as follows:
O u t p u t k n = σ ( X k n )
X k n = j W j k n o u t p u t j n 1
where σ is the activation function. Wikn is the weight value connected from the jth node of the n − 1th layer to the kth node of the nth layer. The output value derived from the jth node of the n − 1th layer serves as an input value. The weights are usually found by using the backpropagation method during the learning phase.
The SVM is a supervised learning model for pattern recognition and data analysis. It is mainly used for classification and regression analysis [46]. This algorithm finds a classifying hyperplane that can maximize margins in the feature space wherein the original data is mapped [47]. By solving the dual problem of the original optimization, it is only required to calculate the kernel function values, k ( x , y ) = ϕ ( x ) , ϕ ( y ) , the inner product of feature vectors instead of feature vectors themselves, where ϕ ( x ) is a mapping function from the original space to the feature space.
This characteristic dramatically increases flexibility of the mapping function and reduces computational cost. For example, the Gaussian (radial basis) kernel function, k ( x , y ) = exp ( γ | | x y | | 2 ) with the kernel scaling factor γ , can be employed to construct SVM models although the corresponding feature vector ϕ ( x ) cannot be explicitly calculated because it is represented as an infinite dimensional vector. The representative structure of this model is presented in Figure 4. Both one versus one extension and one versus all extension are generally employed to extend the binary classification task to multiclass classification tasks for SVM. For more details on SVM, please see [47].

3. Methods

The overall study and analysis procedure is shown in Figure 5. Participants are introduced to the experiment and after that instructed to take the specified sitting posture. Then researchers acquire real-time pressure data for 5 min from 64 sensors (8 by 8) installed in the seat. After enough rest time, the same experiment is carried out for the next sitting posture. After that, the input size of the raw data is modified. Preprocessing procedure was applied to the modified input data with smoothing and normalization. Using the refined data, a total of six learning algorithms are applied to classify sitting postures. Finally, we compare the performance of each classification algorithm. Details are covered in sub-sections below.

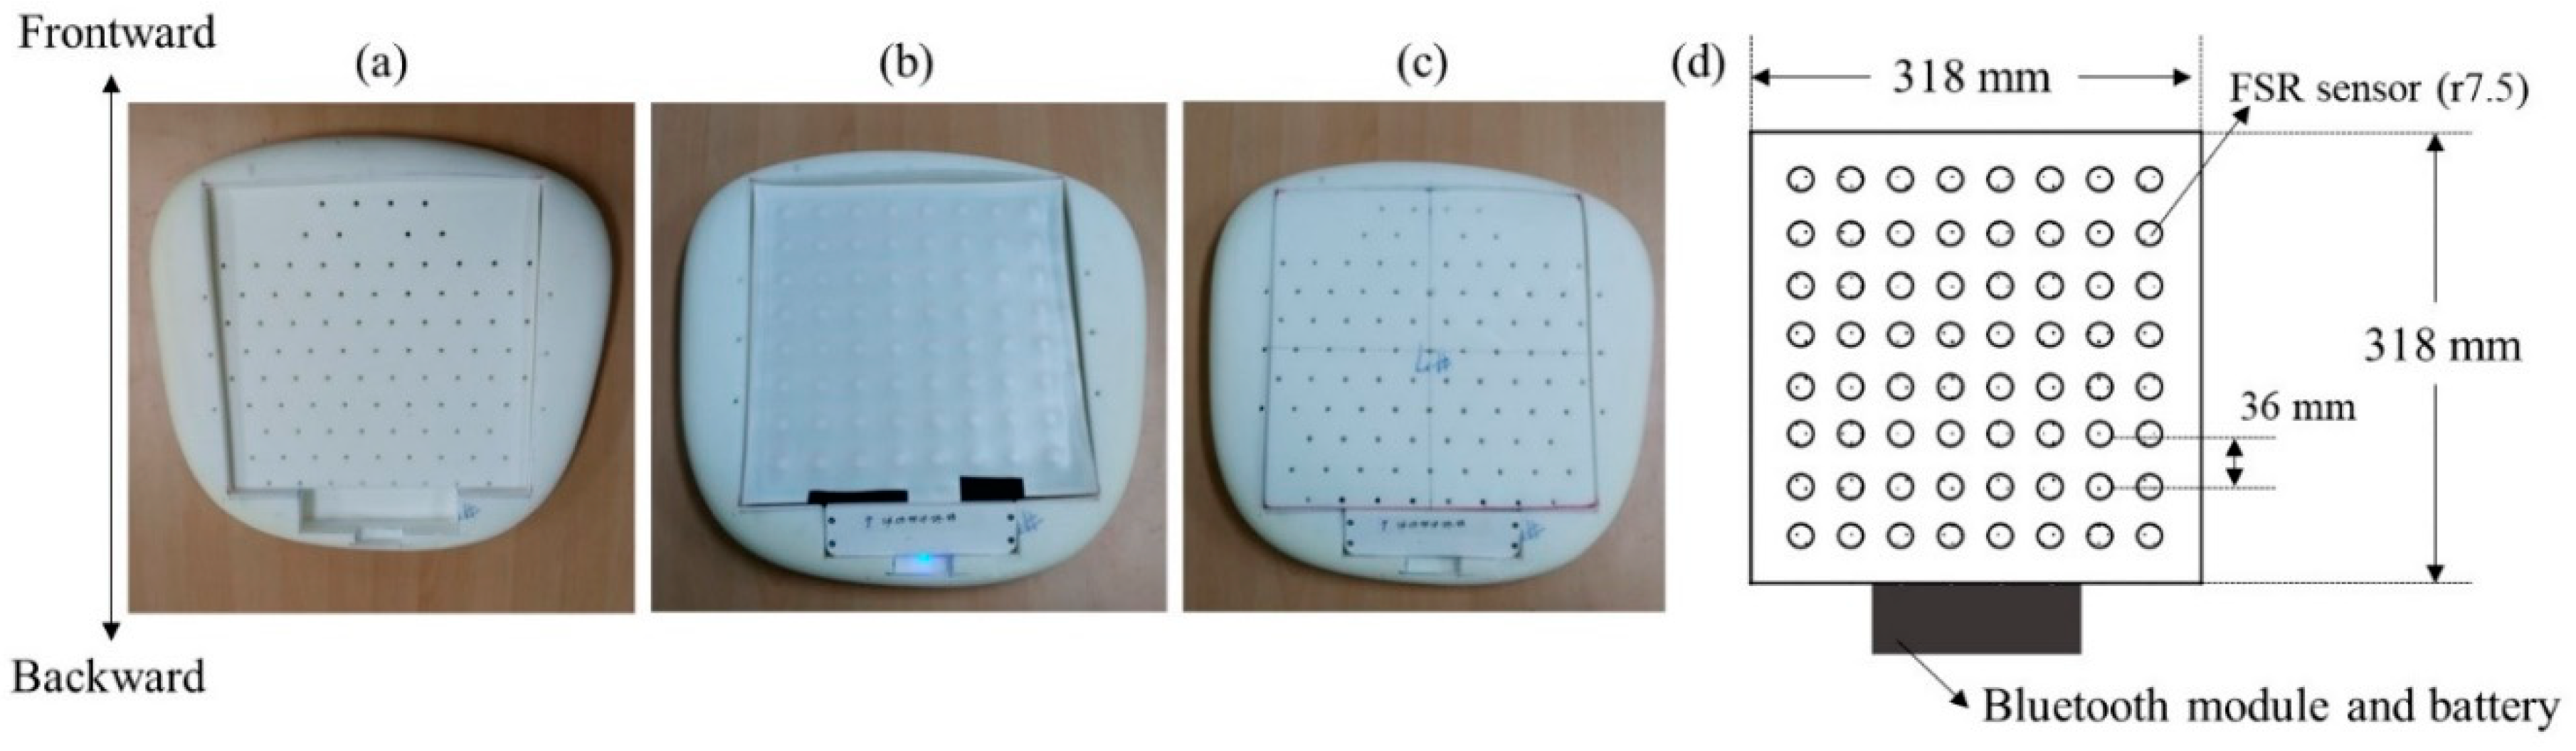
3.1. Sensor Apparatus
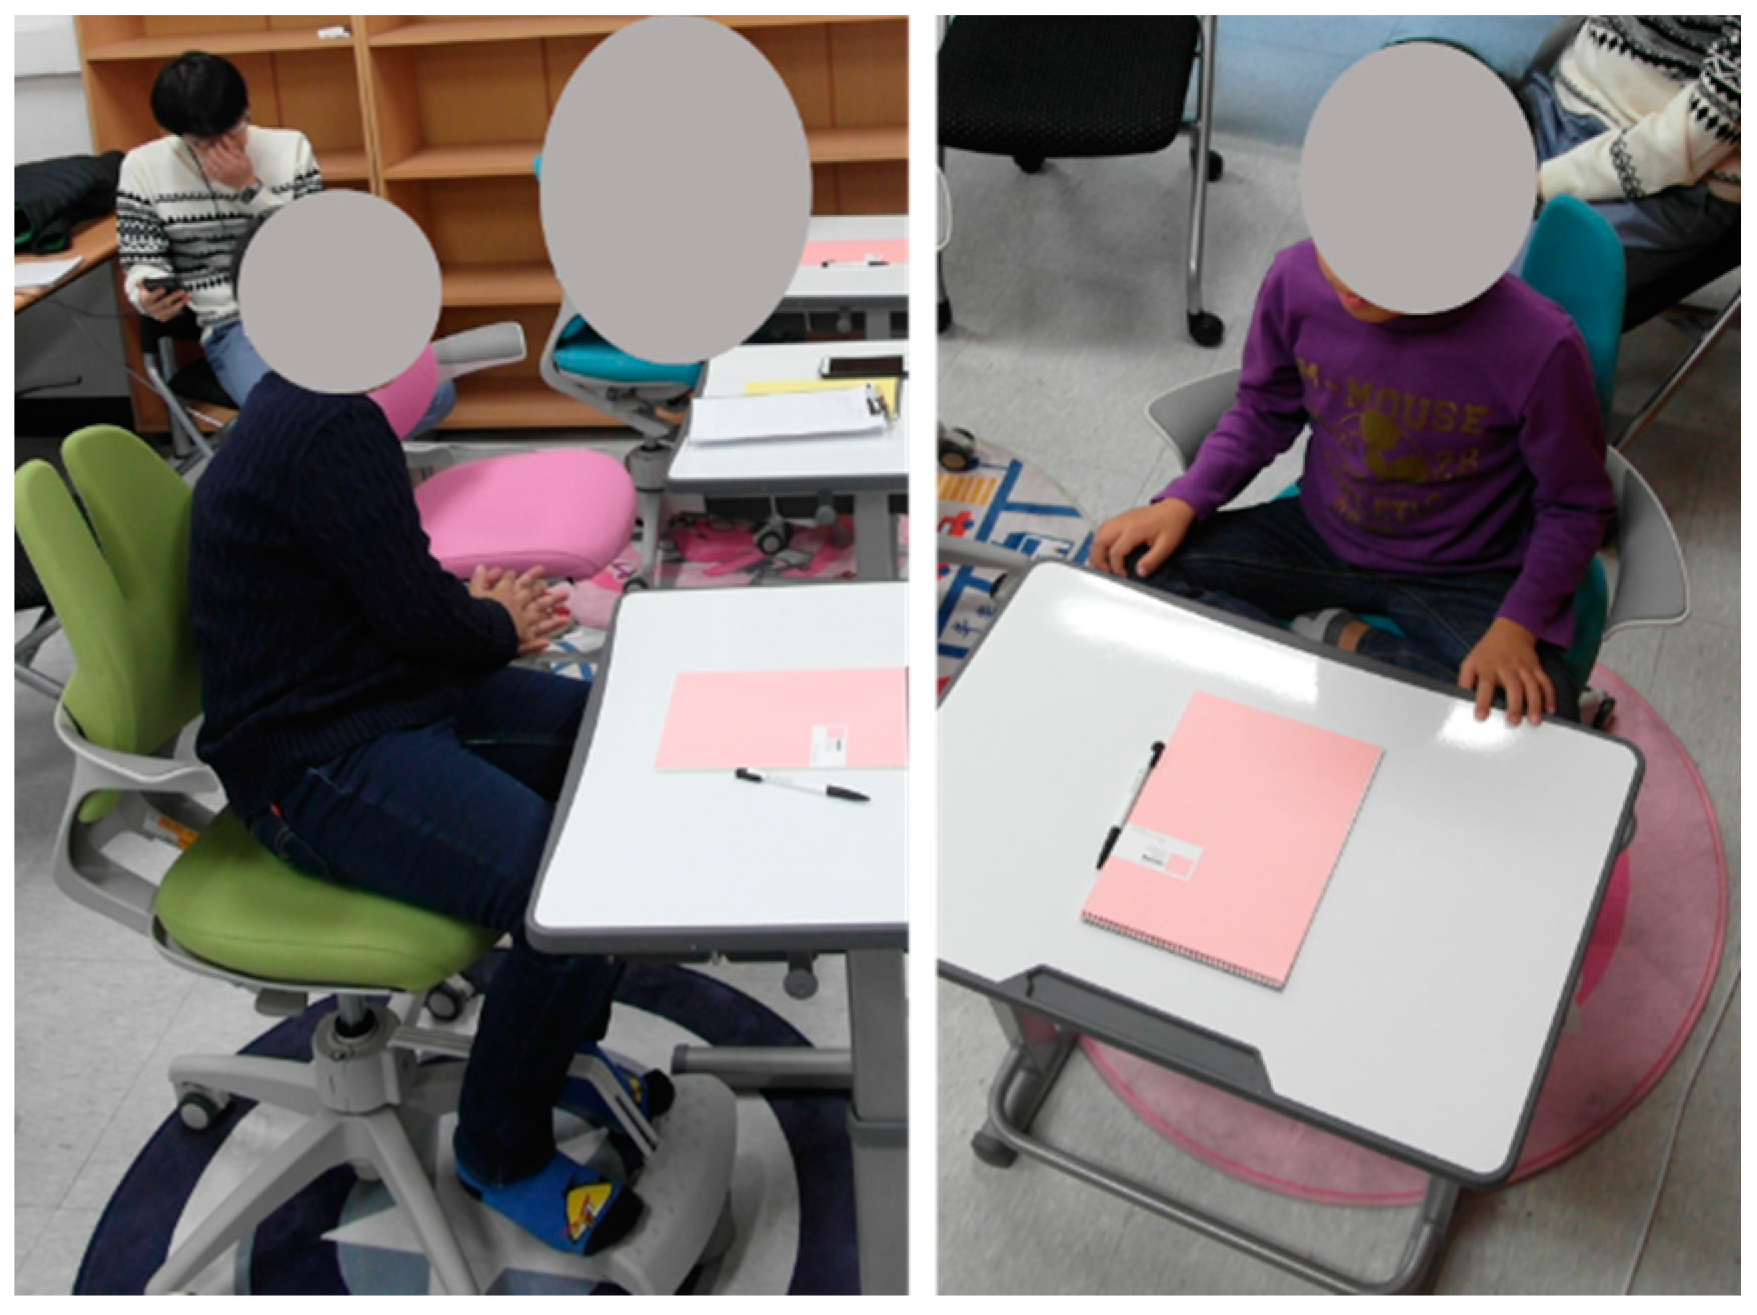
To collect pressure data, a pressure sensor was installed inside the seat cushion of a child chair (Figure 6). The pressure measuring area is 318 × 318 mm, and the polyethylene terephthalate (PET) film sensor has a force sensing resister (FSR) of 8 × 8. The data is transferred to an android smartphone via Bluetooth network with 12 bits.

3.2. Participants

A total of 10 children aged from 7 to 11 years (Mean = 9.10, Std. = 1.73) participated in this experiment. We recruited participants weighing 20 to 40 kg (20–29 kg: three, 30–39 kg: three, 40–49 kg: four). All the children participated in the experiment together with their parents present.

3.3. Selected Sitting Postures

In this study, it was important to reflect the characteristic of the child’s sitting behavior. Therefore, to contain any awkward postures reflected in the children’s sitting behavior, an online survey was conducted of parents with young children. A total of 32 parents completed the questionnaire regarding their child’s unusual sitting posture. As a result, two sitting postures were included in this experiment, namely sitting at the front of the chair and sitting crossed-legged on the chair. Finally, five postures were selected to reflect the representative postures in the previous studies and the sitting behavior characteristics of the children. The selected postures included sitting straight, lean left, lean right, sitting at the front of the chair and sitting crossed-legged on the chair. The description and images of these sitting postures were presented in Table 2.

3.4. Data Collection

The children sat in front of their desks while watching children’s entertainment videos. They took predefined sitting postures in accordance with the instructions of one researcher. After the other researchers confirmed that the participants took their sitting postures well, the pressure data was collected. The experimental environment is shown in Figure 7. The stored pressure sensor data was converted to a heatmap using Plot.ly’s in R, which is an open source library for data visualization. The data were measured for 5 min per posture. The total experiment time was 45 min and the participants were able to take rest sufficiently during the experiment. A total of 260 body pressure distribution data were collected for one sitting posture, and a total of 13,000 sitting posture data were collected.

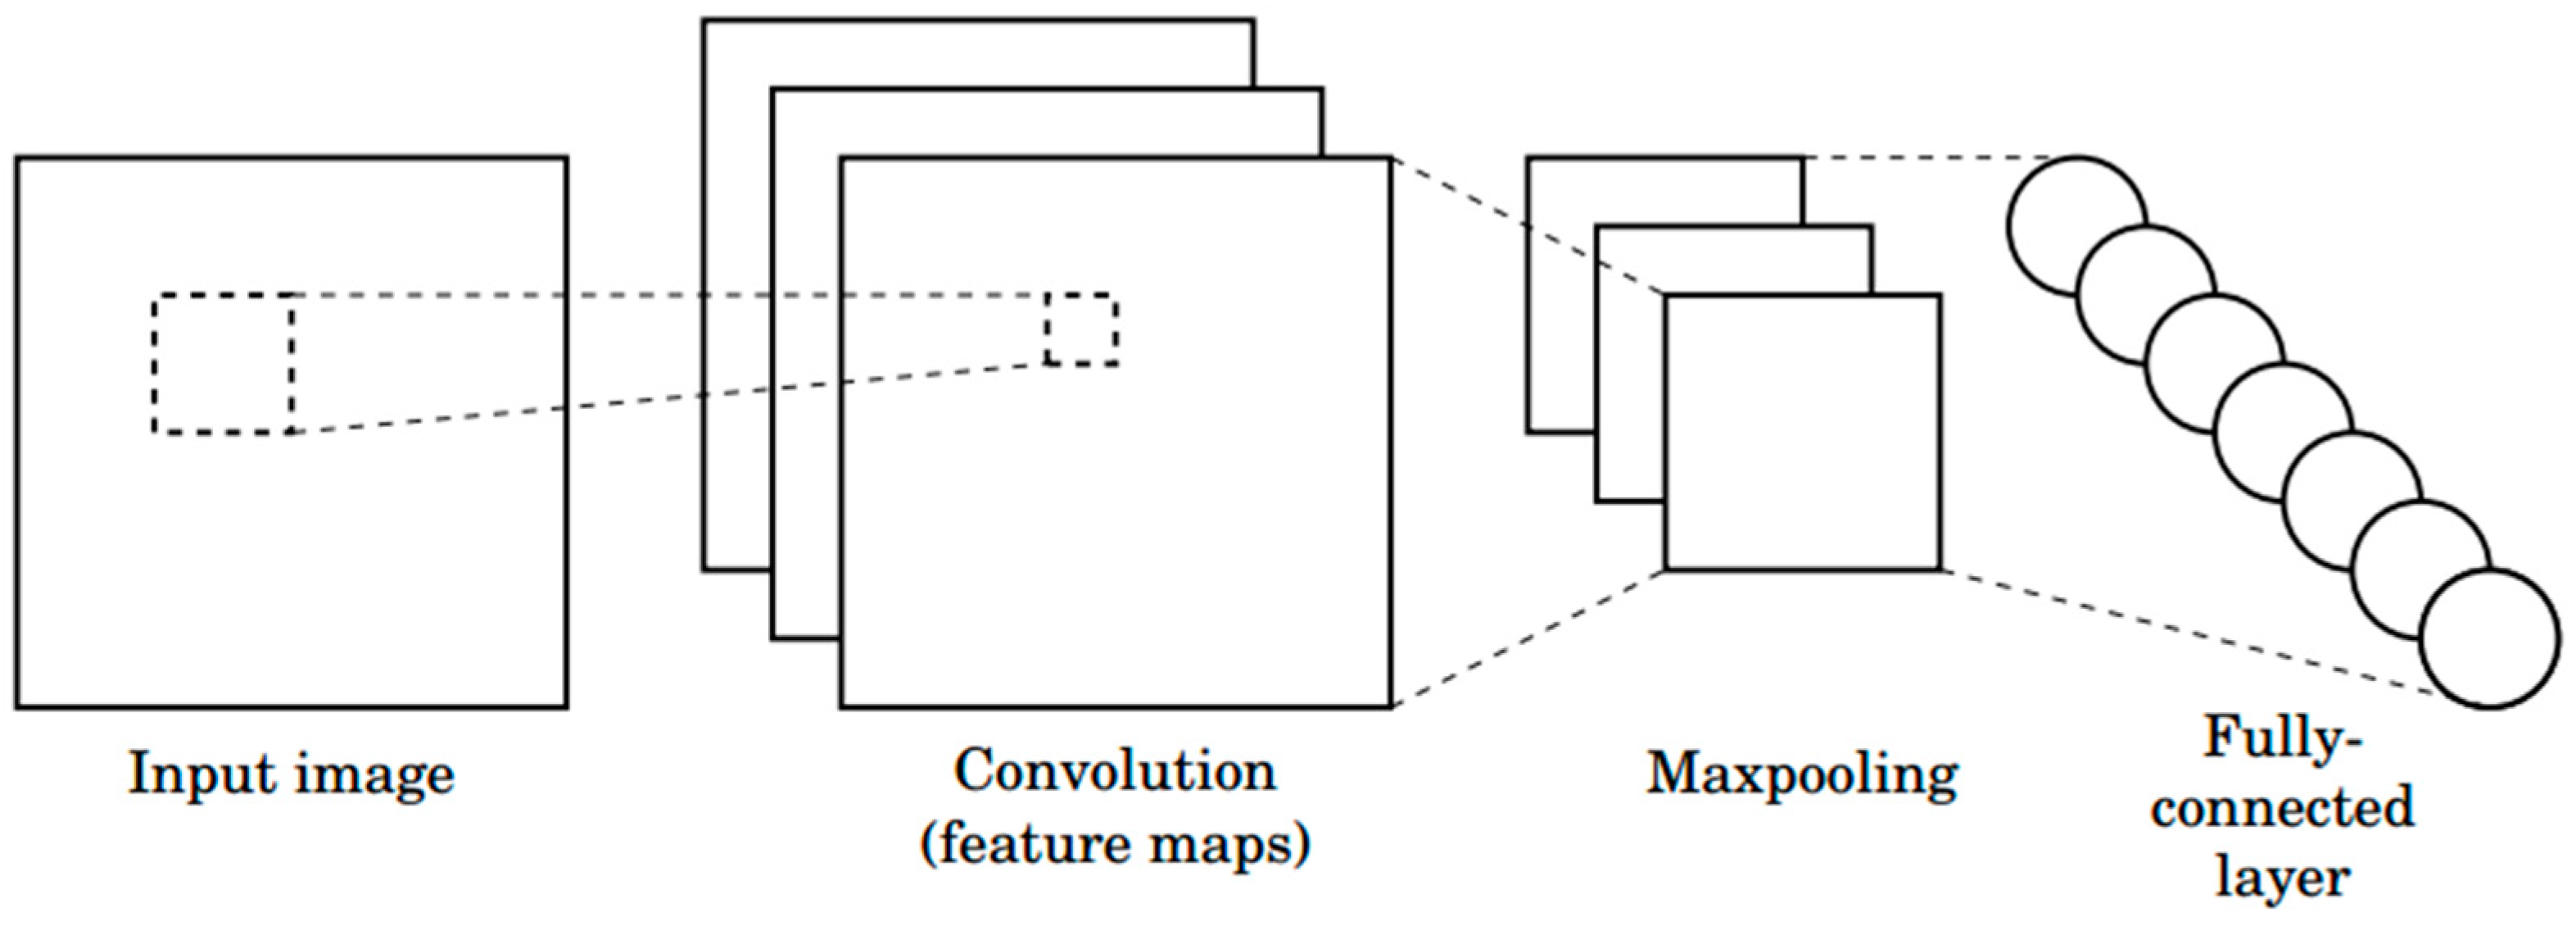
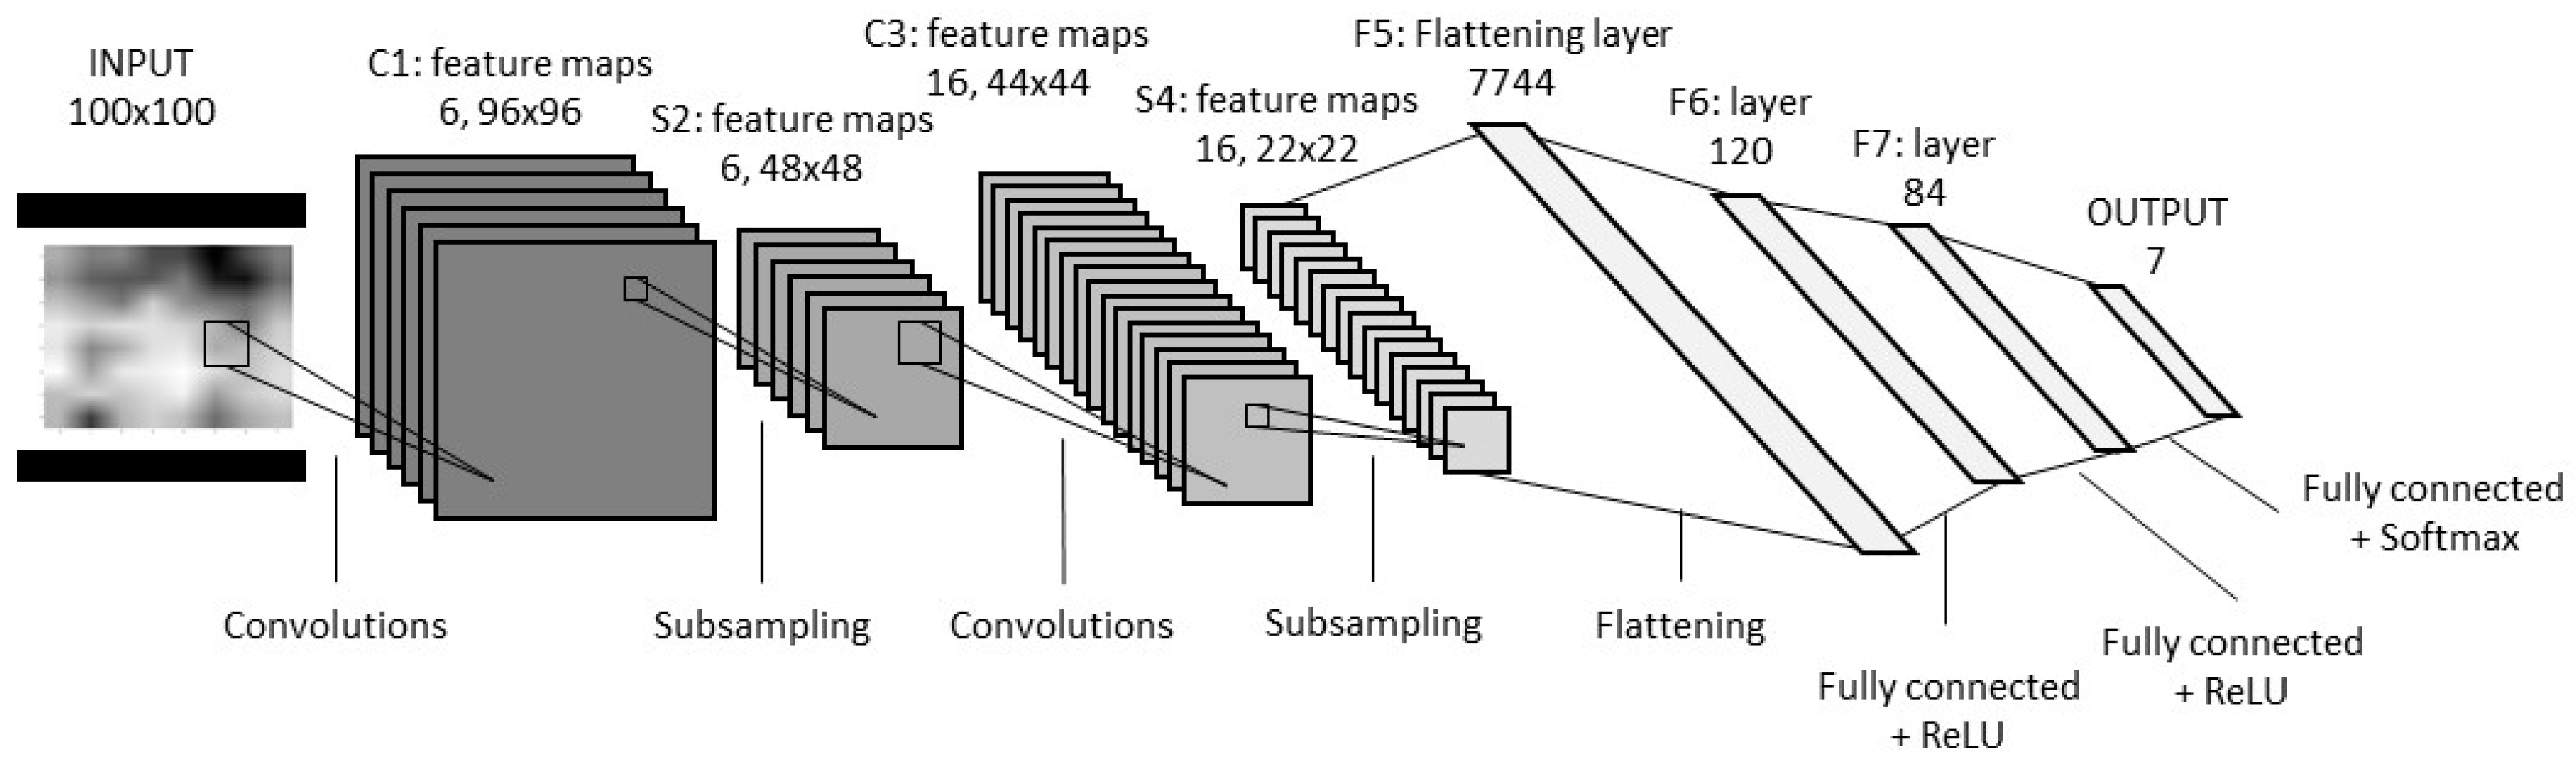
3.5. Sitting Posture Classification Model: LeNet-5

All classification models are coded in Python. The CNN algorithm uses the library TensorFlow, and the remaining machine learning algorithms use the library scikit-learn. LeNet-5 was applied as the CNN algorithm for classifying the pressure distribution data according to the sitting posture. LeNet-5 is the CNN architecture generally used for handwritten digit recognition and was successfully used to solve other visual related problems [48,49]. LeNet-5 comprises seven layers that do not include the input. It consists of two types of convolutional layers, two types of subsampling layers, fully connected layer with ReLU (Rectified Linear Unit) and Softmax, and an output layer.
As the LeNet-5 model is a model used for small-sized datasets, some modifications have been made to this study. As the size of the image has increased and the number of images to be classified has changed, the model is required to be modified. The input layer has been modified to accommodate the size of the image, and the two fully connected layer has been modified accordingly. Detailed information of the structure of the applied model was shown in Figure 8.
The NB classifier with a prior empirical distribution was used. For the DT algorithm, the minimum parent size was adjusted as 5, 10, 15, 20, 25, and 30. In addition, pruning was allowed for this method. In the case of NN analysis, a backpropagation algorithm was applied to the data training process. In the output layer of the last hidden layer, a Softmax function was used to determine the class labels. Excluding for this case, the hyperbolic tangent sigmoid function was used for all the activation functions. To achieve the optimal accuracy, one to three hidden layers were selected in this study, and the number of neurons per layer was set as 20, 30, and 40. For the SVM, we employed the Gaussian kernel function, k ( x , y ) = exp ( γ | | x y | | 2 ) , of which corresponding feature mapping is infinite dimensional. A kernel scaling factor, γ , was set as 0.01, 0.05, and 0.1. In addition, the fractional error bound ν , the maximum fraction of misclassified instances, was set as 0.01 and 0.05 to prevent overfitting.

3.6. Training and Test Procedure

Individual validation was applied to the training and testing of the dataset. The data collected by each individual should not affect the learning because of the individual differences. Therefore, we used nine data as the training data and one data as the test data. Thus, a total of 10 training and test results were obtained. The 10 results included the accuracy of the classification results, the precision of the individual class, and the recall value. Thus, the individual validation results for individual participant data were calculated. Accuracy refers to the percentage of precisely fitting across the entire case. The precision refers to the accuracy of the detection. That is, it indicates how many actual objects are included among the detection results. The recall means detection rate which refers to how well the target objects are detected without being missed. The confusion matrix and equations of each value were described in Table 3.
Precision = TP TP + FP  
Recall = TP TP + FN  
Accuracy = TP + TN TP + TN + FP + FN  

4. Results

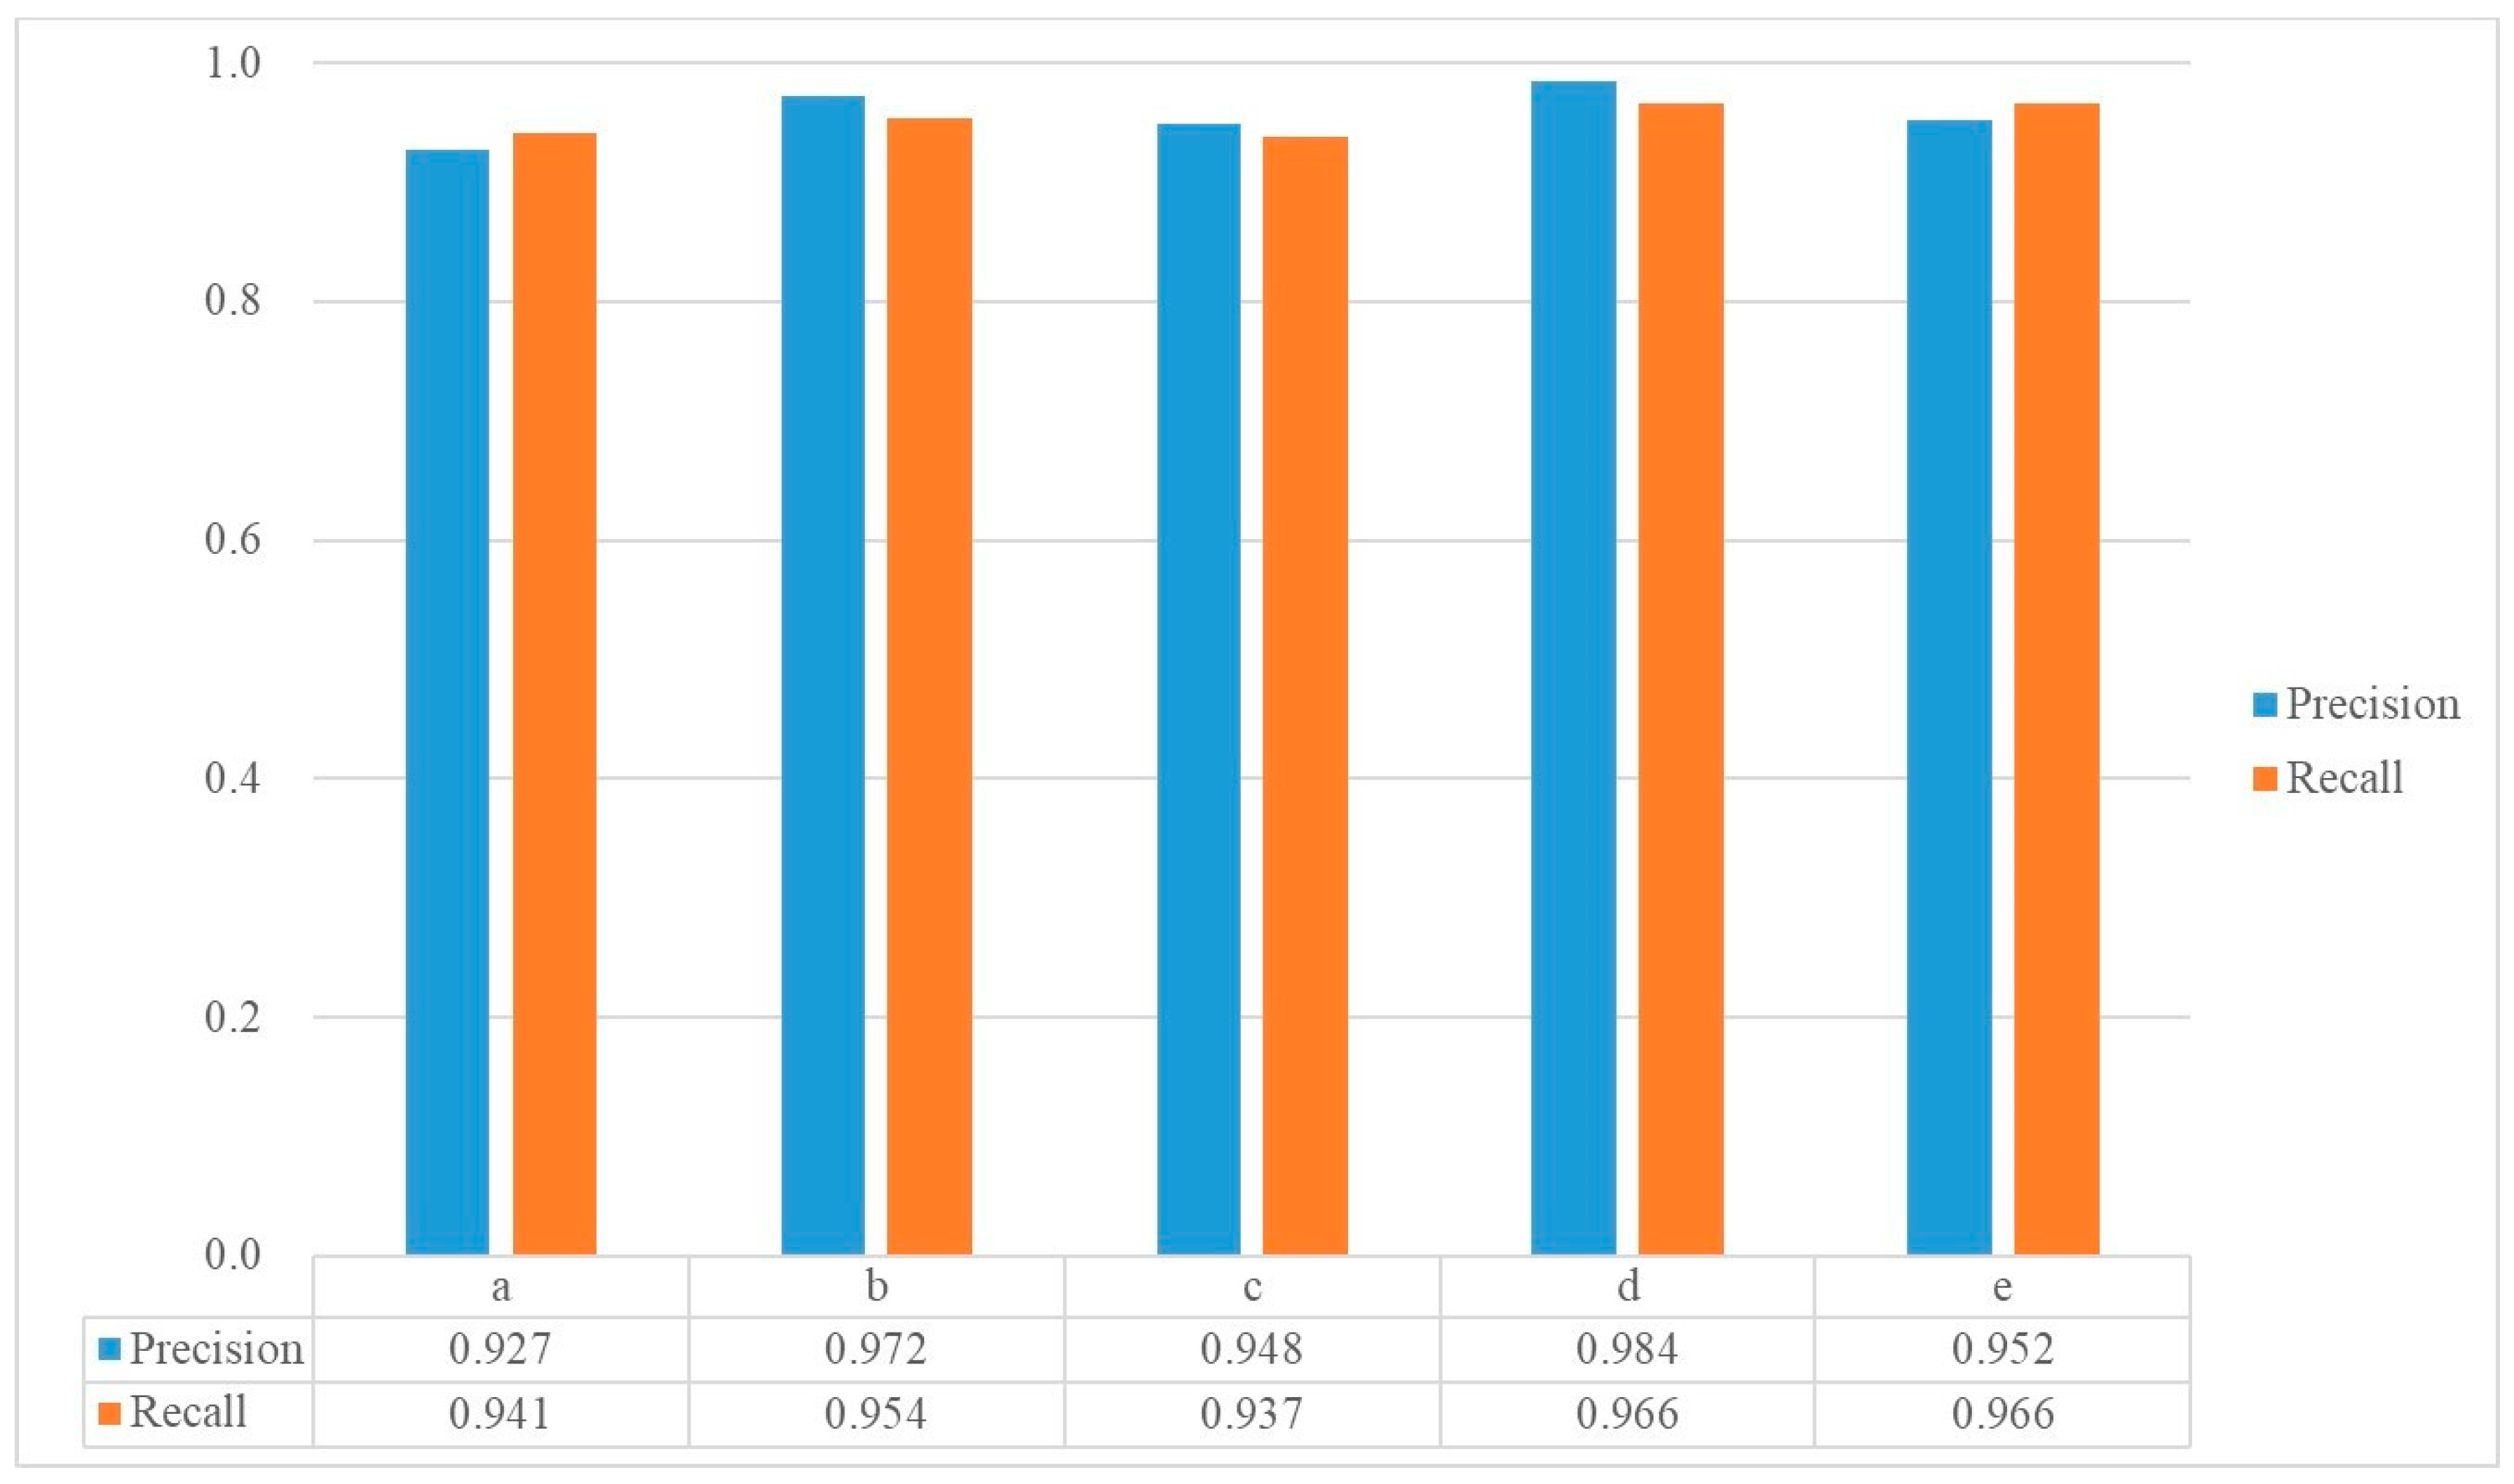
4.1. Results Comparison with Individual Validation

The maximum and minimum accuracy for NB were 0.995 and 0.656, respectively. The average accuracy for NB was 0.871 (Std. = 0.113). For MLR, the minimum and maximum accuracies were 0.737 and 0.977, respectively. The average accuracy was 0.845 (Std. = 0.091). In case of DT, all the average accuracies were less than 80% for the selected parent sizes. The minimum and maximum average accuracies for each parent size were 0.787 and 0.794, respectively, with a difference of less than 1%. The highest average accuracy was 0.794 (Std. = 0.083) when the parent size was 15, and the smallest standard deviation was obtained for a parent size of 10 (Std. = 0.077). For NN, training and test accuracies were obtained under the conditions of number of layers and neurons. Except for the accuracy of the combination of one layer and 20 neurons, all the results showed that the classification performance was higher than 90%. The highest value was 0.921 for the combination of one layer and 40 neurons. In the case of this combination, the standard deviation also showed the smallest value (Std. = 0.057), which could indicate that this combination is optimal for this data. In case of SVM, the best accuracies of test were acquired under the condition of the combination of the values of c (lambda) and gamma. The average accuracy was found to be greater than 0.9 for all the conditions except for the gamma value of 0.5. The overall accuracy was highest at 0.942 (Std. = 0.057) for the condition in which the lambda was 0.05 and gamma was 0.05.
Table 4 shows the results of the CNN model in comparison with the rest of the models used in this study. For DT, NN, and SVM, the accuracy is presented for combinations of parameters that showed the best results. The individual validation results of CNN showed that the accuracy was at least 0.902, and the maximum accuracy was 1.000. The average accuracy was 0.953 (Std. = 0.037). Among learning algorithms, the performance of DT was the lowest. NB and MLR showed an accuracy of more than 80% but not more than 90%. NN, SVM, and CNN showed an accuracy of more than 90%. The performance of CNN was better than all the other learning algorithms in terms of average accuracy and standard deviation.

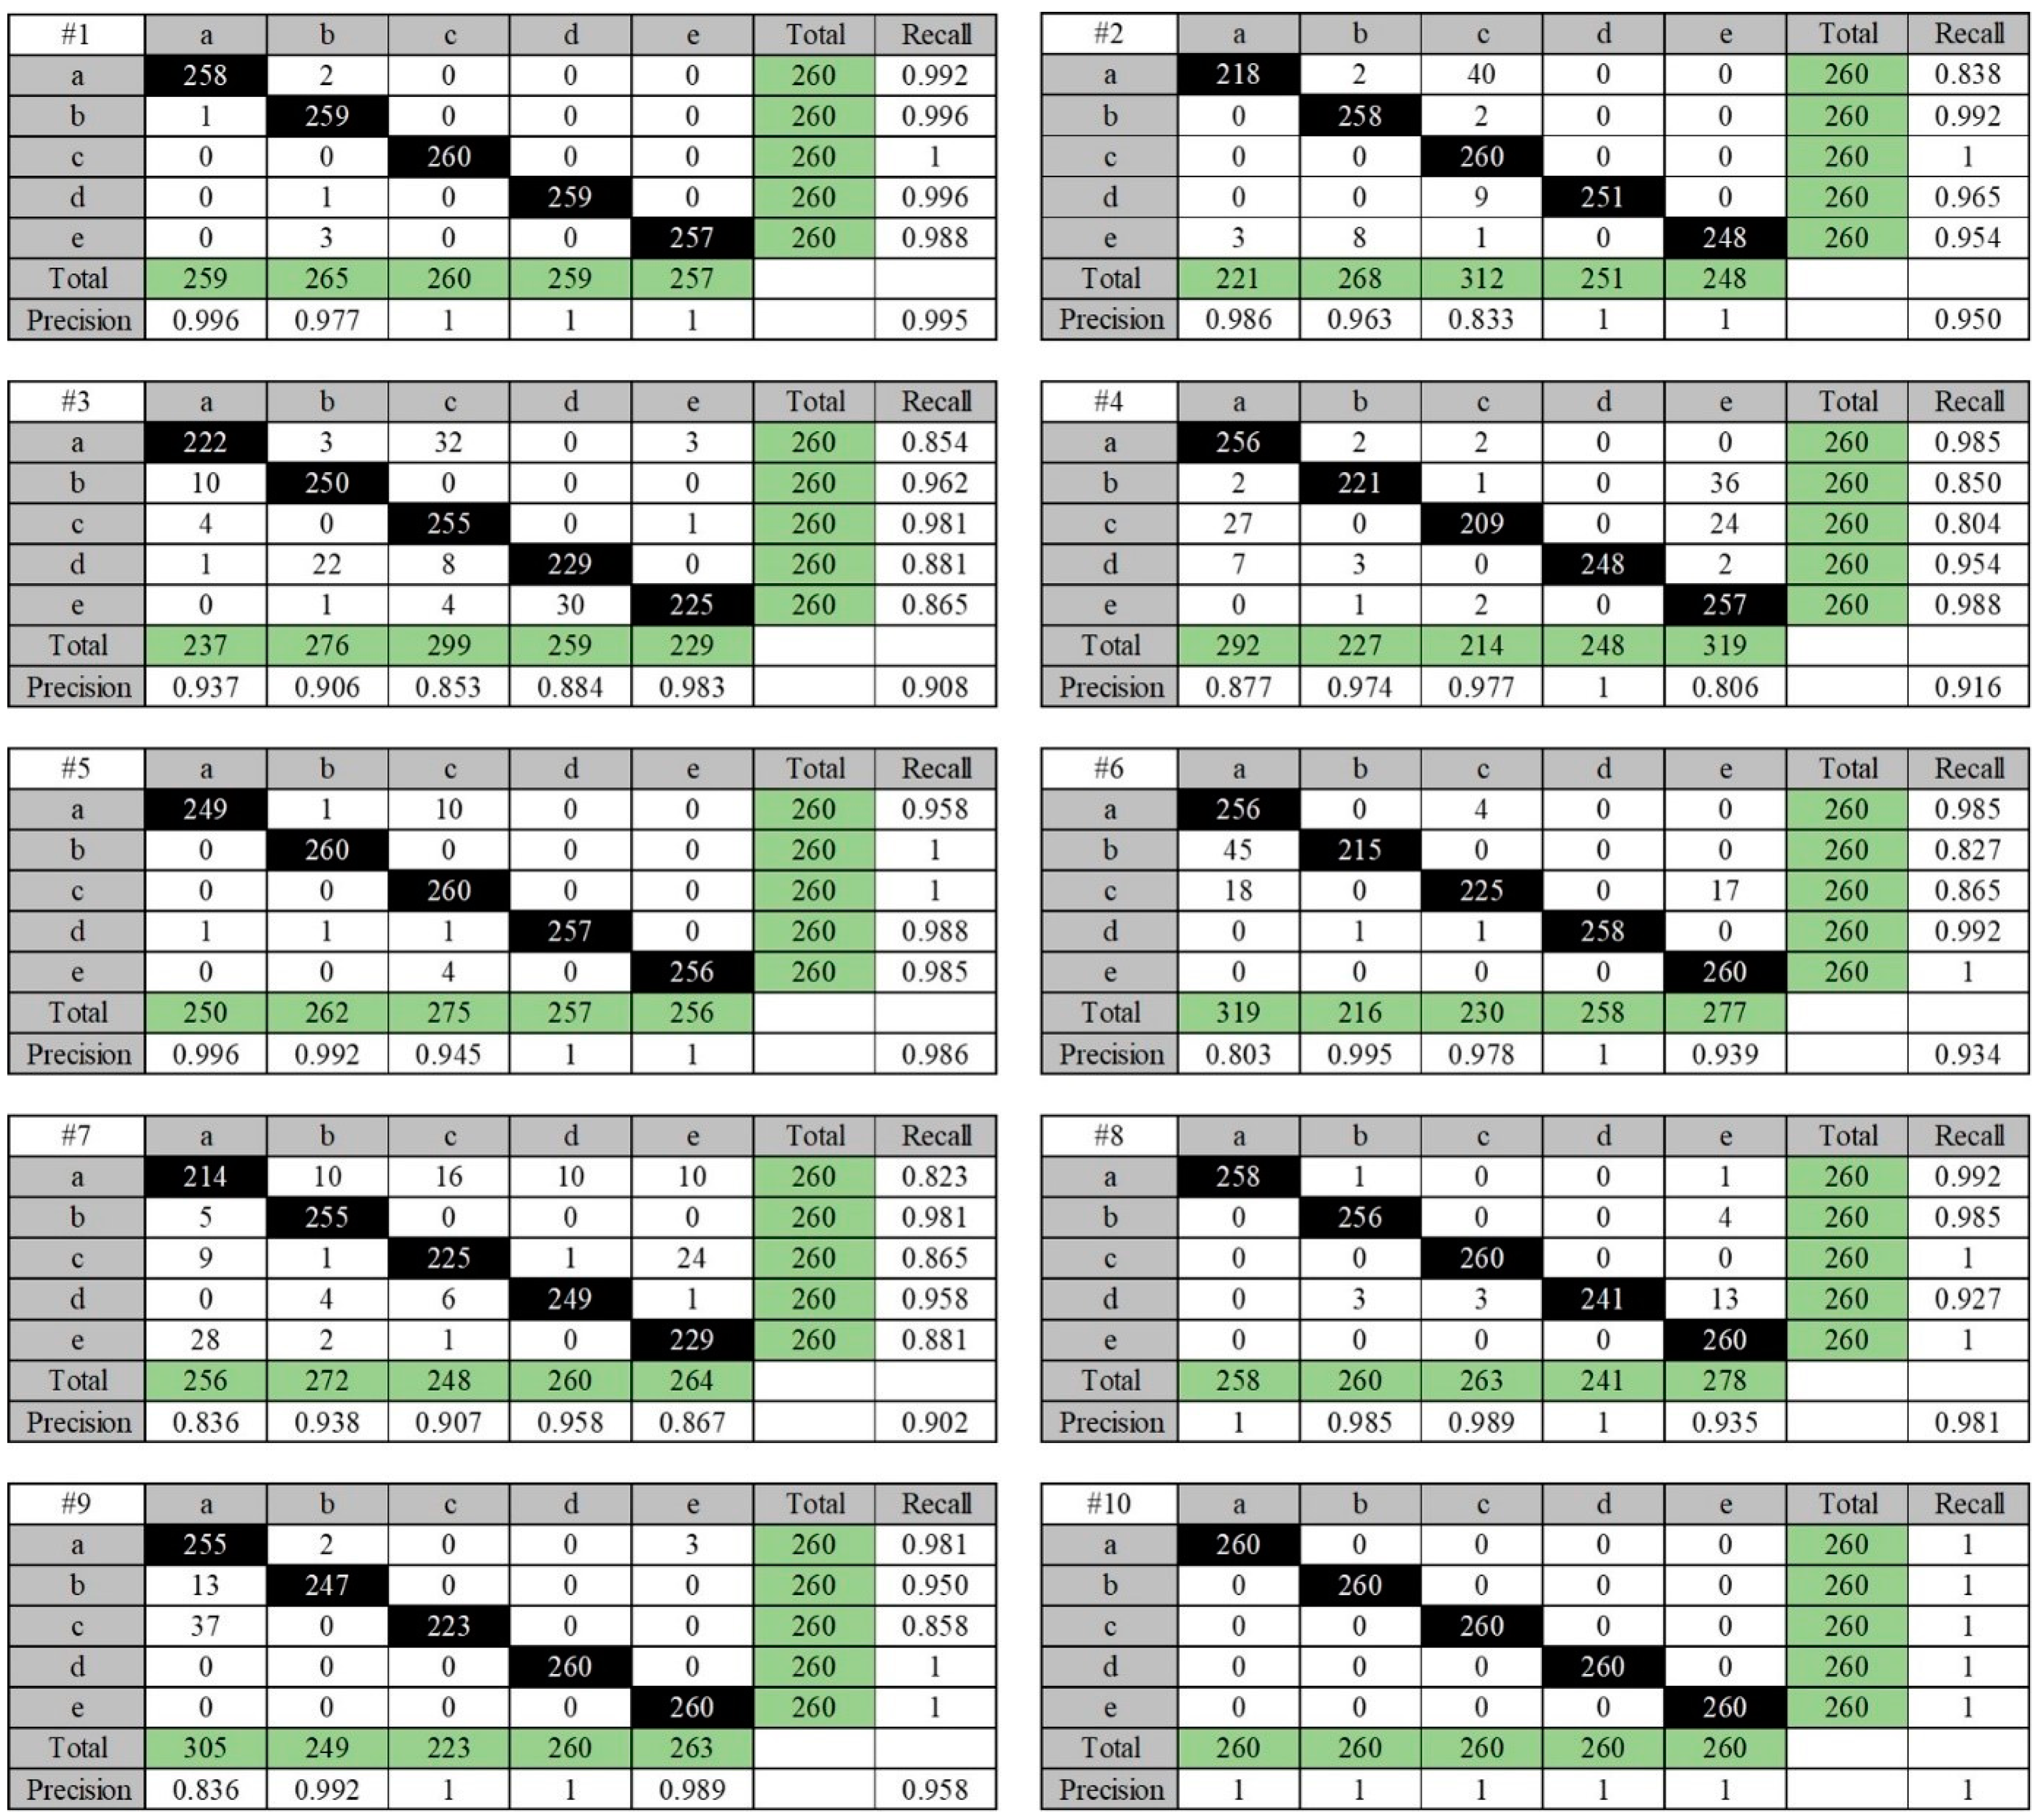
4.2. Results of Confusion Matrix for CNN

Although the current results showed an accuracy of over 95%, further analysis of the classification pattern of each participant and posture and of the physical characteristics of the participants is required to improve the accuracy. Further analysis is presented only for CNN as the results of CNN were superior to those of the other algorithms.
The results of the confusion matrix for each participant using CNN is shown in Figure 9. As shown in Figure 9, the classification accuracy of all the participants was above 0.900. In particular, in the case of #10 participants, the classification accuracy for all the postures was 1.000. For each participant, in the case of recall, the value in the posture (c) of the participant #4 was significantly lower than that of the other postures (Rc = 0.804). Participant #7 recorded values lower than 0.9 in postures (a), (c), and (e) (Ra = 0.823; Rc = 0.865; and Re=0.881). The precision value for posture (a) of participant #6 was the lowest as compared with that of the other postures (Ra = 0.803). This is because posture (b) is often classified as the posture (a) (n = 45). In the case of the participant #4, the precision value of posture (e) is low (Re = 0.798) because postures (b) and (c) are classified as posture (e) (n = 36, 24).

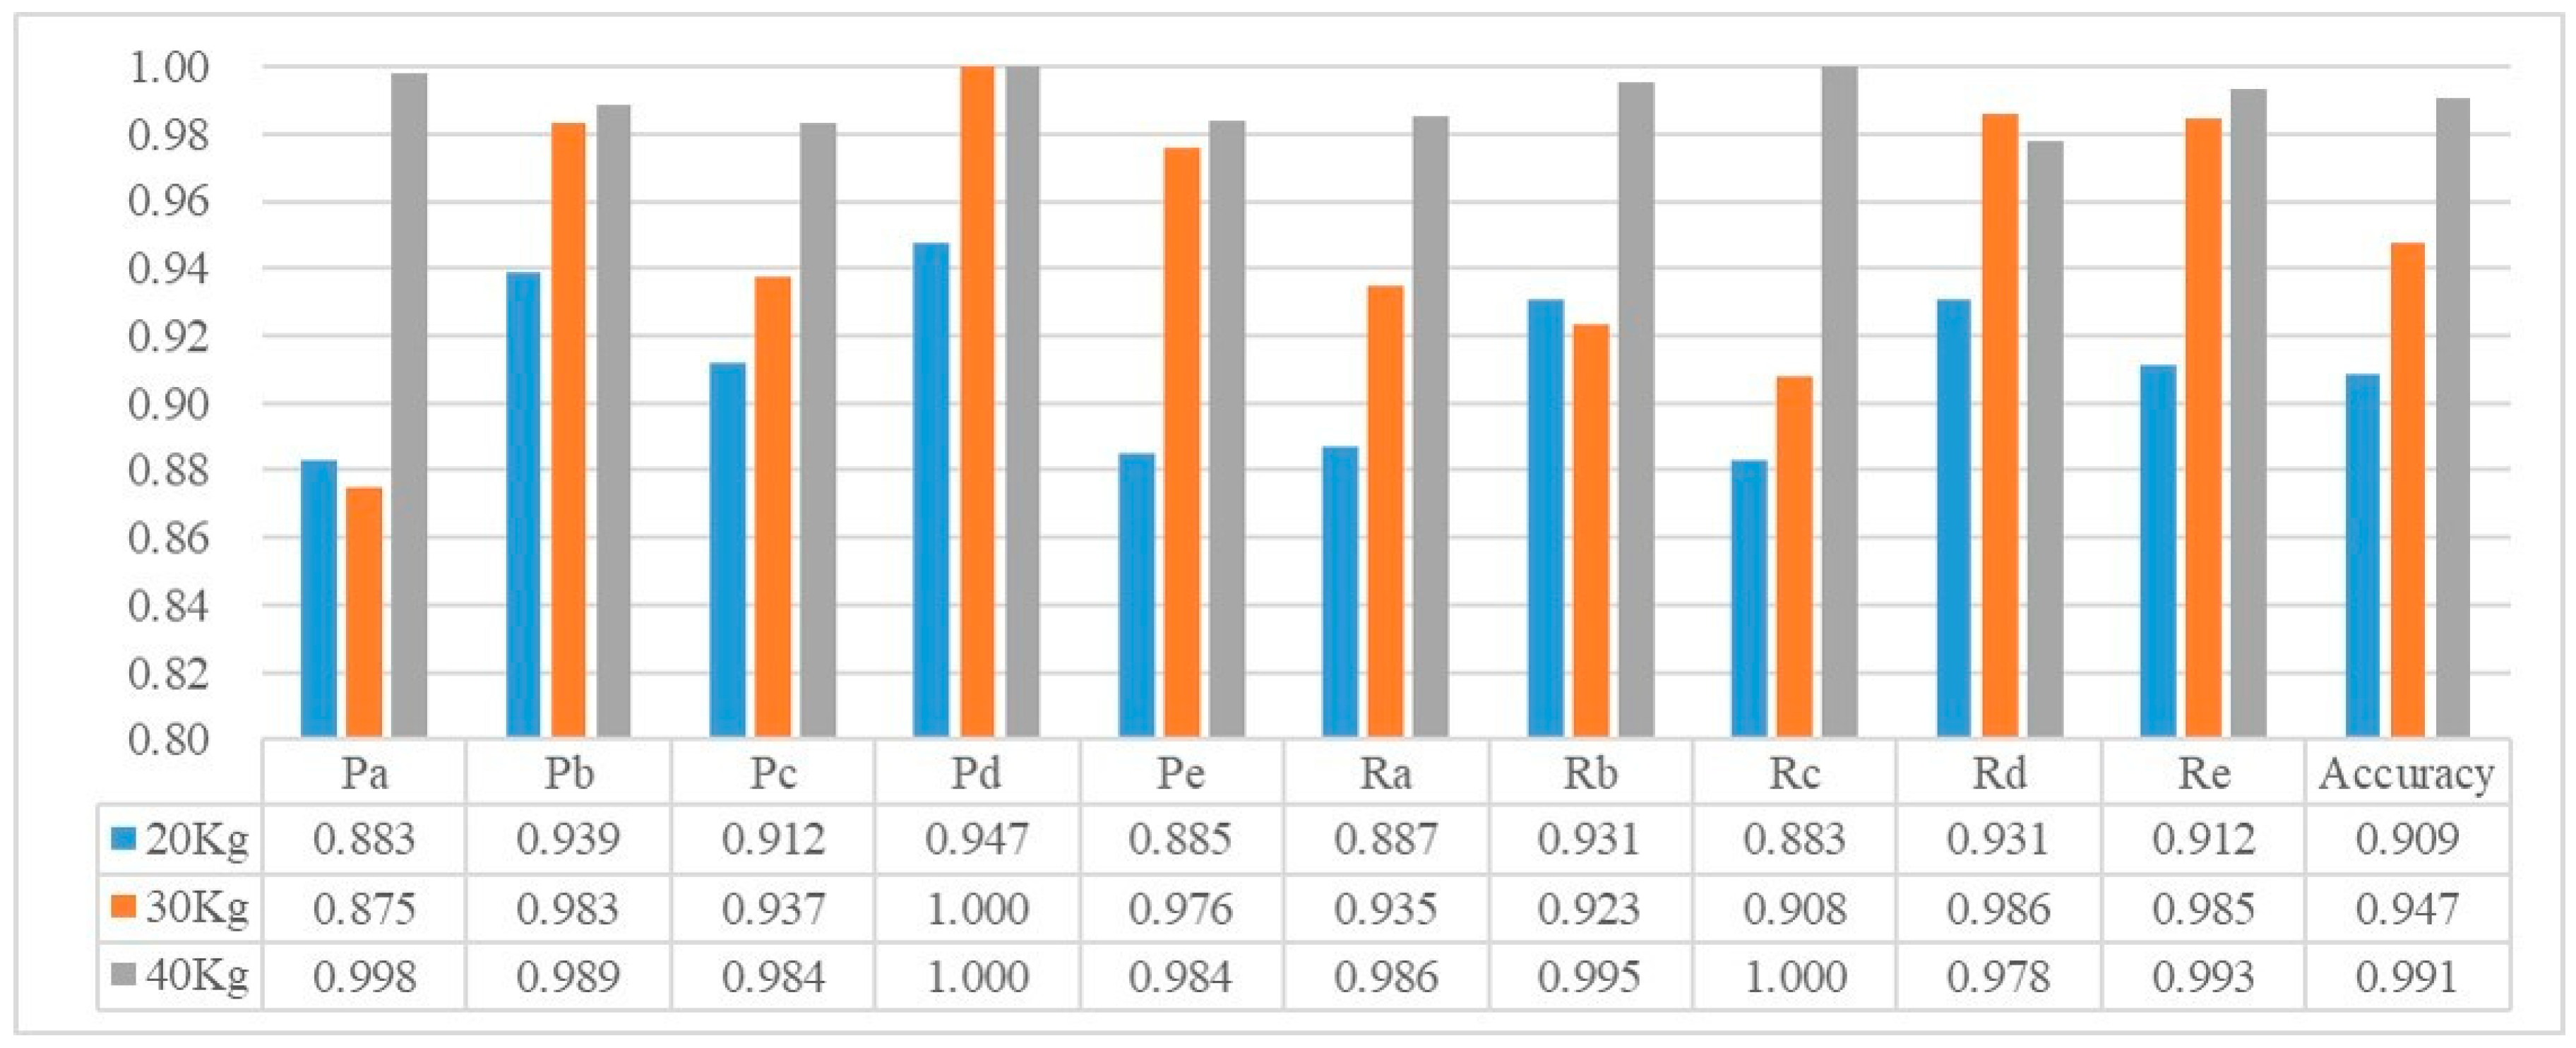
4.3. Relationship between Group of Body Weight and Accuracy

The mean values of the precision and recall for each sitting posture of the posture classification results are shown in Figure 10. The average values of the precision in each sitting posture are in the descending order of (d)–(a). The highest value of precision is 0.984 for posture (d), and the lowest value of precision is 0.927 for posture (a). The standard deviations of all the sitting postures range from 0.030 to 0.081. The descending order of the mean values of recall is (e)–(a). The highest value of recall is 0.984 for postures (d) and (e), and the lowest value of precision is 0.937 for posture (c). The standard deviations of all the sitting posture range from 0.039 to 0.079.
For the experimental analysis, the participants were divided into three groups based on their weight. The results for each group precision, recall, and accuracy are shown in Figure 11. All three performance metrics, precision, recall, and accuracy had the lowest values in the 20 kg group. In addition, the value of each index showed a tendency to increase with a group of a higher body weight.
The results of the ANOVA by weight group are shown in Table 5. There was a significant difference in precision between the weight groups at the 90% confidence level for postures (c) and (d). In the case of recall, it was confirmed that only the E posture was significantly different at the 90% confidence level. Finally, in the case of the accuracy, the p-value was the lowest among all the indices (p = 0.007).

5. Discussion

The objective of this study is to classify the sitting postures of children using pressure sensors installed on the seat using the CNN algorithm. To verify the applicability of this algorithm, several learning algorithms including NB, DT, NN, and SVM were applied to the same data set for the classification of the sitting postures. The accuracy of DT was 0.794, which was the lowest among those of the applied models. The performance of NB and MLR was 0.871 and 0.845, respectively. The CNN, NN, and SVM algorithms showed more than 90% classification accuracy, and the CNN model showed the highest classification accuracy. The classification performance of SVM was 0.942, which approximately had a 1% difference as compared to that of the CNN. Besides that, the standard deviation obtained using CNN was smaller than that of SVM (std. = 0.037). It is essential in the context of classification that value of accuracy is high and the standard deviation value is small [50]. Therefore, CNN is noted to have shown the best result through high average accuracy value and small accuracy deviation between the participants.
Previous researches can be classified into cases wherein a pressure sensor is used only on the seat and wherein the pressure sensor is attached to both the seat and backrest. According to Meyer et al. [9], the accuracy was low when only the pressure data obtained from the seat was utilized without using the pressure data of the backrest. From this result, it can be inferred that under the same experimental conditions, more data can be utilized if the pressure information of the backrest is obtained in addition to that of the seat, thus resulting in a better classification performance. Therefore, it was more challenging to classify the sitting posture by using pressure data only from the seat and not from the backrest. Nonetheless, the average classification accuracy of CNN was 95.3%, which was not significantly lower than those in previous studies using both seat and backrest data [31,32] (See Table 1). Indeed, the classification performance of this study is better than that presented in several other studies [10,30]. These two previous studies classified sitting postures using the NB classifier, which was also used in this study. Although the absolute comparison of the classification performance is limited owing to differences in experimental conditions, it can be inferred that the NB algorithm is not suitable for posture classification given that the results of NB are not high in this study (See Table 4). Moreover, it can be observed that the various types of algorithms have been utilized in diverse methods in the area of research of posture classification. This suggests that attempts have been made at using various algorithms to realize higher classification performance rather than focusing on specific algorithms based on optimal experimental setups. Therefore, according to these trends, the application of CNN, which has not been employed in such an application thus far, can be considered as a valuable new approach.
The classification performance obtained for familiar users is generally more than 90%; however, there were cases in which the performance of unfamiliar users was less than 80%. For instance, Tan et al. [31] reported 96% accuracy for a familiar user; but 79% accuracy for an unfamiliar user. In addition, in a study by Kamiya et al. [29], the result of the classification performance for unfamiliar users was more than 90%, but it was approximately 5% lower than that obtained for familiar users. Therefore, the classification of the sitting postures of unfamiliar users is a more challenging approach in the derivation of the classification accuracy. Furthermore, considering the case of the classification of the sitting postures of a new user after constructing the database in advance without utilizing the data of the existing user, an approach for predicting the unfamiliar user is required. Thus, this study adopted a more conservative verification method which identifies unfamiliar users.
In addition, in this study, the participants were children and, not adults, who were dominantly focused on in previous studies. The anthropometric characteristics of children are largely distributed as they are in the process of growing. In other words, the variance in the child’s anthropometric variables, such as height and weight, is greater than that in adult groups. This encouraged us to conduct further analysis based on the characteristics of the participants, especially their weight. As a result, the classification performance of the low weight group was lower than that of the high weight group. This result is consistent with that obtained in a previous study [51]. The authors of this previous study divided the groups according to the level of body mass index (BMI) and compared the classification performance. The results showed that light intensity group (low BMI) had a lower classification performance than the moderate intensity group (normal BMI). Although this result was obtained using data from adults, it implies the same issue as this current study: when performing experiments on groups of similar age, anthropometric characteristics such as body weight may influence the classification accuracy. Therefore, it is necessary to consider the human body characteristics such as weight in the posture classification. Thinking in the other direction, it is expected that a higher accuracy would be obtained if weight is used as an input variable in the classification of sitting postures. Therefore, it would be necessary to construct a database and train the obtained data by weight groups.
The current paper has collected data for 10 children, but more data will be obtained in the future to utilize a larger data size for classifying the sitting posture. Since the posture can be sufficiently classified through the system constructed in this study, it is expected that the reliability of the result can be guaranteed by acquiring more data. In addition, future studies will expand the classification method and plan to use genetic algorithms considering the learning phase and techniques [52].

6. Conclusions

In this study, we developed a real-time sitting posture classification system for the correct sitting postural habit formation for children. Five sitting postures were selected for classification. The CNN algorithm performs well in this type of posture classification and has been shown to outperform other machine learning algorithms. In addition, as compared to previous studies, the average value of accuracy (0.953) for the sitting posture obtained using CNN was confirmed to be suitable for the development of a smart chair. As a result of examining the accuracy of the posture classification by the weight of the children, it was found that the accuracy is higher if the weight of the group is higher. This result could not be generalized owing to the limitation of this study being that the number of participants in the weight group is small. Thus, further research will be conducted to develop a sensing cushion that has an optimal accuracy for each weight group by adjusting the position or number of sensors. Because children have a higher correlation between body shape and body weight than adults, there is a difference in the active area of the pressure sensor depending on body weight. In addition, there are cases where the different sitting postures represent the same pressure pattern because the difference in body size is large depending on the body weight. For example, the pressure sensor pattern might be similar when a child in a small body size is sitting upright in a chair and when a large child is sitting in front of a chair. In this study, the pressure sensor mat which occupies most of the seat area is used, and the position of the individual pressure sensor is arranged at equal intervals. However, to overcome the misclassification due to the body characteristics according to the weight, further studies are required to discover the optimum pressure sensor position and number. Precisely classifying the sitting posture when using a chair helps prevent the occurrence of musculoskeletal disorders in users and improves their postural habit as well as efficiency in work or study. This study is expected to be used as a fundamental research for developing a smart chair that can induce a correct sitting posture in children by using a sensor-based cushion.

Author Contributions

Y.M.K. contributed to design and conduct the experiments and drafted all sections of the manuscript. Y.S. contributed to the algorithms design and the revision of the manuscript. W.K. supervised the entire research and contributed any improvements until the manuscript was finalized. B.J. contributed to conduct the experiment and illustrated figures in manuscript. M.H.Y. proposed new discussion points on the research results and provided an idea of how this research could be utilized. All authors contributed to the proofreading of the final manuscript.

Funding

This research was supported by the BK21 Plus Program (Centre for Sustainable and Innovative Industrial Systems) funded by the Korea government (Ministry of Education) under Grant [No. 21A20130012638]. This study was also supported by the Korea Evaluation Institute of Industrial Technology (KEIT) funded by the Korea government (Ministry of Trade, Industry, and Energy) under Grant [No. 1415152418].

Acknowledgments

The authors would like to thank Algorigo Inc. for providing the sensor system during this research, and we would like to thank DBK Co., Ltd. for providing the chair for children. We appreciate the administrative support from the Institute for Industrial Systems Innovation of Seoul National University.

Conflicts of Interest

The authors declare no conflicts of interest.

Abbreviations

The following abbreviations are used in this manuscript:
CNNConvolutional neural networks
NBNaïve Bayes Classifier
MLRMultinomial Logistic Regression
DTDecision Tree
NNNeural Network
SVMSupport Vector Machine
TPTrue positive
FPFalse positive
FNFalse negative
TNTrue negative
PaPrecision in posture (a)
PbPrecision in posture (b)
PcPrecision in posture (c)
PdPrecision in posture (d)
PePrecision in posture (e)
RaRecall in posture (a)
RbRecall in posture (b)
RcRecall in posture (c)
RdRecall in posture (d)
ReRecall in posture (e)

References

  1. Dunstan, D.; Barr, E.; Healy, G.; Salmon, J.; Shaw, J.; Balkau, B.; Magliano, D.; Cameron, A.; Zimmet, P.; Owen, N. Television viewing time and mortality: The Australian diabetes, obesity and lifestyle study (AusDiab). Circulation 2010, 121, 384–391. [Google Scholar] [CrossRef] [PubMed]
  2. Hamilton, M.T.; Hamilton, D.G.; Zderic, T.W. Role of low energy expenditure and sitting in obesity, metabolic syndrome, type 2 diabetes, and cardiovascular disease. Diabetes 2007, 56, 2655–2667. [Google Scholar] [CrossRef] [PubMed]
  3. Healy, G.N.; Wijndaele, K.; Dunstan, D.W.; Shaw, J.E.; Salmon, J.; Zimmet, P.Z.; Owen, N. Objectively measured sedentary time, physical activity, and metabolic risk: The Australian Diabetes, Obesity and Lifestyle Study (AusDiab). Diabetes Care 2008, 31, 369–371. [Google Scholar] [CrossRef] [PubMed]
  4. Inoue, M.; Yamamoto, S.; Kurahashi, N.; Iwasaki, M.; Sasazuki, S.; Tsugane, S.; Japan Public Health Center-based Prospective Study Group. Daily total physical activity level and total cancer risk in men and women: Results from a large-scale population-based cohort study in Japan. Am. J. Epidemiol. 2008, 168, 391–403. [Google Scholar] [CrossRef] [PubMed]
  5. O’sullivan, P.B.; Grahamslaw, K.M.; Kendell, M.; Lapenskie, S.C.; Möller, N.E.; Richards, K.V. The effect of different standing and sitting postures on trunk muscle activity in a pain-free population. Spine 2002, 27, 1238–1244. [Google Scholar] [CrossRef] [PubMed]
  6. Huang, M.; Hajizadeh, K.; Gibson, I.; Lee, T. Analysis of compressive load on intervertebral joint in standing and sitting postures. Technol. Health Care 2016, 24, 215–223. [Google Scholar] [CrossRef] [PubMed]
  7. Grimmer, K.; Nyland, L.; Milanese, S. Longitudinal investigation of low back pain in Australian adolescents: A five-year study. Physiother. Res. Int. 2006, 11, 161–172. [Google Scholar] [CrossRef] [PubMed]
  8. Benocci, M.; Farella, E.; Benini, L. A Context-Aware Smart Seat. In Proceedings of the 2011 4th IEEE International Workshop on Advances in Sensors and Interfaces (IWASI), Savelletri di Fasano, Italy, 28–29 June 2011; pp. 104–109. [Google Scholar]
  9. Meyer, J.; Arnrich, B.; Schumm, J.; Troster, G. Design and modeling of a textile pressure sensor for sitting posture classification. IEEE Sens. J. 2010, 10, 1391–1398. [Google Scholar] [CrossRef]
  10. Mota, S.; Picard, R.W. Automated Posture Analysis for Detecting Learner’s Interest Level. In Proceedings of the 2003 Conference on Computer Vision and Pattern Recognition Workshop (CVPRW’03), Madison, WI, USA, 28–29 June 2003; p. 49. [Google Scholar]
  11. Glowacz, A. Acoustic based fault diagnosis of three-phase induction motor. Appl. Acoust. 2018, 137, 82–89. [Google Scholar] [CrossRef]
  12. Yang, J.; Sun, Z.; Chen, Y. Fault detection using the clustering-kNN rule for gas sensor arrays. Sensors 2016, 16, 2069. [Google Scholar] [CrossRef] [PubMed]
  13. Dit Leksir, Y.L.; Mansour, M.; Moussaoui, A. Localization of thermal anomalies in electrical equipment using Infrared Thermography and support vector machine. Infrared Phys. Technol. 2017, 89, 120–128. [Google Scholar] [CrossRef]
  14. Zhang, Y.; Yang, J.; Wang, K.; Wang, Z. Wind power prediction considering nonlinear atmospheric disturbances. Energies 2015, 8, 475–489. [Google Scholar] [CrossRef]
  15. Mehta, D.; Siddiqui, M.F.H.; Javaid, A.Y. Facial Emotion Recognition: A Survey and Real-World User Experiences in Mixed Reality. Sensors 2018, 18, 416. [Google Scholar] [CrossRef] [PubMed]
  16. Ran, L.; Zhang, Y.; Zhang, Q.; Yang, T. Convolutional neural network-based robot navigation using uncalibrated spherical images. Sensors 2017, 17, 1341. [Google Scholar] [CrossRef] [PubMed]
  17. Rundo, F.; Conoci, S.; Ortis, A.; Battiato, S. An Advanced Bio-Inspired PhotoPlethysmoGraphy (PPG) and ECG Pattern Recognition System for Medical Assessment. Sensors 2018, 18, 405. [Google Scholar] [CrossRef] [PubMed]
  18. Wang, L.-H.; Zhao, X.-P.; Wu, J.-X.; Xie, Y.-Y.; Zhang, Y.-H. Motor Fault Diagnosis Based on Short-time Fourier Transform and Convolutional Neural Network. Chin. J. Mech. Eng. 2017, 30, 1357–1368. [Google Scholar] [CrossRef]
  19. Punch, S. Research with children: The same or different from research with adults? Childhood 2002, 9, 321–341. [Google Scholar] [CrossRef]
  20. Yeats, B. Factors that may influence the postural health of schoolchildren (K-12). Work 1997, 9, 45–55. [Google Scholar] [CrossRef]
  21. Harreby, M.; Neergaard, K.; Hesselsøe, G.; Kjer, J. Are radiologic changes in the thoracic and lumbar spine of adolescents risk factors for low back pain in adults? A 25-year prospective cohort study of 640 school children. Spine 1995, 20, 2298–2302. [Google Scholar] [CrossRef] [PubMed]
  22. Boulay, B.; Brémond, F.; Thonnat, M. Posture Recognition with a 3d Human Model. In Proceedings of the IEE International Symposium on Imaging for Crime Detection and Prevention (ICDP), London, UK, 7–8 June 2005; pp. 135–138. [Google Scholar]
  23. Dunne, L.E.; Walsh, P.; Hermann, S.; Smyth, B.; Caulfield, B. Wearable monitoring of seated spinal posture. IEEE Trans. Biomed. Circuits Syst. 2008, 2, 97–105. [Google Scholar] [CrossRef] [PubMed]
  24. Knight, J.F.; Bristow, H.W.; Anastopoulou, S.; Baber, C.; Schwirtz, A.; Arvanitis, T.N. Uses of accelerometer data collected from a wearable system. Pers. Ubiquitous Comput. 2007, 11, 117–132. [Google Scholar] [CrossRef]
  25. Foerster, F.; Smeja, M.; Fahrenberg, J. Detection of posture and motion by accelerometry: A validation study in ambulatory monitoring. Comput. Hum. Behav. 1999, 15, 571–583. [Google Scholar] [CrossRef]
  26. Xu, W.; Huang, M.-C.; Amini, N.; He, L.; Sarrafzadeh, M. Ecushion: A textile pressure sensor array design and calibration for sitting posture analysis. IEEE Sens. J. 2013, 13, 3926–3934. [Google Scholar] [CrossRef]
  27. Choi, H.; Park, S. Estimation of sitting posture by using the combination of ground reaction force. J. Mech. Sci. Technol. 2015, 29, 1657–1662. [Google Scholar] [CrossRef]
  28. Bao, J.; Li, W.; Li, J.; Ge, Y.; Bao, C. Sitting Posture Recognition based on data fusion on pressure cushion. Indones. J. Electr. Eng. Comput. Sci. 2013, 11, 1769–1775. [Google Scholar] [CrossRef]
  29. Kamiya, K.; Kudo, M.; Nonaka, H.; Toyama, J. Sitting Posture Analysis by Pressure Sensors. In Proceedings of the 19th International Conference on Pattern Recognition (ICPR 2008), Tampa, FL, USA, 8–11 December 2008; pp. 1–4. [Google Scholar]
  30. Ma, C.; Li, W.; Gravina, R.; Fortino, G. Activity Recognition and Monitoring for Smart Wheelchair Users. In Proceedings of the 2016 IEEE 20th International Conference on Computer Supported Cooperative Work in Design (CSCWD), Nanchang, China, 4–6 May 2016; pp. 664–669. [Google Scholar]
  31. Tan, H.Z.; Slivovsky, L.A.; Pentland, A. A sensing chair using pressure distribution sensors. IEEE/ASME Trans. Mech. 2001, 6, 261–268. [Google Scholar] [CrossRef] [Green Version]
  32. Xu, L.; Chen, G.; Wang, J.; Shen, R.; Zhao, S. A Sensing Cushion Using Simple Pressure Distribution Sensors. In Proceedings of the 2012 IEEE Conference on Multisensor Fusion and Integration for Intelligent Systems (MFI), Hamburg, Germany, 13–15 September 2012; pp. 451–456. [Google Scholar]
  33. Roh, J.; Park, H.-J.; Lee, K.J.; Hyeong, J.; Kim, S.; Lee, B. Sitting Posture Monitoring System Based on a Low-Cost Load Cell Using Machine Learning. Sensors 2018, 18, 208. [Google Scholar] [CrossRef] [PubMed]
  34. LeCun, Y.; Bottou, L.; Bengio, Y.; Haffner, P. Gradient-based learning applied to document recognition. Proc. IEEE 1998, 86, 2278–2324. [Google Scholar] [CrossRef] [Green Version]
  35. Lee, D.D.; Seung, H.S. A neural network based head tracking system. In Advances in Neural Information Processing Systems; MIT Press: Cambridge, MA, USA, 1998; pp. 908–914. [Google Scholar]
  36. Nowlan, S.J.; Platt, J.C. A convolutional neural network hand tracker. In Advances in Neural Information Processing Systems; MIT Press: Cambridge, MA, USA, 1995; pp. 901–908. [Google Scholar]
  37. Fasel, B. Robust Face Analysis using Convolutional Neural Networks. In Proceedings of the 16th International Conference on Pattern Recognition (ICPR 2002), Quebec City, QC, Canada, 11–15 August 2002; pp. 40–43. [Google Scholar]
  38. McCallum, A.; Nigam, K. A Comparison of Event Models for Naive Bayes Text Classification. In Proceedings of the AAAI-98 Workshop on Learning for Text Categorization, Madison, WI, USA, 26–27 July 1998; pp. 41–48. [Google Scholar]
  39. Zhang, H. The optimality of naive Bayes. In Proceedings of the Seventeenth International Florida Artificial Research Society Conference, Miami Beach, FL, USA, 17–19 May 2004. [Google Scholar]
  40. McFadden, D. Conditional logit analysis of qualitative choice behavior. In Frontiers in Economics; Zarembka, P., Ed.; Academic Press: Cambrisge, MA, USA, 1973; pp. 105–142. [Google Scholar]
  41. Tavakoli, H. A Dictionary of Research Methodology and Statistics in Applied Linguistics; Rahnama Press: Tehran, Iran, 2012. [Google Scholar]
  42. Quinlan, J.R. Induction of decision trees. Mach. Learn. 1986, 1, 81–106. [Google Scholar] [CrossRef] [Green Version]
  43. Kamiński, B.; Jakubczyk, M.; Szufel, P. A framework for sensitivity analysis of decision trees. Central Eur. J. Oper. Res. 2018, 26, 135–159. [Google Scholar] [CrossRef] [PubMed]
  44. Zurada, J.M. Introduction to Artificial Neural Systems; West Publishing Co.: St. Paul, MN, USA, 1992; Volume 8. [Google Scholar]
  45. Haykin, S. Network: A comprehensive foundation. Neural Netw. 2004, 2, 41. [Google Scholar] [CrossRef]
  46. Chang, C.-C.; Lin, C.-J. LIBSVM: A library for support vector machines. ACM Trans. Intell. Syst. Technol. 2011, 2, 27. [Google Scholar] [CrossRef]
  47. Cortes, C.; Vapnik, V. Support-vector networks. Mach. Learn. 1995, 20, 273–297. [Google Scholar] [CrossRef] [Green Version]
  48. Lin, S.; Cai, L.; Lin, X.; Ji, R. Masked face detection via a modified LeNet. Neurocomputing 2016, 218, 197–202. [Google Scholar] [CrossRef]
  49. Sarvadevabhatla, R.K.; Babu, R.V. Freehand sketch recognition using deep features. arXiv, 2015; arXiv:1502.00254. [Google Scholar]
  50. Eiben, A.E.; Schoenauer, M. Evolutionary computing. Inf. Process. Lett. 2002, 82, 1–6. [Google Scholar] [CrossRef]
  51. Ma, C.; Li, W.; Gravina, R.; Cao, J.; Li, Q.; Fortino, G. Activity Level Assessment Using a Smart Cushion for People with a Sedentary Lifestyle. Sensors 2017, 17, 2269. [Google Scholar] [CrossRef] [PubMed]
  52. Caponetto, R.; Fortuna, L.; Graziani, S.; Xibilia, M. Genetic algorithms and applications in system engineering: A survey. Trans. Inst. Meas. Control 1993, 15, 143–156. [Google Scholar] [CrossRef]
Figure 1. Typical structure of the convolutional neural network (CNN).
Applsci 08 01280 g001
Figure 2. Structure of decision tree (DT).
Applsci 08 01280 g002
Figure 3. Structure of neural network (NN).
Applsci 08 01280 g003
Figure 4. Structure of support vector machine (SVM).
Applsci 08 01280 g004
Figure 5. Block diagram of proposed analysis.
Applsci 08 01280 g005
Figure 6. Designed chair cushion with pressure sensor for experiment. (a) The space inside the existing cushion has sufficient space for accommodating the sensor; (b) A film-type 8 × 8 sensor and a circuit for data processing were inserted into the cushion; (c) The upper part of the sensor was supplemented with a cut cushion; (d) The illustrated image of the pressure sensor mat with its detailed dimensions.
Applsci 08 01280 g006
Figure 7. Experiment environment and the situation of data acquisition. Left: lean left; right: sitting crossed-legged on the chair.
Applsci 08 01280 g007
Figure 8. Structure of the CNN model for data analysis.
Applsci 08 01280 g008
Figure 9. The results of confusion matrix for each participant.
Applsci 08 01280 g009
Figure 10. Results of average of precision, and recall for each sitting posture.
Applsci 08 01280 g010
Figure 11. Results of the relationship between weight groups and performance metrics (precision, recall, and accuracy).
Applsci 08 01280 g011
Table 1. Detail information of previous studies on classification of sitting postures.
No. of Pressure Sensors and Location of InstallationNo. of ParticipantsNo. of Sitting ConditionsAlgorithmAccuracyReference
Seat (5)108Density-based clustering94.2% familiarBao et al. [28]
Seat (8 × 8)109SVM93.9% unfamiliar; 98.9% familiarKamiya et al. [29]
Seat (16 × 16)257Dynamic Time Warping (DTW)85.90%W. Xu et al. [26]
Seat (4)97SVM97.20%Roh et. al. [33]
Seat (4) and Backrest (1) * Kinetic sensor (3) and temperature sensor (1)76kNN92.7% unfamiliarBenocci et al. [8]
Seat (6 × 8) and Backrest (2 × 8)79combines several Naïve Bayes classifiers82.3% unfamiliarL. Xu et al. [32]
Seat (2) and Backrest (1)206DT; SVM; Multilayer PerceptionDecision tree (99.5%); SVM (81.5%); MLP (99.7%)Ma et al. [30]
Customized device: Seat (240; a total of 96 out of 240 sensor elements have been preselected), Backrest (1); Commercial device: Seat (32 × 32), Backrest (1)911Naïve Bayes classifierCustomized: only seat sensor: 55%; (with back sensor: 81%); ComfortMat: only seat sensor: 56%; (with back sensor: 84%)Meyer et al. [9]
Seat (42 × 48) and Backrest (42 × 48)1 (single); 30 (multi)14PCA-based Algorithmssingle-user system: over 95%; multi-user system: 96% (familiar user), 79% (unfamiliar user)Tan et al. [31]
Note: *Additional sensors other than pressure sensors.
Table 2. Actual and heat map images with description of selected sitting postures.
Sitting PostureFront and Side Views of Sitting PosturesDescriptionHeat Map Images of Body Pressure Distribution
Sitting straight Applsci 08 01280 i001Sitting with the upper body straight comfortably and putting both feet flat on the floor. Placing the hip to the deepest side on the seat Applsci 08 01280 i002
Lean left Applsci 08 01280 i003Leaning the upper body to the left and the center of gravity is shifted to the left hip Applsci 08 01280 i004
Lean right Applsci 08 01280 i005Leaning the upper body to the right and the center of gravity is shifted to the right hip Applsci 08 01280 i006
Sitting at the front of the chair Applsci 08 01280 i007Sitting the front edge of the seat with the upper body straight comfortably Applsci 08 01280 i008
Sitting crossed-legged on the chair Applsci 08 01280 i009Bending both knees inward and placing each foot on the knee of the opposite leg Applsci 08 01280 i010
Table 3. Confusion matrix.
Actual Class
PositiveNegative
Predicted classPositiveTrue positive (TP)False positive (FP)
NegativeFalse negative (FN)True negative (TN)
Table 4. Results of CNN along with the best performance of the other algorithm.
CNNNBMLRDTNNSVM
10.995 (0.994)0.848 (0.900)0.776 (0.993)0.873 (0.974)0.938 (0.994)0.981 (0.986)
20.950 (0.997)0.704 (0.922)0.740 (0.990)0.716 (0.978)0.839 (0.997)0.890 (0.989)
30.908 (0.994)0.872 (0.931)0.800 (0.992)0.743 (0.979)0.912 (0.995)0.941 (0.990)
40.916 (0.997)0.902 (0.914)0.835 (0.994)0.726 (0.970)0.895 (0.996)0.926 (0.990)
50.986 (0.997)0.968 (0.928)0.894 (0.993)0.797 (0.980)0.983 (0.997)0.976 (0.989)
60.934 (0.995)0.853 (0.934)0.737 (0.990)0.776 (0.972)0.888 (0.997)0.901 (0.982)
70.902 (0.995)0.656 (0.942)0.795 (0.992)0.711 (0.981)0.835 (0.995)0.824 (0.991)
80.981 (0.994)0.965 (0.917)0.977 (0.987)0.906 (0.972)0.968 (0.992)0.991 (0.985)
90.958 (0.997)0.943 (0.921)0.952 (0.989)0.937 (0.972)0.968 (0.994)0.990 (0.988)
101.000 (0.995)0.995 (0.912)0.948 (0.991)0.755 (0.968)0.986 (0.997)0.999 (0.986)
Ave.0.953 (0.995)0.871 (0.922)0.845 (0.991)0.794 (0.975)0.921 (0.995)0.942 (0.988)
Std.0.037 (0.001)0.113 (0.012)0.091 (0.002)0.083 (0.004)0.057 (0.002)0.057 (0.003)
Note: The numbers in parentheses are training accuracy. DT (minimum parent size = 15), NN (layer = 1, neuron = 40), SVM (c = 0.05, gamma = 0.05). The numbers in parentheses are training accuracy.
Table 5. Result of ANOVA between weight groups for each performance metric.
20 kg30 kg40 kgANOVA
MeanStd.MeanStd.MeanStd.Fp
Pa0.8830.0510.8750.0980.9980.0020.0460.883
Pb0.9390.0340.9830.0180.9890.0100.0440.939
Pc0.9120.0620.9370.0910.9840.0260.3490.912
Pd0.9470.0591.0000.0001.0000.0000.1170.947
Pe0.8850.0900.9760.0330.9840.0320.1080.885
Ra0.8870.0860.9350.0830.9860.0190.2120.887
Rb0.9310.0710.9230.0860.9950.0070.2700.931
Rc0.8830.0900.9080.0801.0000.0000.0990.883
Rd0.9310.0430.9860.0180.9780.0340.1630.931
Re0.9120.0670.9850.0270.9930.0080.0600.912
Accuracy0.9090.0070.9470.0120.9910.0090.0000.909

