1. Introduction
In healthcare process management, healthcare professionals aim to formalize, improve and optimize processes by creating better clinical pathways (CPs). A CP is one of the main tools used to manage quality of healthcare and guide evidence-based medicine [
1]. Medical professionals should develop pathways in an objective manner and when putting them into practice, they should deal with variances and individual care, adaptation to target population, concept drifts, and new healthcare paradigms. Using CPs in daily practices, however, should be addressed only with the right tools and techniques [
2]. Considering that almost every step of clinical processes is undertaken digitally and recorded (as event logs) in information management systems, healthcare data can provide insights into the weaknesses of the system to suggest improvements. Refining the definition of CPs by exploiting healthcare data may be an appropriate way of managing healthcare processes for medical professionals.
Data-driven CPs are generated by applying data mining, machine learning or statistical modeling in order to respond to performance-oriented and compliance-oriented questions of CP analysis at run-time and design time. At this point, process mining (PM) is a powerful, objective technique that has been applied in various domains including healthcare. This technique links model-based process and data-oriented analysis. In the healthcare domain, application of this technique is promising due to the growing number of reported studies [
3]. PM can provide several operational insights into healthcare processes: concerning process flows, checking conformance of data with recommendations, identifying performance and waiting times in processes, and managing resource allocation. However, despite the body of evidence on the applicability and usefulness of PM techniques in the healthcare domain, there are still significant methodological and data quality challenges that need to be addressed.
Based on the need stated above and a recent literature review conducted by the same researchers [
4], this article proposes a novel, PM-based process evaluation method for improving healthcare processes. This goal-oriented method aims to (1) provide a broad overview of processes in a short time, (2) create improvement opportunities for processes by incorporating domain knowledge into process enactments, (3) analyze unstructured, multidisciplinary processes like healthcare processes, (4) implement PM activities and techniques in PM methodology, and (5) provide a practical guidance for traceability, usability and functionality of PM implementations using a goal-driven approach. This method starts with the definition of the scope and creation of a table called GQFI that addresses initial project goals (G), questions (Q), features (F) and performance indicators (I) of a PM project. In the following step, event data extraction is performed based on goals and questions. Then, data is preprocessed (by modeling, filtering or abstracting) to provide a framework for interpreting it with respect to the stated goals. Following the GQFI table, the PM analysis stage is executed in which performance indicators selected for each question are measured. The results (indicators and answers to questions) are used as inputs to the following stage of evaluating process performance. Finally, process improvement opportunities are discussed and identified.
The research described in this paper was undertaken by following a design science approach [
5] in which artifacts were built and evaluated to meet the identified business needs [
6]. In this paper, an artifact refers to a goal-driven evaluation method, and the research is divided into two stages: a design and build stage, and en evaluation stage for the constructed validation of the artifact through a case study. The feasibility of the proposed method was demonstrated with an embedded and single case study [
7] involving the surgery process, and the results showed that the proposed method has potential in initiating proposals.
The remaining of this article is organized as follows:
Section 2 presents background information on evidence-based medicine and the role of PM in this area.
Section 3 provides an overview of the generic or healthcare specific PM methodologies.
Section 4 gives detailed explanation about the PM-based process evaluation method.
Section 5 contains a practical example from a case study on surgery process and its results.
Section 6 discusses the results of the case study to identify opportunities for future research. The last section presents the overall conclusions and recommendations for future work.
3. Related Works
PM has the potential to offer many advantages for healthcare professionals. Particularly in healthcare, where most processes are complex, variable, dynamic, and multi-disciplinary in nature, the application of this technique is growing yet challenging. In this research, first, a descriptive analysis of the PM studies on healthcare [
4] was undertaken by applying systematic mapping [
29]. A total of 172 relevant papers were analyzed with respect to various aspects including research and contribution type, application context and healthcare specialty, process modeling type and notation, PM activities, PM techniques, and demographic and bibliometric analysis. The results of mapping showed that, despite the challenges related to healthcare data and technique, this field is rapidly growing and open for further research and practice.
The systematic mapping study also showed that PM community in the healthcare domain is lacking a compreherensive methodology that describes how to accomplish PM activities and techniques in practice. In data mining, efforts have been made to establish methodologies to support organizations in their data mining projects [
30]. The aim of these methodologies is to guide the planning and execution of such projects in order to save time and cost. The commonly used methodologies include CRISP-DM [
31], SEMMA [
32], and KDD [
33], which are very high-level and provide only little guidance support. Furthermore, none of the available methodologies have been tailored as specific to PM projects [
34]. The main difference between data mining and PM methodologies concerns the analysis stage, in which PM considers the whole process in terms of events with the main objectives of process discovery, conformance checking and process enhancement, whereas data mining projects analyze data statistics to determine unsuspected correlations.
During the literature review, four generic PM methodologies were identified: Process Diagnostic Method (PDM) [
35], which has also been extended to the healthcare domain [
9]; the L* life-cycle model [
8]; PM2: Process Mining Project Methodology [
34]; and Business Process Comparison Methodology [
36]. PDM was designed to obtain a broad overview of processes; however, its scope is limited and it does not utilize domain knowledge. The L* life-cycle model covers different distributed aspects of PM techniques, and is designed for structured processes. PM2 guides the execution of PM projects by defining and answering questions iteratively to improve process performance. Business process comparison methodology focuses only on the analysis of multiple processes by comparing processes or process variants.
In the related literature, 12 healthcare specific studies were found to have proposed processes to guide the use of PM techniques for process enhancement. Of these, four [
37,
38,
39,
40] present their proposals without having them validated, and therefore do not include empirical evidence for applicability or usefulness. Question-driven methodology [
41] focuses on the application of PM projects to provide answers to questions about emergency room processes. Some studies [
42,
43,
44] suggest combining PM and simulation to discover and evaluate as-is and to-be processes, respectively. Yang et al. [
45] focus on clustering patient traces and process recommendations and Dagliati et al. [
46] emphasize deriving frequent healthcare flows and clinical data enrichment. Rovani et al. [
19] address the gap between daily practice and clinical guidelines based on declarative process models, and Fernández-Llatas et al. [
47] provide filtering options and algorithms for process discovery, conformance, and enhancement by implementing PALIA ILS tool suite.
Table 1 presents the relation of methodologies with PM features that need to be addressed for analyzing healthcare processes. Based on the findings and challenges identified in previous work [
4], the current research extends PM activity types as PM features by comparing and collecting the steps of generic PM methodologies. Furthermore, indicators that can be measured by using these features were determined and are listed in
Table 2. These indicators are collected from the studies which reported quantitative benefits through the use of PM techniques. Both
Table 1 and
Table 2 were created as specific for this study. In
Table 1, the contribution of each methodology is evaluated in terms of PM features in comparison to the method proposed in this study. The information in this table reveals the need for a comprehensive methodology for in-depth practical operational guidance to assist PM practitioners in a purposeful way for the management of healthcare-specific processes.
The proposed method aims to monitor, control and improve process performance and is based on a goal-driven model to incorporate domain knowledge through an iterative analysis and through the practice of distributed PM. The GQFI table provides guidance for the interpretation of performance and compliance, and allows eliciting improvement opportunities based on bottlenecks and inconsistencies as an outcome. This method is suitable for unstructured processes, such as healthcare, and provides a guide for the state-of-the-art PM techniques, extension of data preprocessing steps, data visualization techniques, process exploration, and outlier detection. It helps achieve project goals such as improve a process with respect to particular key performance indicators (KPIs), obtain concrete data, and frame performance-oriented questions, e.g., especially frequently posed questions (FPQs) [
3].
4. Method
This section proposes and explains the goal-driven process evaluation method based on PM for improving healthcare processes. The method is based on a refined PM framework, guidelines and methodologies for PM projects [
8,
34], and adopted goal- and question-driven PM projects [
8]. It details the main stages of a healthcare process evaluation project to improve usability and understandability of PM in unstructured processes for non-experts. The proposed PM methodology seeks ways of presenting a process in a simple manner by dividing data into smaller datasets, and focusing on their specific characteristics. An overview of the goal-driven healthcare process evaluation method is shown in
Figure 1. This method can deal with a large amount of healthcare data by distributing PM activities and obtaining valuable information in the following steps: (1) The scope and goals of the project and questions to be answered are defined and a GQFI table is created following the guidance of the Goal-Question-Metric (GQM) framework [
48] with a hierarchical structure. (2) The data on cases (patients), activities and timeframe is extracted from the hospital information system (HIS). (3) Event data is formatted as event logs, and abstracted or filtered as sub-processes, as required for healthcare processes [
9]. (4) Event logs are visualized in a log/pattern inspection activity, and a broad overview of the process is obtained in a short time to fully understand the datasets, their limitations and opportunities. (5) After data preprocessing and visualization steps, sets of PM techniques are used in a distributed way by focusing on specific characteristics of the datasets in terms of questions and indicators. (6) The answers of questions and the distributions of indicators are evaluated, and improvement opportunities are gathered. (7) The findings are used to create proposals for process improvement. It should be noted that many PM techniques and activities are available; however, when dealing with big healthcare data, the executions of PM activities and the tasks of the proposed method should be distributed . Some tasks can be supported with PM tools but not all tasks can be performed using a single PM tool.
4.1. Defining Goals and Questions (GQFI)
The aim of this first stage is to exploit domain knowledge from domain experts, end users, customers or management in order to define the project scope, project goals and questions related to these goals. The scope of a project indicates what the process is, when it starts and where it ends, and for which processes and which patients. The goals of a project may be related to improving KPIs related to time, cost, risk, quality, etc. Minimizing mean surgery time, patient waiting time, service response time, and service cost or maximizing service level, i.e., percentage of treated patients within a day, are typical examples. A set of concrete performance-driven questions are used to determine the way to assess or achieve these goals. Each question can be answered with operational scenarios including one or more PM features measuring indicators of the process. Indicators are chosen to provide quantitative answers based on specific needs of stakeholders. PM features, therefore, constitute a bridge between the questions and the indicators, and this bridge can be tailored with respect to the specific needs of stakeholders in PM projects. The output of this stage is the GQFI table.
4.2. Data Extraction
In this stage, patient-related event data is extracted for PM. Healthcare data may be distributed to different data sources that are object-centric rather than process-centric, and may contain incomplete data and outliers at different levels of granularity [
37]. Healthcare data attributes are extracted according to questions and goals as well as the steps of clinical pathways or clinical guidelines. There are three minimum requirements for the control-flow analysis of healthcare data; patient id, information about activities, and timestamps of these activities. Each test, diagnosis, treatment, triage, operation, etc. is a clinical activity. Patient demographics, types and results of tests, name and category of operation, types of triage constitute data attributes for analyzing data enrichment of the discovered process model. Timestamps of data show the sequences and durations of clinical activities and are used for performance analysis. In addition, resource related attributes such as doctor, service, department, emergency or operating rooms are used for organizational analyses.
Existing models are collected for checking the conformance. A hand-made process model (a de jure model) is established by interviewing stakeholders, e.g., domain experts, end users, customers, and management. Models, other artifacts (clinical guidelines, pathways or protocols), feedback metrics and KPIs (which are defined and measured by, for example, the quality department of the hospital) are also collected.
The outputs of this stage are the extracted dataset containing event data, data reference models, hand-made process models, feedbacks from experts or stakeholders, KPIs, and other artifacts.
4.3. Data Preprocessing
Mans et al. [
3] identified a total of 27 data quality issues (e.g., missing, incorrect, imprecise and irrelevant data). To solve these problems and provide meaningful results, the extracted event data needs to be formatted, filtered, abstracted, or clustered at different levels. Furthermore, event data should be partitioned into pre-and post-mortem event log for further PM analysis.
The event data obtained as a query result must be expressed in the form of event logs to apply PM techniques and connect the event log to the model. This object model consists of the objects of the process, activities, cases, activity instances, events, event attributes (e.g., timestamps, resources, cost and transactions) and the relationships between them at the model, instance and event levels [
8].
Questions about a process are answered by filtering, in which the surgery log is given a threshold value, the most-frequent activities are kept, and the events of other activities are filtered out. It can also be helpful to decrease the complexity of the discovered model and reduce the spaghetti effect of the process. When the data is filtered according to a time interval, we can specify a performance target (e.g., 21 days) to determine the cases that do not meet the target value. This feature can be iterative during the PM analysis. The abstraction level is customized by selecting activity or assigning a single value to data attributes. Healthcare data can be converted to different levels using pattern abstraction, e.g., by using a specific plugin in ProM [
49].
Clustering can be used to exploratively analyze the event data to gain novel insights into the process. Through clustering from different perspectives (trace clustering, activity clustering, sequence clustering, etc.), the main process can be well identified. Specific characteristics of a dataset may be clustered focusing on the subsets of activities, patients, or followed paths. In this research, the most commonly used techniques were found to be trace clustering, k-means clustering, and hierarchical clustering for healthcare processes [
4]. Trace clustering is splitting event logs into homogeneous subsets and creating a process model for each subset. This approach was implemented as a ProM plugin, and is used for complex and diverse event data like healthcare process data [
50].
The outputs of the data preprocessing are preprocessed pre-mortem and post-mortem event logs.
4.4. Log and Pattern Inspection
Log and pattern inspection refers to gaining a first impression of the log and gathering statistics to create a log and a pattern summary. This inspection consists of the number of cases, events, duration of events, traces of patterns, resources, frequencies and relative frequencies of events. The aim of this stage is to fully understand and visualize the process in a quick manner. The outputs of this activity can be created in a short time using Disco or ProM plugins.
4.5. PM Analysis and Generating Answers to Questions
Once the data is preprocessed to a suitable format and filtered, different types of PM analysis can be performed. Based on post-mortem and pre-mortem event data and de jure models, PM analysis starts with process discovery techniques adopting a control flow perspective and continues with conformance checking. There are many PM techniques and activities to respond to the questions that arise. This stage includes selecting various PM features, inputs, and outputs obtained within the context of operational scenarios created for each question.
Table 3 lists the PM features and their objectives. After log inspection, the process model is discovered and explored using different mining algorithms. In this stage, the focus is on the discovery of control-flow, organizational aspects (resource perspective), and performance-related information (performance perspective). To visualize the most common paths and outliers, process variants are analyzed. The most complicated or time-consuming cases are visualized or compared in terms of the characteristics of cases. Furthermore, compliance problems and bottlenecks are identified, if any. The cases that do not meet performance targets are visualized. In cross-organizational PM, some analyses are performed using logs from different organizations of the process.
The outputs of this stage are discovered models, enhanced process models, compliance problems, bottlenecks, and process variants: e.g., most followed paths, exceptional paths (outliers), most complicated paths, or time-consuming paths.
4.6. Evaluation of the Results
In this stage, the analysis measures of the indicators are evaluated. The inputs are the indicators related to process variants, bottlenecks, and compliance findings from the previous PM analysis stage. After each PM activity, healthcare data is divided into smaller sets. New datasets can be investigated in terms of patient attributes, department, service or doctor information. Examples include analyzing and visualizing the most followed paths to identify the process, analyzing and visualizing the most complicated or time-consuming cases to identify the potential risks, assessing compliance problems for ad-hoc interventions or possible adjustments to the process, and harmonization of two or more process variants to reduce costs or complexity.
4.7. Proposals for Process Improvement
In PM, process improvement is associated with identifying and eliminating bottlenecks, preventing unnecessary states and reprocessing loops and understanding the points that are too time-consuming. Measuring indicators and answering concrete questions provide opportunities for the improvement of the process model. This knowledge can be used to enhance or extend discovered models. The outputs of this stage are proposals for process improvement and new goals or questions.
5. Case Study
The case study was designed and conducted by following the formal case study research approach and guidelines [
7,
51,
52]. The proposed method aims to monitor, control and motivate improvement of healthcare processes and is based on the principles of a goal-driven PM project [
8]. The objective of the study is to investigate the applicability of the proposed method and its potential in initiating proposals for healthcare process improvement.
This case study follows the embedded and single-case study design according to the classification proposed by Yin [
7]. It is embedded since it considers several analysis units as categories of surgery, and it is a single case study since it considers the surgery process of a university hospital. The clinical data was recorded in January 2017 at all departments of a university hospital in Turkey. 1.152 patients who had undergone an operation were included and the demographics of these patients, surgery type, and the activities related to operation (e.g., admission, starting surgery, finishing surgery, discharge status) were analyzed.
This study uses multiple data sources: archival data as a major source of information, as well as indicators. Archival data is a third degree data type, for which HIS is an important source. The data to be collected is defined based on a goal-driven measurement technique used in the proposed method. In this study, the surgery process of the hospital was selected because it is one of the very well-defined healthcare processes in the organization. The case study was executed by following seven stages of the proposed method and using different PM tools. Four types of PM analysis, namely process discovery, conformance checking, process variant analysis, and performance analysis and two PM tools (ProM and Disco) were used. The latter tool was utilized to generate more understandable and simpler outputs.
5.1. Defining Goals and Questions
In this stage, the scope of analysis and the goals, questions, and indicators are determined to decide on the necessary PM features.
In the current case study, the scope of analysis was a general surgery process of a university hospital. Surgery, elective or required, is performed for various reasons. Depending on the diagnosis, the surgery type changes; e.g., optional or elective, required, urgent or emergency. Depending on the type of surgery, different methods, such as open or minimally invasive techniques may be used. According to the American Medical Association and the American College of Surgeons, there are 24 most common surgical operations including appendectomy, cataract surgery, hysteroscopy, mastectomy, etc. The surgery process has several steps; preparation, preoperative tests required, recovery, management of postoperative discomfort and pain management, and discharge planning.
The goal of this study was to understand the timeliness of surgery process from the viewpoint of the management in a university hospital. Four questions were used to determine the way to achieve this goal. Then, a set of indicators which can be measured using PM features were selected. The PM features selected for each question can be answered within relevant operational scenarios. All these elements are presented in a GQFI table as shown in
Table 4. This table was created by a PM practitioner after several brainstorming sessions with the healthcare experts in the hospital. More specifically, the indicators were selected from within the KPIs that are subject to audit by the Ministry of Health and after discussions with the quality management staff of the hospital.
5.2. Data Extraction
After the GQFI table is defined, the data to be analyzed in terms of cases, activities and timeframe is determined. In this process, the event data automatically extracted from HIS with respect to a given query by the data management center of the hospital was used. This data contains information about 1172 cases that underwent any surgical operation in January 2017, for which all diagnostics, treatments and surgical operational activities were recorded.
The surgery process is supported by different departments of the hospital. For any PM analysis of this process, three mandatory parameters are necessary; patient id, activity name, and timestamp. There is a range of different activities undertaken in the history of the patient. There are also additional data attributes which can be used in the analysis; e.g., the doctor that performed the surgery, department, service, operating room, surgery category, diagnosis, and patient demographics such as age and gender.
Contextual data on the processes of ambulatory surgery and inpatient surgery as well as discharge and admission processes was manually obtained from the quality management department of the hospital. The feedback metrics of these processes were as follows: number of cancelled operations due to insufficient preparation before surgery, percentage of outpatients to transferred to a service, length of hospital stay, and number of patients discharged. In addition, mortality rate and number of complications were important indicators showing the efficiency of the surgery process.
5.3. Data Preprocessing
This stage consists of formatting and abstraction of sub-processes. Event data should be formatted in event logs to carry out PM techniques. For this reason, the surgery process data was converted automatically and modeled with the software that we developed according to the event object model [
8].
Typically, a surgery process comprises the steps of admission to hospital, preoperative examination, surgery, postoperative examination, service transaction, department transaction, intensive care transaction, and discharge activities. A patient can perform any of these activities any number of times. A case object is a patient in this process model, and an event object relates to each activity undertaken for each patient. Age, gender and diagnosis of patient are held at the instance level, and the performed activity, timestamp of activity, department and service of activity, and doctor are held at event level with the event object and its attributes. Age, gender, diagnosis, and surgery name are data attributes of the event; doctor, department, service, and operation room are resource attributes; and the timestamp of activities are the performance attributes. All these attributes can be used to enrich the discovered process model from different perspectives; i.e., data, resource and performance.
Log mining may result in a complicated, spaghetti-like model with too much detail, which makes it difficult to understand and manage data. The surgery log of this hospital contained a huge number of distinct surgical and laboratory activities. To avoid complications, all the low-level laboratory tests were considered as a single test and all distinct operations as a single surgical activity. An example from an event log of a single patient is given in
Table 5.
5.4. Log and Pattern Inspection
Log inspection can be performed using Disco or ProM. ProM is an open source tool that provides many different techniques for log inspection; e.g., dotted chart, log visualizer, log summary plugins, and pattern abstraction. Once the log is loaded, it can be viewed in various ways. Using Disco, the number of events and patients was obtained, the data of individuals was examined from the log, and process variants were traced. Some of the statistics were also checked using the log summary viewer as shown in
Table 6 to gain an insight into the surgery process.
5.5. PM Analysis and Generating Answers to Questions
In this phase, the results of a detailed analysis of the surgery process are presented. Scenarios including PM features were employed using the existing PM tool of Disco; therefore, in this paper, the outputs (map, statistics and case view) of Disco were used to answer the questions. In the PM analysis stage, each question was answered based on the PM features and the answer was quantitatively evaluated via measuring indicators as follows:
- Q1
How does the process look like?
The operational scenario to answer this question shows the general characteristics of the process in terms of process map, statistics, and patterns. It includes two PM features explained below.
Log and Patterns Inspection: Disco provided detailed statistics of the process.
Table 6 shows that there were 1172 cases and 6299 events under nine main activities; thus, the dataset was relatively small. The timeframe of the data was approximately three months. The average length of hospital stay was five days (12.8 days for groups of A1-A2-A3; 5.1 days for group of B; 3.8 days for group of C; 37.8 h for group of D; and 60 h for group of E). For some cases, however, the process lasted up to 129 days. The greatest relative frequency value belonged to the gynecology department (22%), operation room (for day of surgery) (54%), and cataract surgery (7%). There were 58 process variants and five events belonging to the first process variant.
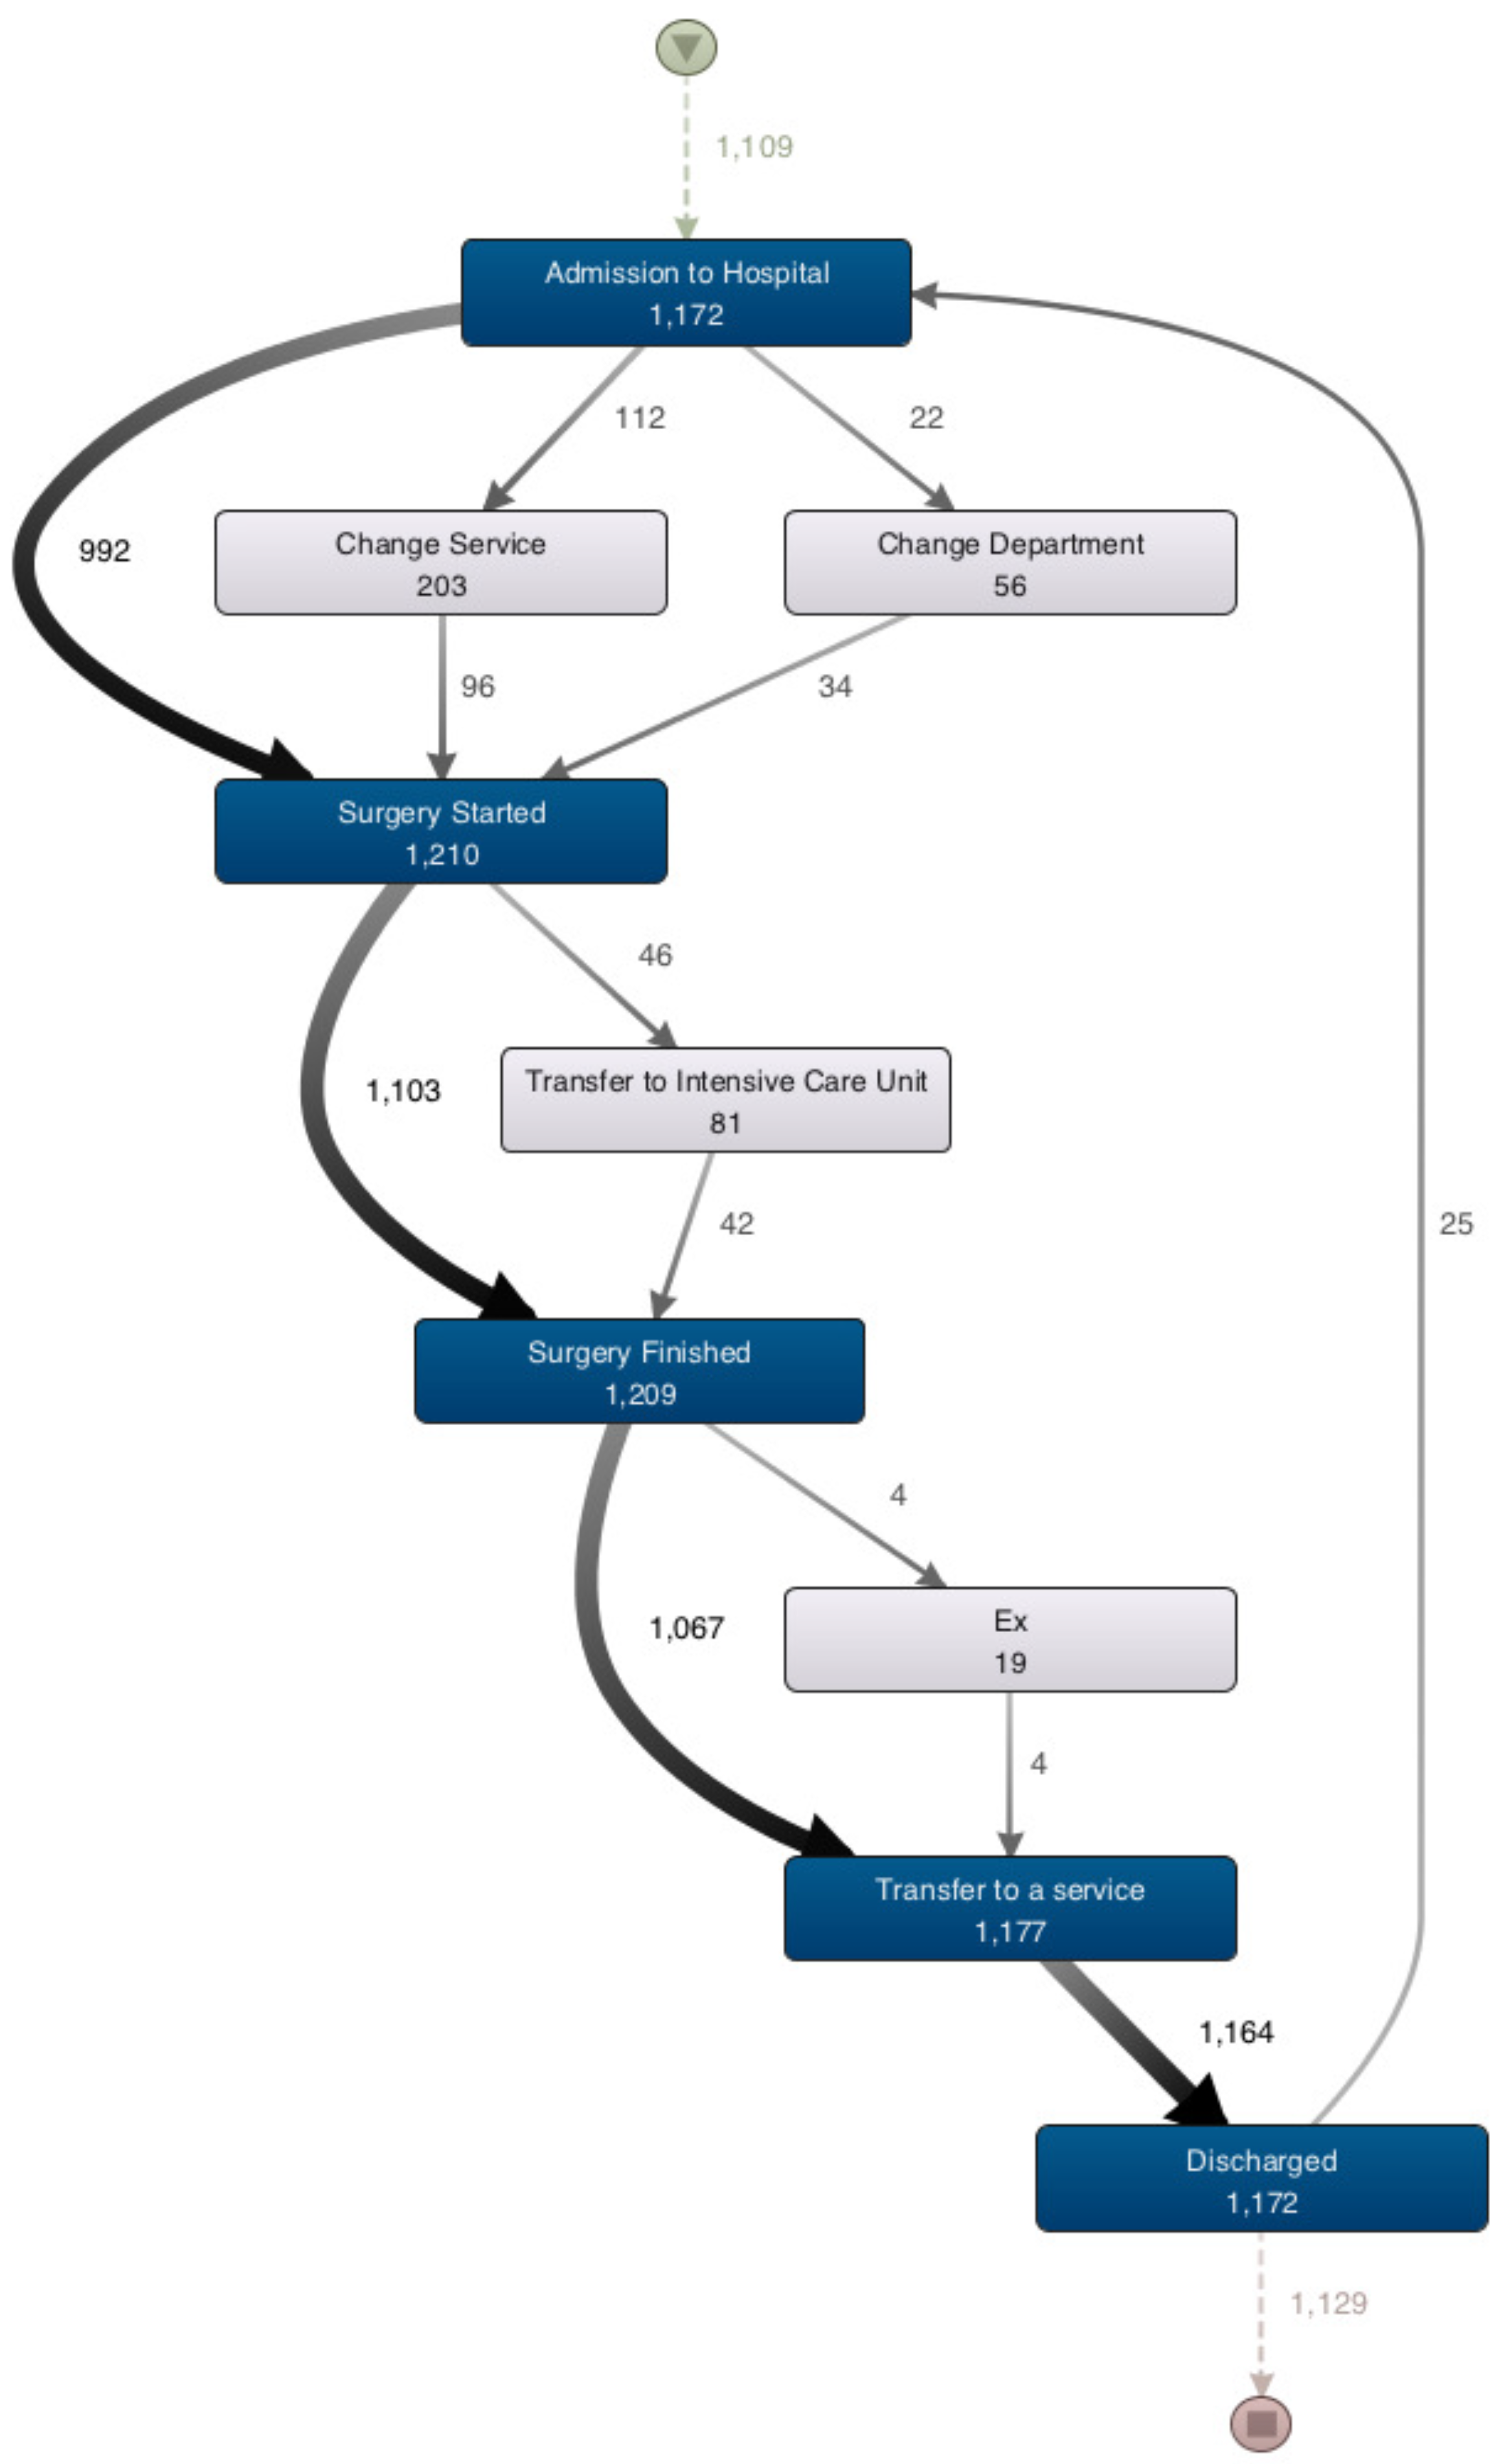
Process Discovery: A process map of the surgery process was created to demonstrate how the process looks (
Figure 2). This map was generated by Disco Miner, which is a further developed version on Fuzzy Miner [
53]. Fuzzy miner is one of the younger process discovery algorithms and uses significance/correlation metrics to interactively simplify the process model at the desired level of abstraction. The starting point of the process map in the figure is a little triangle on the top, which shows 1172 patients. All the patients started either with “Admission to Hospital”, the first step of the process, or directly with the “Surgery Started” activity. After admission to the hospital, the process is split into four alternative paths. The thicker arrow reflects the most frequent activities; e.g., “Surgery Started” activity undertaken by 992 patients after admission. There is no dominant rework loop around the activities; only 25 patients were admitted to the hospital again after having been discharged. Ending activities are “Discharged”, “Ex”, “Surgery Finished”, and “Transfer to a Service”. At the time of the study, 13 patients had not been discharged yet and 1159 patients had completed the surgery process and been discharged. When the activity slider is pulled down to the lowest point, it is seen that there are only five main activities performed. Missing patients may be observed between activities due to the simplified view and the examination of only the most important flows. When the path slider is pulled to the top, all the paths are revealed as shown in
Figure 3, and the process map becomes more complicated.
- Q2
What are the most followed paths and exceptional paths?
The operational scenario for this question includes two PM features explained below:
Log and Patterns Inspection: In the case view of this process, there are 58 different process variants belonging to 1172 individual patients.
Process Variant Analysis: As shown in
Table 7, the most frequent variants of the surgery process were derived. Variant 1 covers around 65% of the events related to 767 different patients (doctors’ varying operations and timestamps) that follow the same path within the average length of hospital stay of two days. The most followed path is the same as in the main process. There are many process variants in terms of traces of the surgery process. Twenty-nine variants (0.09%), having a single patient, follow a distinct path from others.
- Q3
Where are the bottlenecks in the process?
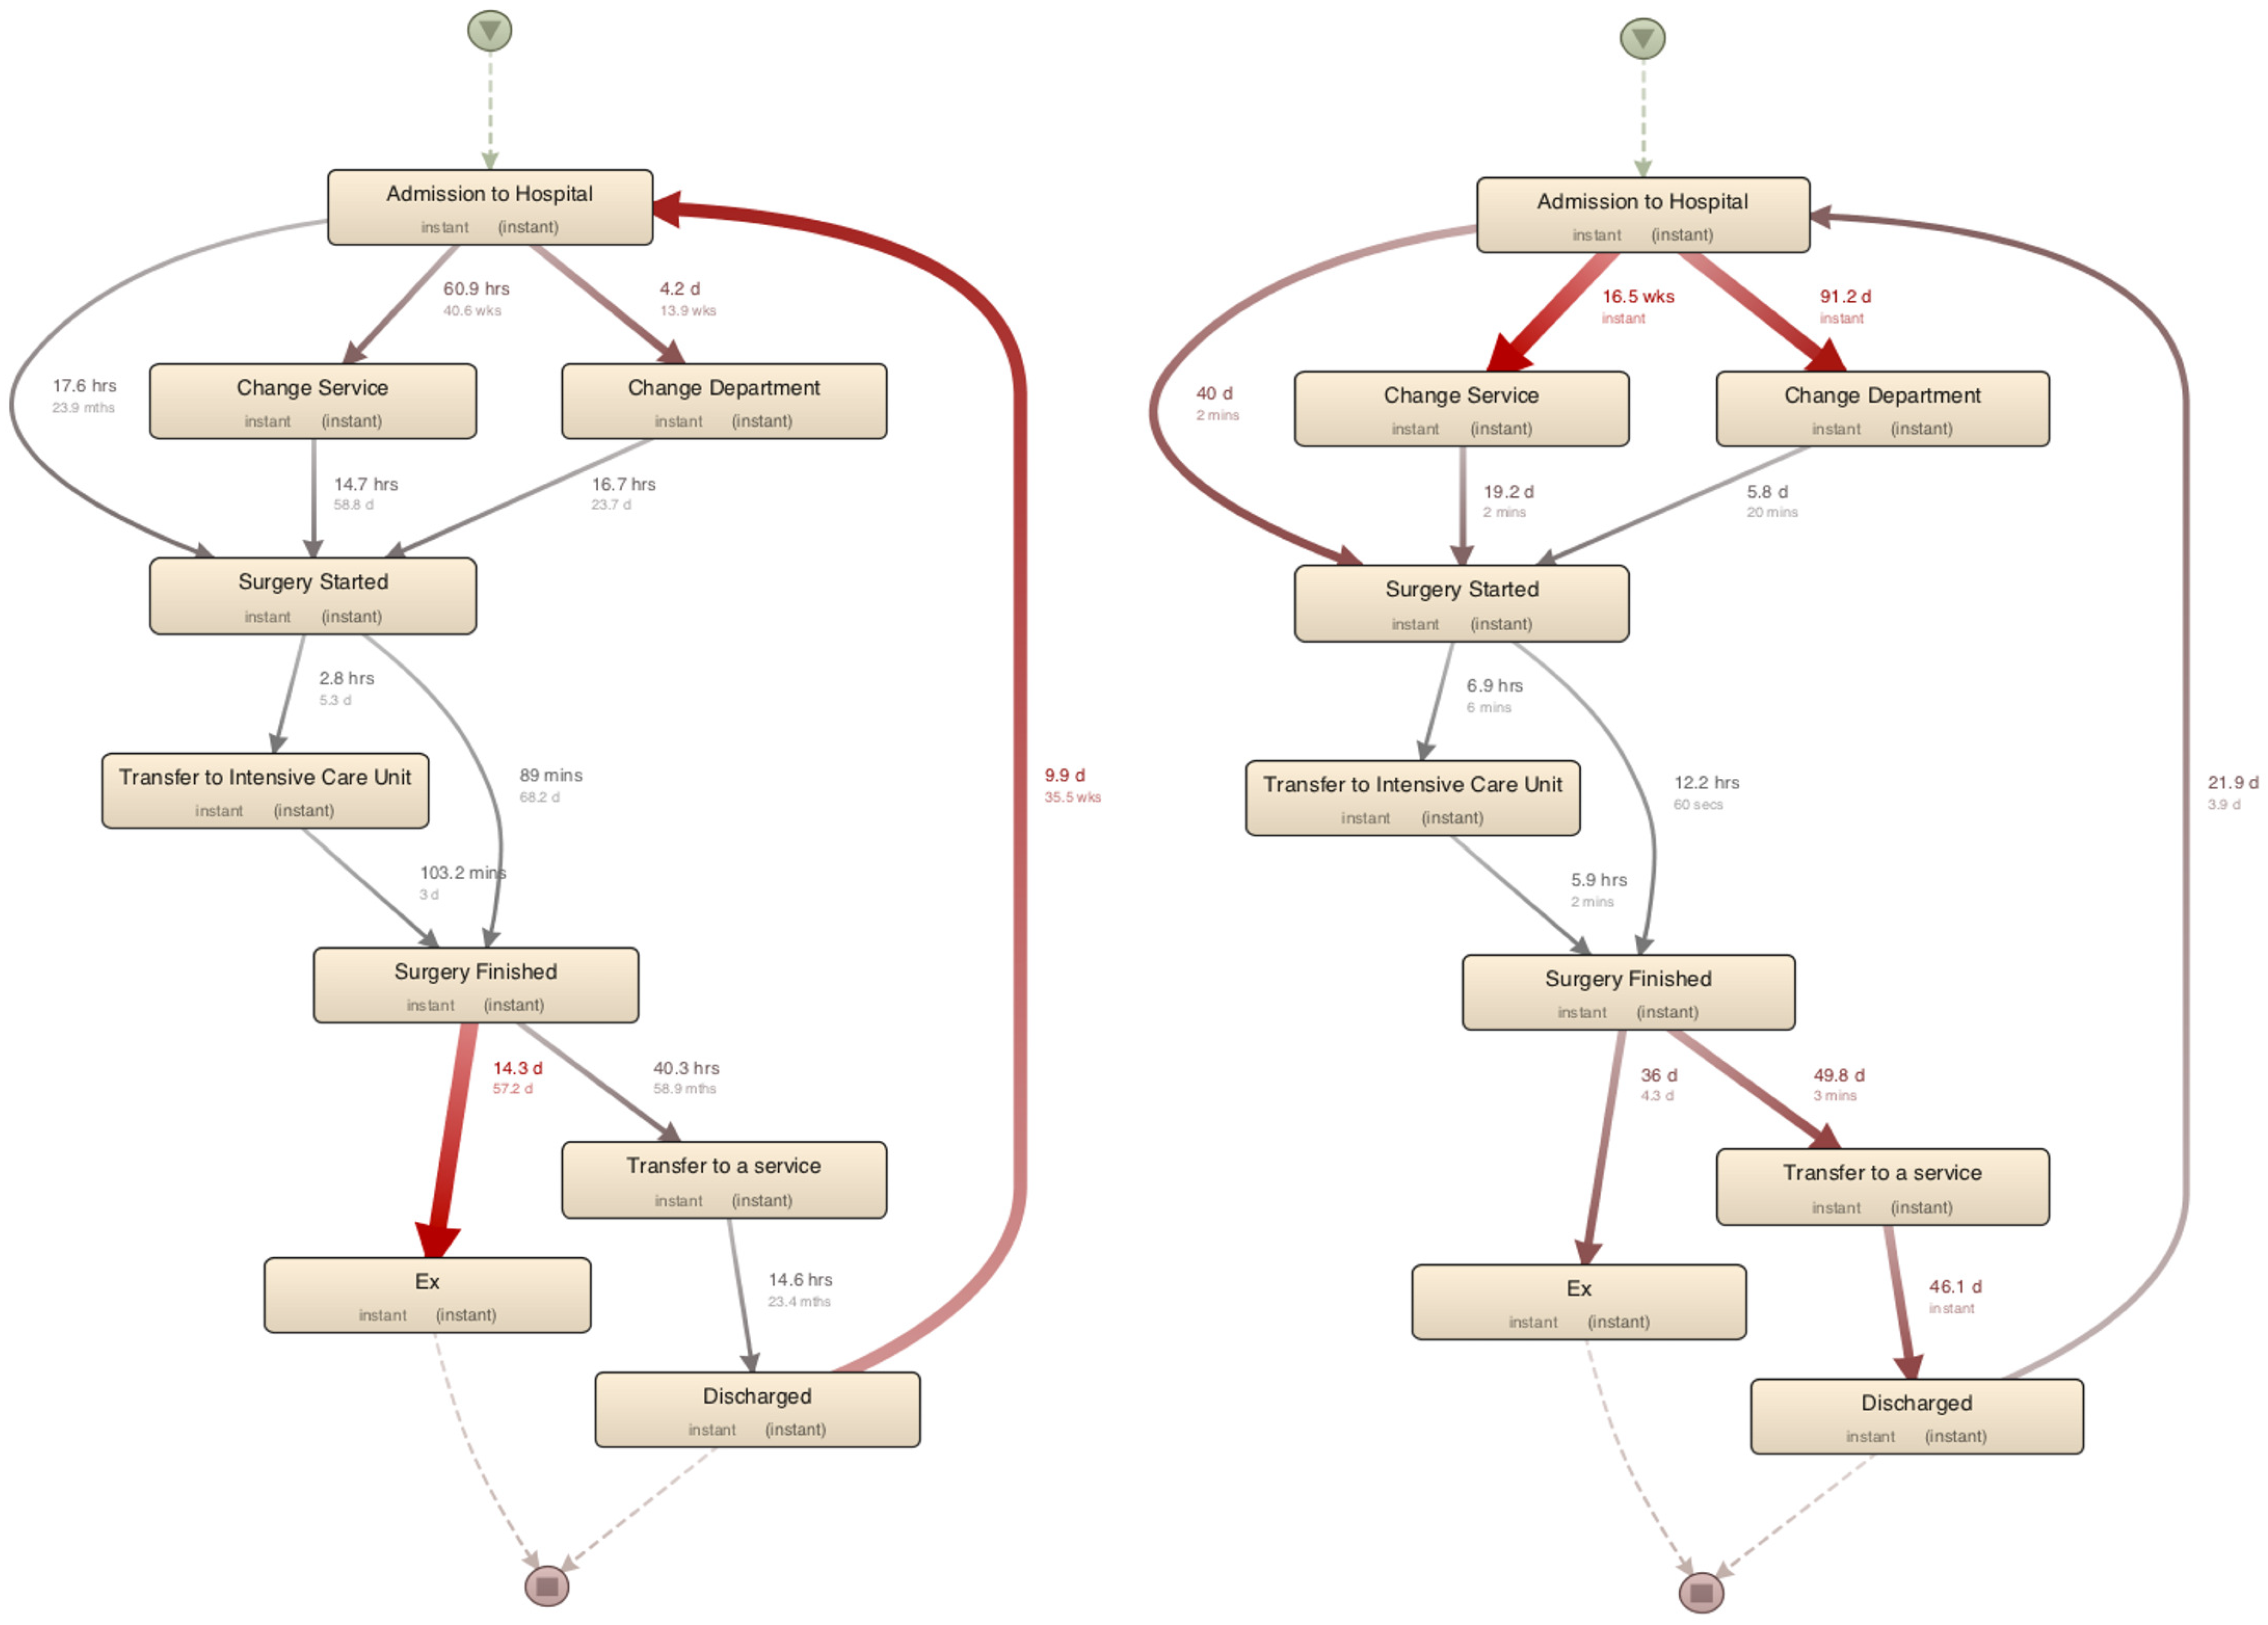
Performance Analysis: In the performance analysis using Disco, the total duration and max/min duration showed total/average delays and time spent in different steps of the surgery process, as shown in
Figure 4. Following “admission to hospital”, the steps of “change service” (60.9 h) or “change department” (4.2 days) took longer than expected. Furthermore, after being discharged, some patients were admitted to the hospital again within an average of 9.9 days for various reasons. An interesting observation is that some patients waited in the recovery room for 40.3 h on average before being transferred to a service.
Figure 4 shows the max and min durations of the paths. The surgery time ranges from 60 secs to 12.2 h. There are some bottlenecks during pre-operative (in transition from “admission to hospital” to “surgery started”) and post-operative (in transition from “surgery finished” to “discharged”) activities of the processes.
- Q4
Are there deviations from the prescribed process?
A detailed view of the process map in Disco tool was used to compare the observed behavior with the modeled behavior. According to the frequency analysis of the whole process (all activities and paths in
Figure 3), most cases followed a sequential path: the patient was admitted to the hospital, had surgery, was transferred to a service, and was finally discharged. This conforms to the modeled behavior of the surgery process. Concerning the traces that did not fit the modeled behavior well, the matching rate was calculated as 87% as shown in
Table 8. In variants V4, V5, and V15 (n = 75), the “change service” activity appeared to be in the time frame of the patient’s operation. In variants V7 and V13 (n = 25), the patients underwent multiple operations. For six of these patients, the log regarding the transfer to a service was not available. In variants V8, V12, V14, and V16 (n = 37), the “surgery started” activity occurred before “admission to hospital”.
5.5.1. Evaluation of the Results
In this stage, an instance of the GQFI table is derived using the actual values of indicators, and the quantitative results are summarized in the form of answers to the questions 1–4.
- Q1
Some performance problems were observed e.g., quite a few cases taking much longer than 21 days (up to 129 days, which is an outlier). It is necessary to determine the step(s) of the process that take(s) too much time, why, and for which patients or surgery.
- Q2
The most followed path covers 65% of all process instances, and there are many exceptional paths (with 29 process variants). These deviations show that the practicing of these processes needs to be divided into different paths for different groups of patients or surgery categories.
- Q3
Bottleneck points of the process are “change service” (60.9 h) and “change department” (4.2 days). This could be due to the problems related to preoperative operations or service resource allocation for these cases. During the average 40.3 h, the patients waited in the recovery room without being transferred to a service. This could be related to the health status of patients or the nature or success of surgery. The process map does not provide information about the reasons for these bottlenecks and the long waiting time since the root causes would differ and need to be investigated.
- Q4
The non-fitting process variants reveal that 6% of the patients were transferred to a service without being officially finished surgery, 3% of the patients had surgery without being officially admitted to the hospital, and six patients were not transferred to a service between two surgical operations. After filtering the non-fitting traces, concrete cases should be investigated with other attributes, such as department, surgery, or surgery category.
5.5.2. Proposals for Process Improvement
The surgery process consists of five main activities; admission to hospital, surgery started, surgery finished, transfer to a service, and discharged, which are expected to take place sequentially. Depending on the nature of process or state of patients, between these activities, other activities may also occur (e.g., change service/department or transfer to the intensive care unit or being ex) or loops between them.
In this case study, the timeliness of the surgery process was associated with some basic indicators about the process, variants, deviations, bottlenecks, and inconsistencies. In some of the event logs, skipping of events, missing events, and rework loops (repetitions) of surgery process were detected. There were two bottlenecks resulting from the absence of certain records in pre-operative and post-operative process. Lack of resources and staff or nature of specialty would explain the steps of the process that were delayed. Inconsistencies related to admission and surgery of patient were also observed. Using and integrating RFID tags that record the times for starting and finishing surgery of the patient and visualizing this information could help to increase the quality of care in the hospital.
Finally, new questions were defined based on the bottleneck and inconsistencies identified; e.g., “What are the reasons for deviation from the defined process?” and “Are the records accurate?” These questions allow checking conformance to specifications based on actual behavior, and determine or manage the steps of HIS in which deviations take place. Another question is “How would the process look if we only included patients that stayed at the hospital for more than 21 days?”. Here, we could specify a performance target to examine and visualize the cases that did not meet the target value using the performance target analysis.
6. Conclusions and Future Work
In this paper, a goal-driven process evaluation method based on PM was presented for healthcare processes. The method is executed through operational scenarios to answer typical, frequent questions for these processes. The aims, activities, inputs, and outputs of each stage in the proposed method were discussed and then a case study was undertaken to investigate the feasibility of the proposed method in eliciting process improvements. The application of the proposed method covered all three aims of PM activities, as well as other activities such as process variant analysis and performance analysis. A sample GQFI table was derived for the case study, PM activities were executed, the predefined questions were answered, and the results were evaluated. Basic statistics such as mostly followed variants, exceptional variants, bottlenecks, and inconsistencies of the surgery process were analyzed based on PM activities. Opportunities for improvement were identified to minimize cost, reduce average stay time and use of resources, and maximize services and outcomes of the process and the quality of care.
Table 9 shows an overview of the SWOT analysis [
54] of the proposed method for application of PM in the healthcare domain. Based on the SWOT analysis, it is concluded that strengths and opportunities of the proposed method are more significant than its weaknesses and threats.
In future work, we plan to apply this method to other healthcare processes, e.g., emergency process, by conducting further case studies. In addition, there is a need for the development of a tool that will support the evaluation method and the execution of the operational scenarios and PM features of the proposed method; e.g., process exploration, process comparison, and outlier detection. Developing such a tool might also be useful to support on-site analysis of healthcare process data by medical professionals and hospital managers.


