Seismic Behavior and Shear Bearing Capacity of Ultra-High Performance Fiber-Reinforced Concrete (UHPFRC) Beam-Column Joints

1
School of Civil Engineering and Architecture, Northeast Electric Power University, Jilin 132012, China
2
Key Lab of Structures Dynamic Behavior and Control (Harbin Institute of Technology), Ministry of Education, Harbin 150090, China
*
Author to whom correspondence should be addressed.
Appl. Sci. 2018, 8(5), 810; https://doi.org/10.3390/app8050810
Submission received: 18 March 2018
/
Revised: 4 May 2018
/
Accepted: 14 May 2018
/
Published: 18 May 2018
(This article belongs to the Section Materials Science and Engineering)
Abstract
:This work aims to investigate the seismic behavior and shear bearing capacity of Ultra-High Performance Fiber-Reinforced Concrete (UHPFRC) beam-column joints. Quasi-static tests were conducted on five exterior and four interior reinforced UHPFRC beam-column joints; the behavior of specimens was examined in terms of failure processes, shear deformation angle, load transfer, and loadbearing capacity. The influences of the joint types, axial compression load level, and stirrup ratio in joint cores on the failure modes and shear carrying capacity of joints were analyzed. The shear resistance mechanism of a reinforced UHPFRC beam-column joint consists of the diagonal strut and truss mechanisms. The role of steel fiber through cracks is similar to reinforcement bars in the truss mechanism; based on these mechanisms and the test results, a formula was proposed to predict the shear carrying capacity of reinforced UHPFRC joints. The formula can reflect the effects of axial compression load level, steel fiber content, and stirrup ratio in the joint core on the shear carrying capacity of the beam-column joint, which can be used not only for UHPFRC beam-column joint design, but also steel fiber high-strength concrete joints.
1. Introduction
The beam-column joint is the important element in the reinforced concrete (RC) frame structure, which carries large horizontal and vertical shear forces as the internal forces of beam and column transfers through joints. Earthquake damage demonstrates that beam-column joints are susceptible to shear failure. In order avoid shear failure, a high percentage of transverse stirrups are required in the joint core [1], which may lead to reinforcement congestion and, thus, construction difficulties in casting concrete in the joint regions [2,3]. Fiber RC may be a feasible solution to reduce the congestion of stirrups in the beam-column joint core [4,5]. The main objective of this research is to provide experimental evidence of the behavior of beam-column joints with UHPFRC under earthquake loads and with various design parameters, and determine the effect of UHPFRC on the shear bearing capacity of beam-column joints.
Since the mid-1960s, numerous researchers have conducted a series of studies on the calculation of the shear carrying capacity of beam-column joints, and proposed certain analytical models; for instance, the diagonal strut mechanism, truss mechanism [6], softened strut-and-tie model, simplified softened strut-and-tie model [7,8], general analytical model [9], and two diagonal axial springs model [10]. Those models and their parameters were mainly developed based on the experimental results of beam-column joints with normal concrete (NC); however, the mechanical properties vary significantly between UHPFRC and NC. The compressive strength of UHPFRC ranges from 120 to 800 MPa; its fracture energy can reach 40,000 J/m2, its toughness index (TI) can reach 3.5, and its ultimate tensile strain can reach up to 0.0003 [11,12,13]. The improvement of UHPFRC in terms of strength, toughness, and deformation capacity will influence the failure characteristics of the structure, which may affect the load-carrying capacity. Yang et al. [14] conducted a test on the torsional behavior of the UHPFRC beam and investigated the effect of the transverse and longitudinal reinforcement ratio on the angle of the diagonal compressive stresses. Shi et al. [15] investigated the bearing features of UHPFRC columns under eccentric compression and developed a simple analytical method for calculating the ultimate loads of UHPFRC columns. Existing test result of UHPFRC beam and column components indicated that the existing models or parameters are not completely suitable for UHPFRC structures. Very little research has been done on seismic behavior and shear-bearing capacity UHPFRC beam-column joints. The compressive strength, tensile strength, and ultimate strain of UHPFRC are all higher than that of NC, so the cracking load and ultimate bearing capacities of the UHPFRC joint should be different to those of the NC joint. On the other hand, the UHPFRC usually contain no coarse aggregates, and the aggregate interlock forces are nearly nonexistent. However, the steel fiber that exists in UHPFRC may change the failure process and modes, and lead to change the load bearing capacity. Therefore, it is necessary to investigate the behavior and failure mechanism of the UHPFRC joint under earthquake loads through experiments, analyze the components of shear resistance, and suggest a formula for calculating the shear bearing capacity of UHPFRC beam-column joints.
2. Test Program
2.1. Specimen Details
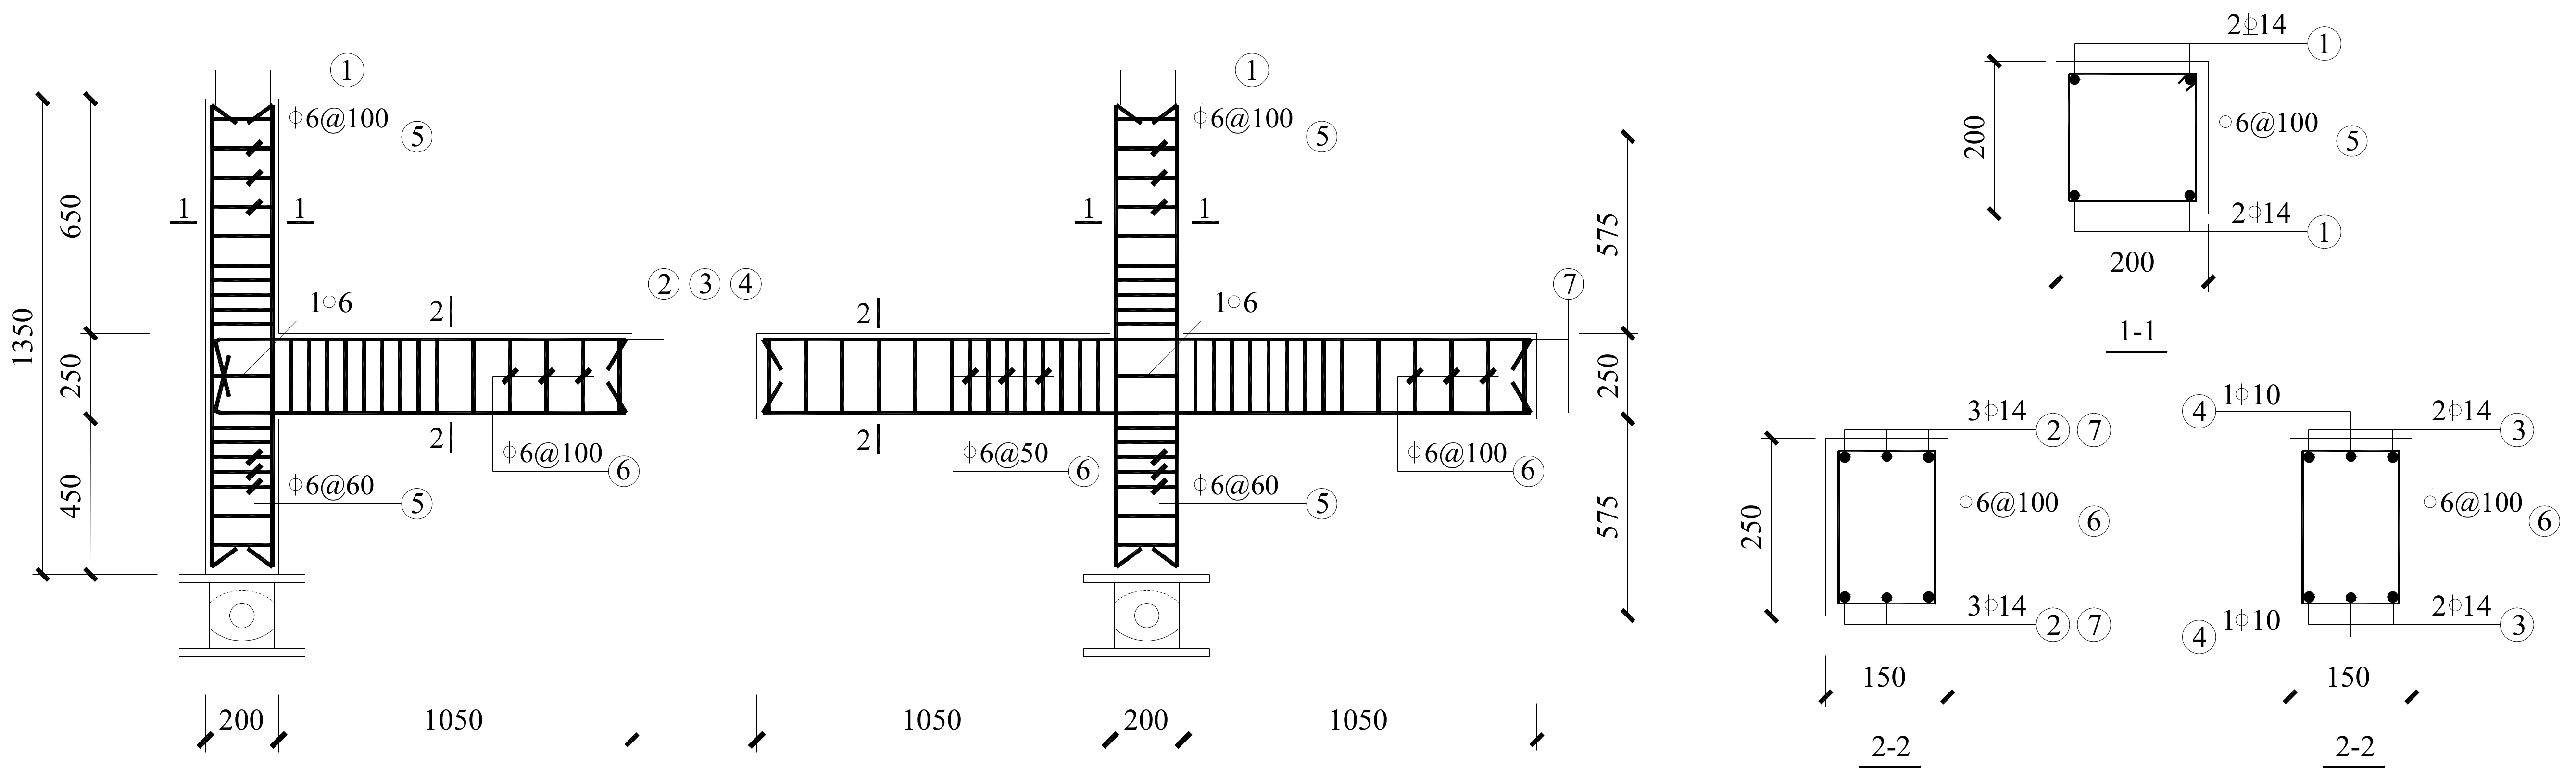
A total of nine (five exterior and four interior) UHPFRC beam-column joints were cast and tested under cyclic loading. For the purpose of obtaining the shear strength of the UHPFRC beam-column joints, all specimens were designed based on the weak joint–strong component design principle, and shear failure was expected in the joint core. All specimens were designed with the same dimensions. The beam cross-section was 150 × 250 mm, and the column cross-section was 200 × 200 mm. Figure 1 illustrates the size and details of the reinforcement of specimens. The test specimen variables included the stirrup ratio in the joint core and axial compression load level. The specimen design parameters are displayed in Table 1.
2.2. Materials
For the UHPFRC joint specimens, the UHPFRC was prepared with the following ingredients: ordinary Portland cement (P.O. 42.5), silica fume (with a specific surface area of 143,100 cm2/g and specific gravity of 2.21 kg/m3), quartz sand, steel fiber (13 mm long with a diameter of 0.2 mm and tensile strength of 2950 MPa), superplasticizer, and water. The UHPFRC mixture proportions are displayed in Table 2. The volume percentage of the steel fiber was 1.3%. Three cubic specimens (100 × 100 × 100 mm) were cast together with each UHPFRC joint specimen to determine the UHPFRC strength. Strength and quasi-static tests of joints were carried out on the same day. The compressive strength of the UHPFRC is indicated in Table 1.
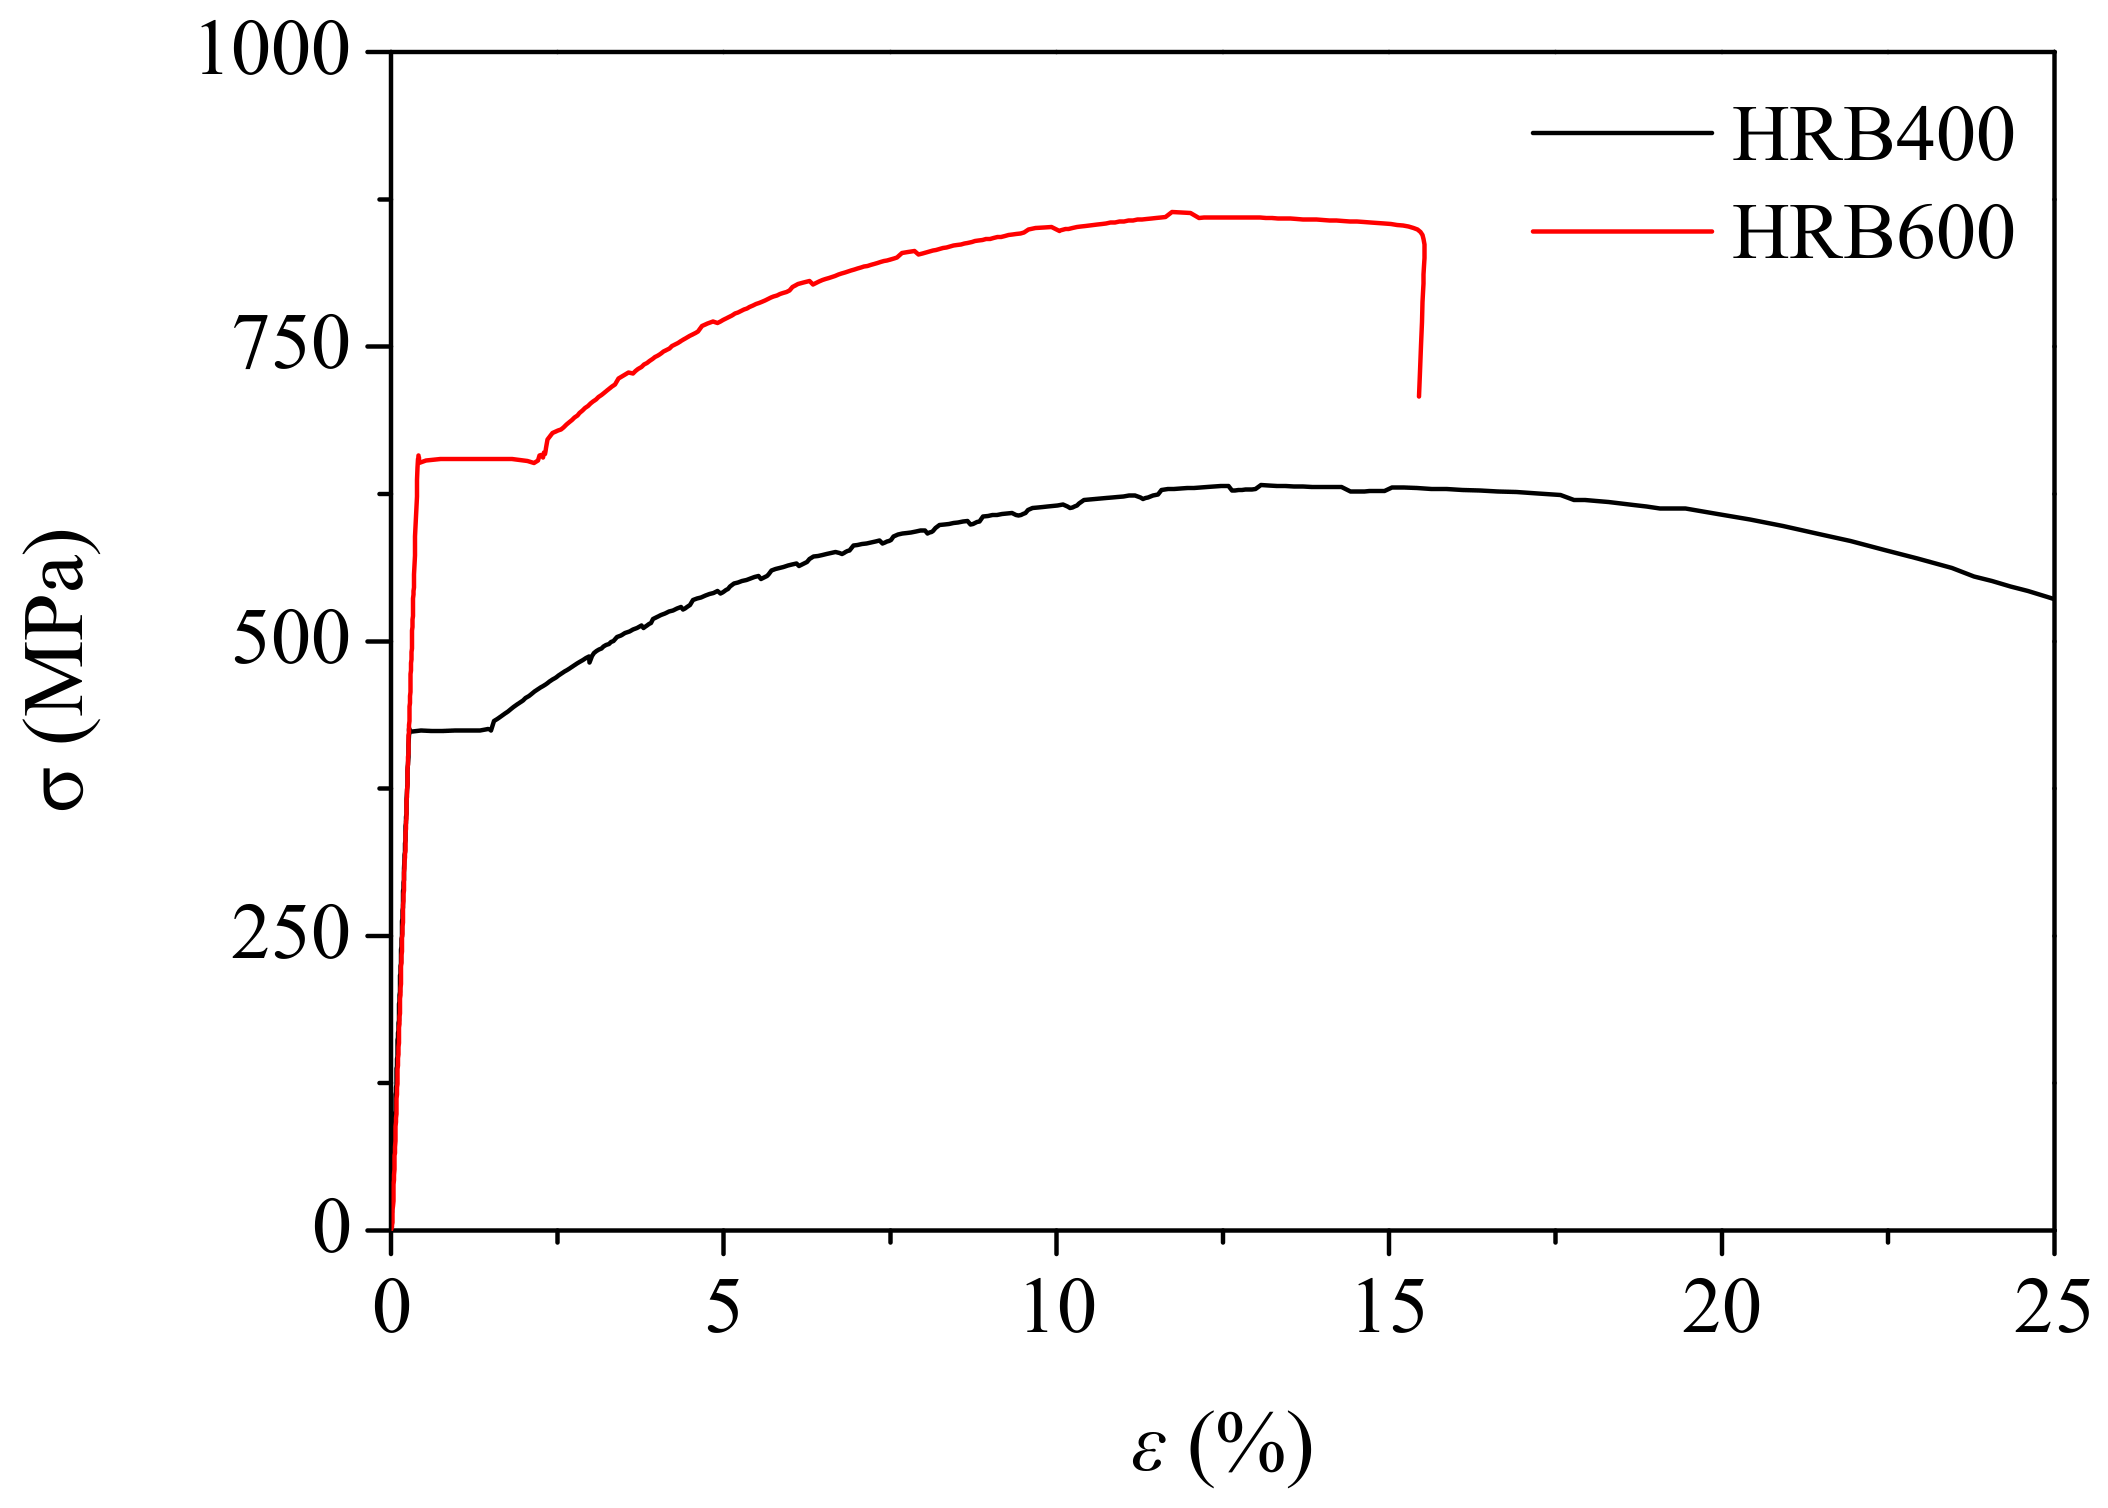
The longitudinal reinforcement bars in the beam and column were the HRB400 and HRB600 grade deformed steel bars, while the stirrups were the HPB300 grade plain bars. The effective diameter and measured mechanical properties of the steel bars are listed in Table 3. Figure 2 shows the stress-strain curves of HRB400 and HRB600 grade steel bars.
2.3. Test Setup and Loading Procedure
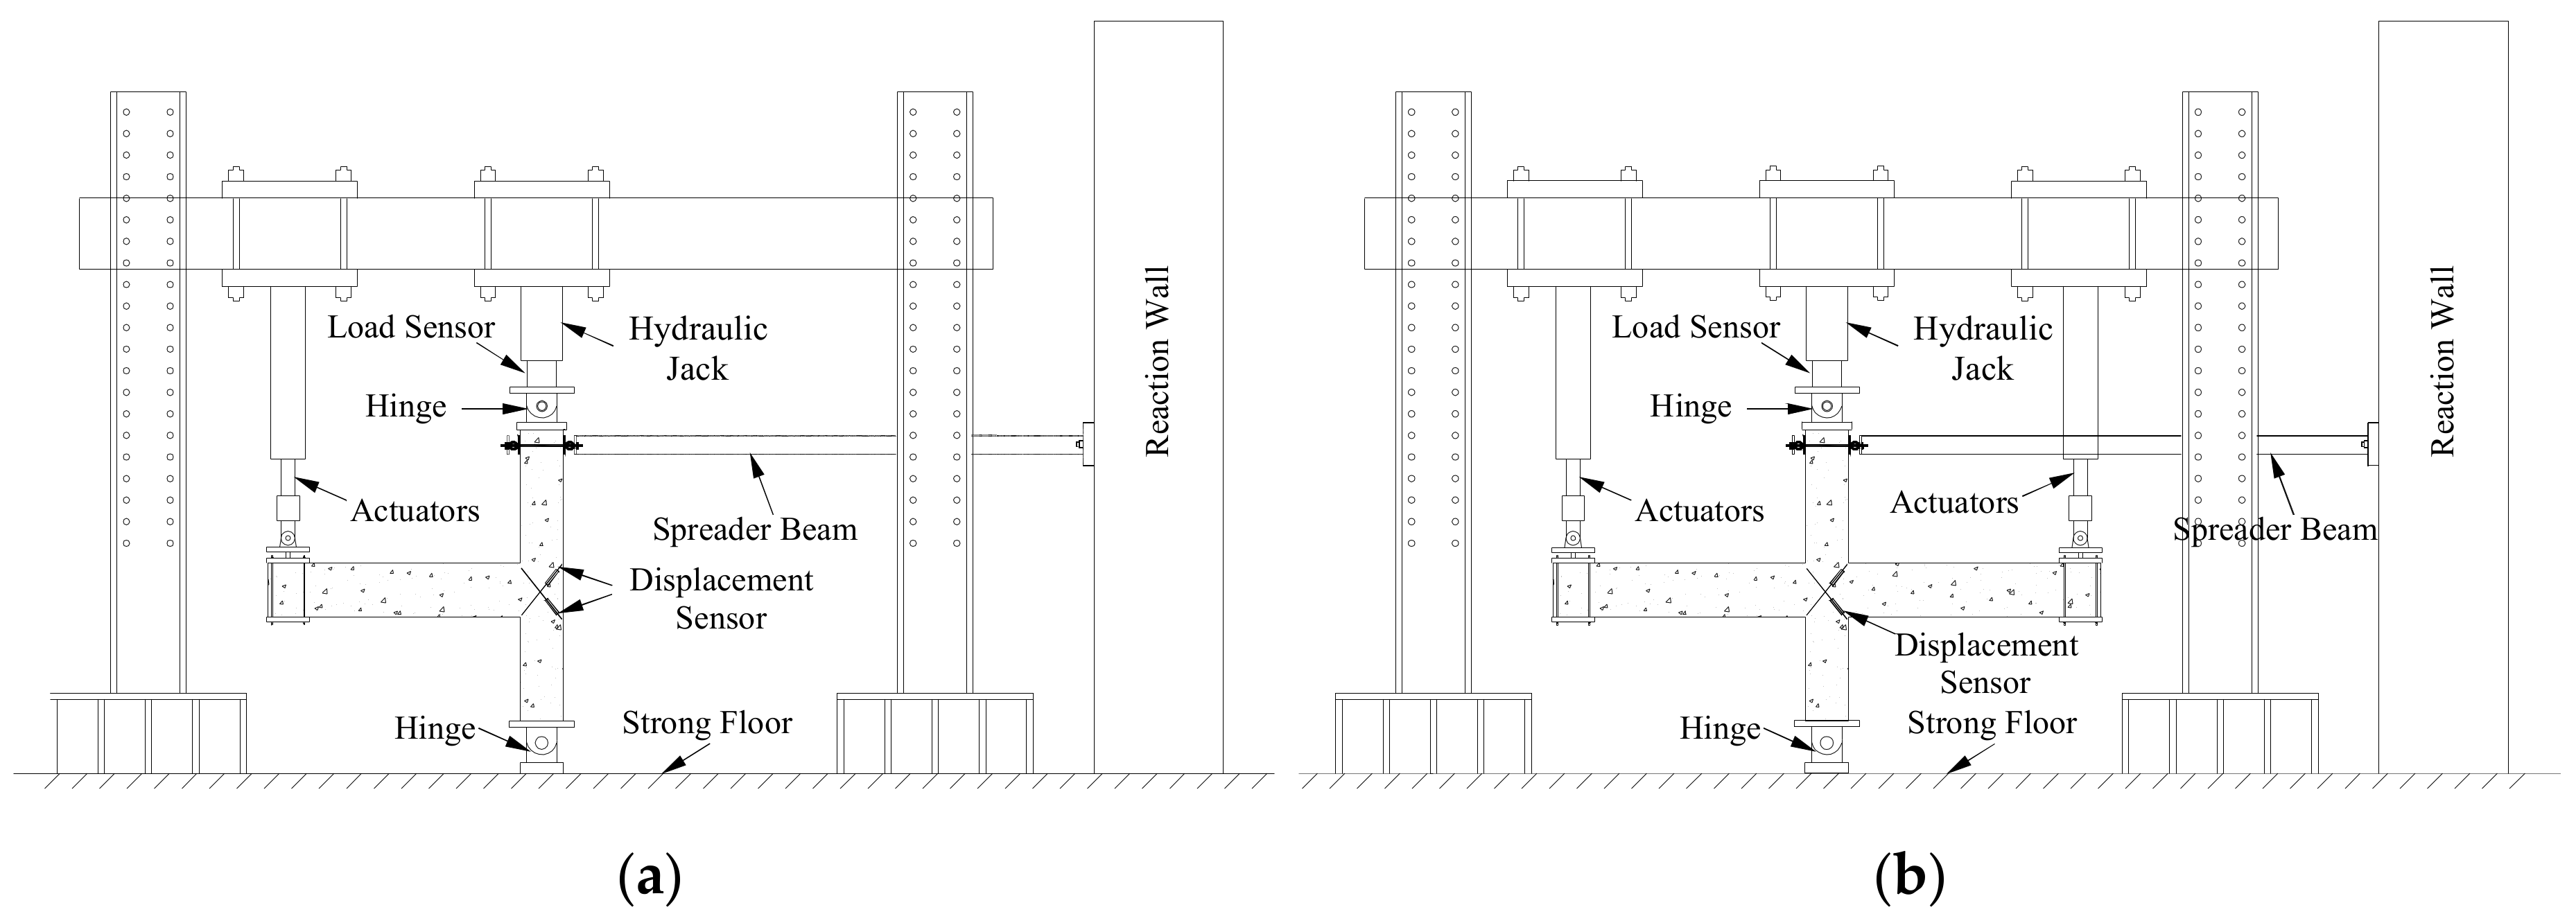
The beam tip was subjected to a cyclic load as the column was subjected to a constant compressive load. A schematic of the test setup is provided in Figure 3. The bottom and top of the column formed a hinged support, which was simulated by solid steel circular shafts placed between the hole of two steel connectors. The compressive load of the column end was applied by a 2000 kN hydraulic jack. The cyclic load of the beam tips was applied by two electro-hydraulic servo actuators. According to the Chinese code [16], the seismic loading scheme consisted of two phases, namely the load-controlled and displacement-controlled phases. At the beginning of the test, the specimens were under reverse cyclic loading with load control, in which only one cycle of each load level was applied. When the specimen experienced cracking in the joint core or the longitudinal reinforcements in the beam reached their yield strain, the process was switched to displacement control. The corresponding displacement of the beam tip is defined as Δy. During the displacement-controlled phase, three cycles were applied for each displacement level, and the displacement amplitude was Δy. The test was terminated when the load-carrying capacity of specimens dropped to less than 85% of the maximum load or eventually failed. For interior UHPFRC beam-column joint specimens, the left and right beam tips are subjected to reverse loading simultaneously, with an equal loading rate.
The instrumentation was designed to monitor the overall specimen response and load resistance mechanism in the beam, column, and joint. The vertical load and displacement of the beam tip were measured by load and displacement sensors. The strains in the longitudinal reinforcement bar and stirrups were monitored by strain gauges. The UHPFRC strain in the joint regions was measured by gauges attached to surfaces of these regions. The shear distortions of joints were measured by two displacement sensors installed in the joint regions. The joint shear deformation angle was calculated by [17]:
in which γ is average joint shear deformation angle; a and b are the horizontal and vertical distances between the end points of the diagonal, respectively; and (Δ1 + Δ2) and (Δ3 + Δ4) are the changes in diagonal lengths.
3. Results and Discussion
3.1. Cracking Patterns
The failure modes of the nine tested specimens under reverse cyclic loading were found to be similar. Firstly, a flexural crack appeared in the beam adjacent to the joint region; then, diagonal cracks appeared in the joint core; finally, shear failure occurred in the joint core. The failure processes consisted of four stages: initial crack, penetrating crack, ultimate carrying capacity, and failure stage.
At the beginning of the first stage, several flexural cracks appeared in the beam. When the cyclic load reached 50% to 75% of the maximum peak load, the first diagonal crack with a small width and length appeared in the diagonal direction of the joint regions. The UHPFRC strains in the joint core were 282 × 10−6~396 × 10−6 at the initial crack moment. In the reverse direction loading phase, a diagonal crack was observed along another diagonal. Compared to reinforced high-strength and NC beam-column joints, reinforced UHPFRC beam-column joints exhibit a higher initial cracking strength. Average shear stress value (Vjcr/(bjhj)) of UHPFPC joint is 3.84 MPa when cracks appear in the joint area. The average crack shear stress value of total 22 NC joints from literature [5,18,19] is 2.60, which is 32.3% smaller than that of UHPFPC joint. This may be explained by the fact that UHPFRC has a higher tensile strength and ultimate tensile strain than high-strength concrete and NC without steel fiber. The tests demonstrated that the stirrup strains in the joint core were small, indicating that its function during the stage was smaller, which means that the joint shear force was primarily resisted by UHPFRC. The initial crack shear strengths of all of the same joint types were similar, indicating that the initial crack shear strength of the joint depends primarily on the UHPFRC tensile strength, rather than the stirrups in the joint core.
Following cracking, with an increase in displacement and cycle times, the initial crack along the diagonal direction continued to elongate. A number of small cracks were observed along two diagonal directions of the joint core with an increase in loading, which divided the UHPFRC joint core into several diamond-shaped sections. The width of the two main diagonal cracks in the orthogonal directions continued to increase, with the largest crack reaching a 0.3 mm to 0.5 mm width. The two main diagonal cracks propagated towards the lower and upper corners of the joint and eventually passed through the entire joint regions, and this stage is referred to as “penetrating crack”.
With a further increase in displacement, the load-carrying capacity of the joint increased within a small range, up to the maximum load, and the specimens entered the third stage. During this stage, the joint cracks became unstable and propagated up and down into column. The crack width increased significantly, and the shear deformation of the joint regions multiplied. Some steel fibers in the main cracks were pulled out, followed by some UHPFRC spalling at the intersection of the two orthogonal diagonal directions. The stirrup strains increased rapidly, and the stirrups in the joint core reached their yield before the load reached its maximum. Therefore, the function of stirrup is greater during the second stage than the first stage. During this stage, the UHPFRC and stirrups resisted diagonal tensile stresses, while the UHPFRC resisted diagonal compressive stresses.
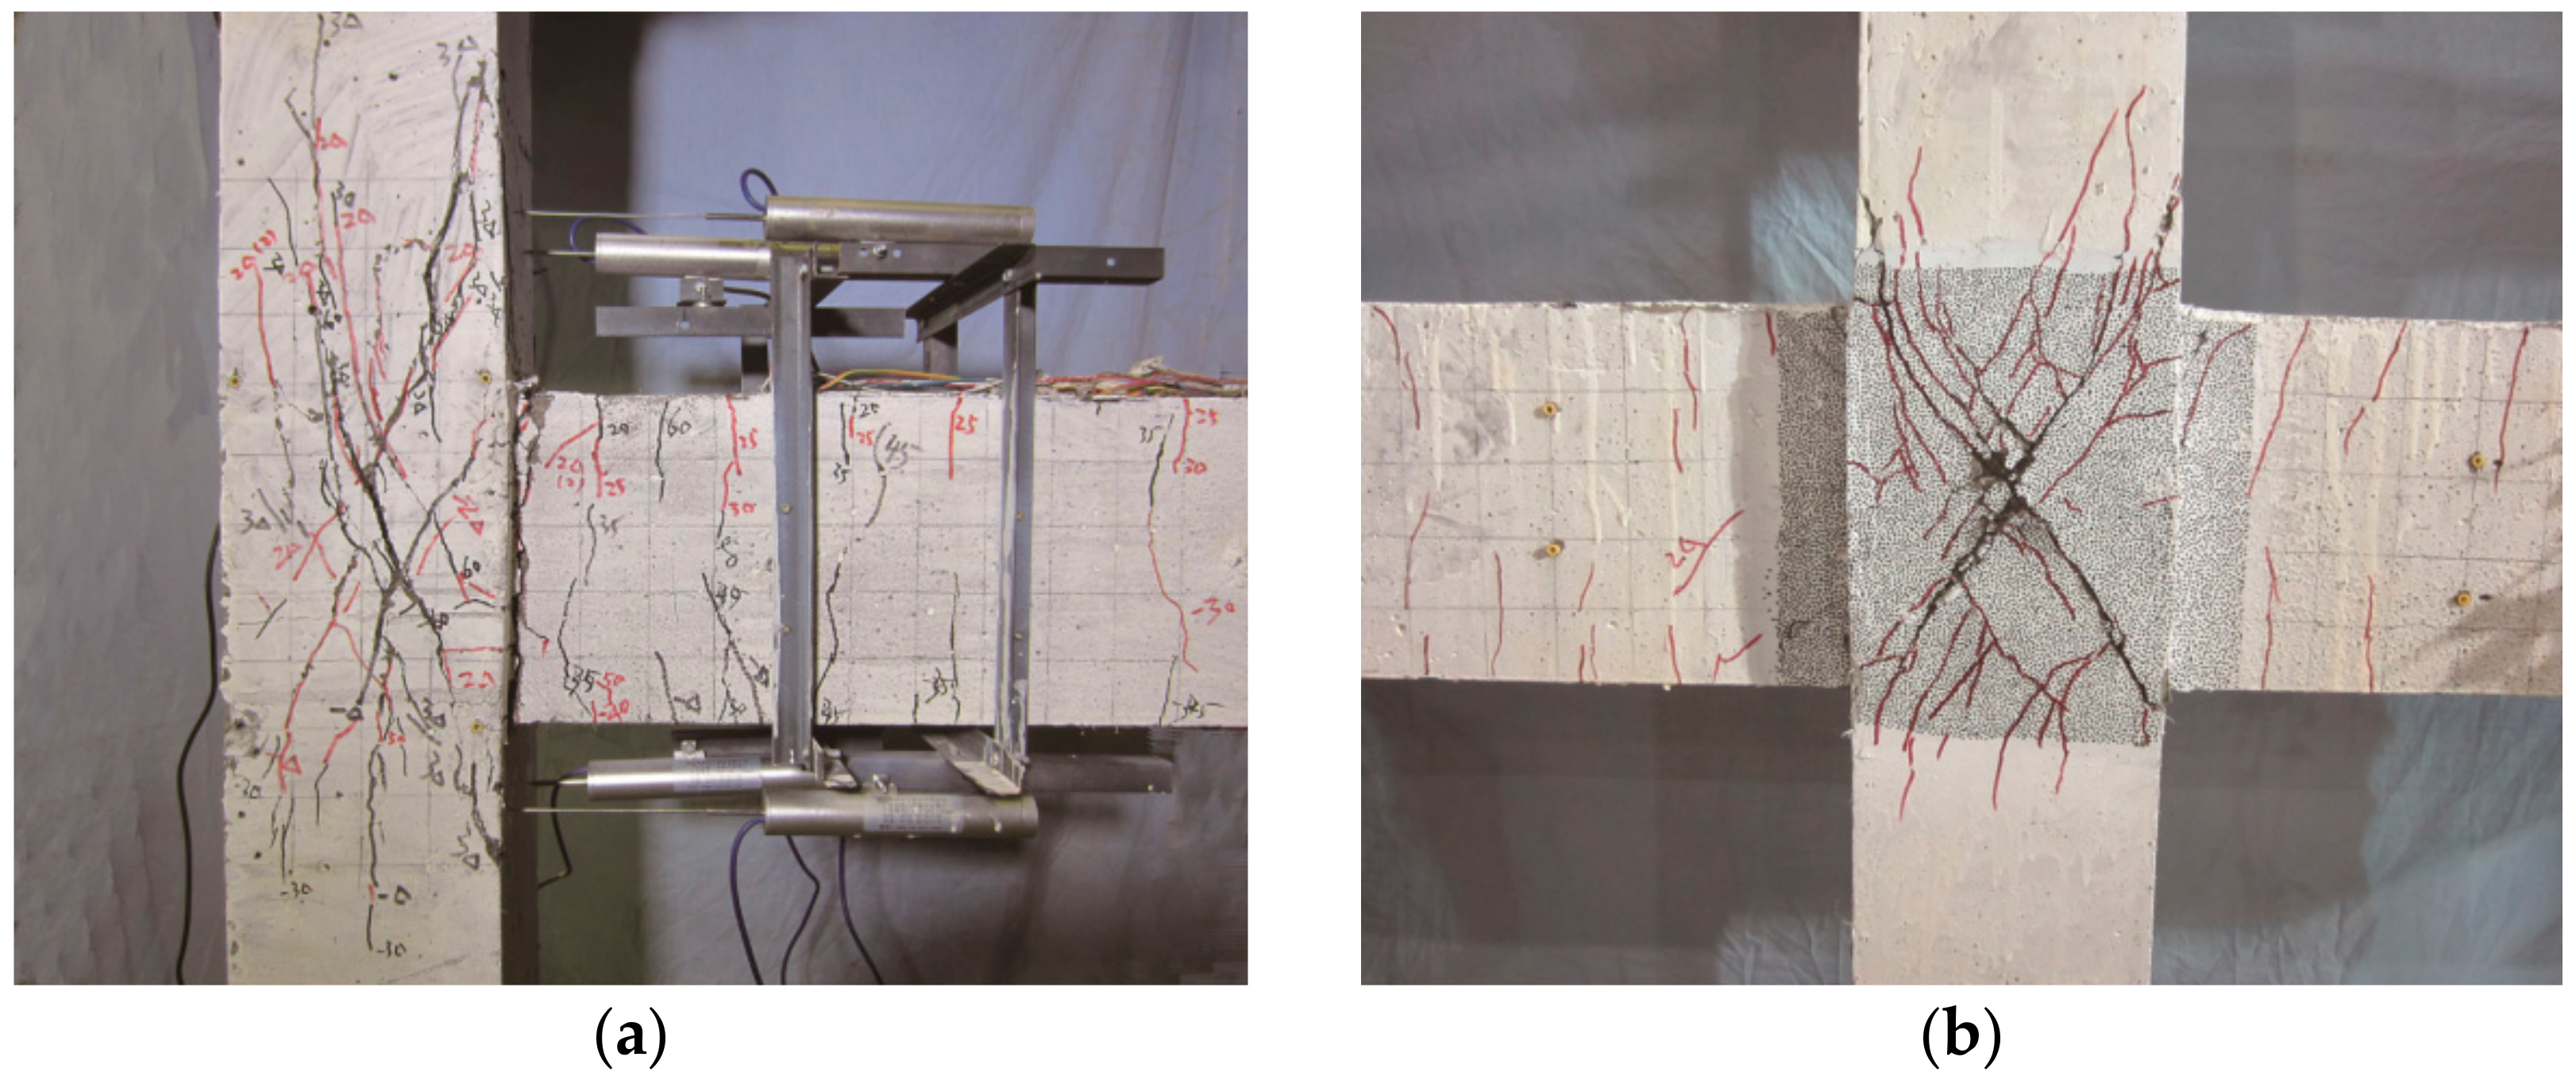
In the final stage, the cracks continued to propagate and were accompanied by joint bulging in both the in-plane and out-of-plane directions, while the shear deformation of the joint regions increased further. The bulging heights were approximately 2 to 5 mm in the in-plane direction. The joint bulging can be attributed to an increase in volumetric strain, resulting from a lack of confinement of the joint core. Finally, several steel fibers were pulled out from the matrix, and UHPFRC crushing or spallation may have occurred in main crack edges at the loading ends; however, the specimen remained as an integral whole, which differs from NC joints. The results indicated that axial compression load level, stirrup ratio in joint, and steel strength have little effect on final failure mode of UHPFRC joint core; the failure modes of UHPFRC joint specimens are illustrated in Figure 4.
It can be seen from Figure 4 that the inclination angle of cracks in the exterior joint is larger than that of the interior joint. The inclination angle of five exterior joints’ main cracks vary from 54°~71°, with a mean of 64.2°, and the inclination angle of main cracks in the interior joint is about 56°. This can be attributed to the different anchorages of longitudinal rebar in the beam between the exterior and interior joints. The straight anchored bar is commonly used in interior joints. In order to satisfy the anchorage requirements, a 90° hook was used in the beam longitudinal rebars of the exterior. During the early loading stage, the tension force in the beam longitudinal rebars was mainly balanced by bond stresses between the UHPFRC and horizontal segment of the hooked beam rebars. No stress occurred in the vertical segment of the hooked beam rebars, and the compressive stress of the UHPFRC from the vertical segment of the hooked rebars was zero. With increased loading, the bond deterioration of the horizontal segment rebars increased, as did the compressive stress of the UHPFRC from the vertical segment. The higher compressive stress from the vertical segment resulted in diagonal struts with larger inclination angles. A larger axial compression load leads to larger inclination angles of diagonal struts. The principal stress orientations were inconsistent with the diagonal of the joint; therefore, the crack inclination angles in the exterior joint were larger. Compared to the exterior joint, there was no compressive stress from the vertical segment, and the crack orientations were almost consistent with the diagonal of the joint. The UHPFRC column was subjected to combined axial compressive, moment, and shear forces, and the crack angles were greater than 60 degrees at the joint to the column.
3.2. Load Deflection Behavior of UHPFRC Joints
According the Chinese code for the seismic design of buildings, the shear force (Vj) of a joint can be expressed as [20]:
in which is the total end bending moment of the beam-adjoining joint core, , particularly for exterior joints, and ; Hc is the total column depth; hb is the total beam depth; hb0 is the effective beam depth; and is the distance from the resultant force center of the compressive reinforcement to the compressive edge.
The shear deformation angle (γ) of joints can be calculated according to Equation (1). Figure 5 illustrates the shear force (Vj)-deformation angle (γ) hysteretic loops and skeleton curves of the eight specimens, except for specimen EJ-1 with a smaller shear deformation angle. The Vj-γ hysteresis loops of the UHPFRC beam-column joint exhibit the following characteristics:
- (1)
- During the load control stage, little shear deformation occurred at the joint, and the slopes of the loading and unloading curves in the hysteresis loops were basically overlapping prior to joint cracking.
- (2)
- During the displacement control stage, in the 1Δy displacement stage, the shear deformation angle of the joint was very small, and strength degradation was not observed. During the 2Δy stage, the slope of the hysteresis loops began to decline; however, the decline rate was small. The maximum shear carrying capacities of eight specimens were reached in the first 2Δy cycle. During the second and third cycles of the 2Δy displacement, strength and stiffness degradation of specimens was observed.
- (3)
- The shear angles of specimens EJ-1 and EJ-4 were relatively small, which may be explained by the fact that more obvious beam failure was observed for specimens EJ-1 and EJ-4 than other joint specimens. For other specimens, the shear deformation angles of joints became evident in the first 3Δy cycle, but the shear strengths decreased only slightly. This indicates that the deformation and toughness of the UHPFRC beam-column joint were effective. As the cycle times increased, the shear deformation angles of the specimens continued to increase, and the strengths began to decrease until failure. Because of the steel fiber, the UHPFRC has a higher toughness than NC; the ultimate shear deformation angles of UHPFRC joint are considerably larger than that at peak shear load. The shear deformation angles ratio between ultimate state and peak shear load range from 1.45 to 8.56, and the average value is 5.79. This indicates that UHPFRC beam-column joints have good deformation capacity.
- (4)
- From the comparisons of specimens EJ-2 and EJ-4, and specimens EJ-3 and EJ-5 with same beam reinforcement load bearing capacity, it can be seen that the use of HRB600 grade high-strength steel bars with relatively high yield strain and low elastic modulus can improve ductility and strength degradation of UHPFRC joints.
For better examination on the effect of test parameters, the envelope curves of hysteretic loops of the same kind of joint are plotted in a single graph, as shown in Figure 6. It can be seen from Figure 6 that an increase in the axial compression load can improve the shear carrying capacity of specimens. This is because the increased column compression extends the compression zone, making the sectional area of the UHPFRC diagonal strut resist the compression increase. Moreover, appropriate compression stresses can improve the initial crack strength of UHPFRC and cause cracks to reclose. Therefore, the favorable effects of the axial compression load level on the shear strength should be reasonably considered. When it exceeds a certain range, any increase in the column compression load will extend the compression zone further along the joint boundaries. As a result, the inclination of the diagonal compression strut will decrease, as will its contribution in resisting the shear force [21].
The maximum shear strengths for specimens J-1 and J-3 were similar, but the shear bearing capacity of J-4 was reduced by 7.5% compared to J-2, the main reason being that the UHPFRC strength of specimen J-4 was lower than that of specimen J-2. Kim et al. [22] and Tran et al. [23] investigated the influence factors for the shear behavior of RC beam-column joints, and the results demonstrated that the concrete compressive strength was the main governing parameter for the joint shear strength. Furthermore, the shear bearing capacity of the UHPFRC joint was mainly dependent on the UHPFRC strength as well. However, with fewer stirrups configured in the joint core, the stirrups yielded before the maximum shear strength. The shear force in the joint was mainly carried by the UHPFRC, rather than the stirrup, at the peak shear force moment.
The joint type is another factor affecting the shear carrying capacity of beam-column joints. It can be seen from the figure that the shear strength of the interior joints was higher than that of the exterior joints, which can be attributed to changes in the UHPFRC diagonal strut. Because a vertical anchoring portion of the beam bar was present in the joint, the diagonal compression strut in the exterior joints had a smaller cross-section and larger inclination angle than that of the interior joints. In this research, the shear strength ratio of exterior to interior joints is approximately 80%, and similar behavior has been observed in normal and high-strength concrete beam-column joints [21,24,25]. A similar result for NC joints was reported by other researchers, in which the shear strengths of exterior joints are approximately 80~90% of those of interior joints [24].
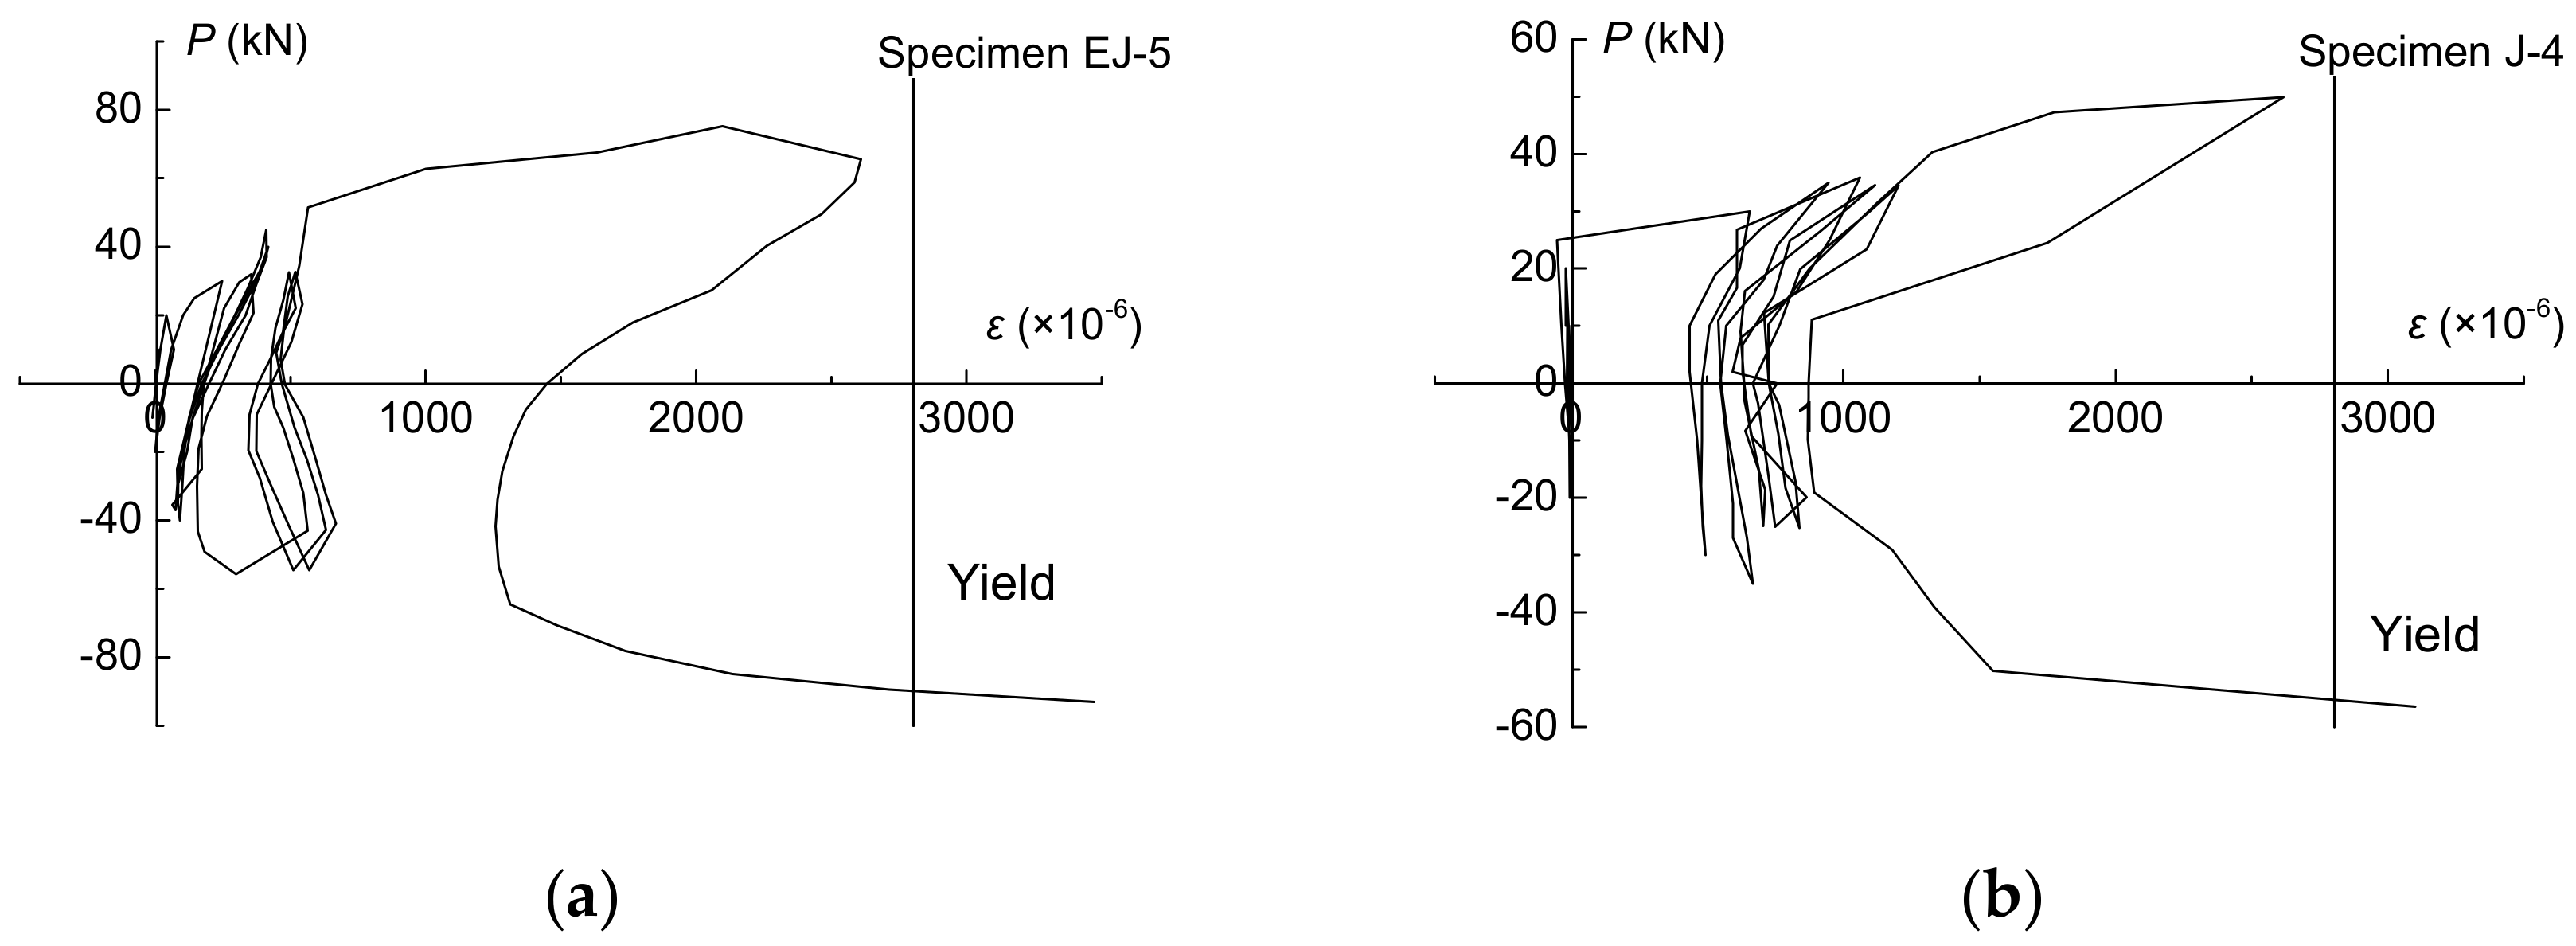
Figure 7 illustrates the typical curve of the stirrup strain versus beam tip load. The figure indicates that, prior to UHPFRC cracking in the joint regions, the stirrup strains of were small, generally less than 800 × 10−6. The stirrup strains can be restored during unloading. Following cracking, the stirrup strains in the joint core increased rapidly and maintained residual deformation when unloading. During the first cycle of 2Δy, the stirrup strains in the joint core rapidly increased to 2100 × 10−6 to 2600 × 10−6, indicating that the stirrup was close to yield, and the strains could recover partially after unloading. In the reverse direction loading, the stirrup yielded when the load approached the peak. The results indicate that the UHPFRC exhibited a higher deformation capacity under tensile stress owing to the use of steel fiber, which can enhance ductility and improve the deformation capacity of beam-column joints.
When the load neared the peak load, the stirrup in the joint core yielded owing to the low stirrup ratio, so the effect of resisting the stirrup shear force in the joint core was fully utilized. Furthermore, with the stirrup restraint effect in the joint core, shear cracks in the joint appeared late, and the shear carrying capacities of the joints were improved. However, when the stirrup ratio exceeds its upper limit value, most stirrups do not yield when UHPFRC crushing occurs in the joint core, and the effect of resisting the shear cannot be fully achieved, which would result in a higher value of the calculated shear carrying capacity. Owing to the limited number of specimens in the test, further research should be conducted, aimed at determining the upper and lower limitations of the stirrup ratio suitable for UHPFRC beam-column joints.
4. Calculation Method of Shear Carrying Capacity of UHPFRC Beam-Column Joint
4.1. Shear Resistance Mechanism of UHPFRC Beam-Column Joint
As a critical element in RC frame structures, beam-column joints in complicated stress conditions play the important role of transferring forces, including the bending moment, shear force, and axial force. Orthogonal diagonal compressive and tensile stresses exist along the diagonal direction of the joint core panel in the joint when they carry horizontal and vertical compression forces that are transferred from the beam as well as column. The diagonal compressive stress is resisted by UHPFRC diagonal strut in joint core, and the horizontal component force of the diagonal compression force is the horizontal shear strength of the joints. Therefore, the mechanical model can be simplified as a diagonal strut, as illustrated in Figure 8b. Unlike NC crushing under compressive load, the compression failure mode of UHPFRC is usually cracked in the compressive stress direction and bulges in the other direction because of the existence of fiber, so diagonal strut UHPFRC never crushes, and contributes to a large proportion of the shear carrying capacity of joints, even in the failure stage. The reinforced stresses are very small before joint cracking, and the diagonal compressive stress and tensile stress are mainly resisted by the UHPFRC in the joint core. When the diagonal tensile stress exceeds the tensile strength of UHPFRC, an initial crack is formed. The higher tensile strength and peak tensile strain of UHPFRC cause beam-column joints to exhibit higher initial cracking strength. Following cracking, the diagonal tensile stress is mainly resisted by the stirrup and steel fibers in the UHPFRC fracture surface, as illustrated in Figure 8c,d. The stirrup, steel fiber, and longitudinal steel bar across joints’ core form a truss. The stirrup and steel fibers constitute the horizontal tie, and vertical reinforced bars (if they exist) and steel fibers constitute the vertical tie. With a further increase in the displacement and cycle, the joint diagonal strut mechanism gradually undergoes degradation in carrying the diagonal compressive stress, owing to UHPFRC cracking. Therefore, the horizontal shear force is resisted by the UHPFRC friction resistance and the dowel force of the steel bars and steel fibers. However, the aggregate interlock forces of UHPFRC joint are smaller than those of RC joint, because there is no coarse aggregate in UHPFRC.
Based on the above analysis, the shear carrying capacity of the examined joint is the summation of the shear resistance of the UHPFRC diagonal strut, fibers, and stirrup, the calculation model of which is illustrated in Figure 8. Thus, the shear carrying capacity expression can be defined in the form of Equation (3); that is,
in which is the shear carrying capacity of the UHPFRC joint, is the horizontal component force of the diagonal compression force resisted by the UHPFRC diagonal strut in the joint core, is the shear carrying capacity of the steel fibers, and is the shear carrying capacity of the stirrup.
4.2. Components of Shear Carrying Capacity
4.2.1. Shear Force Carried by UHPFRC in Joint Core
The shear carrying capacity of the UHPFRC in the joint core is dependent on the compressive strength of the UHPFRC diagonal strut, the value of which is the component force of the compressive strength of the UHPFRC diagonal strut in the horizontal direction. The inclination angle is ; that is, the angle between the diagonal compressive strut and horizontal direction is defined as
in which and are the distances between the compression and tensional longitudinal reinforcement centerline of zone in the beam and column, as illustrated in Figure 8a. However, for exterior joints, has a different definition, namely, the distance from the extreme longitudinal reinforcement axis in the column to the bar extension axis at the free end of the 90-degree hooked bar.
The effective area of diagonal strut can be computed using Equation (5); that is,
In the equation, is the diagonal strut width and can be approximately regarded as the width of joint section , which is the lesser value of , , and , in which and are the section widths of the beam and column, respectively, and is the height of the column section. Moreover, can be evaluated according to the equation , in which and are the compression zone heights in the beam and column, respectively. If the beam adjacent to the joint core does not continue to burden the compression force owing to the appearance of a conspicuous bending plastic hinge and severe UHPFRC spalling when the joint fails, is 0; if not, it can be considered as 1/5 of the beam section height in the calculation of . The determination of adopts the equation proposed by Paulay and Priestley [6], namely, , in which is the axial compressive load acting on the upper column, is the cubic compressive strength of UHPFRC, and and are the geometric dimensioning of the column section.
Because of the complicated tensile-compressive cyclic stress state, the diagonal compressive strength and corresponding compressive strain of the concrete in the diagonally cracked joint core panel are less than those of the concrete in the uniaxial compressive test; that is, the strength in the principal compressive direction is softened by the principal tension in the perpendicular direction [26], and UHPFRC exhibits characteristics of decreasing. This study adopts the softening coefficient to account for this phenomenon. Existing research has demonstrated that is associated with and the principal tension strain . Based on the experimental results, the softening coefficient can be approximated by Equation (6), as follows [27]:
The shear carrying capacity of UHPFRC can be calculated using Equation (7):
4.2.2. Shear Force Carried by Steel Fiber
The test results indicate that the majority of steel fibers bridging across the cracks constantly carry the diagonal tensile stress like the shear reinforcement, until the third stage of the failure process. Therefore, steel fibers can be regarded as dispersed reinforcement bars. Furthermore, owing to the fact that the length of steel fibers incorporated into UHPFRC is less than the critical length of fibers when they are broken, steel fibers are not broken, but rather pulled out from the UHPFRC matrix. The tensile capacity of the steel fibers is mainly dependent on the adhesion between the fibers and UHPFRC matrix, which can be expressed as:
In Equation (8), is the adhesive stress between the steel fiber and UHPFRC matrix; is the length-diameter ratio of the steel fiber; is the volume percentage of steel fiber to total UHPFRC volume; and is the area of crack interface.
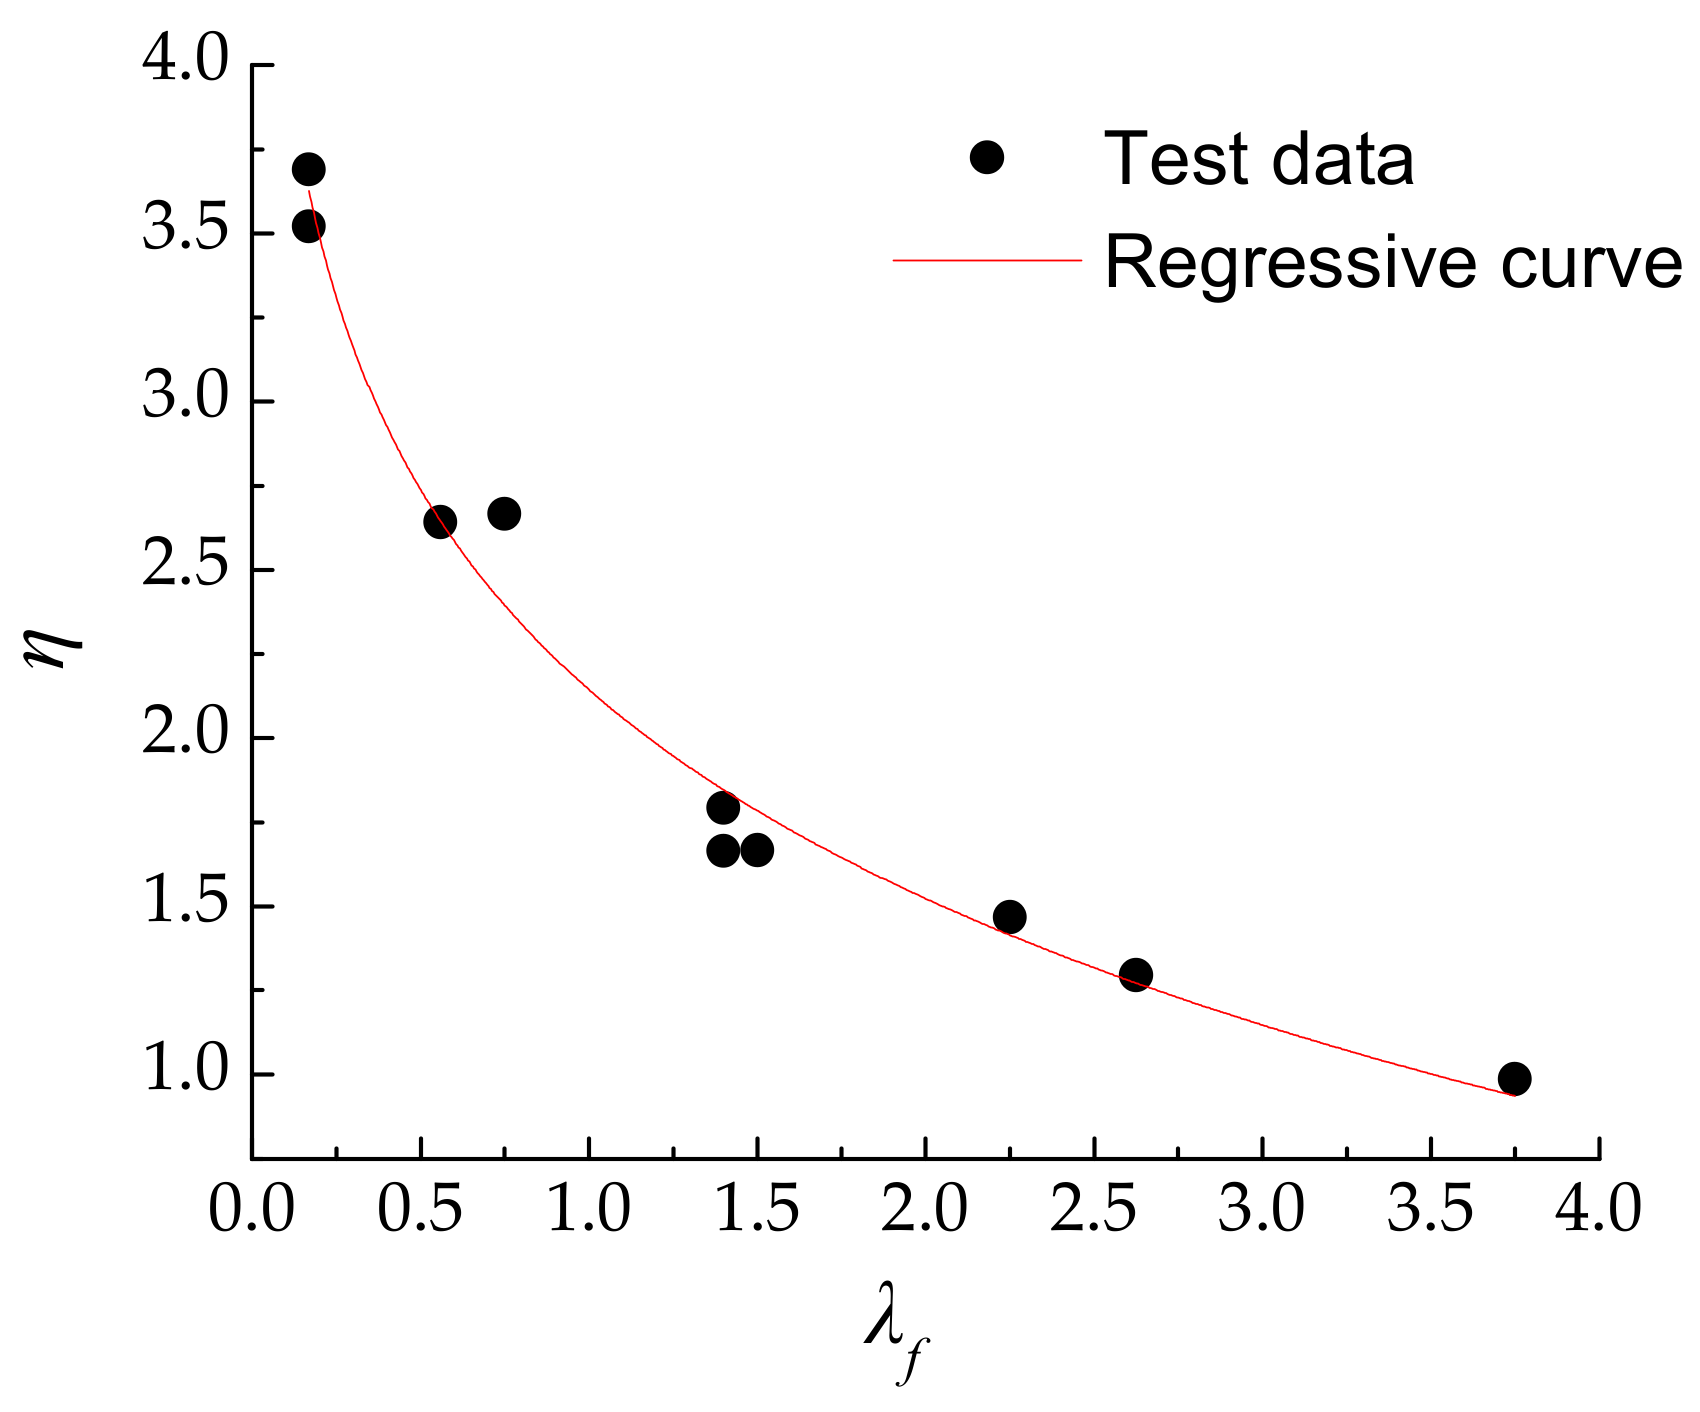
However, the positions of random fibers incorporated into UHPFRC are not only vertical to the crack interface, and the lengths embedded in the UHPFRC across cracks are not equal, resulting in fibers being more easily pulled out from the shorter end and the distribution of fibers in specimens not being symmetrical. These factors have adverse effects on and cause the actual value of to be less than the calculated value from Equation (8). Therefore, a coefficient is introduced to Equation (8) to account for the adverse effects of these factors, and can be expressed as
We define , with representing the characteristic coefficient of steel fibers and representing the pulled-out total effective coefficient of steel fibers. The relation of versus (as shown in Figure 9) following cracking is acquired through regressive analysis on the experimental results of UHPFRC conducted in [28,29]. When the length-diameter ratio varies from 56 to 75 and the volume percentage of steel fiber varies from 0% to 5%, then
The main crack interface is approximated as the diagonal of joints, so the crack interface area , and . Hence, the horizontal shear carrying capacity of steel fiber can be calculated by the expression
4.2.3. Shear Force Carried by Stirrup in Joint Core
In general, the effects of stirrups are asynchronous owing to the different crack positions and widths in the joint, and not all stirrups yield completely when the joint fails. Hence, the factor is incorporated into the calculation for the contribution of stirrups in UHPFRC beam-column joints. Therefore, the shear carrying capacity of stirrups can be expressed as
In Equation (12), is the stirrup yield strength; is the sum of each section area of the stirrups in the same vertical joint section; s is the spacing of stirrups; is the effective height of the beam section adjacent to the joint; is the minimum distance from the compressive longitudinal reinforcement axis to the extreme section edge in beam; and is the non-uniformity coefficient of the stirrups, which varies between 0.85 and 1. When the stirrup characteristic value (, is volume stirrup rate of joint, is the strength of stirrup, and is the strength of RPC) is greater than or equal to 0.25, should be used; when the stirrup characteristic value less than or equal to 0.1, should be used; for all other cases, should be computed with linear interpolation method according to the stirrup characteristic value of joint.
Combining Equations (3), (7), (11) and (12), the shear carrying capacity Vj of the UHPFRC beam-column joints can be expressed as
In order to account for the influence of joint type, factor is introduced into Equation (13), which can be expressed as
in which is 0.8 and 1 for exterior and interior joints, respectively.
4.3. Verification of Proposed Calculation Formula for Shear Carrying Capacity
In order to verify the proposed formula, the shear carrying capacities of 13 existing specimens (including nine UHPFRC beam-column joints in this paper and four interior steel fiber reinforced high-strength concrete beam-column joints described in the literature [30]) were calculated using Equation (14) and compared with the experimental values calculated using Equation (2). The comparison results of the 13 specimens are displayed in Table 4. All selected specimens were subjected to cyclic loading on the beam tip, and their failure modes were mostly joint shear failure. It can be seen from Table 4 that the calculated shear carrying capacities of both the exterior and interior reinforcement beam-column joints are in close agreement with the experimental values, with the exception of specimen EJ-1. The ratio of the mean calculated values to experimental values is 1.018, while the variance and coefficient of variation are 0.106 and 0.105, respectively. The experimental value of specimen EJ-1 is approximately 25% smaller than the calculated value, which can be explained by the fact that more serious flexural failure at the beam end was observed for specimen EJ-1 than for other specimens.
5. Conclusions
- (1)
- A reinforced UHPFRC beam-column joint has a higher initial cracking strength and shear carrying capacity. Furthermore, the integrity of UHPFRC joint specimens is superior to NC joints when they eventually fail.
- (2)
- A suitable configuration of the transverse closed stirrup can enhance the shear carrying capacity owing to restraining occurrences and development of cracks. The shear bearing capacity of exterior joints is smaller than that of interior joints with the same sectional area and reinforcement. The shear strengths of exterior joints are approximately 80~90% of those of interior joints.
- (3)
- The use of HRB600 grade high-strength steel bars with relatively high yield strain and low elastic modulus can improve the ductility and strength degradation of UHPFRC joints.
- (4)
- The shear resistance mechanism of the reinforced UHPFRC beam-column joint consists of the diagonal strut and truss mechanisms. Steel fibers, such as the dispersive reinforcement bars, constitute the horizontal and vertical ties in the truss mechanism.
- (5)
- Based on test results, a formula (Equation (14)) was proposed, which can predict the shear bearing capacity of reinforced UHPFRC and steel fiber high-strength concrete joints. In the formula, the contribution of steel fibers to shear carrying capacity of joints was determined based on the test bond strength between steel fibers and UHPFRC matrix.
Author Contributions
D.W. and Y.J. conceived and designed the experiments; D.W. performed the experiments; D.W. and W.Z. analyzed the data; H.S. contributed reagents/materials/analysis tools; D.W. wrote the paper.
Funding
The work described in this paper was supported by the National Natural Science Foundation of China (Project No. 51378095) and the Science and Technology Development Plan of Jilin Province (Project No. 20180101064JC).
Conflicts of Interest
The authors declare that they have no conflict of interest regarding the publication of this paper.
References
- Hanson, N.W.; Conner, H.W. Seismic resistance of reinforced concrete beam-column joints. J. Struct. Div. Am. Soc. Civ. Eng. 1967, 93, 533–559. [Google Scholar]
- Tang, J.; Hu, C.; Yang, K.; Yan, Y. Seismic behaviour and shear strength of framed joint using steel-fiber reinforced concrete. J. Strut. Eng. 1992, 118, 341–358. [Google Scholar]
- Ganesan, N.; Indira, P.V.; Sabeena, M.V. Behaviour of hybrid fibre reinforced concrete beam–column joints under reverse cyclic loads. Mater. Des. 2014, 54, 686–693. [Google Scholar] [CrossRef]
- Filiatrault, A.; Ladicani, K.; Massicotte, B. Seismic performance of code-designed fiber reinforced concrete joints. ACI Mater. J. 1994, 91, 564–571. [Google Scholar]
- Liang, X.W.; Wang, Y.J.; Tao, Y.; Deng, M.K. Seismic performance of fiber-reinforced concrete interior beam-column joints. Eng. Strut. 2016, 126, 432–445. [Google Scholar] [CrossRef]
- Paulay, T.; Priestley, M.J.N. Seismic Design of Reinforced Concrete and Masonry Buildings; Wiley: New York, NY, USA, 1992. [Google Scholar]
- Hwang, S.J.; Lee, H.J. Analytical model for predicting shear strengths of exterior reinforced concrete beam-column joints for seismic resistance. ACI Struct. J. 2000, 96, 846–857. [Google Scholar]
- Hwang, S.J.; Lee, H.J. Strength prediction for discontinuity regions by softened strut-and-tie model. J. Struct. Eng. 2002, 128, 1519–1526. [Google Scholar] [CrossRef]
- Attaalla, S.A. General analytical model for nominal shear stress of type 2 normal- and high-strength concrete beam-column joints. ACI Mater. J. 2004, 101, 65–75. [Google Scholar]
- Shayanfar, J.; Akbarzadeh Bengar, H.; Niroomandi, A. A proposed model for predicting nonlinear behavior of rc joints under seismic loads. Mater. Des. 2016, 95, 563–579. [Google Scholar] [CrossRef]
- Richard, P.; Cheyrezy, M. Reactive powder concretes with high ductility and 200–800 MPa compressive strength. ACI Spec. Publ. 1994, 114, 507–518. [Google Scholar]
- Al-Tikrite, A.; Hadi, M.N.S. Mechanical properties of reactive powder concrete containing industrial and waste steel fibres at different ratios under compression. Constr. Build. Mater. 2017, 154, 1024–1034. [Google Scholar] [CrossRef]
- Habel, K.; Viviani, M.; Denarié, E.; Brühwiler, E. Development of the mechanical properties of an ultra-high performance fiber reinforced concrete (UHPFRC). Cem. Concr. Res. 2006, 36, 1362–1370. [Google Scholar] [CrossRef]
- Yang, I.-H.; Joh, C.; Lee, J.W.; Kim, B.-S. Torsional behavior of ultra-high performance concrete squared beams. Eng. Struct. 2013, 56, 372–383. [Google Scholar] [CrossRef]
- Shi, C.; Long, M.; Cao, C.; Long, G.; Lei, M. Mechanical property test and analytical method for reactive powder concrete columns under eccentric compression. KSCE J. Civ. Eng. 2016, 21, 1307–1318. [Google Scholar] [CrossRef]
- JGJ 101-96. Specificating of Testing Methods for Earthquake Resistant Building; China Building Industry Press: Beijing, China, 1997. [Google Scholar]
- Dang, C.-T.; Dinh, N.-H. Experimental study on structural performance of RC exterior beam-column joints retrofitted by steel jacketing and haunch element under cyclic loading simulating earthquake excitation. Adv. Civ. Eng. 2017, 2017, 1–11. [Google Scholar] [CrossRef]
- Zhao, H.T. Crack resistance of reinforced concrete beam-column joints. J. Build. Struct. 1990, 11, 38–48. [Google Scholar]
- Said, S.H.; Razak, H.A. Structural behavior of RC engineered cementitious composite (ECC) exterior beam–column joints under reversed cyclic loading. Constr. Build. Mater. 2016, 107, 226–234. [Google Scholar] [CrossRef]
- GB 50011-2010. Code for Seismic Design of Buildings; China Building Industry Press: Beijing, China, 2010. [Google Scholar]
- Alaee, P.; Li, B. High-strength concrete interior beam-column joints with high-yield-strength steel reinforcements. J. Struct. Eng. 2017, 143. [Google Scholar] [CrossRef]
- Kim, J.; Lafave, J.M. Key influence parameters for the joint shear behavior of reinforced concrete (RC) beam–column connections. Steel Constr. 2007, 29, 2523–2539. [Google Scholar]
- Tran, M.T. Influence factors for the shear strength of exterior and interior reinforced concrete beam-column joints. Procedia Eng. 2016, 142, 63–70. [Google Scholar] [CrossRef]
- Fujii, S.; Morita, S. Comparison between interior and exterior RC beam-column joint behavior. In ACI SP 123-6: Design of Beam-Column Joints for Seismic Resistance; American Concrete Institute: Farmington Hills, MI, USA, 1991; pp. 155–165. [Google Scholar]
- Alaee, P.; Li, B. High-strength concrete exterior beam-column joints with high-yield strength steel reinforcements. Eng. Struct. 2017, 145, 305–321. [Google Scholar] [CrossRef]
- Hsu, T.T.C.; Belarbi, A. Compression response of cracked reinforced concrete. J. Struct. Eng. 1993, 119, 3590–3610. [Google Scholar]
- Zhang, L.-X.; Hsu, T.T.C. Behavior and analysis of 100 MPa concrete membrane elements. J. Struct. Eng. 1998, 124, 24–34. [Google Scholar] [CrossRef]
- Yong, Y. Damage Constitutive Model of RPC under Uniaxial Tension and Compression Based on Weibull Distribution; Northeast Dianli University: Jilin, China, 2015. [Google Scholar]
- Yan, S. The Research on the Tensile Performance of the Ultra-High-Performance Concrete Reinforced by Grading-Fiber; Hunan University: Changsha, China, 2006. [Google Scholar]
- Gao, D.; Shi, K. Calculation method for bearing capacity of steel fiber reinforced high-strength concrete beam-column joints. J. Build. Struct. 2014, 35, 71–79. [Google Scholar]
Figure 1.
Sizes and details reinforcement of specimens.

Figure 2.
The typical stress-strain curves of HRB400 and HRB600 grade steel bars.

Figure 3.
Test setup: (a) exterior joint and (b) interior joint.

Figure 4.
Typical failure modes of exterior and interior joint specimens: (a) exterior UHPFRC joint, (b) interior UHPFRC joint
Figure 4.
Typical failure modes of exterior and interior joint specimens: (a) exterior UHPFRC joint, (b) interior UHPFRC joint

Figure 5.
Shear force versus shear deformation angle of joint cores: (a) specimen EJ-2; (b) specimen EJ-3; (c) specimen EJ-4; (d) specimen EJ-5; (e) specimen J-1; (f) specimen J-2; (g) specimen J-3; and (h) specimen J-4.
Figure 5.
Shear force versus shear deformation angle of joint cores: (a) specimen EJ-2; (b) specimen EJ-3; (c) specimen EJ-4; (d) specimen EJ-5; (e) specimen J-1; (f) specimen J-2; (g) specimen J-3; and (h) specimen J-4.
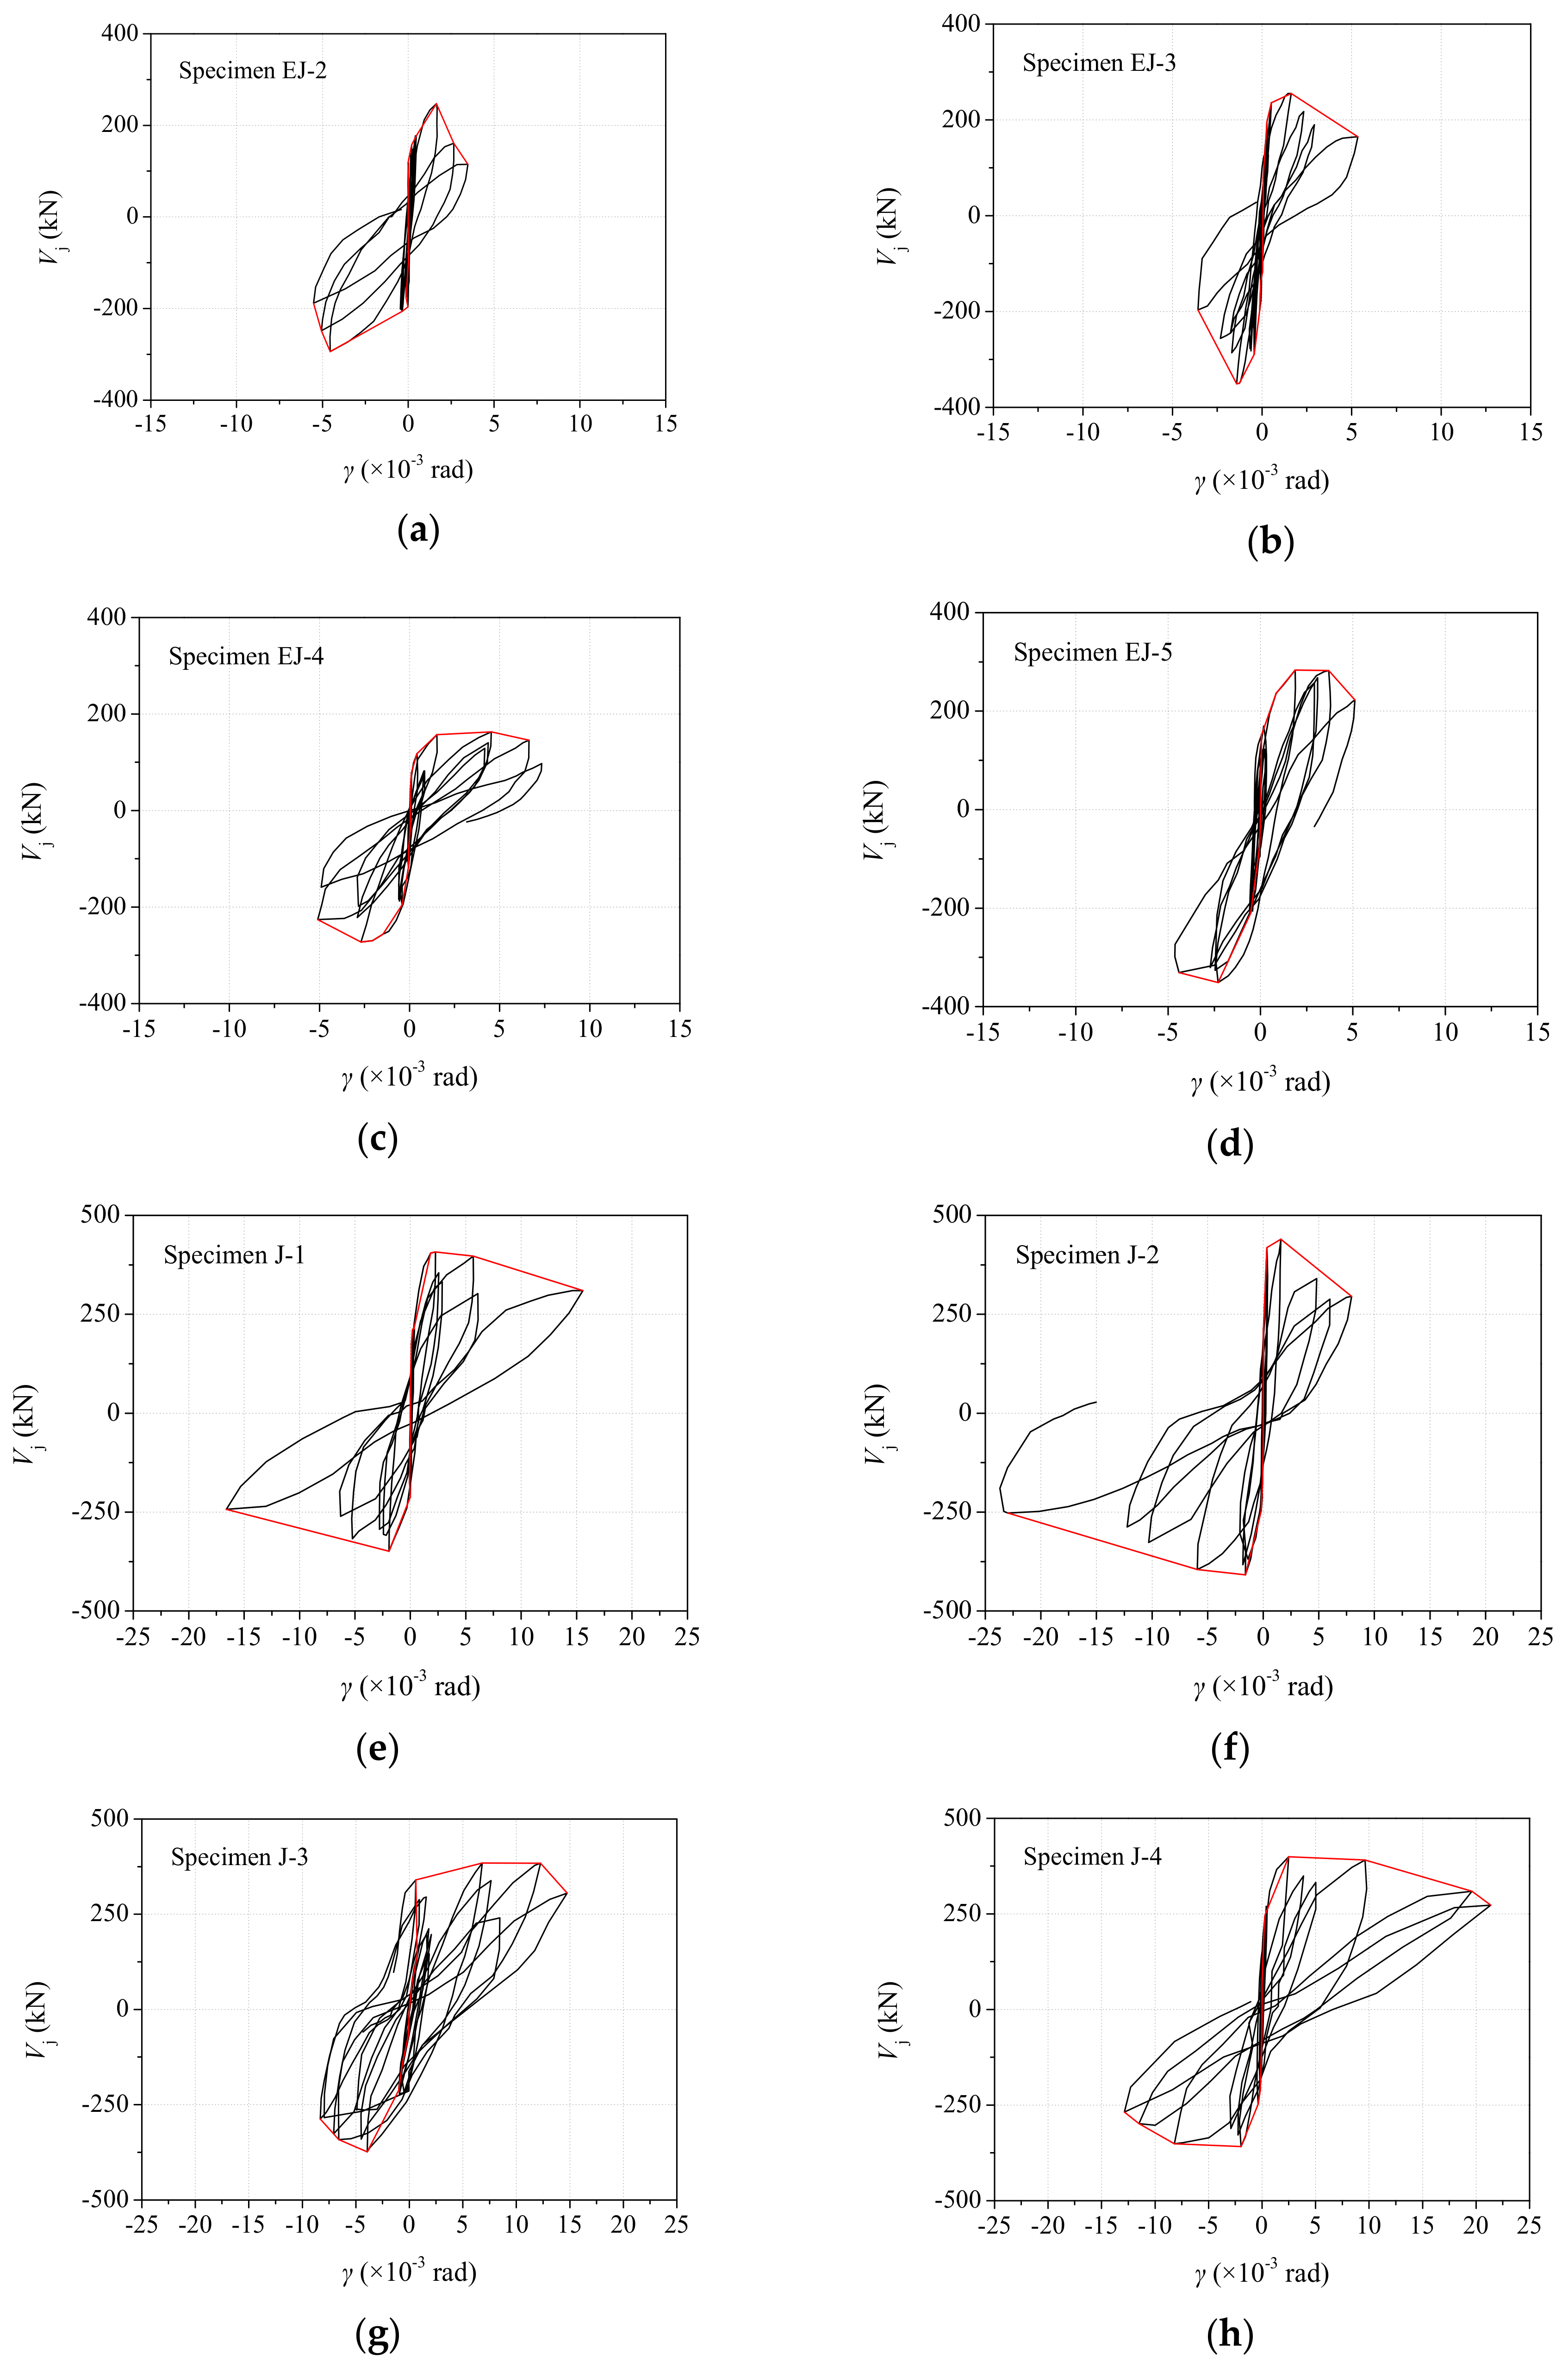
Figure 6.
Envelope curves of shear force versus shear deformation angle of joint cores: (a) exterior joint and (b) interior joint.
Figure 6.
Envelope curves of shear force versus shear deformation angle of joint cores: (a) exterior joint and (b) interior joint.
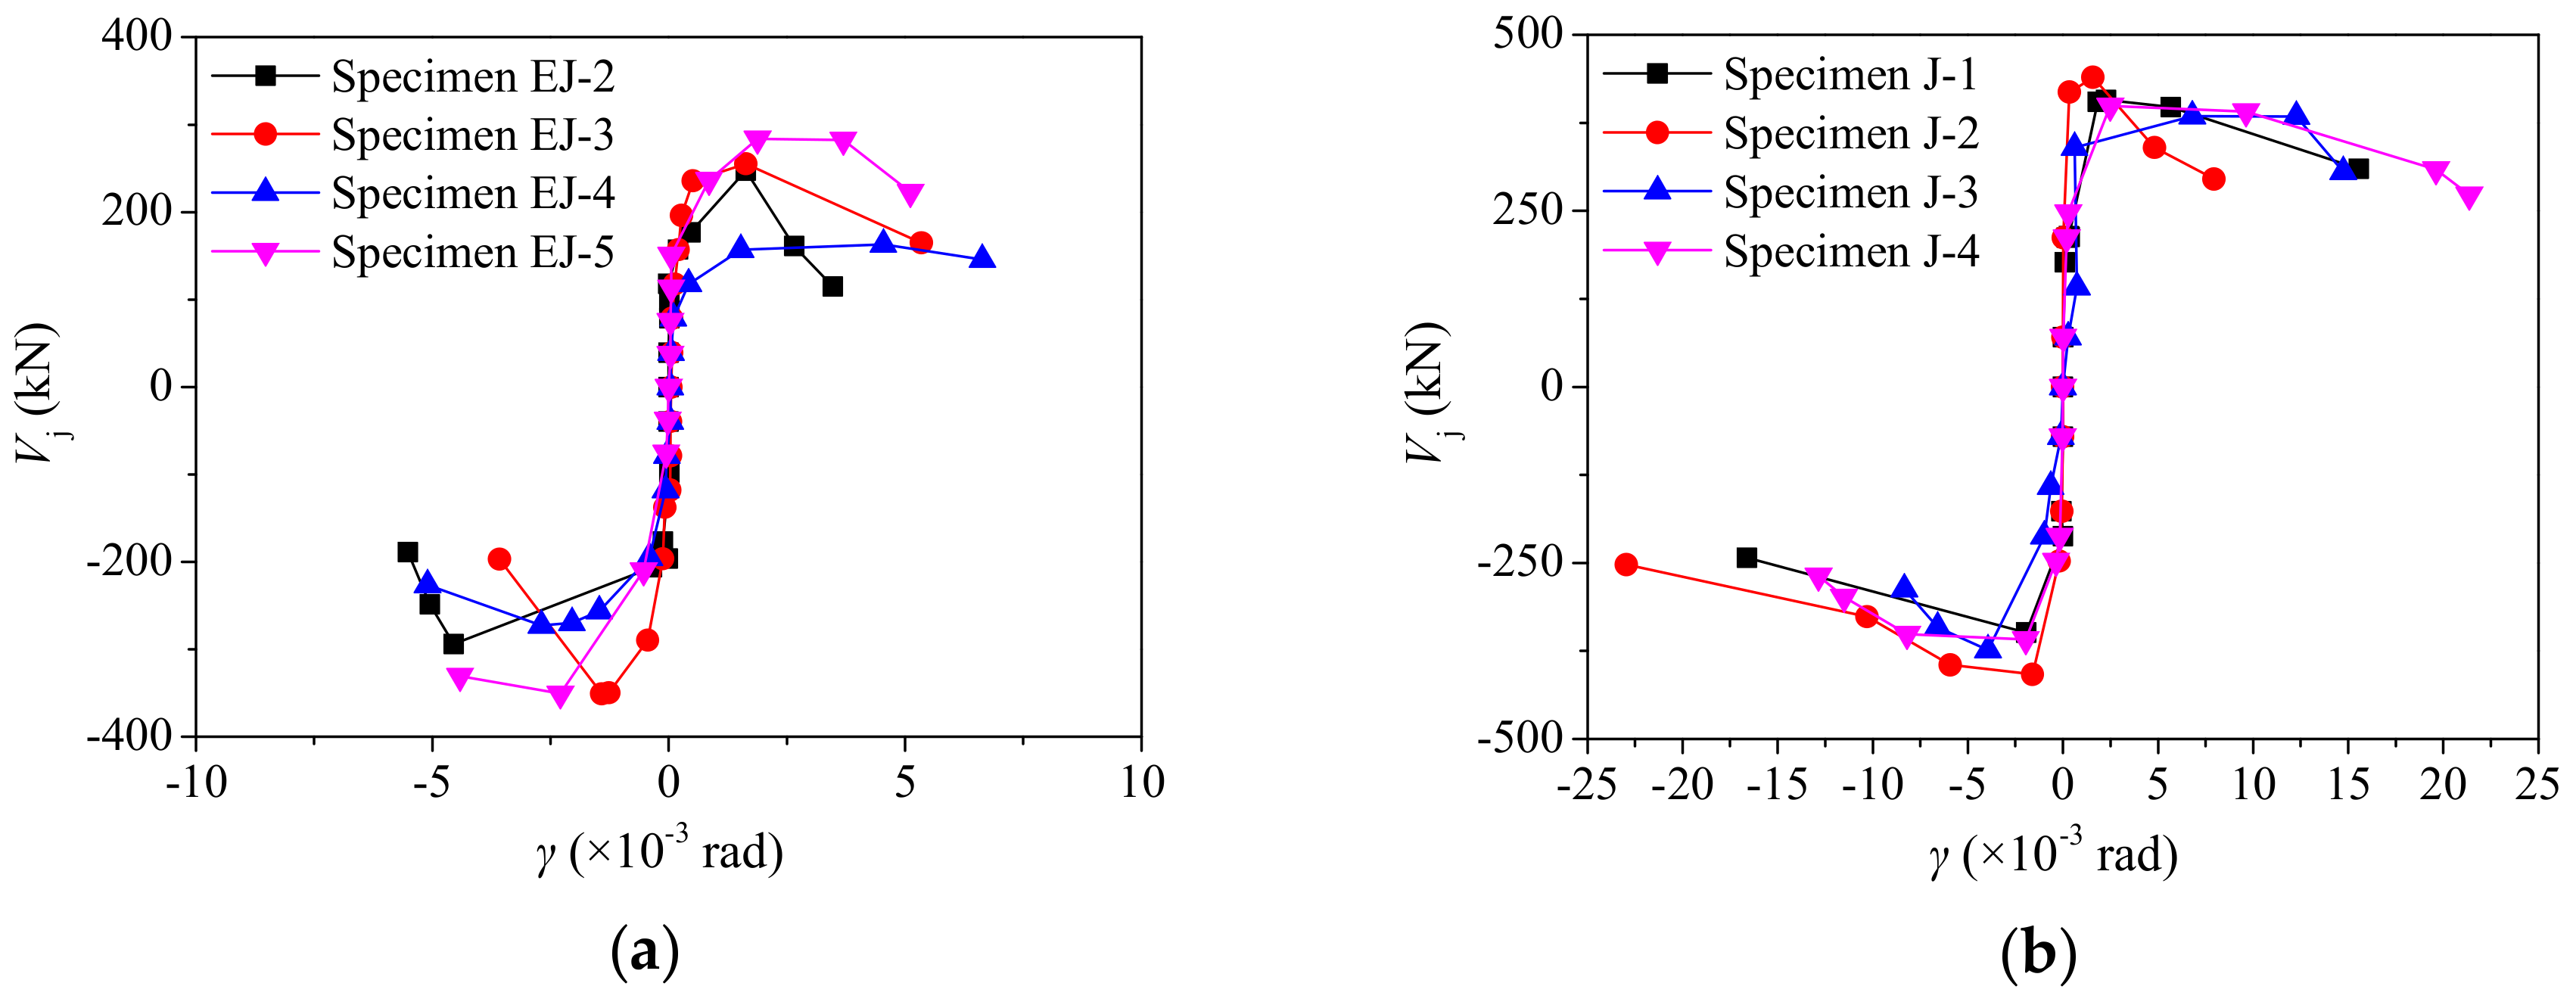
Figure 7.
Strain of stirrups in joint cores: (a) specimen EJ-5 and (b) specimen J-4.

Figure 8.
Calculation method of shear carrying capacity of UHPFRC beam-column joint: (a) external actions of joint, (b) UHPFRC, (c) steel fiber, and (d) stirrup.
Figure 8.
Calculation method of shear carrying capacity of UHPFRC beam-column joint: (a) external actions of joint, (b) UHPFRC, (c) steel fiber, and (d) stirrup.
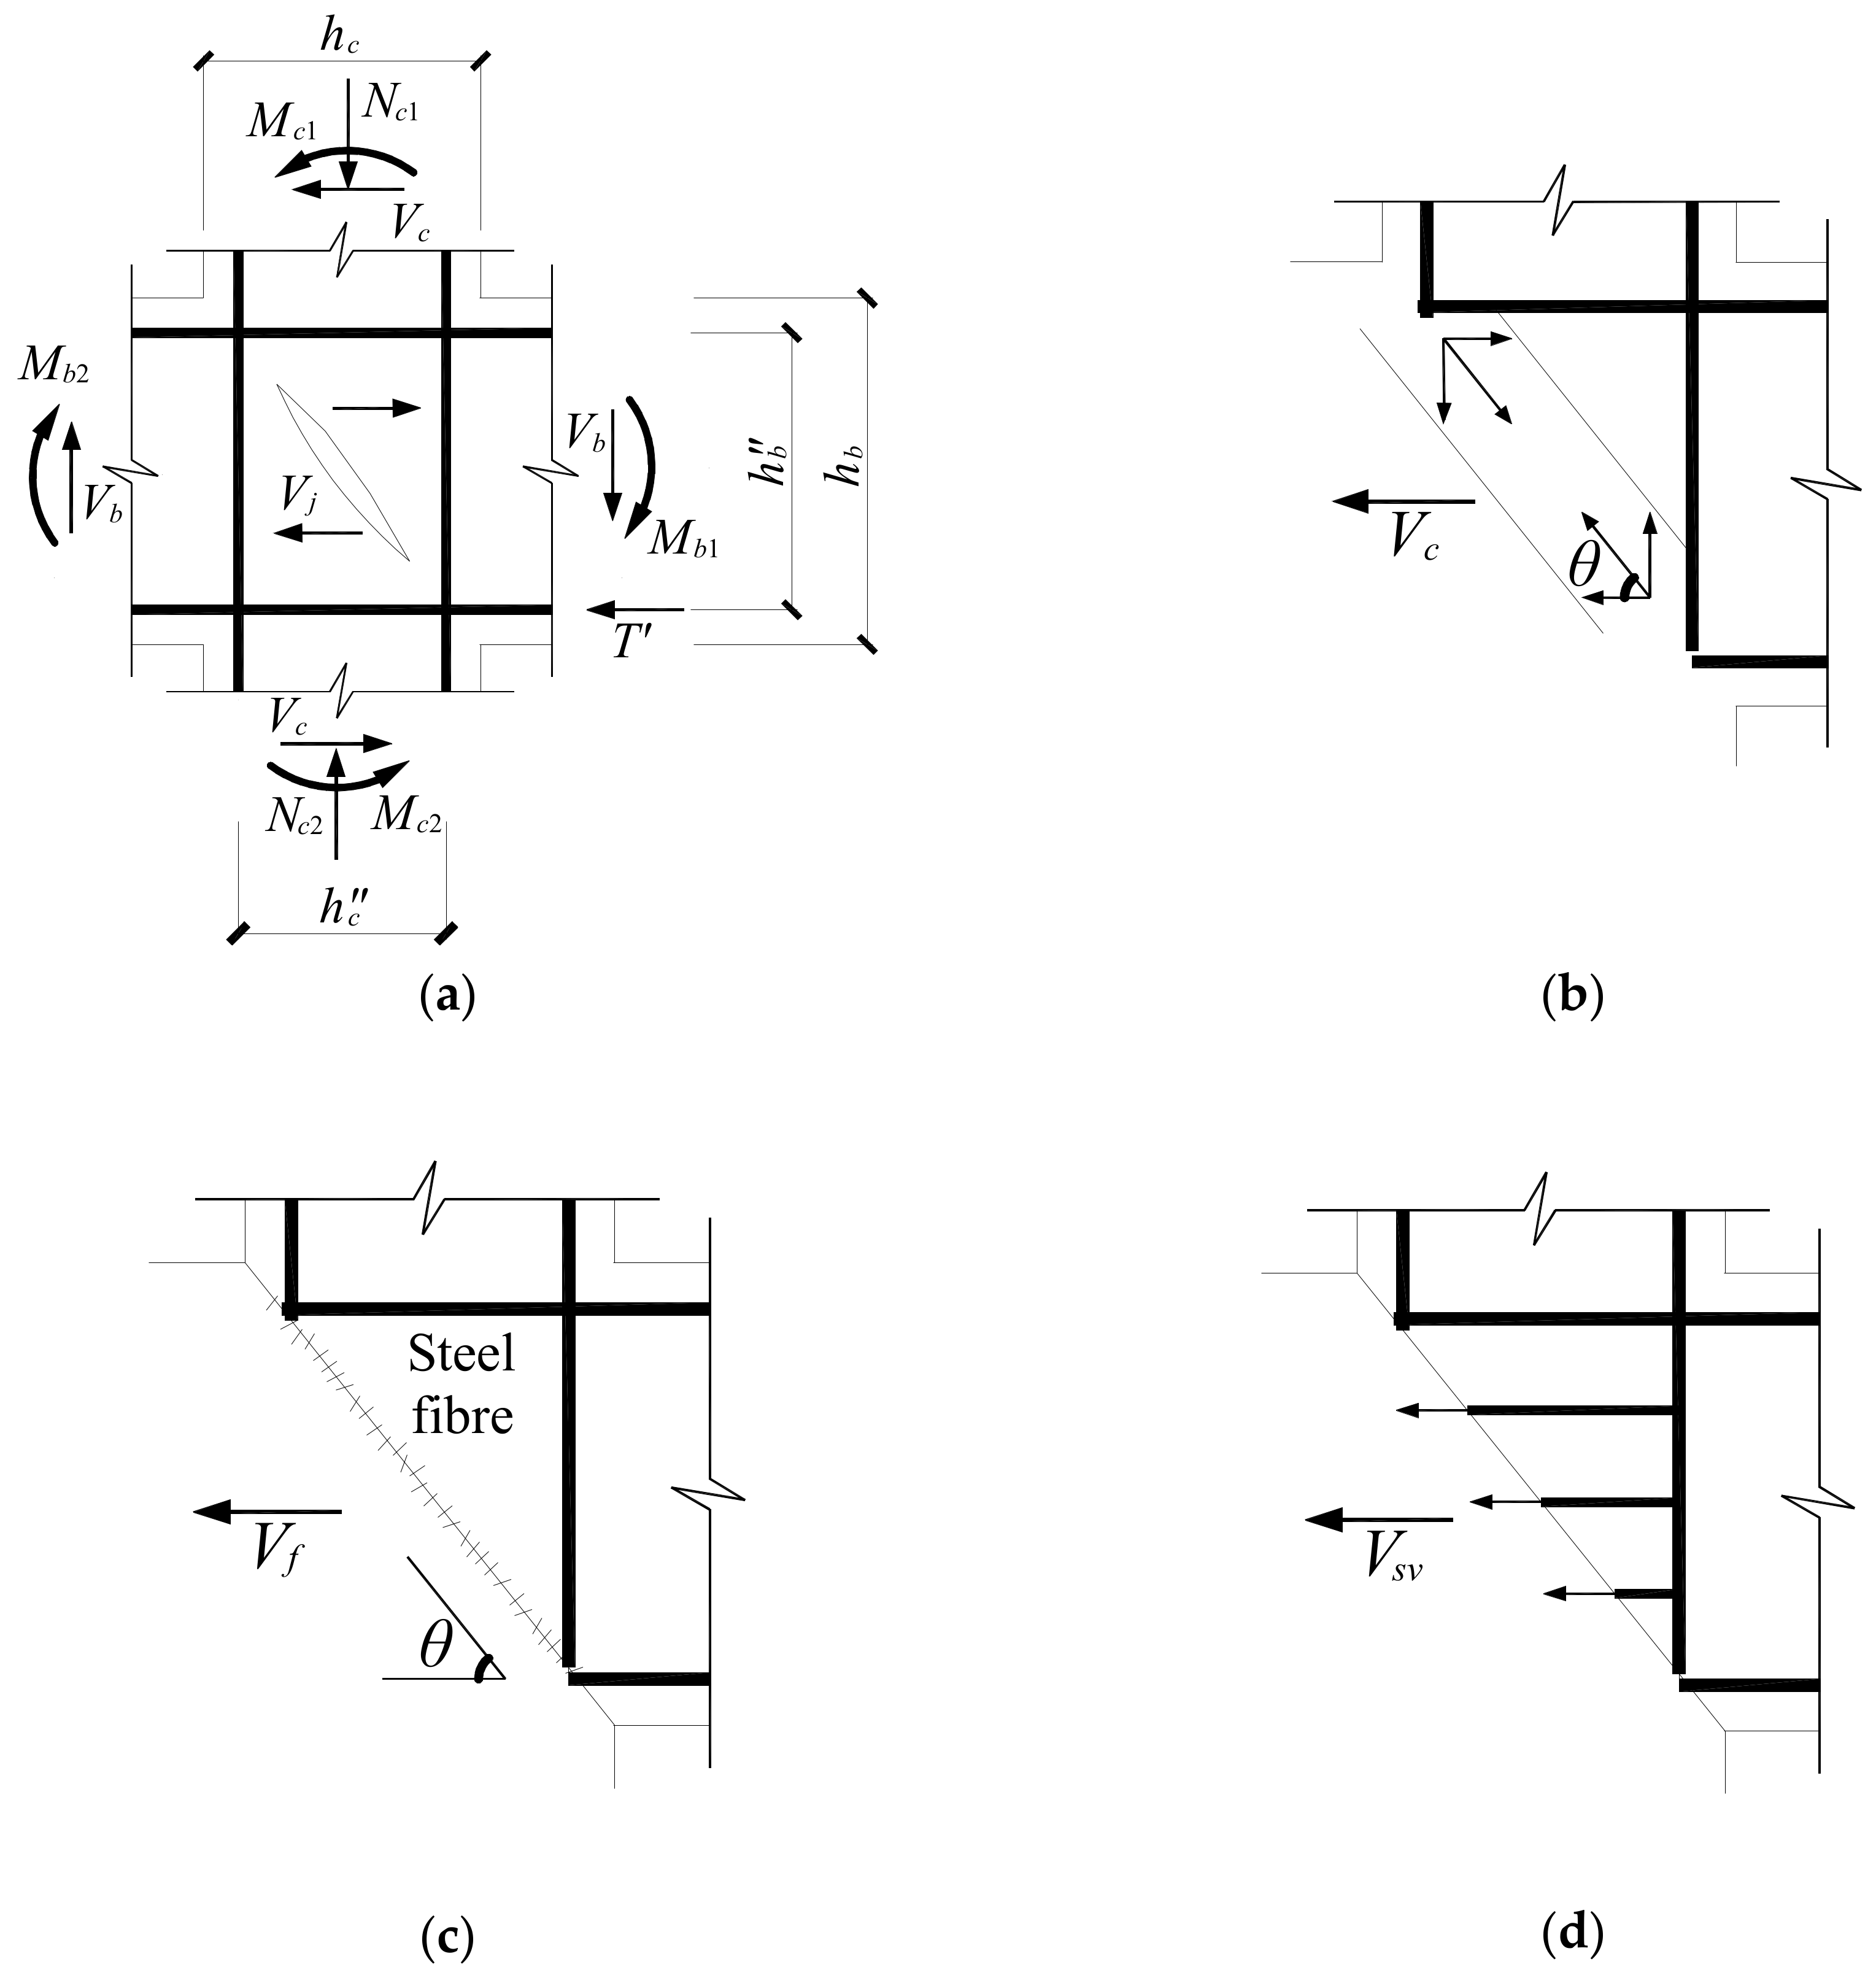
Figure 9.
versus relation curve.


Table 1.
Specimen parameters.
| Specimen | Joint Type | UHPFRC Compressive Strength, MPa | Longitudinal Reinforcement in Beam | Longitudinal Reinforcement in Column | Stirrups in Joint Core | N/fc Aj | ||
|---|---|---|---|---|---|---|---|---|
| Top and Bottom Rebar | Type | Total Rebar | Type | |||||
| EJ-1 | Exterior | 91.83 | 3-D14 | HRB400 | 4-D14 | HRB400 | 0 | 0.5 |
| EJ-2 | Exterior | 103.95 | 2-D20+1-D10 | HRB400 | 4-D14 | HRB400 | 1-D6, 2 legs hoop | 0.3 |
| EJ-3 | Exterior | 98.45 | 2-D20+1-D10 | HRB400 | 4-D14 | HRB400 | 1-D6, 2 legs hoop | 0.5 |
| EJ-4 | Exterior | 89.85 | 3-D14 | HRB600 | 4-D14 | HRB600 | 0 | 0.3 |
| EJ-5 | Exterior | 97.63 | 3-D14 | HRB600 | 4-D14 | HRB600 | 1-D6, 2 legs hoop | 0.3 |
| J-1 | Interior | 112.3 | 3-D14 | HRB400 | 4-D14 | HRB400 | 0 | 0.3 |
| J-2 | Interior | 104.1 | 3-D14 | HRB400 | 4-D14 | HRB400 | 0 | 0.5 |
| J-3 | Interior | 105.8 | 3-D14 | HRB400 | 4-D14 | HRB400 | 1-D6, 2 legs hoop | 0.3 |
| J-4 | Interior | 98.5 | 3-D14 | HRE400 | 4-D14 | HRE400 | 1-D6, 2 legs hoop | 0.5 |
1. The longitudinal reinforcement area in beam of specimens EJ-1, EJ-4 and EJ-5 is the same, but the steel strength is different; 2. The load bearing capacity of longitudinal reinforcement in beam of specimens EJ-2, EJ-3, EJ-4 and EJ-5 is the same.
Table 2.
UHPFRC mixture proportions (per m3).
| Material | Cement | Silica Fume | 0.16~0.315 mm Quartz Sand | 0.315~0.63 mm Quartz Sand | 0.63~1.25 mm Quartz Sand | Steel Fiber | Super-Plasticizer | Water |
|---|---|---|---|---|---|---|---|---|
| Mass (kg) | 756.7 | 227.0 | 169.6 | 370.8 | 737.7 | 105.8 | 20.4 | 216.4 |
Table 3.
Material parameters of reinforcement.
| Type of Reinforcement | Application | Effective Diameter (mm) | Yield Strength (MPa) | Ultimate Strength (MPa) | Elastic Modulus (GPa) |
|---|---|---|---|---|---|
| HPB300 | Transverse stirrup | 6 | 353.56 | 398.30 | 210 |
| HPB300 | Longitudinal bars | 9.5 | 360.6 | 522.2 | 201 |
| HRB400 | Longitudinal bars | 14 | 423.40 | 632.40 | 200 |
| HRB400 | Longitudinal bars | 20 | 441.90 | 588.60 | 200 |
| HRB600 | Longitudinal bars | 14 | 651.00 | 861.67 | 195 |
Table 4.
Comparison of calculated and experimental values.
| Specimen | fcu/MPa | bc × hc/mm × mm | bb × hb/mm × mm | Volume Percentage of Fiber | Stirrup in Joint Core | fy/MPa | Design Axial Compression Load Level | Vjt/kN | Vjc/kN | Vjt/Vjc |
|---|---|---|---|---|---|---|---|---|---|---|
| EJ-1 | 91.83 | 200 × 200 | 150 × 250 | 1.3 | 0 | - | 0.5 | 216.9 | 290.1 | 0.748 |
| EJ-2 | 103.95 | 200 × 200 | 150 × 250 | 1.3 | 1Φ6 | 353.6 | 0.3 | 271.2 | 276.9 | 0.979 |
| EJ-3 | 93.45 | 200 × 200 | 150 × 250 | 1.3 | 1Φ6 | 353.6 | 0.5 | 302.6 | 302.8 | 0.999 |
| EJ-4 | 89.85 | 200 × 200 | 150 × 250 | 1.3 | 0 | - | 0.3 | 232.9 | 258.6 | 0.901 |
| EJ-5 | 97.63 | 200 × 200 | 150 × 250 | 1.3 | 1Φ6 | 353.6 | 0.3 | 312.6 | 273.3 | 1.144 |
| J-1 | 112.3 | 200 × 200 | 150 × 250 | 1.3 | 0 | - | 0.3 | 374.8 | 339.2 | 1.105 |
| J-2 | 104.1 | 200 × 200 | 150 × 250 | 1.3 | 0 | - | 0.5 | 410.2 | 368.5 | 1.113 |
| J-3 | 105.8 | 200 × 200 | 150 × 250 | 1.3 | 1Φ6 | 353.6 | 0.3 | 380.9 | 347.4 | 1.096 |
| J-4 | 98.5 | 200 × 200 | 150 × 250 | 1.3 | 1Φ6 | 353.6 | 0.5 | 379.2 | 378.5 | 1.002 |
| JDZ0.3-0.5-0.6 | 82.1 | 200 × 200 | 150 × 250 | 0.5 | 2Φ8 | 307 | 0.3 | 328.1 | 335.2 | 0.979 |
| JDZ0.2-1.0-0 | 79.1 | 200 × 200 | 150 × 250 | 1.0 | 0 | - | 0.2 | 330.9 | 302.3 | 1.095 |
| JDZ0.3-1.0-0 | 81.7 | 200 × 200 | 150 × 250 | 1.0 | 0 | - | 0.3 | 348.4 | 332.1 | 1.049 |
| JDZ0.4-1.0-0 | 78.1 | 200 × 200 | 150 × 250 | 1.0 | 0 | - | 0.4 | 360.5 | 352.1 | 1.024 |
© 2018 by the authors. Licensee MDPI, Basel, Switzerland. This article is an open access article distributed under the terms and conditions of the Creative Commons Attribution (CC BY) license (http://creativecommons.org/licenses/by/4.0/).
Share and Cite
MDPI and ACS Style
Wang, D.; Ju, Y.; Zheng, W.; Shen, H. Seismic Behavior and Shear Bearing Capacity of Ultra-High Performance Fiber-Reinforced Concrete (UHPFRC) Beam-Column Joints. Appl. Sci. 2018, 8, 810. https://doi.org/10.3390/app8050810
AMA Style
Wang D, Ju Y, Zheng W, Shen H. Seismic Behavior and Shear Bearing Capacity of Ultra-High Performance Fiber-Reinforced Concrete (UHPFRC) Beam-Column Joints. Applied Sciences. 2018; 8(5):810. https://doi.org/10.3390/app8050810
Chicago/Turabian StyleWang, Dehong, Yanzhong Ju, Wenzhong Zheng, and Hao Shen. 2018. "Seismic Behavior and Shear Bearing Capacity of Ultra-High Performance Fiber-Reinforced Concrete (UHPFRC) Beam-Column Joints" Applied Sciences 8, no. 5: 810. https://doi.org/10.3390/app8050810
Note that from the first issue of 2016, this journal uses article numbers instead of page numbers. See further details here.