Article

Evaluation of the Change in Undrained Shear Strength in Cohesive Soils due to Principal Stress Rotation Using an Artificial Neural Network

by
Grzegorz Wrzesiński
1,*,
Maria Jolanta Sulewska
2 and
Zbigniew Lechowicz
1
1
Faculty of Civil and Environmental Engineering, Warsaw University of Life Sciences, Nowoursynowska 159 St., 02-776 Warsaw, Poland
2
Faculty of Civil and Environmental Engineering, Bialystok University of Technology, Wiejska 45E St., 15-351 Bialystok, Poland
*
Author to whom correspondence should be addressed.
Appl. Sci. 2018, 8(5), 781; https://doi.org/10.3390/app8050781
Submission received: 24 March 2018 / Revised: 28 April 2018 / Accepted: 10 May 2018 / Published: 14 May 2018

Abstract

:
This paper presents a method describing the application of artificial neural networks to evaluate the change in undrained shear strength in cohesive soils due to principal stress rotation. For analysis, the results of torsional shear hollow cylinder (TSHC) tests were used. An artificial neural network with an architecture of 7–6–1 was able to predict the real value of normalized undrained shear strength, τfu/σ’v, based on soil type, over-consolidation ratio (OCR), plasticity index, IP, and the angle of principal stress rotation, α, with an average relative error of around ±3%, and a single maximum value of relative error around 6%.

1. Introduction

Undrained shear strength is one of the basic parameters that characterizing the mechanical properties of cohesive soils. The value of this parameter depends on soil type, consistency, stress state, history, and also depends on factors such as loading type and loading mode [1,2]. The loading of subsoil changes the stress state of the soil, and thereby causes principal stress rotation in comparison with the soil’s initial state obtained during the sedimentation process [3]. Research performed in a torsional shear hollow cylinder apparatus (TSHCA), both on undisturbed and reconstituted cohesive soils, has shown that principal stress rotation has a significant impact on the value of undrained shear strength. Undrained shear strength had a major principal stress value in the σ1 horizontal, which was about 0.70 of the value of that of the vertical σ1, as previously observed in the literature [4,5,6,7,8]. Therefore, when determining the bearing capacity of the subsoil, changes resulting from this phenomenon should be taken into account. Test investigations that determine the impact of principal stress rotation on the undrained shear strength of subsoil are costly and time-consuming. Hence, other methods to evaluate the change in undrained shear strength are used.
The impact of principal stress rotation on undrained shear strength may be estimated using the relationship proposed by Bishop [9]:
C u = C u V · ( 1 a B · s i n 2 θ ) · ( 1 b B · s i n 2 2 θ ) ,
where CuV is the undrained shear strength with a vertical direction of applied stress, aB and bB are empirical coefficients, and θ is the inclination of major principal stress with respect to the vertical axis.
In the Bishop relationship, only undrained shear strength with a vertical direction of applied stress is determined in the tests, while the change in undrained shear strength depends on empirical parameters.
Kulhavy and Mayne [10] proposed a systematic framework to estimate normalized undrained shear strength as a function of normalized undrained shear strength, under an isotropically-consolidated undrained compression test with a strain rate equal to 1%/h on normally-consolidated clay. The following dimensionless modifiers were also taken into account: test mode, over-consolidation ratio, strain rate. Ching and Phoon [11] constructed a multivariate probability distribution of undrained shear strength from various test procedures, based on a large clay database. This multivariate distribution provided an estimate of normalized undrained shear strength based on four factors: test mode, over-consolidation ratio, strain rate, and plasticity. Houlsby and Houlsby [12] performed a statistical fitting of undrained strength data using Bayesian statistical methods. The presented approach allowed the fitting of a design profile to a set of measurements of undrained shear strength.
Artificial neural networks (ANNs) are tools of information technology, often used in science and various fields of technology for modeling complex phenomena (e.g., [13,14,15,16]). ANNs are alternatively used for statistical analysis methods, as they are often more useful compared to traditional methods [17].
Reviews of the application of ANNs in civil engineering were presented by Adeli [18], Ghaboussi [19], and Rojas [20]. Waszczyszyn [21,22] presented applications of ANNs in various subjects: analysis of regression problems, hybrid computational systems, development of ANNs, Bayesian neural networks (BNNs), principal component analysis (PCA), and recurrent cascade neural networks (RCNNs). Rafiq et al. [23] provided guidelines and examples of engineering applications of three types of neural networks: multilayer perceptrons (MLPs), radial basis function (RBF) networks, and normalized RBF (NRBF) networks.
In geotechnical engineering, ANNs have been used to analyze many issues, as reviewed by Dihoru et al. [24], Pichler et al. [25], Rafiq et al. [23], Shahin et al. [26,27], Tian et al. [28], Sulewska [29], and Zhou et al. [30]. Constitutive modeling of soils in triaxial tests, based on neural networks, were carried out by Basheer [31], Ellis et al. [32], Fu et al. [33], Najjar and Huang [34], Penumadu and Zhao [35], and Sidarta and Ghaboussi [36]. Lee et al. [37] presented neural network models for evaluating unsaturated shear strength. The use of ANNs for the prediction of the lateral earth pressure ratio, Ko, based on a dilatometer test was shown by Das and Basudhar [38], and the prediction of undrained shear strength was shown by Byeon et al. [39] and Lee et al. [37]. However, artificial neural networks have not been applied to the evaluation of the change in undrained shear strength in cohesive soils due to principal stress rotation. For this purpose, a series of undrained shear strength tests in a torsional shear hollow cylinder apparatus, both on undisturbed and reconstituted cohesive soil samples, was carried out.

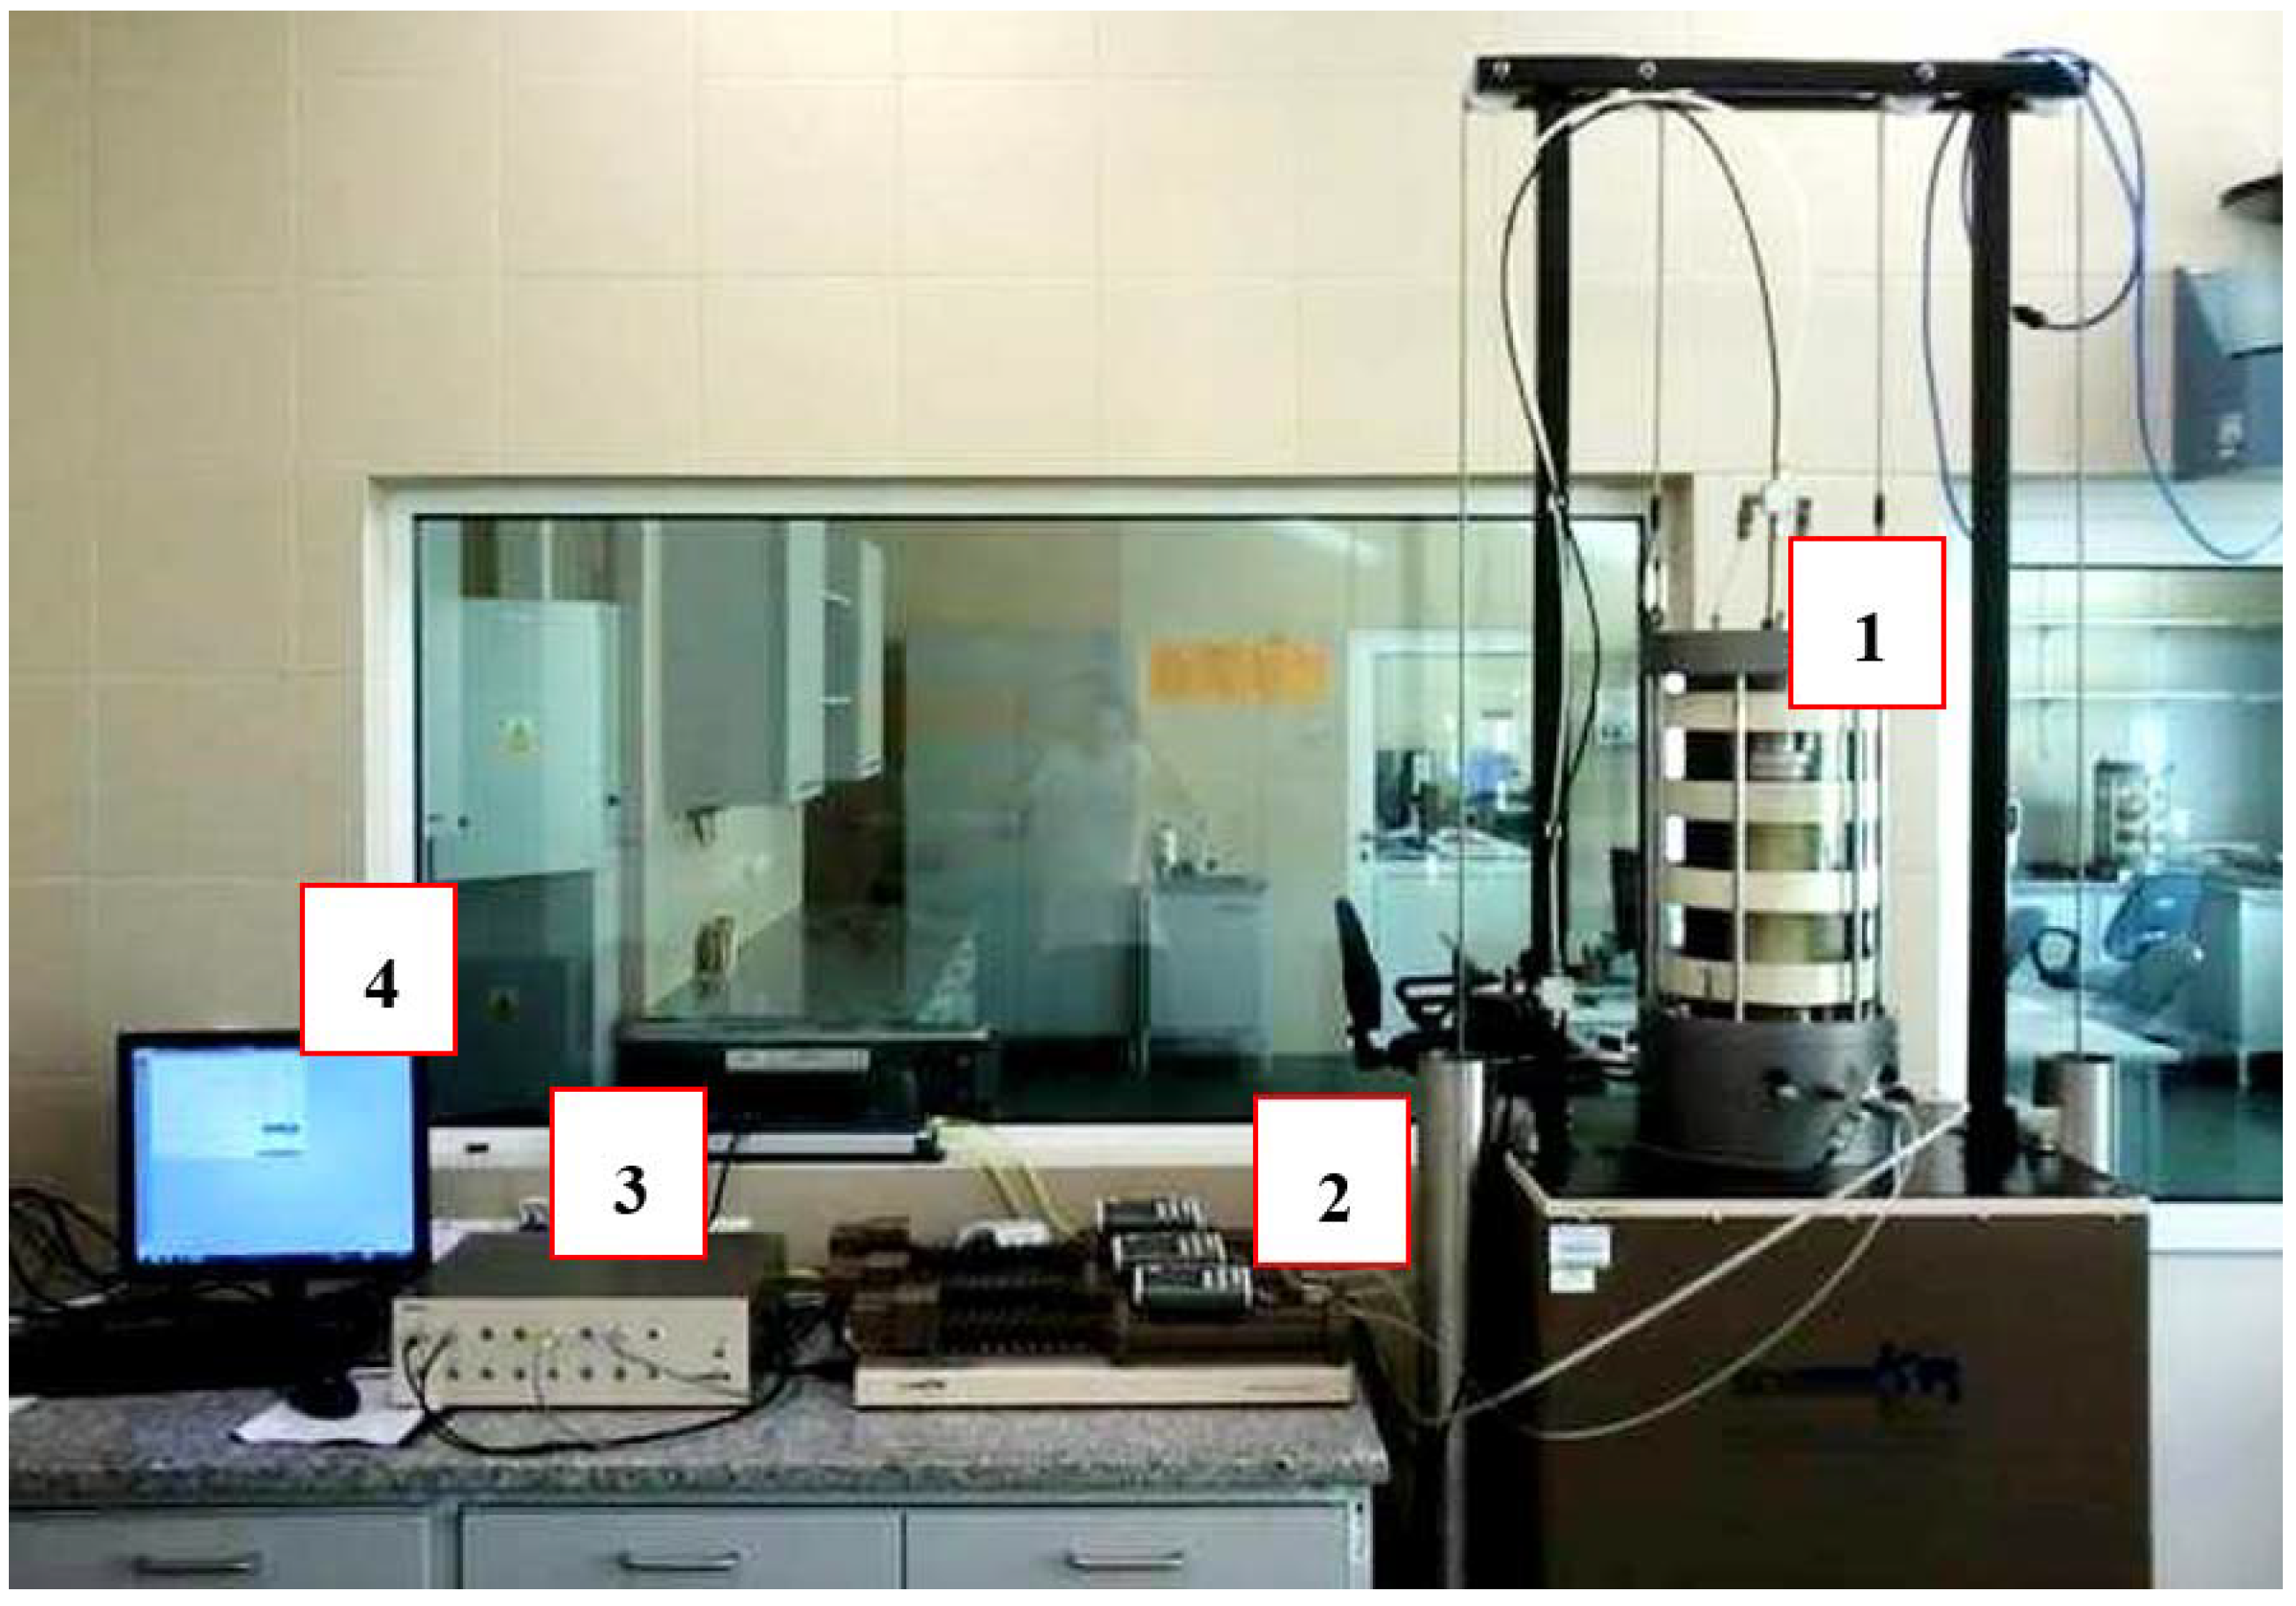
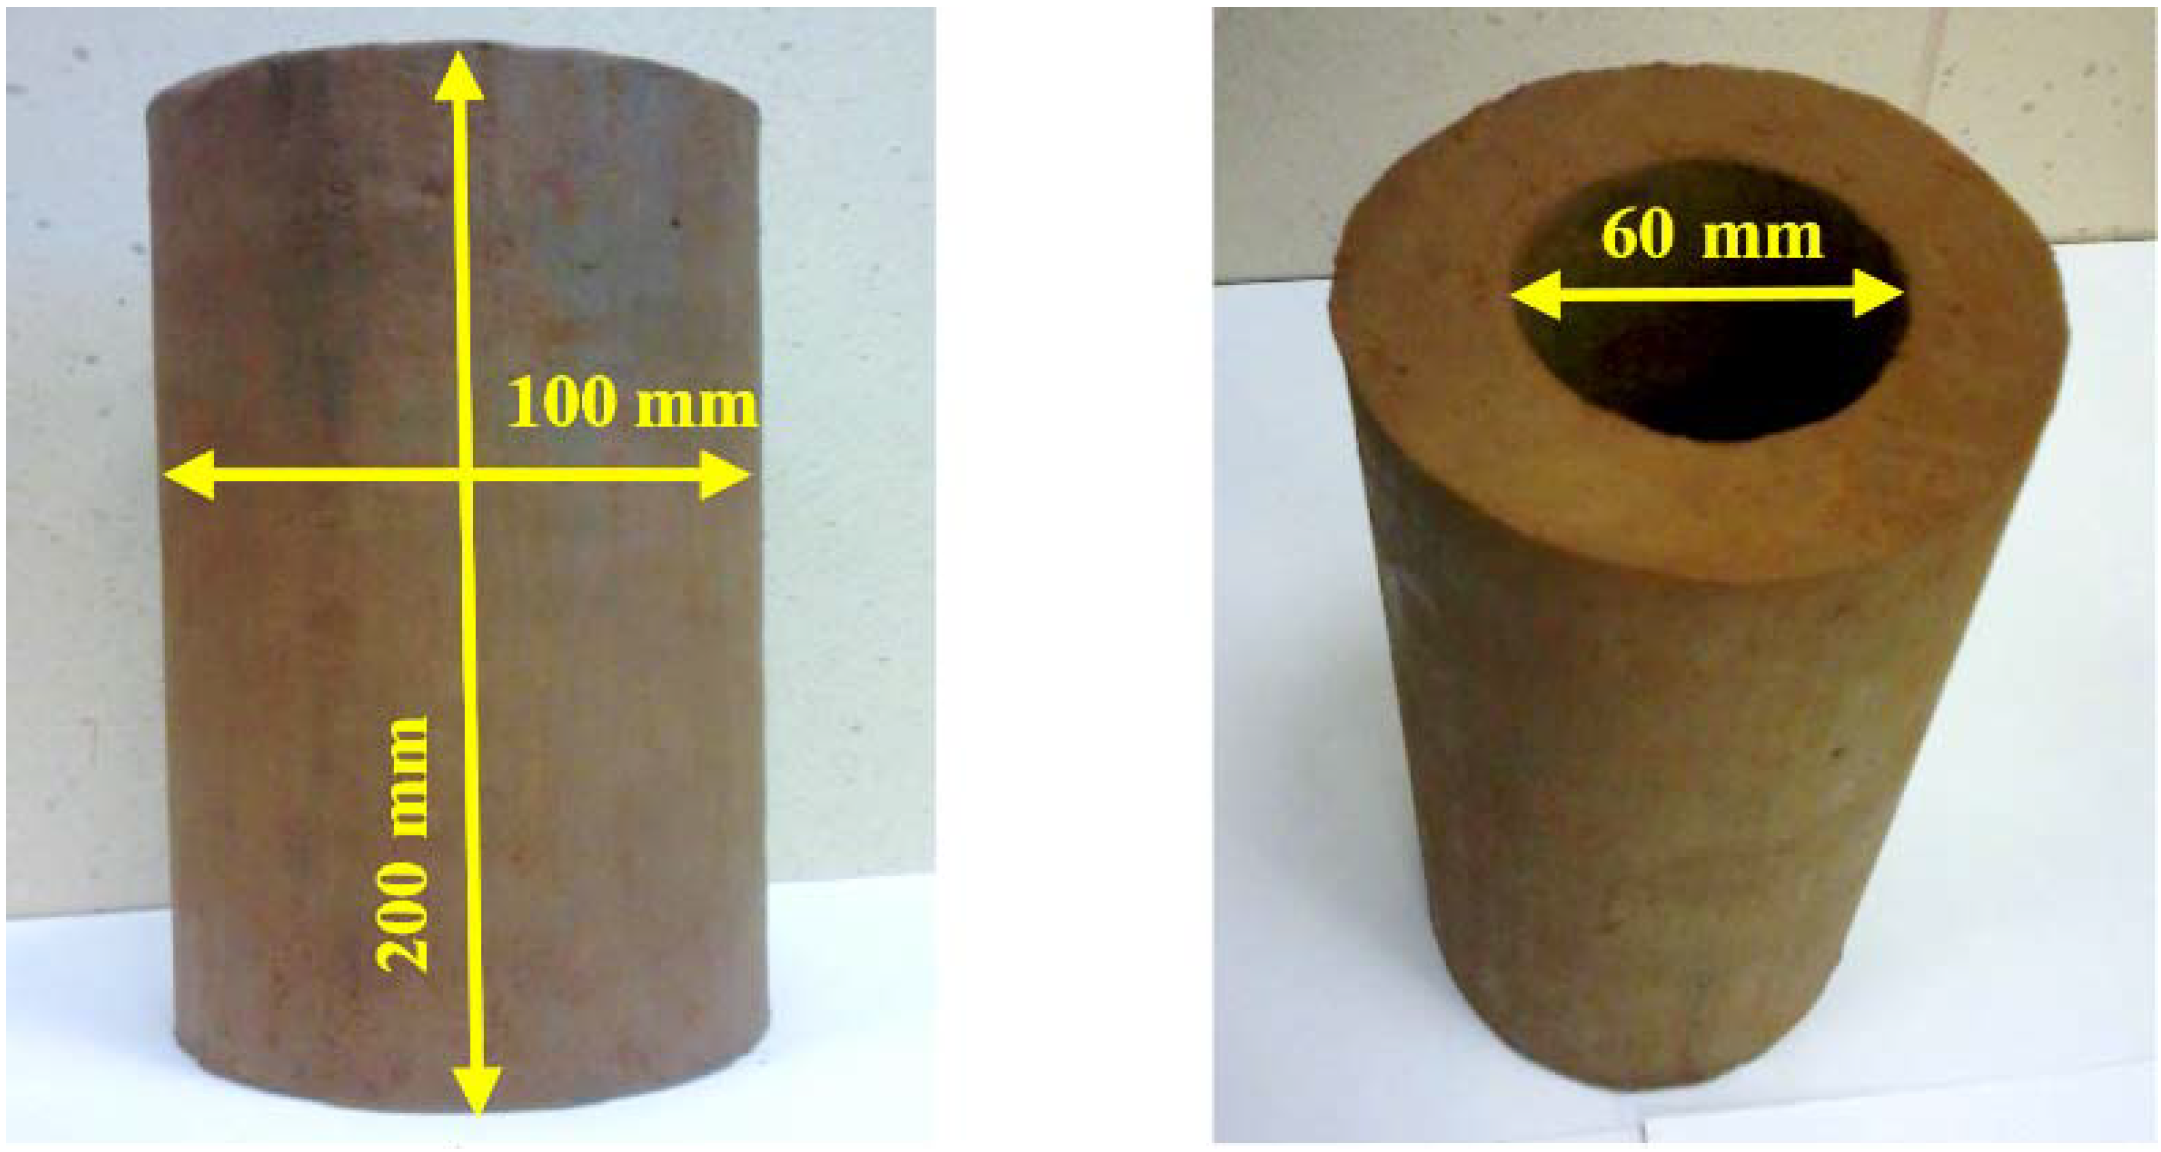
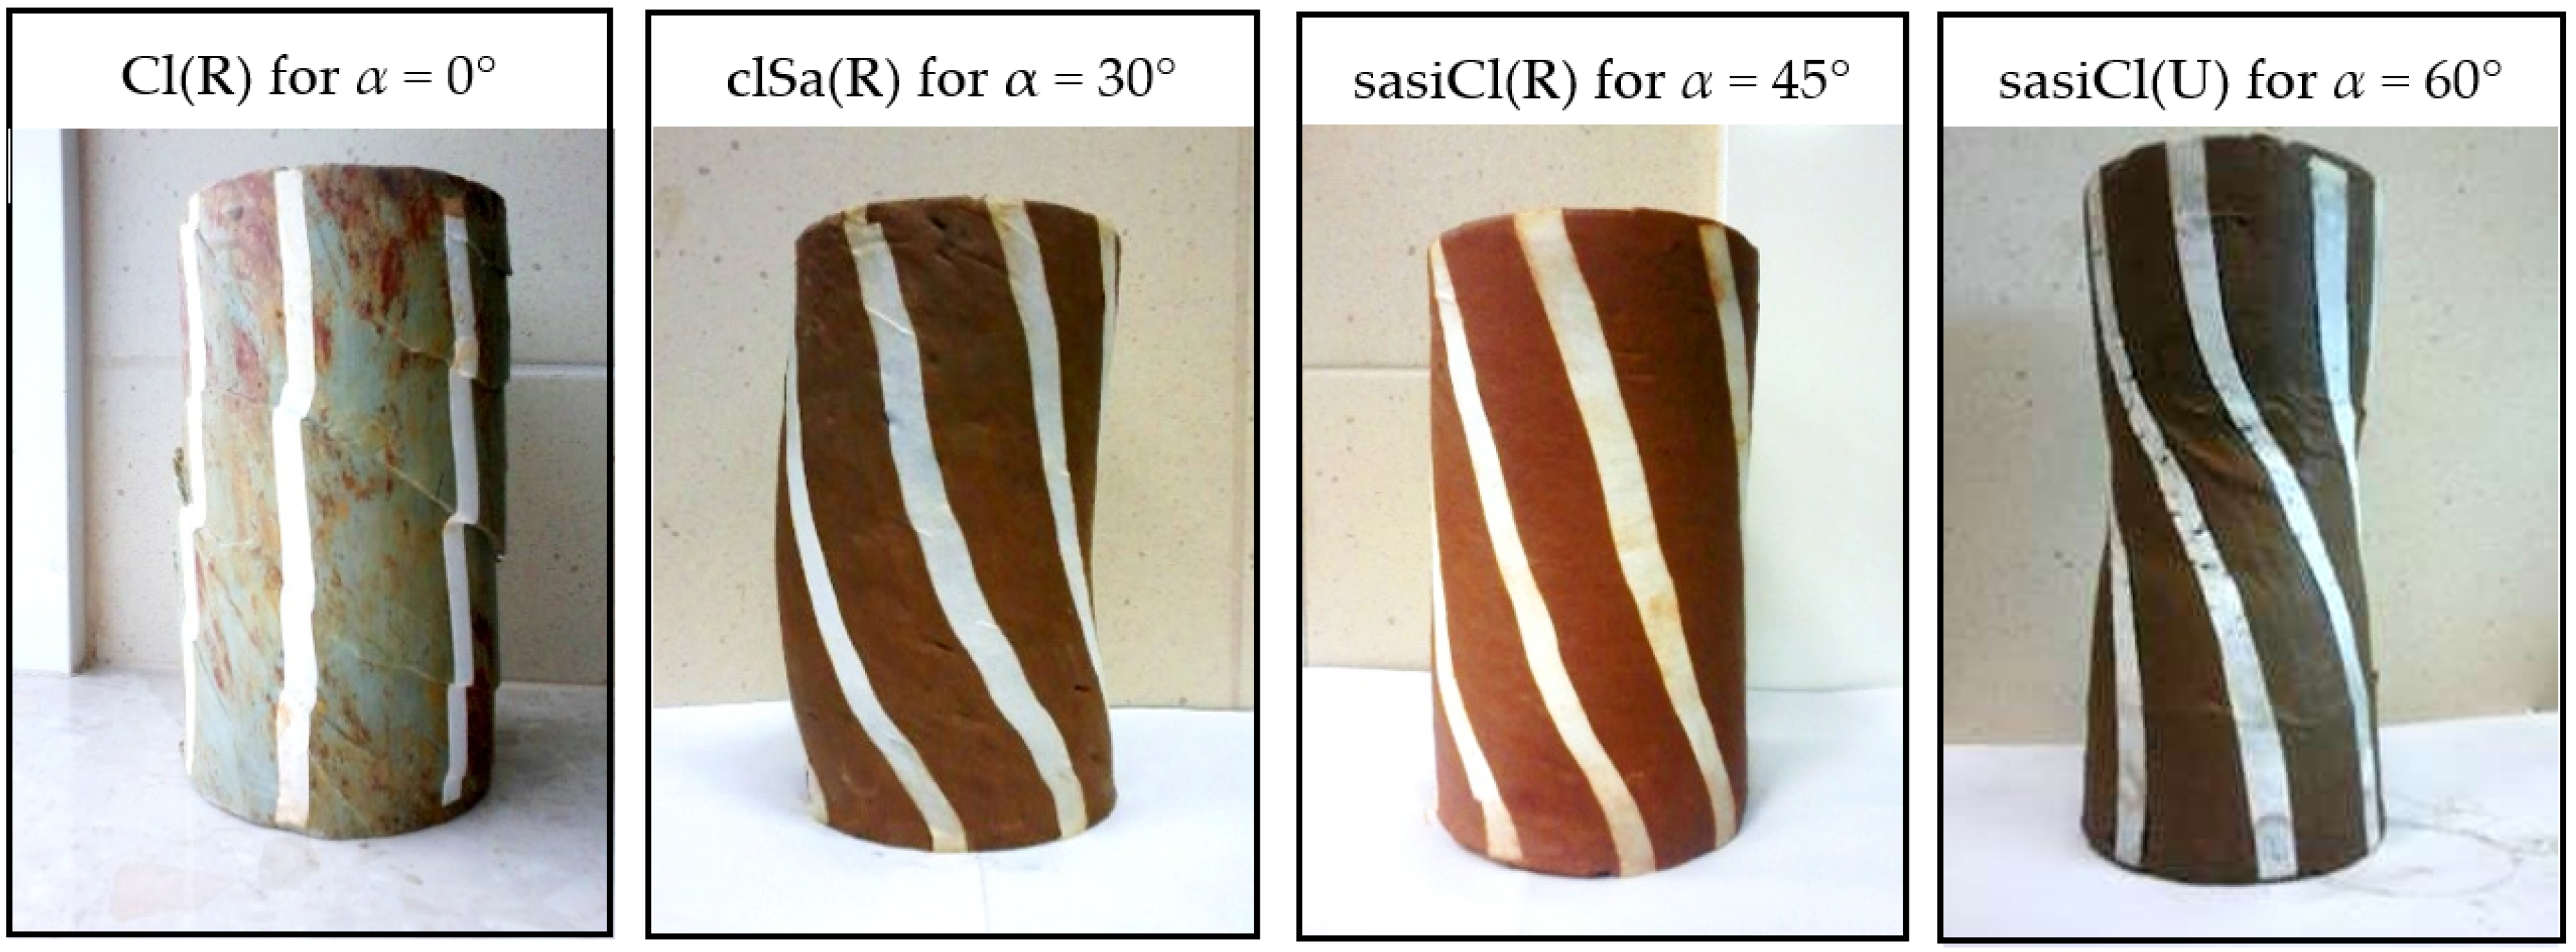
2. Materials and Methods
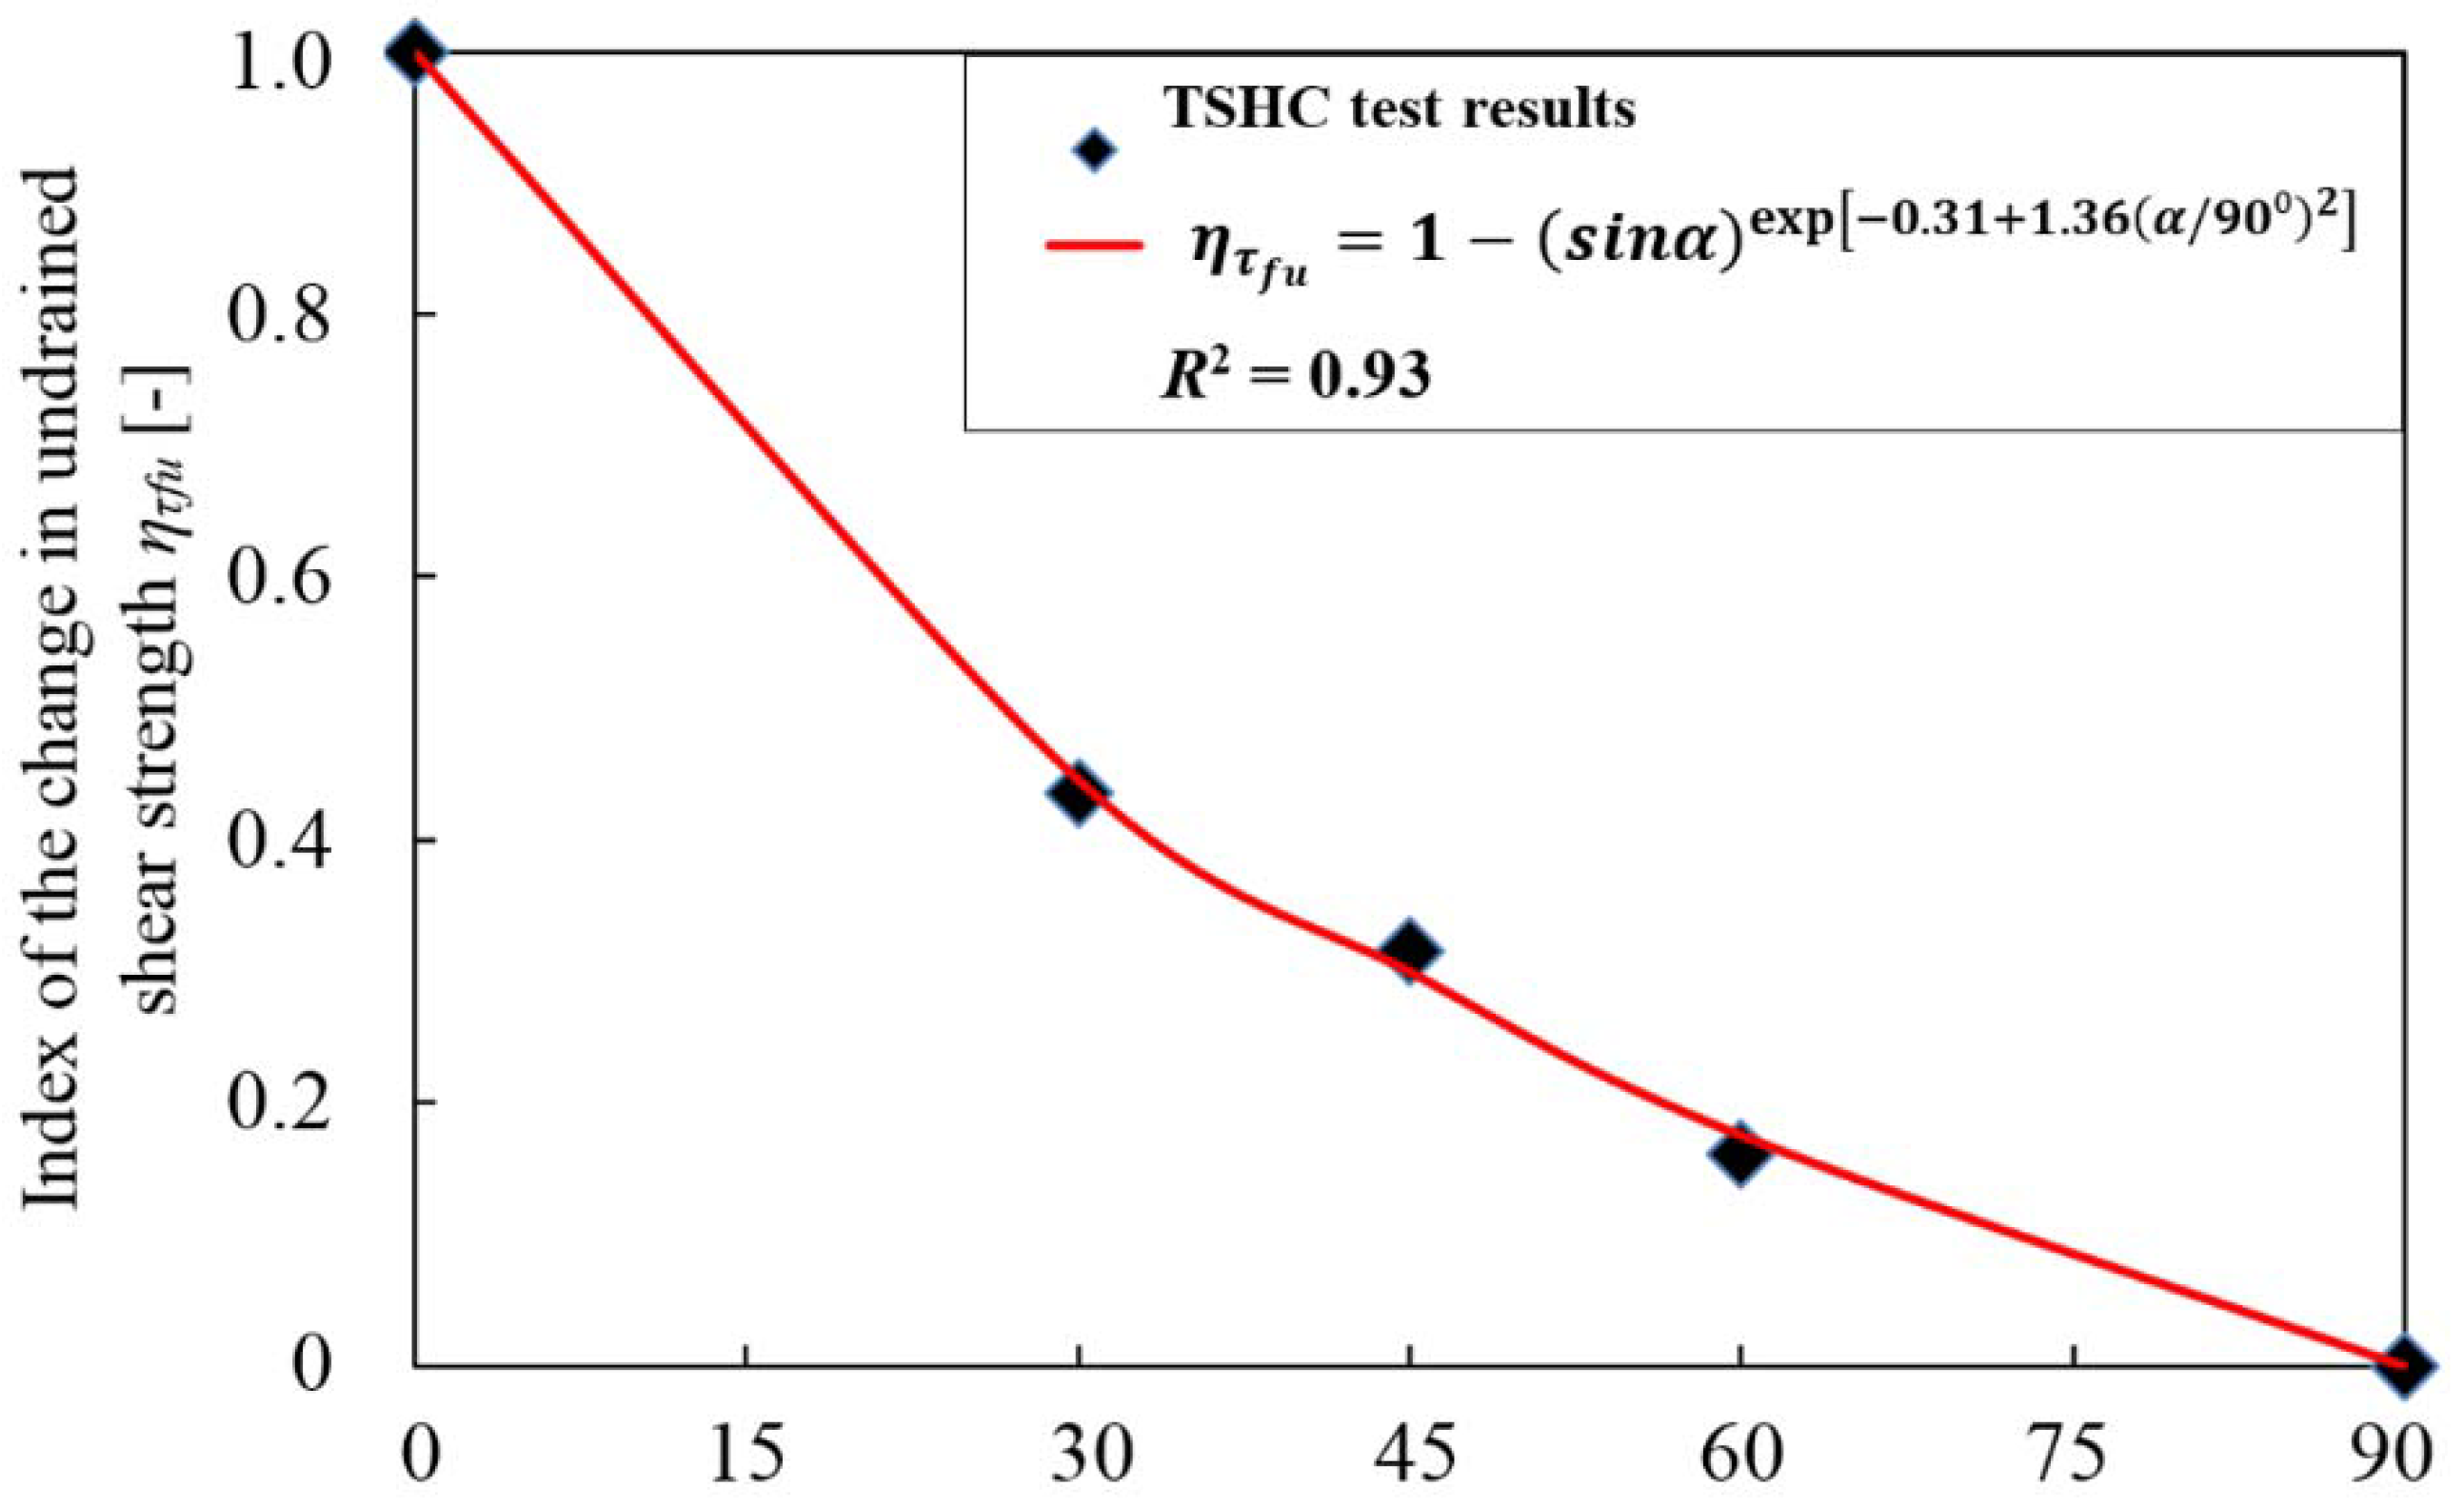
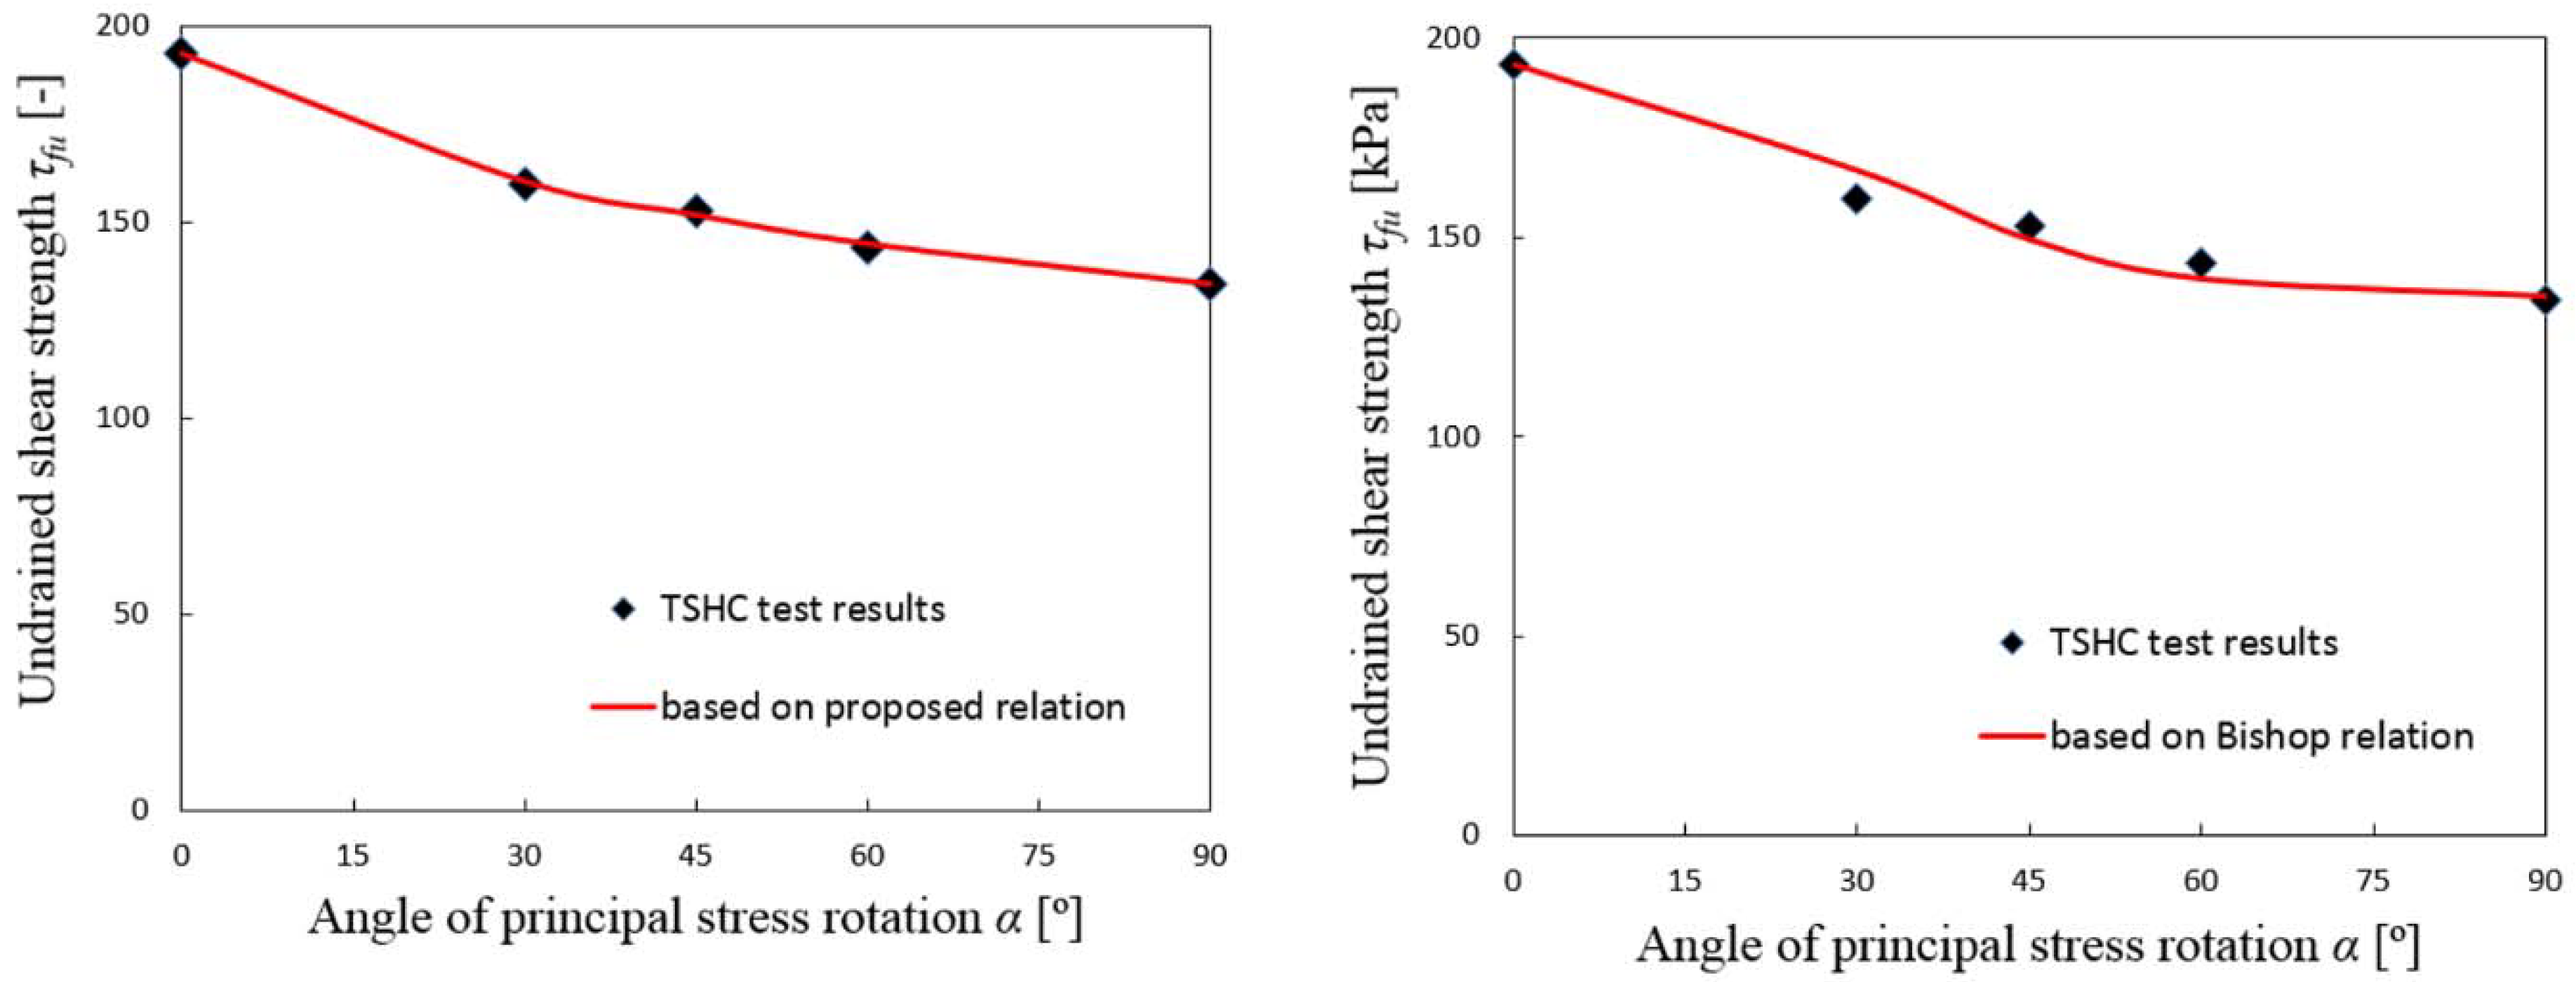
Laboratory tests to determine undrained shear strength were performed in the Water Center Laboratory at the Warsaw University of Life Sciences (SGGW) using the torsional shear hollow cylinder apparatus (Figure 1). Tests were carried out on undisturbed (U) and reconstituted (R) soil samples of clay (Cl(U)), sandy silty clay (sasiCl(U) and sasiCl(R)), and clayey sand (clSa(R)). The clay samples had an over-consolidation ratio (OCR) of 3.5 and a plasticity index IP of 77.6%. The samples of sandy silty clay had an OCR of 2.7 and an IP of 34.7%, whereas the samples of clayey sand had an OCR of 8.0 and an IP of 10.5%. The index properties of the tested soils are presented in Table 1. The undrained shear strength was determined at angles of principal stress rotation, α, equal to 0°, 30°, 45°, 60°, and 90° for clay and clayey sand, and equal to 0°, 15°, 30°, 45°, 60°, 75°, and 90° for sandy silty clay. Undisturbed soil samples were taken directly from the excavation site at the Copernicus Science Center station of the II underground line in Warsaw, while reconstituted samples were prepared in the laboratory using material from undisturbed samples, following their failure.
The TSHC tests were performed on soil samples in the shape of a hollow cylinder (Figure 2). Tests, both on undisturbed and reconstituted soils, were performed in six consecutive stages: flushing, saturation, consolidation, change of the intermediate principal stress parameter, b, change of the angle of principal stress rotation, α, and finally, shearing in undrained conditions. Parameter b is defined as:
b = ( σ 2 σ 3 ) ( σ 1 σ 3 ) ,
where σ1 is the major principal stress, σ2 is the intermediate principal stress, and σ3 is the minor principal stress.
Flushing was carried out to remove air and gases from soil samples and tubes having the largest dimensions. Saturation of soil samples was performed using the back pressure method. This stage lasted until the value of Skempton’s parameter, B, exceeded 0.95. Next, anisotropic consolidation was performed. In the case of clay, the value of Ko during the consolidation process was equal to 0.97, whereas for sandy silty clay, Ko was equal to 0.83. After dissipation of excess pore water pressure, parameter b was changed to 0.5 (Equation (1)) [44].
In the next step, the value of angle α was changed to the determined value in particular test. Finally, the process of sample shearing was carried out in the stress path, involving an increase in deviator stress, q, and a constant value of total mean stress, p. During the entire shearing process of the soil samples, values of parameter b and angle α were kept constant. An example of the soil samples after the TSHC tests is shown in Figure 3.

3. Results

The TSHC tests allowed the values of undrained shear strength to be obtained at selected angles of principal stress rotation for undisturbed clay, undisturbed and reconstituted sandy silty clay, as well as reconstituted clayey sand (Table 2). To determine these parameters, the maximum deviator stress was used as the failure criterion. All obtained values of undrained shear strength were normalized based on the vertical effective stress, σ’v, to obtain comparable values of normalized undrained shear strength.
Based on research carried out by Wrzesiński [41] in a torsional shear hollow cylinder apparatus, a relationship was proposed to evaluate undrained shear strength at any angle of principal stress rotation [45]. The proposed relationship differs from the commonly known equation proposed by Bishop [9], because undrained shear strengths at α values of 0° and 90° are determined based on strength tests. This allows a more accurate determination of undrained shear strength for α values between 0° and 90°.
The undrained shear strength at any angle of principal stress rotation, τ f u α , can be evaluated as [45]:
τ f u α = τ f u 90 ° + η τ f u ( τ f u 0 ° τ f u 90 ° ) ,
where η τ f u is the index of change in undrained shear strength, τ f u 90 ° is the undrained shear strength at α = 90°, and τ f u 0 ° is the undrained shear strength at α = 0°.
The index of change in undrained shear strength due to a change in angle of principal stress rotation is defined as:
η τ f u = ( τ f u α τ f u 90 ° ) / ( τ f u 0 ° τ f u 90 ° ) .
Based on the TSHC test results, the following relationship between the indexes of change in undrained shear strength at any angle, α, was proposed by Wrzesiński [41]:
η τ f u = 1 ( s i n α ) e x p [ a o + a 1 ( α 90 ° ) n ] ,
where ao, a1, and n are empirical coefficients.
The obtained relationship in Equation (5) for over-consolidated clayey sand (clSa(R)), tested by Kiziewicz [40], is presented in Figure 4. The coefficient of determination, R2, for the relationship determining the change in undrained shear strength for clayey sand was equal to 0.93. The values of empirical coefficients ao, a1, and n for all tested soils are shown in Table 2. Test results showed that the values of empirical coefficients in Equation (5) depended on the type and structure of the soil, and its stress history. The proposed equation was derived on the basis of tests performed on over-consolidated clays with a low impact of glaciotectonic disturbances on the soil structure.
Figure 5 presents the undrained shear strength of clayey sand, clSa(R), based on Equation (3), with the index η τ f u obtained from Equation (5), and empirical coefficients presented in Table 2. In Figure 5, undrained shear strength evaluated based on Bishop’s relationship is also presented. The undrained shear strength at α = 90° determined in the TSHC test was different from the result based on Bishop’s relationship. In this case, the relative error was equal to 0.82. Using Bishop’s relationship to determine undrained shear strength for clayey sand clSa(R), the biggest relative error was at an α value of 30°, and was equal to 4.19%. However, when using the proposed method, the error was equal to 0.38%.

4. Artificial Neural Network Analysis

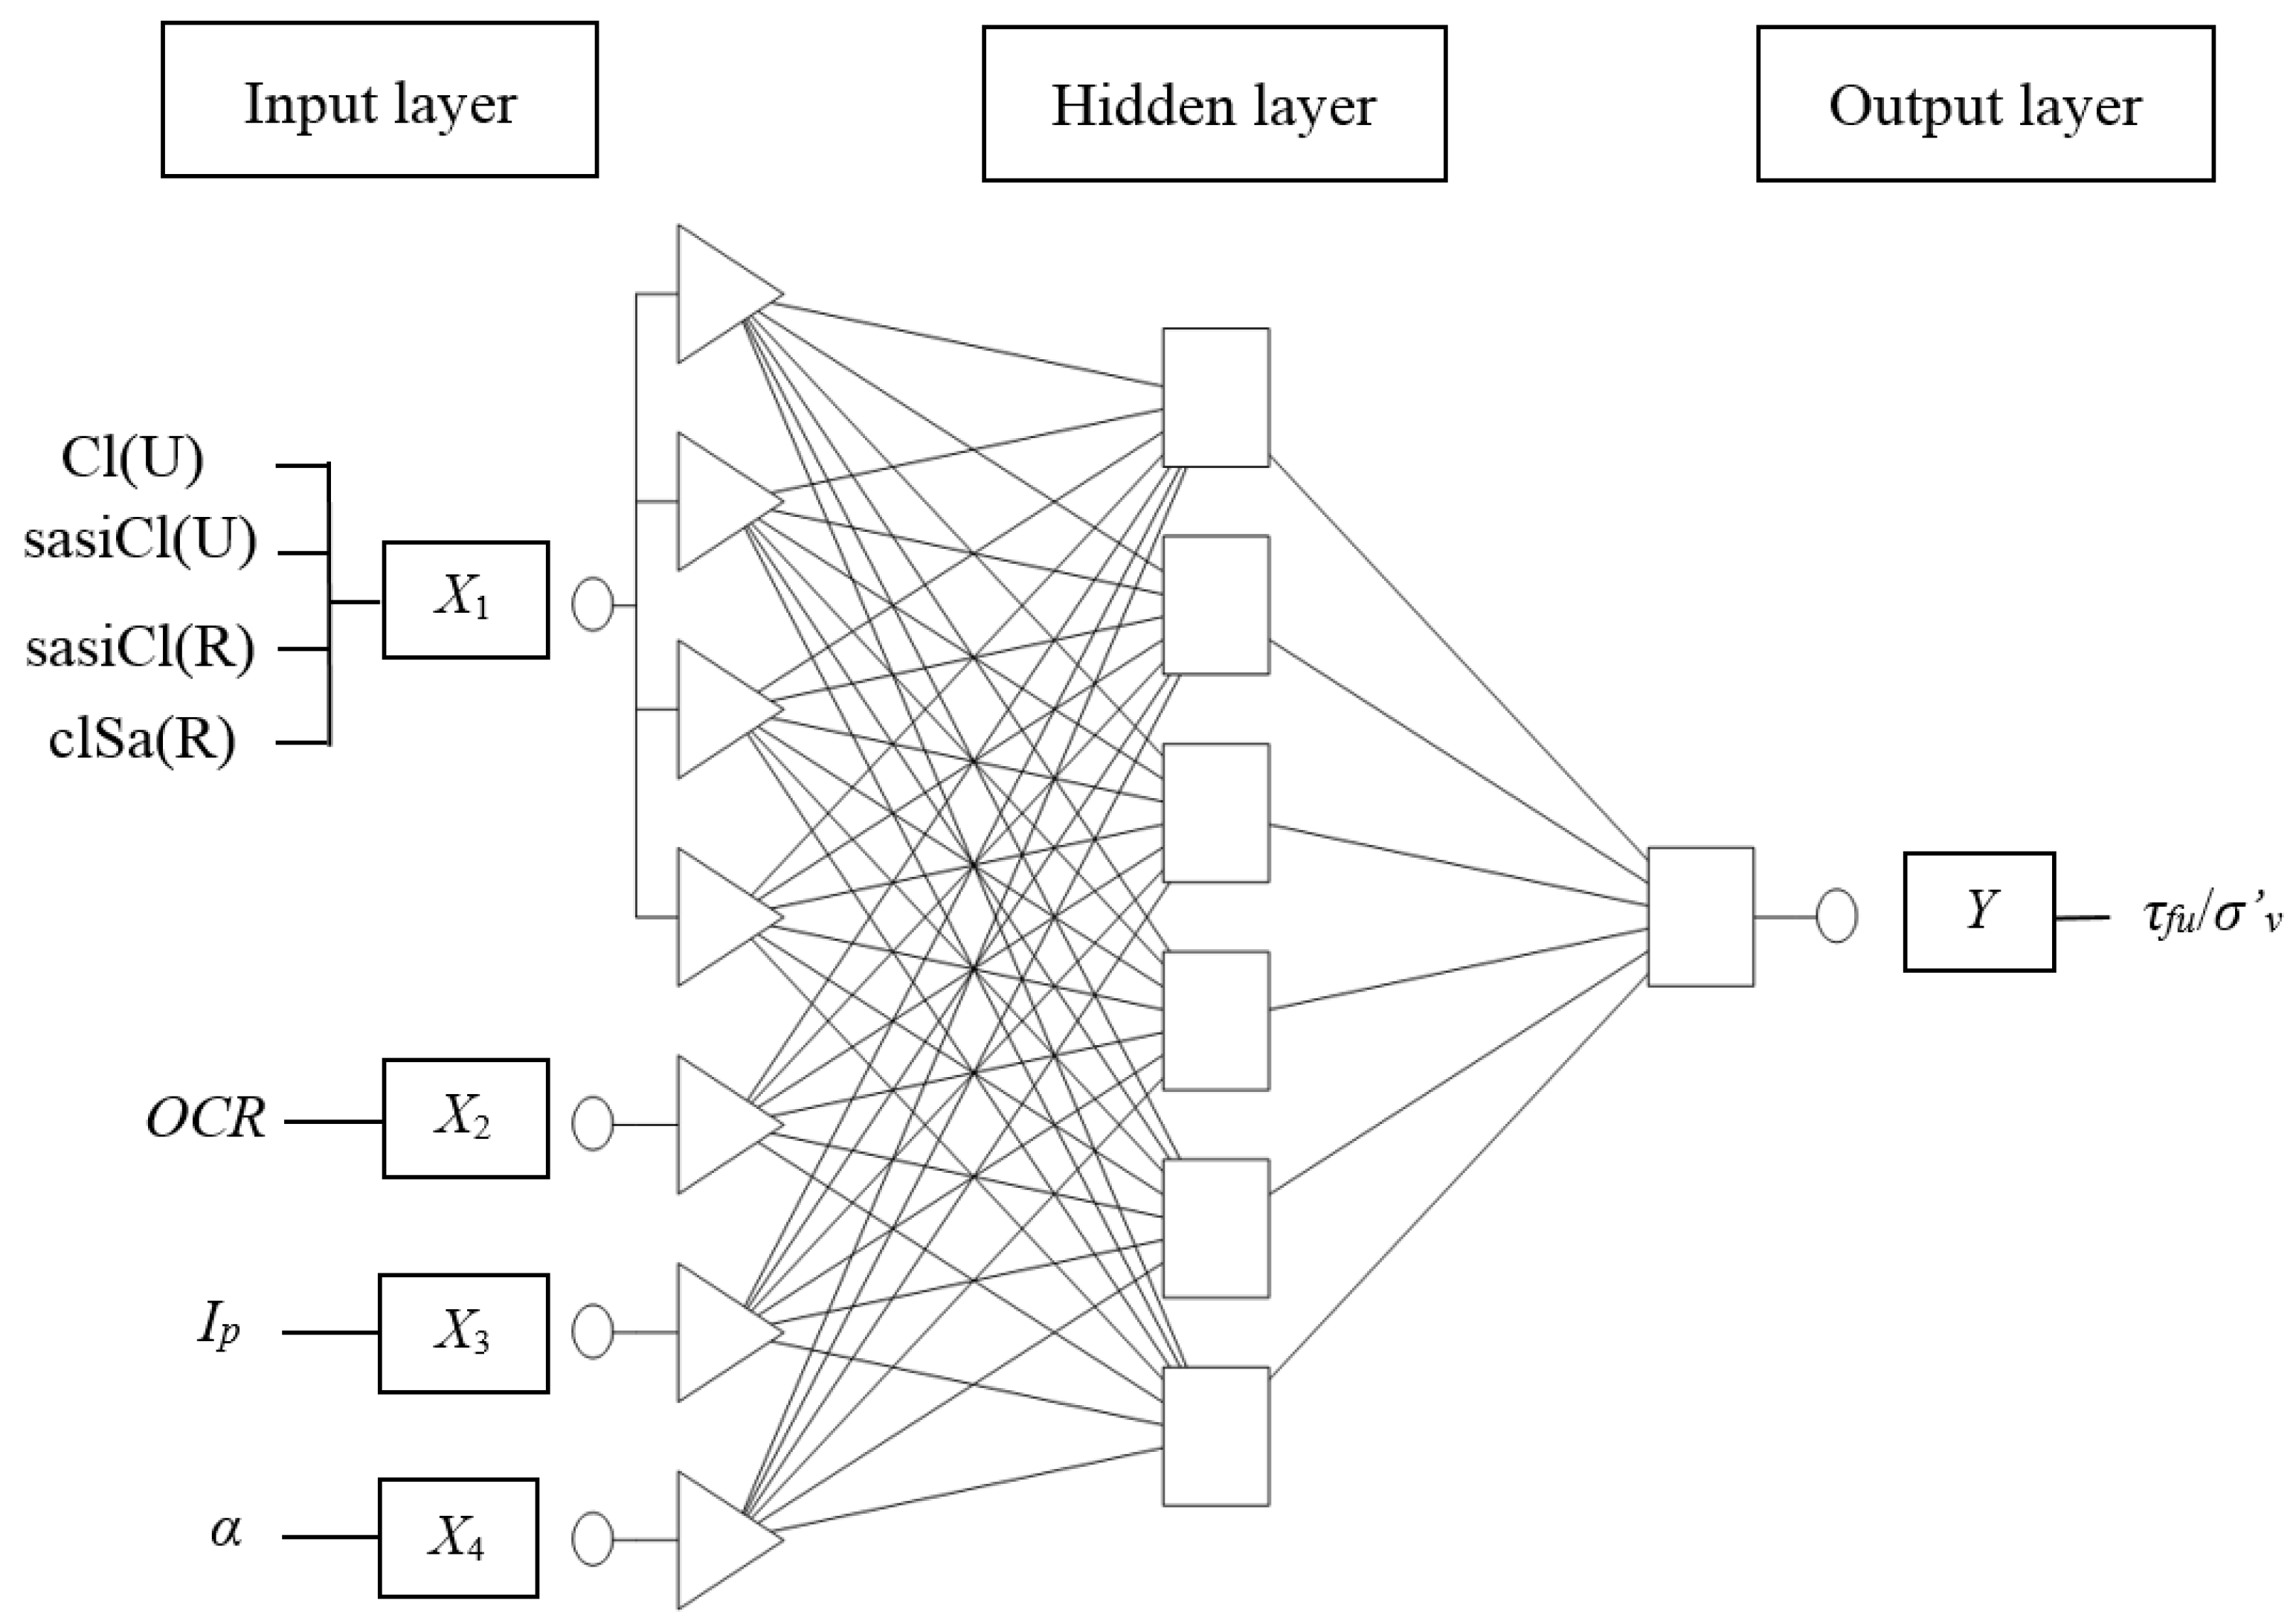
4.1. Architecture of the Artificial Neural Network

The class of neural network used in this study was a multilayer perceptron (MLP) with one hidden layer. The architecture of the network’s NHM type is defined by the number of nodes, N, in the input layer X1XN; the number of nodes, H, in the hidden layer; and the number of nodes, M = Y, in the output layer.
Neural networks were constructed according to the criterion of minimization of the error function, which was the sum of squares of differences (SOS), expressed by the following formula (for one output):
E S O S =   i = 1 P ( d i y i ) 2 ,
where P is the number of cases of set P, i ∈ {1, …, P}, di represents the known values of the tests, and yi corresponds to values predicted from neural networks.
Measures of errors were calculated separately for each subset: learning, L , testing, T , and validation, V . To assess the predictive quality of the neural network, values of error measures in the testing subset, T , were taken into account. Selected error measures for neural networks with one output are given by the following formulae:
Relative error (for individual cases):
R E i = | d i y i d i | · 100 % ,
Determination coefficient, R2:
R 2 = i = 1 P ( y i d ¯ i ) 2 i = 1 P ( d i d ¯ i ) 2 ,
Mean absolute error:
M A E = i = 1 P | d i y i | P ,
Root mean squared error:
R M S = 1 P · i = 1 P ( d i y i ) 2 ,
where di is the measured value, yi is the value predicted by the neural network, di is the measured mean value in a given subset, and denotes the case number from subsets L , T , or V with cardinality P, where i ∈ {1, ..., P}.

4.2. Datasets

Two datasets were used in the ANN analysis. Set A consisted of results of the TSHC tests, where nA was equal to 24 cases, described by the following five variables: X1 = soil type ∈ {Cl(U), sasiCl(U), sasiCl(R), clSa(R)} X2 = over-consolidation ratio, OCR ∈ {3.5, 2.7, 8.0}; X3 = plasticity index, IP ∈ {77.6, 34.7, 10.5%}; X4 = angle of principal stress rotation, α ∈ {0, 30, 45, 60, 90°} or {0, 15, 30, 45, 60, 75, 90°}; Y = normalized undrained shear strength, τfu/σ’v (Table 2). The variables used were selected based on statistical analysis [41]. Variable X1 was treated as a quality (linguistic) variable. Variable X1 required the introduction of as many input neurons as there were soils (i.e., four neurons) [46].
Set B was a set of “artificial” data, and consisted of nB = 340 cases, described by independent variables X1X3 shown in Table 2, and dependent variable Y, representing normalized undrained sheer strength, τfu/σ’v, calculated from Equations (3) and (4) using empirical coefficients shown in Table 2 for the independent variable, α, in the range 1–89° in 1° increments. Set B was used to create and train the neural networks. The selected artificial neural network was used to predict τfu/σ’v values based on new, actual data from the TSHC tests in set A .

4.3. Training and Testing

Set B was randomly assigned to 50%, 25%, and 25% of the learning, L , testing, T , and validation, V subsets, respectively. The testing subset was used to periodically check the generalizability acquired by the network, and the validation subset was used for the final evaluation of the trained neural network.
The predictive quality of the neural regression model was evaluated on the basis of error analysis, and calculated independently for the following subsets: learning, L , testing, T , and validation, V . Neural networks were optimized for the number of neurons in the hidden layer, the activation function in the neurons of the hidden and output layers, and the learning method. The conjugate gradient (CG) algorithm was chosen for network learning. An early-stopping method of training was used [47]. Learning was stopped after 35 learning cycles (epochs). Neural networks with the best predictive quality were determined on the basis of the highest values of the determination coefficient (R2), the lowest values of root mean squared errors (RMSs), and the lowest mean values of relative errors (REs) [47].
Based on the analysis of many neural networks, a neural network of 7–6–1 was selected, meaning seven input neurons, six neurons in one hidden layer, and one output neuron (Figure 6). Activation functions were identified. For the hidden neurons, this was a tanh sigmoid curve, and for the output neuron, this was a logistic function. The errors in the L , T , and V subsets of dataset B were small, while the determination coefficients (R2) were very high (Table 3). The relative prediction error (RE) of the proposed neural network had a maximum value of about ±3% (Figure 7) in all subsets of dataset B .
Statistical analysis performed by Wrzesiński [41] indicated that, from linear regression models (simple and multiple), the highest value of the determination coefficient was 0.951, and the lowest mean relative error was about ±20%.

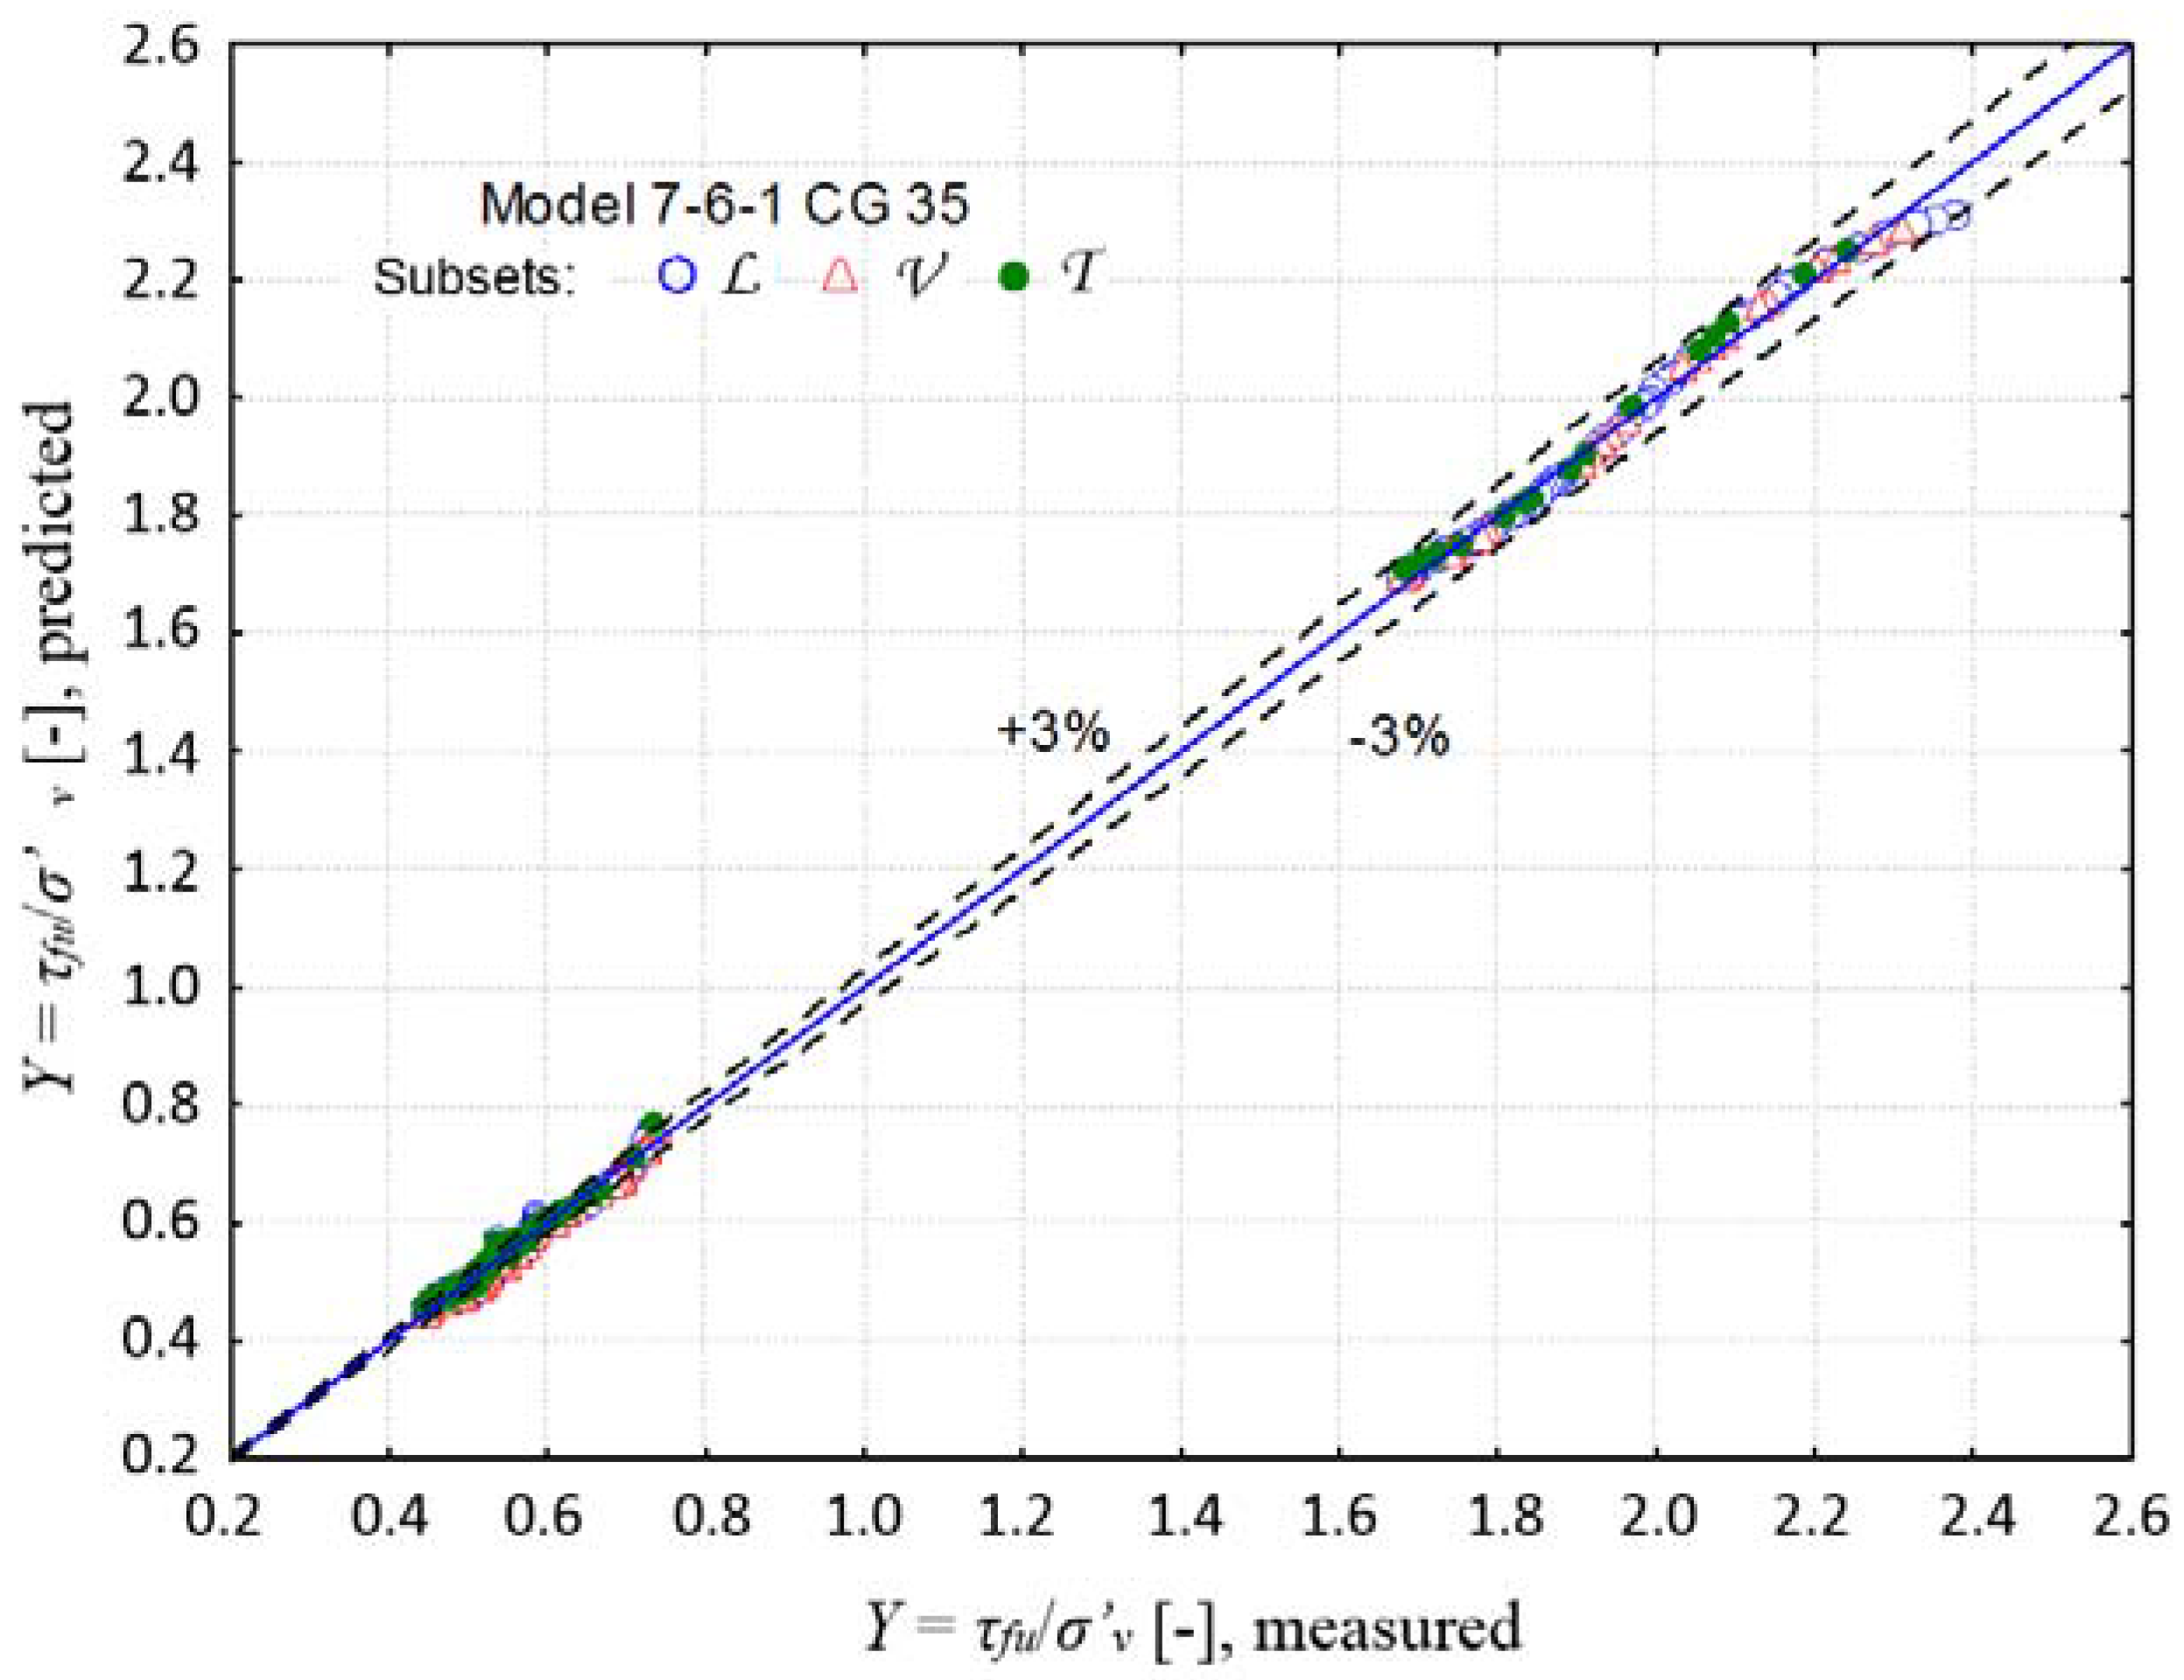
4.4. Neural Network Prediction

The trained artificial neural network, 7–6–1, was tested by applying it to the prediction of τfu/σ’v, based on laboratory data from set A . Independent variables X1, X2, X3, and X4 (Table 2) were introduced into the network, and τfu/σ’v values predicted by the network were obtained. A comparison between measured values of τfu/σ’v obtained from the TSHC tests and values of τfu/σ’v predicted using the proposed neural network 7–6–1 are shown in Table 4. The single maximum value of relative error was about 6%.

5. Conclusions

The presented neural network, with the architecture 7–6–1, predicted the real value of the variable, τfu/σ’v, based on the following data: soil type, over-consolidation ratio (OCR), plasticity index (IP), and angle of principal stress rotation (α) for tested pre-consolidated cohesive soils.
The 7–6–1 artificial neural network was selected with a determination coefficient of 0.998 and a mean relative error of around ±3% in set B , and the single maximum relative error was about 6%. It had better predictive quality of normalized undrained shear strength (τfu/σ’v) than linear regression models, where the highest determination coefficient was 0.951, and the lowest mean relative error was about ±20%.
Conclusions from the analysis only concern the tested types of cohesive soils. As further tests are carried out in the torsional shear hollow cylinder apparatus, the ANN models can be upgraded and extended, taking into account other soil types, and possibly generalizing for most types of cohesive soils.

Author Contributions

G.W. and Z.L. prepared research program, performed laboratory tests and prepared the manuscript. M.J.S. performed Artificial Neural Network analysis and prepared the manuscript.

Acknowledgments

This work, carried out in 2017–2018 at the Warsaw University of Life Sciences—SGGW and the Bialystok University of Technology, was supported by Polish financial resources on science.

Conflicts of Interest

The authors declare no conflict of interest.

References

  1. Jardine, R.J. One perspective of the pre-failure deformation characteristics of some geomaterials. Pre-failure Deformation of Geomaterials. Proc. Sapporo. Balkema Rotterdam. 1995, 2, 855–885. [Google Scholar]
  2. Lipiński, M.J.; Wdowska, M.K. A stress history and strain dependent stiffness of overconsolidated cohesive soil. Ann. Warsaw Univ. Life Sci.—SGGW Land Reclam. 2011, 43, 207–216. [Google Scholar] [CrossRef]
  3. Hight, D.W.; Gens, A.; Symes, M.J. The development of a new hollow cylinder apparatus for investigating the effects of principal stress rotation in soils. Géotechnique 1983, 33, 335–383. [Google Scholar] [CrossRef]
  4. Lade, V.P.; Kirkgard, M.M. Effects of stress rotation and changes of b-values on cross-anisotropic behavior of natural Ko consolidated soft clay. Soils Found. 2000, 40, 93–105. [Google Scholar] [CrossRef]
  5. Lin, H.; Penumadu, D. Experimental investigation on principal stress rotation in Kaolin Clay. J. Geotech. Geoenviron. Eng. 2005, 131, 633–642. [Google Scholar] [CrossRef]
  6. Nishimura, S.; Minh, N.A.; Jardine, R.J. Shear strength anisotropy of natural London Clay. Géotechnique 2007, 57, 49–62. [Google Scholar] [CrossRef]
  7. Rolo, R. The Anisotropic Stress-Strain-Strength Behavior of Brittle Sediments. Ph.D. Thesis, Imperial College, London, UK, 2003. [Google Scholar]
  8. Zdravković, L.; Jardine, R.J. The effects on anisotropy of rotating the principal stress axes during consolidation. Géotechnique 2001, 51, 69–83. [Google Scholar] [CrossRef]
  9. Bishop, A.W. The strength of soils as engineering materials. Géotechnique 1966, 16, 91–130. [Google Scholar] [CrossRef]
  10. Kulhavy, F.H.; Mayne, P.W. Manual on Estimating Soil Properties for Foundation Design; Report EK-6800; Electric Power Research Institute: Palo Alto, CA, USA, 1990. [Google Scholar]
  11. Ching, J.; Phoon, K.K. Multivariate distribution for undrained shear strength under various test procedures. Can. Geotech. J. 2013, 50, 907–923. [Google Scholar] [CrossRef]
  12. Houlsby, N.M.T.; Houlsby, G.T. Statistical fitting of undrained strength data. Géotechnique 2013, 63, 1253–1263. [Google Scholar] [CrossRef]
  13. Jang, D.; Park, H.; Choi, G. Estimation of Leakage Ratio Using Principal Component Analysis and Artificial Neural Network in Water Distribution Systems. Sustainability 2018, 10, 750. [Google Scholar] [CrossRef]
  14. Kang, P.-S.; Lim, J.-S.; Huh, C. Artificial Neural Network Model to Estimate the Viscosity of Polymer Solutions for Enhanced Oil Recovery. Appl. Sci. 2016, 6, 188. [Google Scholar] [CrossRef]
  15. Li, W.; Cui, L.; Zhang, Y.; Cai, Z.; Zhang, M.; Xu, W.; Zhao, X.; Lei, Y.; Pan, X.; Li, J.; et al. Using a Backpropagation Artificial Neural Network to Predict Nutrient Removal in Tidal Flow Constructed Wetlands. Water 2018, 10, 83. [Google Scholar] [CrossRef]
  16. Zhu, X.; Fan, Y.; Zhang, F.; Ye, X.; Chen, C.; Yue, H. Multiple-Factor Based Sparse Urban Travel Time Prediction. Appl. Sci. 2018, 8, 279. [Google Scholar] [CrossRef]
  17. Paez, T.L. Neural networks in mechanical systems simulation, identification and assessment. Shock Vibr. 1993, 1, 177–199. [Google Scholar] [CrossRef]
  18. Adeli, H. Neural Networks in Civil Engineering: 1989–2000. Comput.-Aided Civ. Inf. 2001, 16, 126–142. [Google Scholar] [CrossRef]
  19. Ghaboussi, J. Biologically inspired soft computing methods in structural mechanics and engineering. Struct. Eng. Mech. 2001, 11, 485–502. [Google Scholar] [CrossRef]
  20. Rojas, R. Neural Networks: A Systematic Introduction; Springer: Berlin, Germany, 1996. [Google Scholar]
  21. Waszczyszyn, Z. Advances of Soft Computing in Engineering; CISM Courses and Lectures; Springer: Wien, Austria; New York, NY, USA, 2010. [Google Scholar]
  22. Waszczyszyn, Z. Artificial neural networks in civil engineering: another five years of research in Poland. Comp. Assist. Mech. Eng. Sci. 2011, 18, 131–146. [Google Scholar]
  23. Rafiq, M.Y.; Bugmann, G.; Easterbrook, D.J. Neural network design for engineering applications. Comput. Struct. 2001, 79, 1541–1552. [Google Scholar] [CrossRef]
  24. Dihoru, L.; Muir Wood, D.; Sadek, T.; Lings, M. A neural network for error prediction in true triaxial apparatus with flexible boundaries. Comput. Geotech. 2005, 32, 59–71. [Google Scholar] [CrossRef]
  25. Pichler, B.; Lackner, R.; Mang, H.A. Back analysis of model parameters in geotechnical engineering by means of soft computing. Int. J. Numer. Meth. Eng. 2003, 57, 1943–1978. [Google Scholar] [CrossRef]
  26. Shahin, M.A.; Jaksa, M.B.; Maier, H.R. Artificial Neural Network applications in geotechnical engineering. Aust. Geomechan. 2001, 36, 49–62. [Google Scholar]
  27. Shahin, M.A.; Jaksa, M.B.; Maier, H.R. State of the art of Artificial Neural Networks in geotechnical engineering. Elect. J. Geotech. Eng. 2008, 8, 1–26. [Google Scholar]
  28. Tian, J.; Li, C.; Liu, J.; Yu, F.; Cheng, S.; Zhao, N.; Wan Jaafar, W.Z. Groundwater Depth Prediction Using Data-Driven Models with the Assistance of Gamma Test. Sustainability 2016, 8, 1076. [Google Scholar] [CrossRef]
  29. Sulewska, M.J. Applying artificial neural networks for analysis of geotechnical problems. Comp. Assist. Mech. Eng. Sci. 2011, 18, 231–241. [Google Scholar]
  30. Zhou, T.; Wang, F.; Yang, Z. Comparative Analysis of ANN and SVM Models Combined with Wavelet Preprocess for Groundwater Depth Prediction. Water 2017, 9, 781. [Google Scholar] [CrossRef]
  31. Basheer, I.A. Selection of methodology for neural network modeling of constitutive hysteresis behavior of soils. Comput.-Aided Civ. Inf. 2000, 15, 440–458. [Google Scholar] [CrossRef]
  32. Ellis, G.W.; Yao, C.; Zhao, R.; Penumadu, D. Stress-strain modeling of sands using artificial neural network. J. Geotech. Eng. 1995, 121, 429–435. [Google Scholar] [CrossRef]
  33. Fu, Q.; Hashash, Y.M.A.; Hung, S.; Ghaboussi, J. Integration of laboratory testing and constitutive modeling of soils. Comput. Geotech. 2007, 34, 330–345. [Google Scholar] [CrossRef]
  34. Najjar, Y.M.; Huang, C. Simulating the stress-strain behavior of Georgia kaolin via recurrent neuronet approach. Comput. Geotech. 2007, 34, 346–361. [Google Scholar] [CrossRef]
  35. Penumadu, D.; Zhao, R. Triaxial compression behavior of sand and gravel using artificial neural networks (ANN). Comput. Geotech. 1999, 24, 207–230. [Google Scholar] [CrossRef]
  36. Sidarta, D.E.; Ghaboussi, J. Constitutive modeling of geomaterials from non-uniform material test. Comput. Geotech. 1998, 22, 53–71. [Google Scholar] [CrossRef]
  37. Lee, S.J.; Lee, S.R.; Kim, Y.S. An approach to estimate unsaturated shear strength using artificial neural network and hyperbolic formulation. Comput. Geotech. 2003, 30, 489–503. [Google Scholar] [CrossRef]
  38. Das, S.K.; Basudhar, P.K. Undrained lateral load capacity of piles in clay using artificial neural network. Comput. Geotech. 2006, 33, 454–459. [Google Scholar] [CrossRef]
  39. Byeon, W.Y.; Lee, S.R.; Kim, Y.S. Application of flat DMT and ANN to Korean soft clay deposits for reliable estimation of undrained shear strength. Int. J. Offshore Pol. Eng. 2006, 16, 73–80. [Google Scholar]
  40. Kiziewicz, D. Evaluation of Shear Strength of Cohesive Soils with Use of Non-Standard Stress Path. Ph.D. Thesis, Warsaw University of Life Sciences, Warsaw, Poland, 2012. [Google Scholar]
  41. Wrzesiński, G. Stability Analysis of an Embankment with Influence of Principal Stress Rotation on the Shear Strength of Subsoil. Ph.D. Thesis, Warsaw University of Life Sciences, Warsaw, Poland, 2016. [Google Scholar]
  42. EN ISO 14688-1. Geotechnical Investigation and Testing—Identification and Classification of Soil—Part 1: Identification and Description; International Organization for Standardization: Geneva, Switzerland, 2002. [Google Scholar]
  43. EN ISO 14688-2. Geotechnical Investigation and Testing—Identification and Classification of Soil—Part 2: Principles for a Classification; International Organization for Standardization: Geneva, Switzerland, 2004. [Google Scholar]
  44. Wrzesiński, G.; Lechowicz, Z. Influence of the rotation of principal stress directions on undrained shear strength. Ann. Warsaw Univ. Life Sci.—SGGW Land Reclam. 2013, 45, 183–192. [Google Scholar] [CrossRef]
  45. Wrzesiński, G.; Lechowicz, Z. Testing of undrained shear strength in a Hollow Cylinder Apparatus. Studia Geotechnica et Mechanica 2015, 37, 69–73. [Google Scholar] [CrossRef]
  46. Masters, T. Practical Neural Network Recipes in C++; Academic Press: New York, NY, USA, 1993. [Google Scholar]
  47. Bishop, C.M. Neural Networks for Pattern Recognition; Oxford University Press: Oxford, UK, 1995. [Google Scholar]
Figure 1. Torsional shear hollow cylinder apparatus (TSHCA) in the Water Center Laboratory at the Warsaw University of Life Sciences (SGGW). (1) TSHC apparatus cell, (2) pressure and volume controllers, (3) electronic measuring device, (4) computer.
Applsci 08 00781 g001
Figure 2. An example of a soil sample in the shape of a hollow cylinder.
Applsci 08 00781 g002
Figure 3. Selected soil samples after the TSHC tests.
Applsci 08 00781 g003
Figure 4. Relationship describing the index of change in undrained shear strength for clayey sand clSa(R).
Applsci 08 00781 g004
Figure 5. Undrained shear strengths based on Equation (3), Equation (5), and Bishop’s relation for clayey sand clSa(R).
Applsci 08 00781 g005
Figure 6. Architecture of the two-layer artificial neural network, 7–6–1 conjugate gradient (CG) 35.
Applsci 08 00781 g006
Figure 7. Comparison between measured values of independent variable Y, τfu/σ’v, and values of Y predicted by proposed neural network, 7–6–1, in set B .
Applsci 08 00781 g007
Table 1. Index properties of the tested soils [40,41].
Soil type [42]wL (%)wP (%)IL (-)IC (-)Fraction [43] (%)
GrSaSiCl
Cl(U)112.935.3−0.061.06053659
sasiCl(U)
sasiCl(R)
59.024.30.130.870215029
clSa(R)19.48.70.750.250701911
Notes: wL—liquid limit, wP—plastic limit, IL—liquidity index, IC—consistency index. Gr—gravel, Sa—sand, Si—silt, Cl—clay, R—reconstituted, U—undisturbed.
Table 2. Results of the TSHC tests for clay (Cl), sandy silty clay (sasiCl), and clayey sand (clSa), as well as empirical coefficients for Equation (5) [40,41,45].
Soil Type (X1)Over-Consolidation Ratio OCR (-) (X2)Plasticity Index IP (%) (X3)Angle of the Principal Stress Rotation α (°) (X4)Undrained Shear Strength τfu (kPa)Effective Vertical Stress σ’v (kPa)Normalized Undrained Shear Strength τfu/σ’vo (-) (Y)Coefficients of Equation (5)
aoa1n
Cl(U)3.577.60228.53100.7370.34−0.802
30201.80.651
45178.50.576
60172.40.556
90160.10.516
sasiCl(U)2.734.70129.32200.5880.52−2.142
15125.80.572
30117.70.535
45106.60.485
60101.40.461
7599.80.454
9098.40.447
sasiCl(R)2.734.70118.72200.540.64−0.202
15117.50.534
30115.20.524
45110.60.503
60107.40.488
75105.50.48
90104.20.478
clSa(R)810.50193.2802.415−0.311.362
30159.91.999
45152.71.909
60143.61.795
90134.11.676
Table 3. Measures of network errors in the 7–6–1 network of subsets L , T , and V of set B . MAE: mean absolute error; R2: coefficient of determination; RMS: root mean squared error.
Measures of ErrorsSubset learning, Subset testing, 𝒯 Subset validation, 𝒱
RMS0.00570.00540.0052
MAE0.01090.01100.0105
R20.9980.9980.998
Table 4. Comparison between measured values of τfu/σ’v obtained from the TSHC tests and values of τfu/σ’v predicted using the proposed neural network 7–6–1, in set A .
No.Measured Values τfu/σ’v from Set A di (-)Predicted Values τfu/σ’v Based on 7–6–1 Network yi (-)Relative Errors of Individual Case REi (%)
10.7370.7755.16
20.6510.6342.61
30.5760.592.43
40.5560.5540.36
50.5160.5120.77
60.5880.6124.08
70.5720.5582.45
80.5350.522.8
90.4850.4911.24
100.4610.4681.52
110.4540.4550.22
120.4470.4521.12
130.540.5725.92
140.5340.5310.56
150.5240.54.58
160.5030.484.57
170.4880.473.69
180.480.472.08
190.4780.4780
202.4152.3223.85
211.9992.0191
221.9091.8851.26
231.7951.7890.33
241.6761.6941.07
Max RE13 = 5.92%

