Failure Pattern Transition of Shape Memory NiTi Foam Subjected to Compression: From Quasi-Static to Dynamic

Key Laboratory of Urban Security and Disaster Engineering of Ministry of Education, Beijing University of Technology, Beijing 100124, China
*
Author to whom correspondence should be addressed.
Appl. Sci. 2018, 8(5), 741; https://doi.org/10.3390/app8050741
Submission received: 22 April 2018
/
Revised: 4 May 2018
/
Accepted: 5 May 2018
/
Published: 8 May 2018
(This article belongs to the Section Materials Science and Engineering)
Abstract
:Featured Application
Shape memory cellular alloy combines the merits of shape memory effect and exceptional energy absorption capacity, having potential applications in automobile and other industries by promoting multiple crushing mitigation capacity.
Abstract
Shape memory alloy can recover its original configuration, while lightweight foam can absorb a considerable amount of energy. It is desirable to test whether shape memory foam has merits in terms of both shape memory effect and exceptional energy absorption capacity. In the present study, shape memory NiTi foam is compressed quasi-statically and dynamically in order to investigate its response and failure pattern transition with an increasing loading rate. A universal testing machine is used in a quasi-static test, while the split Hopkinson pressure bar is employed in the dynamic test. It is observed that the NiTi foam fails differently: under a quasi-static load, small foam parts of various sizes fall off from the specimen fringe; meanwhile, under dynamic load, the foam fractures in the specimen center to split it into multiple pieces. The underlying failure mechanisms accounting for the shape memory foam behavior under different loading rates are discussed.
1. Introduction
Shape memory alloy (SMA) is widely applied in various applications [1], especially in the form of wires and bars [2,3,4,5]. Foam and porous materials have exceptional properties in some aspects compared to their solid counterparts with the same mass, such as their strength-to-density ratio, fireproof nature, and thermal and sound isolation; thus, they are a versatile material with multiple applications. Easily manufactured even from recycled beverage cans [6], its excellent energy absorption capacity [7,8] makes it a promising candidate for structure protection against highly dynamic loads such as blast and impact. For instance, it can be used as the core of sandwich sacrificial claddings for building protection [9,10], the inner layer of blast chambers [11], and as the crush mitigation layer for automobiles and water vehicles [7]. Recently, a simple and cost-effective method for the mass production of open-cell metal/alloy foam is reported, in which the foam parameters can be accurately controlled [12].
It is natural to consider combining both merits of SMA and foam/porous structures to fabricate porous SMA or SMA foam. Among the various SMA foam manufacture methods, various sintering methods [13,14] are frequently applied, while three-dimensional (3D) interconnected microchannels with steel wire spaceholders [15] is an alternative approach to fabricate NiTi porous structures. The quasi-static loading and recovery property of shape memory foam is investigated [16], and a theoretical model is established to accurately represent the properties analytically [17]. SMA foam finds its wide application in biomedical engineering with relatively small application strain, where it is applied quasi-statically and the deformed SMA almost recovers to its original configuration [18].
When it comes to applications in protective engineering, things are different. On the one hand, due to the uncertain nature of the loading (generally impact and blast), the maximum strain cannot be guaranteed to be kept below a certain value under which recovery is almost complete; on the other hand, the loading is highly dynamic, and may lead to a shape memory foam response that is different from that subjected to a quasi-static load. However, the failure mode of shape memory foam exceeding its recovery strain under a quasi-static load until failure is rarely reported, as well as under the dynamic load. As a result, in the present study, the failure pattern of shape memory NiTi foam subjected to both quasi-static and dynamic loads is investigated, in which the strain exceeds the allowable recovery value. The research has significant implications on whether the shape memory NiTi foam is suitable for applications in protective engineering against impact and blast, and the possible issues to be addressed before successful industrial application. Shape memory NiTi foam with a relative density (defined as the ratio of foam density to base material density) of 45% of the base materials is experimentally tested.
2. Materials and Test Methods
2.1. Static Compression and Recovery
All of the specimens used in this study are cut from two identical pieces of NiTi foam panel with dimensions of 100 mm by 100 mm (thickness ranges from 7 mm to 14 mm), one of which is shown in Figure 1. Specimens with 25-mm diameters were cut from one piece, while other specimens of 40-mm diameter were cut from the other foam piece. Electrical discharge machining was used to cut the specimens. Examination of each specimen after cutting suggested that they were almost uniform, and no obvious defects (i.e., crack or larger void than the general size) were found. Considering that the average thickness of all of the specimens was 10 mm, we assume that all of the specimens in the current study are uniform and of the same size. All of the specimens had a relative density of 45%. The specimens with 40-mm diameters were used in the quasi-static test, while those with a 25-mm diameter were used in the dynamic test.
Before a dynamic test of the recovery capacity of the NiTi foam, a quasi-static test of the recovery ability of these foams was carried out. For each test, a specimen with a 40-mm diameter was loaded by an Instron test machine, at loading rate 0.4 mm/min. Two groups of tests have been done: three specimens were compressed to 10% strain, recover, and cycle five times, while another three specimens underwent similar loading, but to a 20% compressive strain and cycle four times. For each recovery, the compressed specimen was heated in an oven for one hour at a constant temperature of 95 °C.
2.2. Dynamic Compression and Recovery
Five specimens of 25 mm in diameter and roughly 10 mm in thickness were tested. All of the specimens were cut from the same NiTi foam plate with a relative density of 45%; thus, they can be considered as having exactly the same properties. The split Hopkinson pressure bar (SHPB) system is widely accepted as one of the standard tests for dynamic material properties; therefore, it is applied in the current study, as shown in Figure 2. Amongst these options, one sample was tested under 1 MPa gas gun pressure, while two specimens were tested for both 1.5 MPa and 2 MPa gas gun pressures, respectively. After each loading by the SHPB, the specimen is put into the furnace and heated at 95 °C for one hour. These three groups of tests are looked into and discussed separately.
3. Test Results with Discussions
3.1. Recovery Capacity of NiTi Foam Subjected to Static Load with Discussions
The states of the specimens after 10% strain compressive loading and after recovery are shown in Figure 3.
The maximum strain of NiTi bulk material under static loading is 10% [1], beyond which the shape memory effect will be damaged. Therefore, to illustrate the advantage of NiTi foam over its solid counterpart in terms of deformability with shape memory effect maintained, 10% strain is chosen, and 20% strain is chosen as twice the maximum strain of NiTi bulk with shape memory effect unaffected.
The test results Figure 4 suggest that the strength of the shape memory foam increases initially, and then decreases with the increasing cycling number. The initial strengthening is caused by the compression and incomplete recovery: for each loading cycle, although only 10% overall compressive strain is applied, the NiTi foam cannot fully recover to the unloaded configuration, as seen from Table 1 and Table 2.
Take the first cycle of compression and recovery of the 10% strain case as an example. Before test, the diameter is 40.00 mm, and the thickness is 12.20 mm, while after compression and recovery, the diameter becomes 40.18 mm, and the thickness becomes 11.92 mm. First, it is clear that the specimen diameter increases and the thickness decreases. Furthermore, a simple calculation suggests that the volume of the specimen decreases, leading to increased relative foam density, and hence increased strength. It is the competing mechanism between consolidation due to densification and damage accumulation due to multiple loading that determines the foam strength in each cycle. With this underlying mechanism, both observations for 10% and 20% strain can be analyzed in a unified criterion. On one hand, loading causes the densification of the foam, whose density increases as the volume of foam specimen decreases, even after recovery by heating. A relatively denser foam after loading provide a higher stress–strain curve compared with those with less dense foam, which has a strengthening effect. On the other hand, multiple loading and recovery induces damage accumulation, which has a weakening effect of the foam. Therefore, initial loading cycles enhance the foam, leading to a higher stress–strain curve in the next cycle, and further loading exceeding a cycle number induces damage accumulation. In addition, the response and recovery of bulk NiTi are examined [19], which shows that among the five loading cycles: in the initial two loading cycles, the strength is relative low while in the third and fourth loading cycles, the strength goes high. When it comes to the fifth cycle, the stress–strain curve lowers. Despite the difference between the stress–strain curves of the NiTi foam and its counterpart bulk solid, the two material perform similarly with increasing cycle numbers in terms of strength.
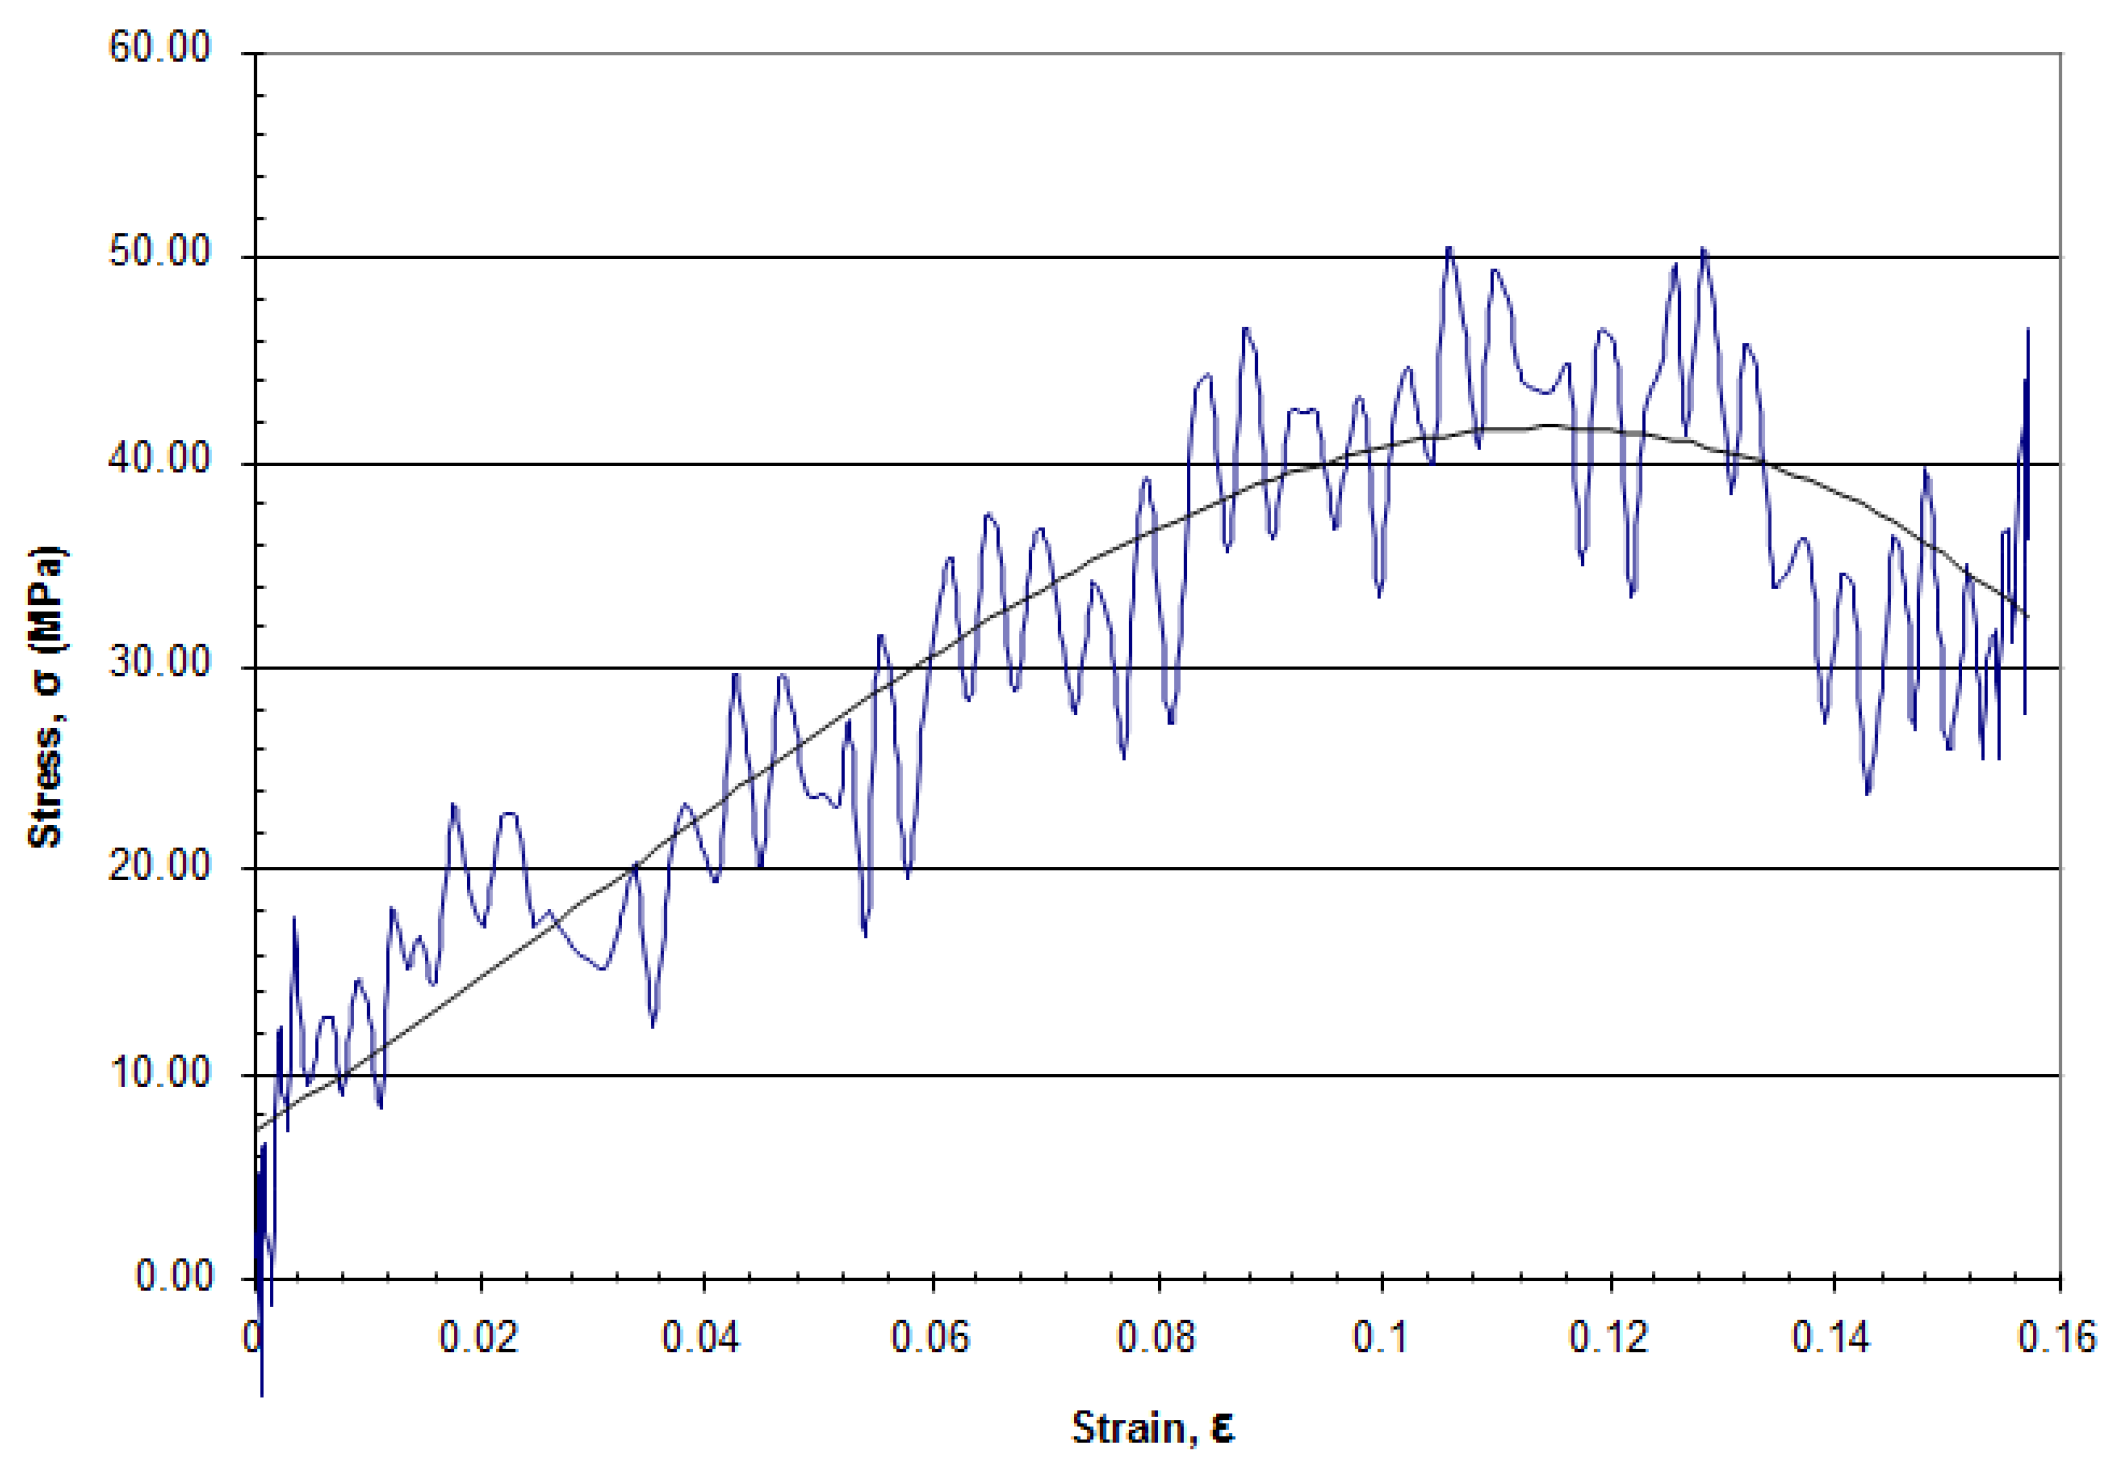
A failure test was carried out to investigate the failure pattern and ultimate strength of the NiTi foam under quasi-static compressive loading. Figure 5 shows generally that the stress–strain relationship is a straight line, indicating that the stress increases with strain almost linearly, which is different from that of low-density metal foam, which has a stress plateau. At 25% strain, a short and sharp drop occurs, corresponding to the detachment of the foam part at the specimen fringe, as shown in Figure 5. With the progress of the 0.4 mm/min compression, more foam parts gradually break apart from the fringe. From 37% strain corresponding to around 160 MPa stress, the NiTi foam parts continue to fall off the specimen, which results in a disrupted pattern in the stress–strain relationship.
Figure 6 shows the failure pattern of the crushed specimen after the test. Foam parts with various sizes at the specimen fringe fall off, while the central part of the specimen remains intact. With such a failure mode, it is obvious that even if all the fallen parts and the main part can recover completely when heated, the load-bearing capacity of the NiTi foam specimen permanently degrades.
The fall-off mass during loading at 20%, 25%, and 37% are 0.61 g, 1.13 g, and 4.25 g, respectively. Finally, the loading stopped at 45% strain, where some parts amounting to 5.58 g were observed. The fall-off mass measuring method is that the fall-off parts were removed at regular strain intervals, and the masses were weighed and recorded. Subsequently, the mass to a certain strain can be determined by gradually adding the incremental fall-off mass.
3.2. Recovery Capacity of NiTi Foam Subjected to Dynamic Load with Discussions
For each specimen in the SHPB test, the thickness and diameters of the specimen before loading, after loading, and after recovery, as well as the velocity of the striker bar, are recorded in Table 3. It is worth noting that the recovery is effective, but the efficiency is not 100%, implying that the foam undergoes plastic deformation in the present study.
Figure 7 shows the relationship between the dynamic nominal stress (force over the undeformed specimen’s cross-section area) and nominal strain (shortening over undeformed specimen thickness) of a specimen subjected to 1.0 MPa of gas gun pressure and recovery three times. In addition to the original readings, smoothed trend lines with a high frequency signal filtered are drawn to show the dynamic relationship. It is interesting to find that the strength of the foam increases as the number of loading and recovery cycles increases. In particular, the increase in the first loading and recovery is remarkable. The mechanism is that although the NiTi foam can recover when heated, it cannot recover to its original undeformed state. For the same reasons as the compression/recovery, the relative density of the foam increases with the test number for the same specimen, hence the increased dynamic stress–strain relationship.
Subjected to 1.5 MPa of gas gun pressure, the increase in the foam strength is also observed for both specimens tested.
Strain rate is defined as the derivative of strain with respect to time. It is a measurement of loading speed: the higher the loading speed, the higher the strain rate. It is the property of a material (especially the strength) under dynamic loading, and is often characterized by the Cowper–Symonds relationship:
where σd and σy are the dynamic and quasi-static strength; is the strain rate; and D and q are Cowper–Symonds coefficients. The D and q of steel are 600 and 5, implying that the steel is rate-sensitive while the D and q of aluminum are 6500 and 4, respectively, meaning that aluminum is rate-insensitive.
As to the NiTi foam behavior indicated in Figure 7a and Figure 8a of the current study, the gas gun launching pressures of 1.0 MPa and 1.5 MPa generates a striker velocity of 14.1 m/s and 16.7 m/s, respectively. Subsequently, the compressive loading speeds onto the specimen are different, resulting in different loading rates. From the figures, it is observed that the higher the strain rate, the higher the dynamic strength of the NiTi foam, which implies that the NiTi foam is a rate-sensitive material.
When specimen 1 after the SHPB tests is examined, it is found that under the first loading, some major cracks initiate in the center and propagate through the whole specimen, but the cracked specimen remains as an entire piece, as shown in Figure 9a. However, in the second test, the cracks develop and the specimen falls into pieces, as shown in Figure 9b. The failure prevents the specimen to be tested in the subsequent loading cycles, which accounts for why different specimens undergo different numbers of loadings. Again, it is observed that the dynamic strengths of the second test of both specimens under 1.5 MPa loading are higher than those of the first test.
When zoomed-in, the foam failure is clear: some joints fracture and disconnect with adjacent parts, as illustrated in Figure 10.
For the same reason, the test stops for both specimens after the first loading cycle when subjected to 2.0 MPa of gas gun pressure, because the specimen surface becomes significantly smaller and uneven with broken joints. Thus, further loading does not make sense. As expected, the strain rate effect of this NiTi foam is significant when compared with the first test for each specimen under lower loading intensities, as shown in Figure 7a, Figure 8a and Figure 11. The higher the strain rate, the higher the dynamic strength.
The failure pattern of NiTi foam subjected to dynamic load is significantly different from that subjected to quasi-static load: major cracks initiate and develop in the specimen center under dynamic loading. The mechanism is that dynamic compression in the out-of-plane direction leads to a quick expansion in the in-plane direction (the plane refer to the specimen round surface), resulting in quick tension in the in-plane direction. While material tends to become brittle when loaded with a relatively higher strain rate, and recall that the largest tensile stress occurs in the disc center, cracks initiate and develop in the center. On the contrary, while the foam disc is compressed quasi-statically, there is sufficient time for the stress to distribute. Then, the joint failure does not initiate at the center; instead, small foam parts fall off the fringe. The different failure patterns suggest that the shape memory NiTi foam deforms differently when subjected to different loading rates.
In fact, the three major factors governing the mechanical properties (such as stiffness and strength) of the porous/cellular solids are porosity (or relative density, which is defined as the ratio of foam density to density of the bulk materials from which the foam is made), pore size, and pore distribution. However, almost all of the current theories on cellular solids, including metal foam (ductile) and foam concrete (brittle), focus on the dependency of foam property on only the relative density, and neglect the effect of the pore size and pore distribution. It is believed that the influence of pore size and pore distribution on foam properties is also important and worth investigating, for which a considerable amount of test data are required. We will examine it in the future.
4. Conclusions
Shape memory NiTi foam with 45% relative density is compressed both quasi-statically and dynamically in order to investigate the response transition with increasing loading rate. Throughout the load cycles, the foam specimens are loaded with strains exceeding the recoverable NiTi limit, which exhibits the damage accumulation under different loading conditions. Subjected to quasi-static load, small foam parts of various sizes peel off from the specimen fringe, while under dynamic load, the foam fractures in the specimen center to split the foam specimen into multiple pieces. The strain rate effect is remarkable: the higher the loading rate, the higher the foam stress.
Author Contributions
X.W. designed the experiments and analyzed the test data; H.Z. conceived the idea and wrote the paper.
Acknowledgments
The funding support from National Natural Science Foundation of China (Project No. 51778028) is gratefully acknowledged.
Conflicts of Interest
The authors declare no conflict of interest.
References
- Jani, J.M.; Leary, M.; Subic, A.; Gibson, M.A. A review of shape memory alloy research, applications and opportunities. Mater. Des. 2014, 56, 1078–1113. [Google Scholar] [CrossRef]
- Seo, J.; Kim, Y.C.; Hu, J.W. Pilot study for investigating the cyclic behavior of slit damper systems with recentering shape memory alloy (SMA) bending bars used for seismic restrainers. Appl. Sci. 2015, 5, 187–208. [Google Scholar] [CrossRef]
- Panton, B.; Oliveira, J.P.; Zeng, Z.; Zhou, Y.N.; Khan, M.I. Thermomechanical fatigue of post-weld heat treated NiTi shape memory alloy wires. Int. J. Fatigue 2016, 92, 1–7. [Google Scholar] [CrossRef]
- Ng, S.B.; Huang, W.M.; Shu, D.W. Plastic energy and tearing energy of a NiTi shape memory alloy wire. Mater. Des. 2008, 29, 1066–1069. [Google Scholar] [CrossRef]
- Gadot, B.; Martinez, O.R.; Roscoat, S.R.; Bouvard, D.; Rodney, D.; Orgéas, L. Entangled single-wire NiTi material: A porous metal with tunable superelastic and shape memory properties. Acta Mater. 2015, 96, 311–323. [Google Scholar] [CrossRef]
- Gibson, L.J.; Ashby, M.F. Cellular Solids: STRUCTURES and Properties, 2nd ed.; Cambridge University Press: Cambridge, UK, 1997. [Google Scholar]
- Lu, G.X.; Yu, T.X. Energy Absorption of Structures and Materials; CRC Press: Boca Raton, FL, USA, 2003. [Google Scholar]
- Ashby, M.F.; Evans, A.; Fleck, N.A.; Gibson, L.J.; Hutchinson, J.W.; Wadley, H.N.G. Metal Foams: A Design Guide; Butterworth-Heinmann: Woburn, MA, USA, 2000. [Google Scholar]
- Zhou, H.Y.; Ma, G.W.; Li, J.D.; Zhao, Z.Y. Design of metal foam cladding subjected to close-range blast. J. Perform. Constr. Facil. 2015, 29, 04014110. [Google Scholar] [CrossRef]
- Xia, Y.; Wu, C.Q.; Liu, Z.X.; Yuan, Y.M. Protective effect of graded density aluminium foam on RC slab under blast loading—An experimental study. Constr. Build. Mater. 2016, 111, 209–222. [Google Scholar] [CrossRef]
- Shen, J.H.; Lu, G.X.; Zhao, L.M.; Zhang, Q.M. Short sandwich tubes subjected to internal explosive loading. Eng. Struct. 2013, 55, 56–65. [Google Scholar] [CrossRef]
- Soni, B.; Biswas, S. Mass-scale processing of open-cell metallic foams by pressurized casting method. J. Porous Mater. 2017, 24, 29–37. [Google Scholar] [CrossRef]
- Bassani, P.; Panseri, S.; Ruffini, A.; Montesi, M.; Ghetti, M.; Zanotti, C.; Tampieri, A.; Tuissi, A. Porous NiTi shape memory alloys produced by SHS: Microstructure and biocompatibility in comparison with Ti2Ni and TiNi3. J. Mater. Sci. Mater. Med. 2014, 25, 2277–2285. [Google Scholar] [CrossRef] [PubMed]
- Xu, J.L.; Bao, L.Z.; Liu, A.H.; Jin, X.J.; Tong, Y.X.; Luo, J.M.; Zhong, Z.C.; Zheng, Y.F. Microstructure, mechanical properties and superelasticity of biomedical porous NiTi alloy prepared by microwave sintering. Mater. Sci. Eng. C 2015, 46, 387–393. [Google Scholar] [CrossRef] [PubMed]
- Bewerse, C.; Emery, A.A.; Brinson, L.C.; Dunand, D.C. NiTi porous structure with 3D interconnected microchannels using steel wire spaceholders. Mater. Sci. Eng. A 2015, 634, 153–160. [Google Scholar] [CrossRef]
- Kaya, M.; Cakmak, O. Shape Memory behavior of porous NiTi alloy. Metall. Mater. Trans. A 2016, 47, 1499–1503. [Google Scholar] [CrossRef]
- Karamooz Ravari, M.R.; Kadkhodaei, M.; Ghaei, A. A unit cell model for simulating the stress-strain response of porous shape memory alloys. ASM Int. 2015, 24, 4096–4105. [Google Scholar] [CrossRef]
- Lou, L.; He, H.; Li, Y.M.; Zhu, C.Q.; Chen, Z.Y.; Liu, C. Effects of high O contents on the microstructure, phase-transformation behaviour, and shape-recovery properties of porous NiTi-based shape-memory alloys. Mater. Des. 2016, 106, 37–44. [Google Scholar] [CrossRef]
- Nathal, M.V.; Krause, D.L.; Wilmoth, N.G.; Bednarcyk, B.A.; Baker, E.H. Three-Dimensional Cellular Structures Enhanced by Shape Memory Alloys; NASA/TM-2014-218324; Glenn Research Center: Cleveland, OH, USA, 2014. [Google Scholar]
Figure 1.
NiTi foam specimen: (a) cut from a foam panel; (b) single specimen put in the center of testing machine.
Figure 1.
NiTi foam specimen: (a) cut from a foam panel; (b) single specimen put in the center of testing machine.

Figure 2.
Illustration of the split Hopkinson pressure bar (SHPB) at Construction Lab, Nanyang Technological University, Singapore.
Figure 2.
Illustration of the split Hopkinson pressure bar (SHPB) at Construction Lab, Nanyang Technological University, Singapore.

Figure 3.
Illustration of a specimen (a) after quasi-static loading and (b) after recovery by heating (view angle are slightly different).
Figure 3.
Illustration of a specimen (a) after quasi-static loading and (b) after recovery by heating (view angle are slightly different).
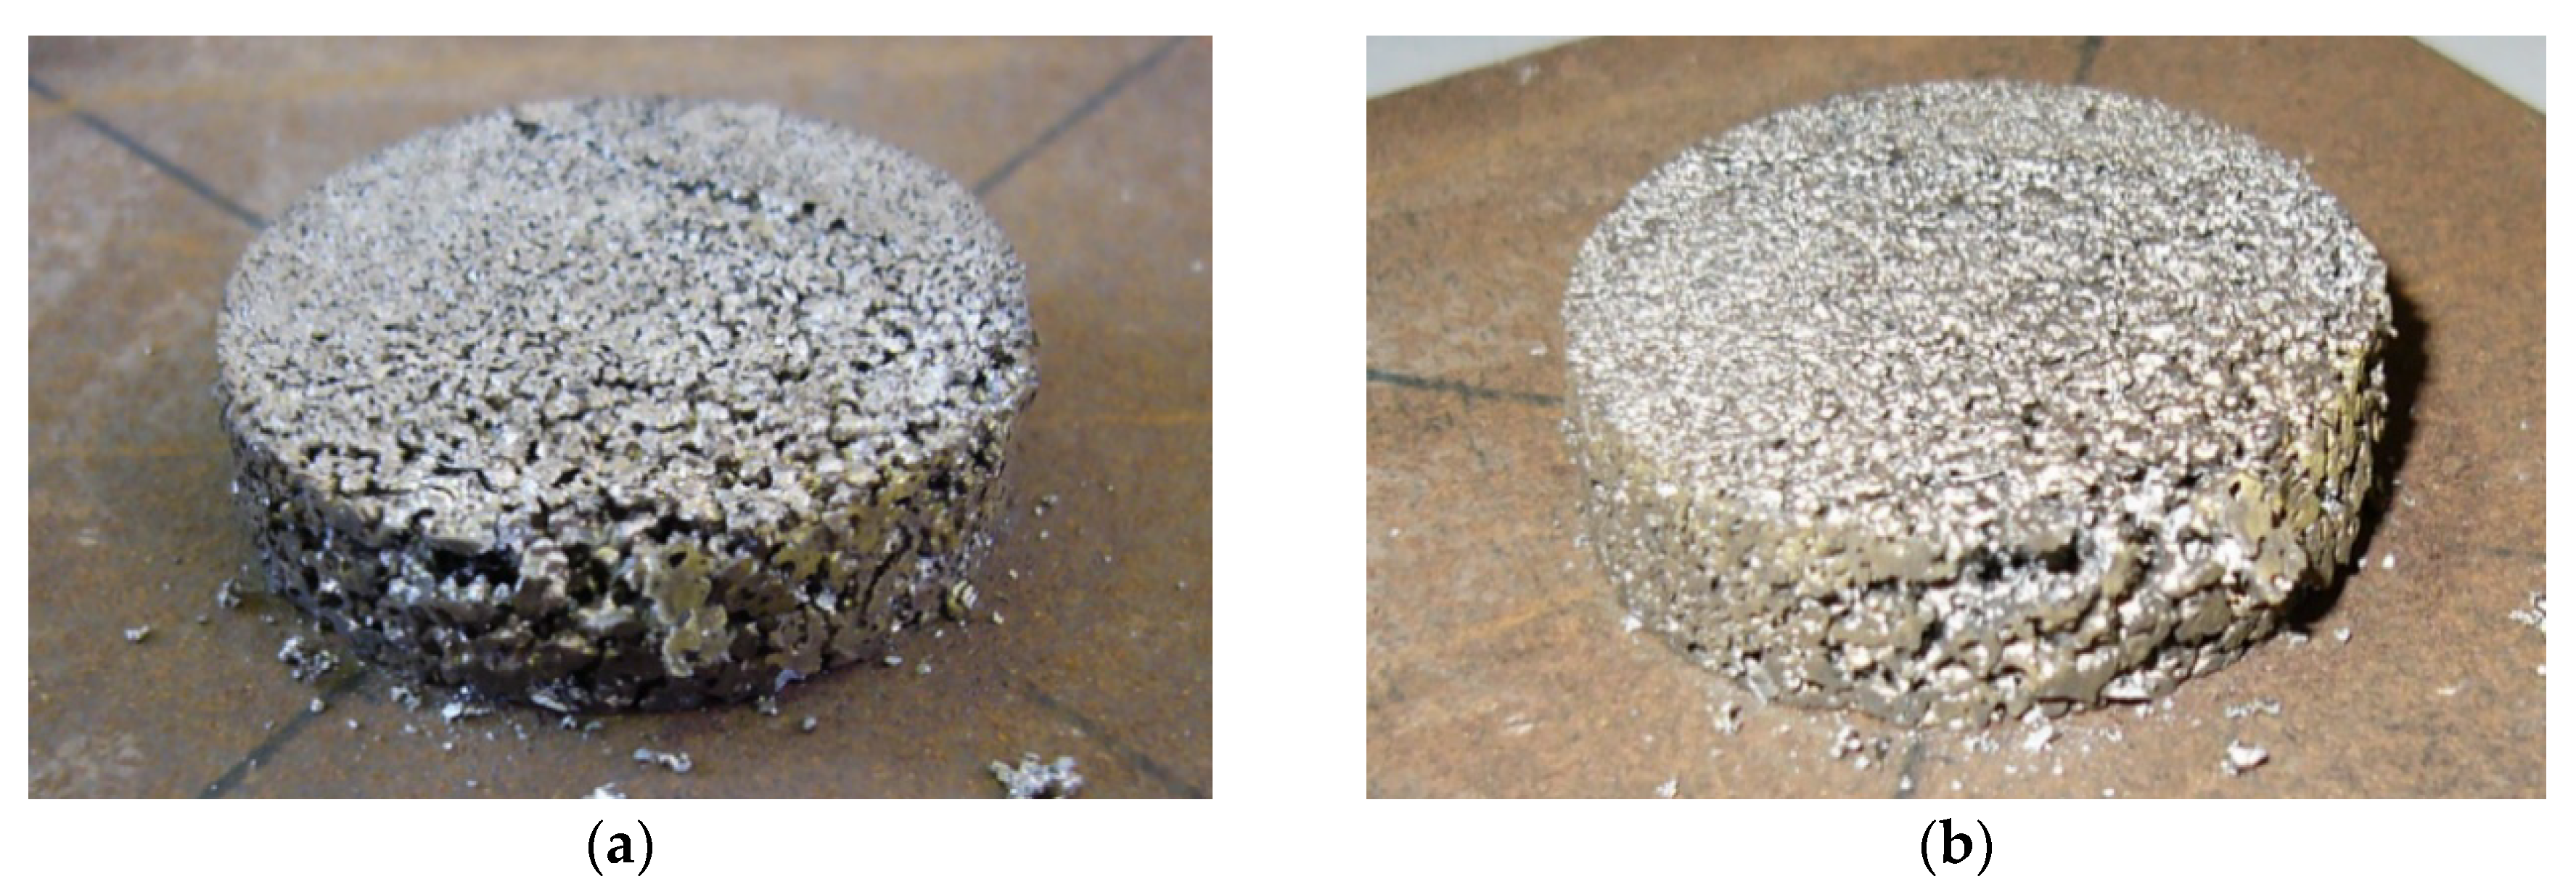
Figure 4.
Stress–strain relationship of cyclic quasi-static compression: (a) 10% strain; (b) 20% strain.
Figure 4.
Stress–strain relationship of cyclic quasi-static compression: (a) 10% strain; (b) 20% strain.

Figure 5.
Stress–strain relationship of quasi-static failure test.
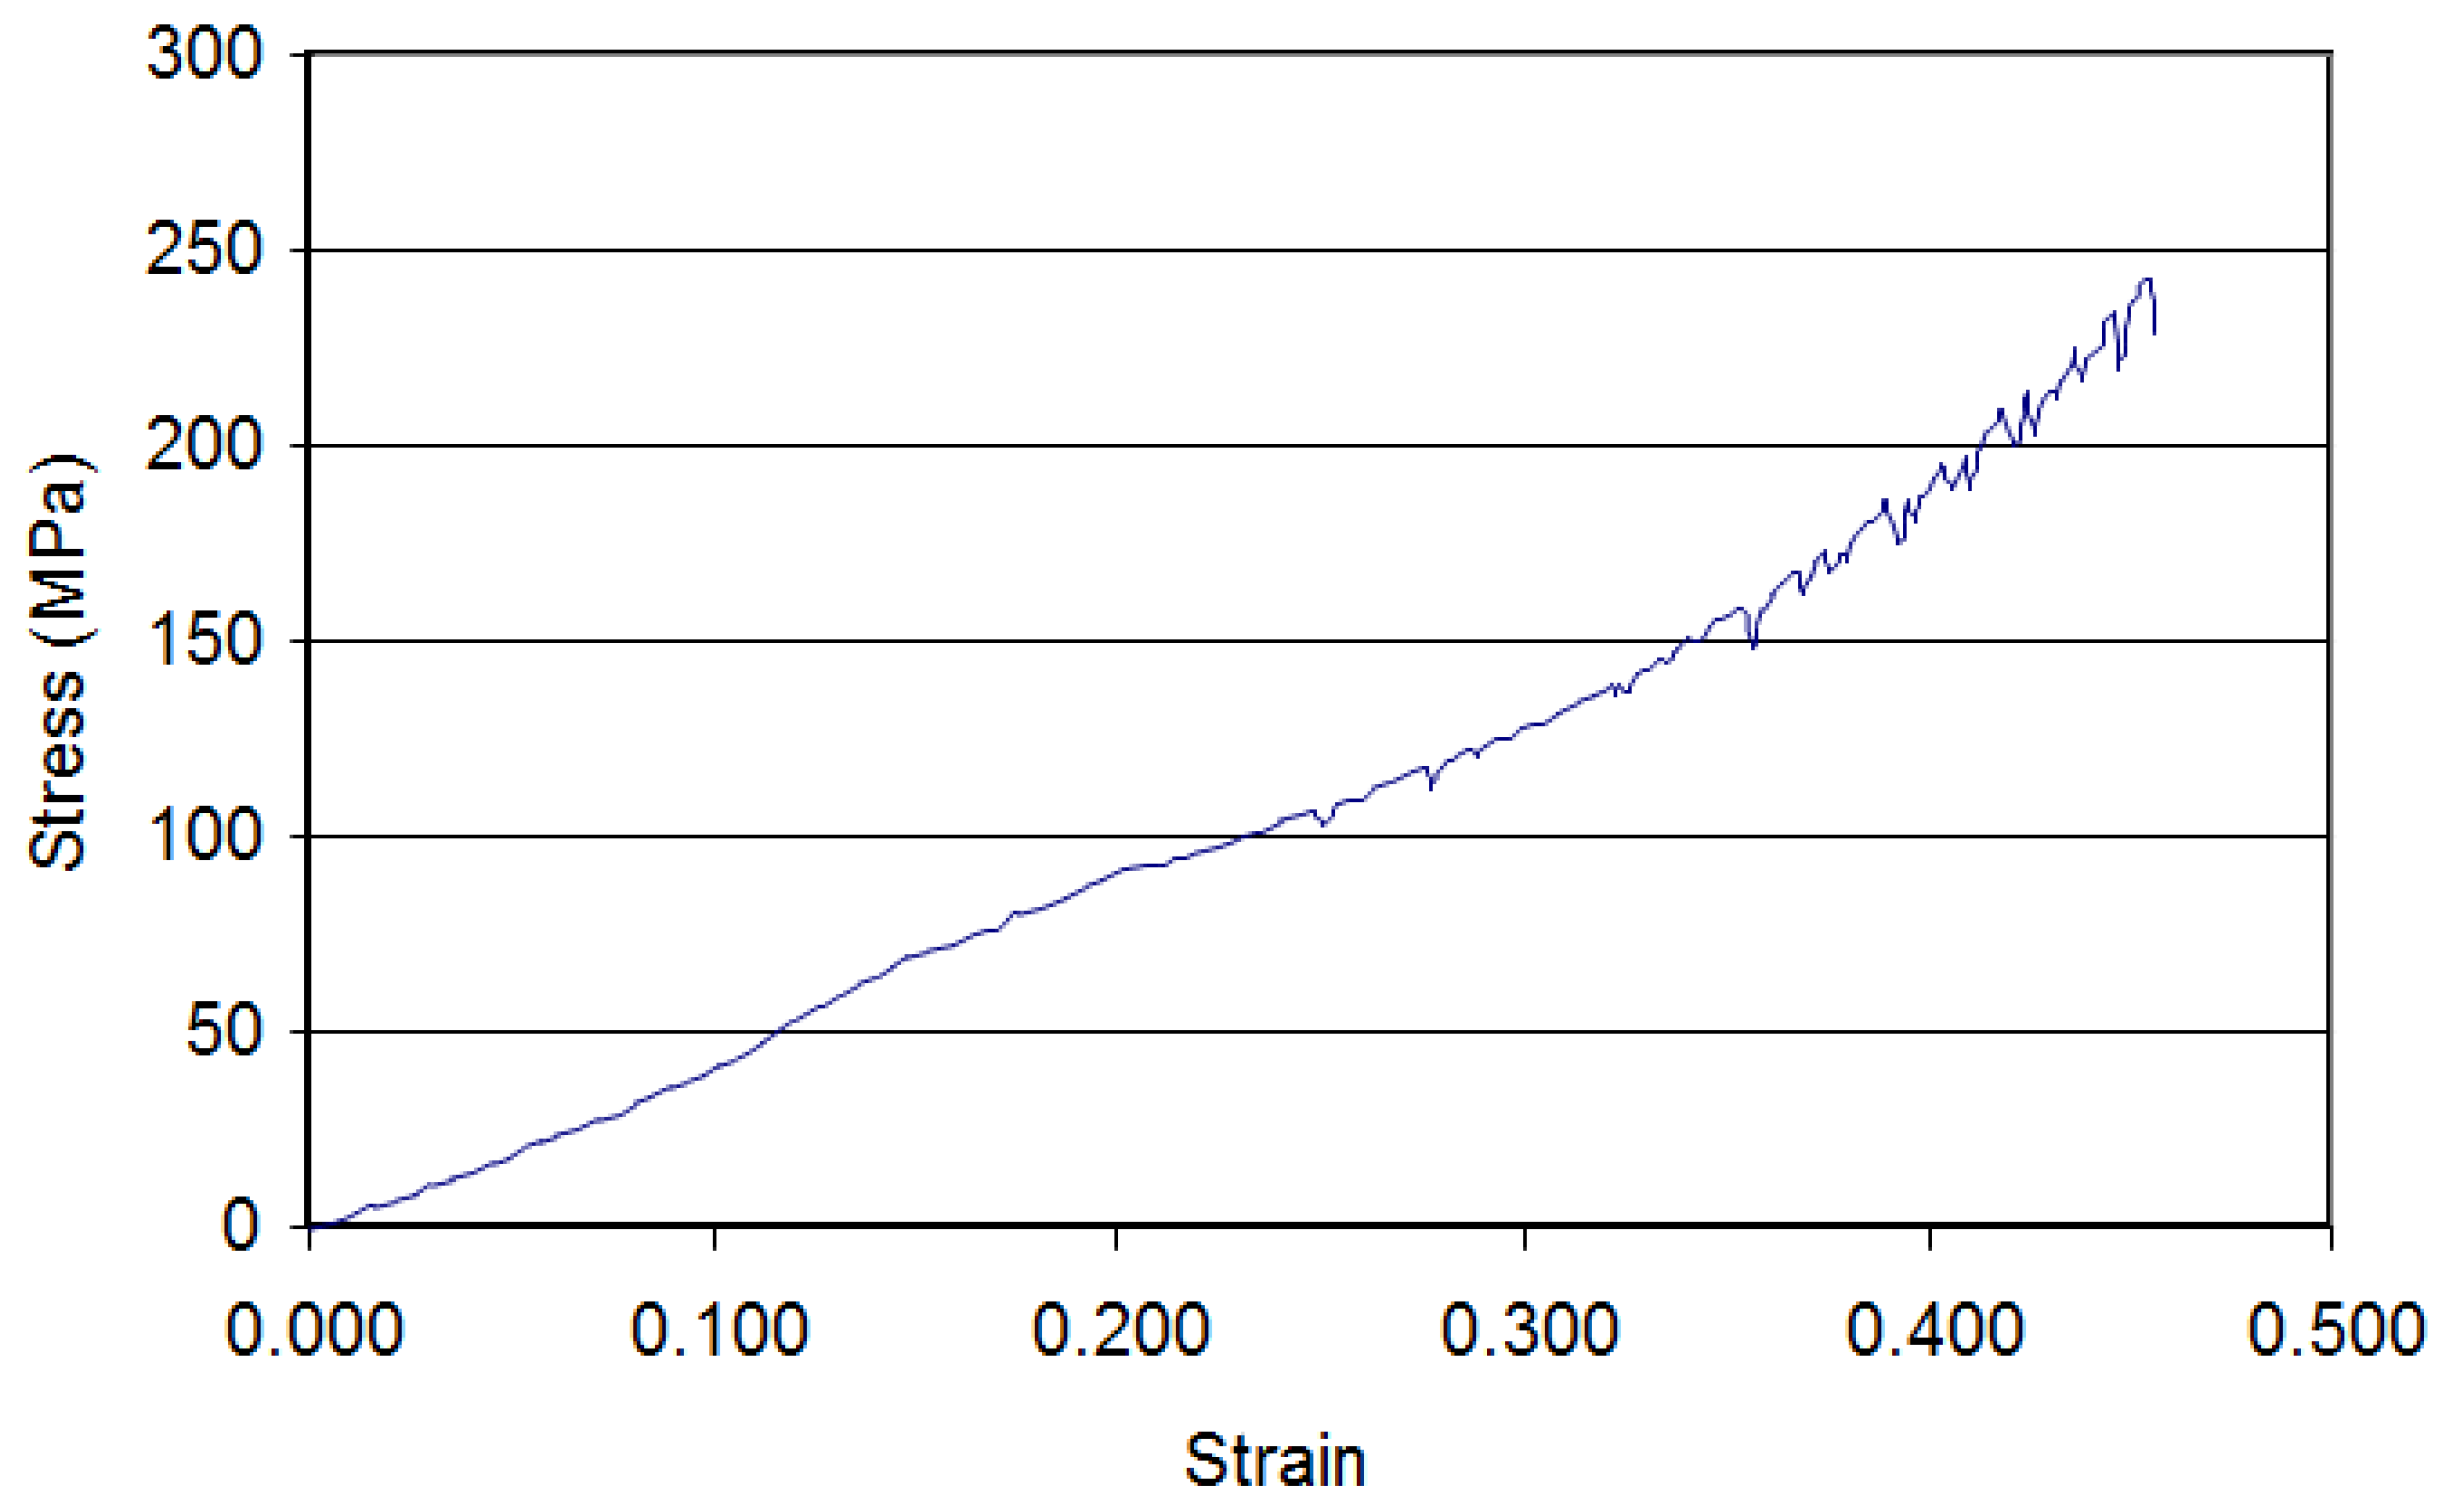
Figure 6.
Specimen after quasi-static failure test: (a) plan view; (b) side view.
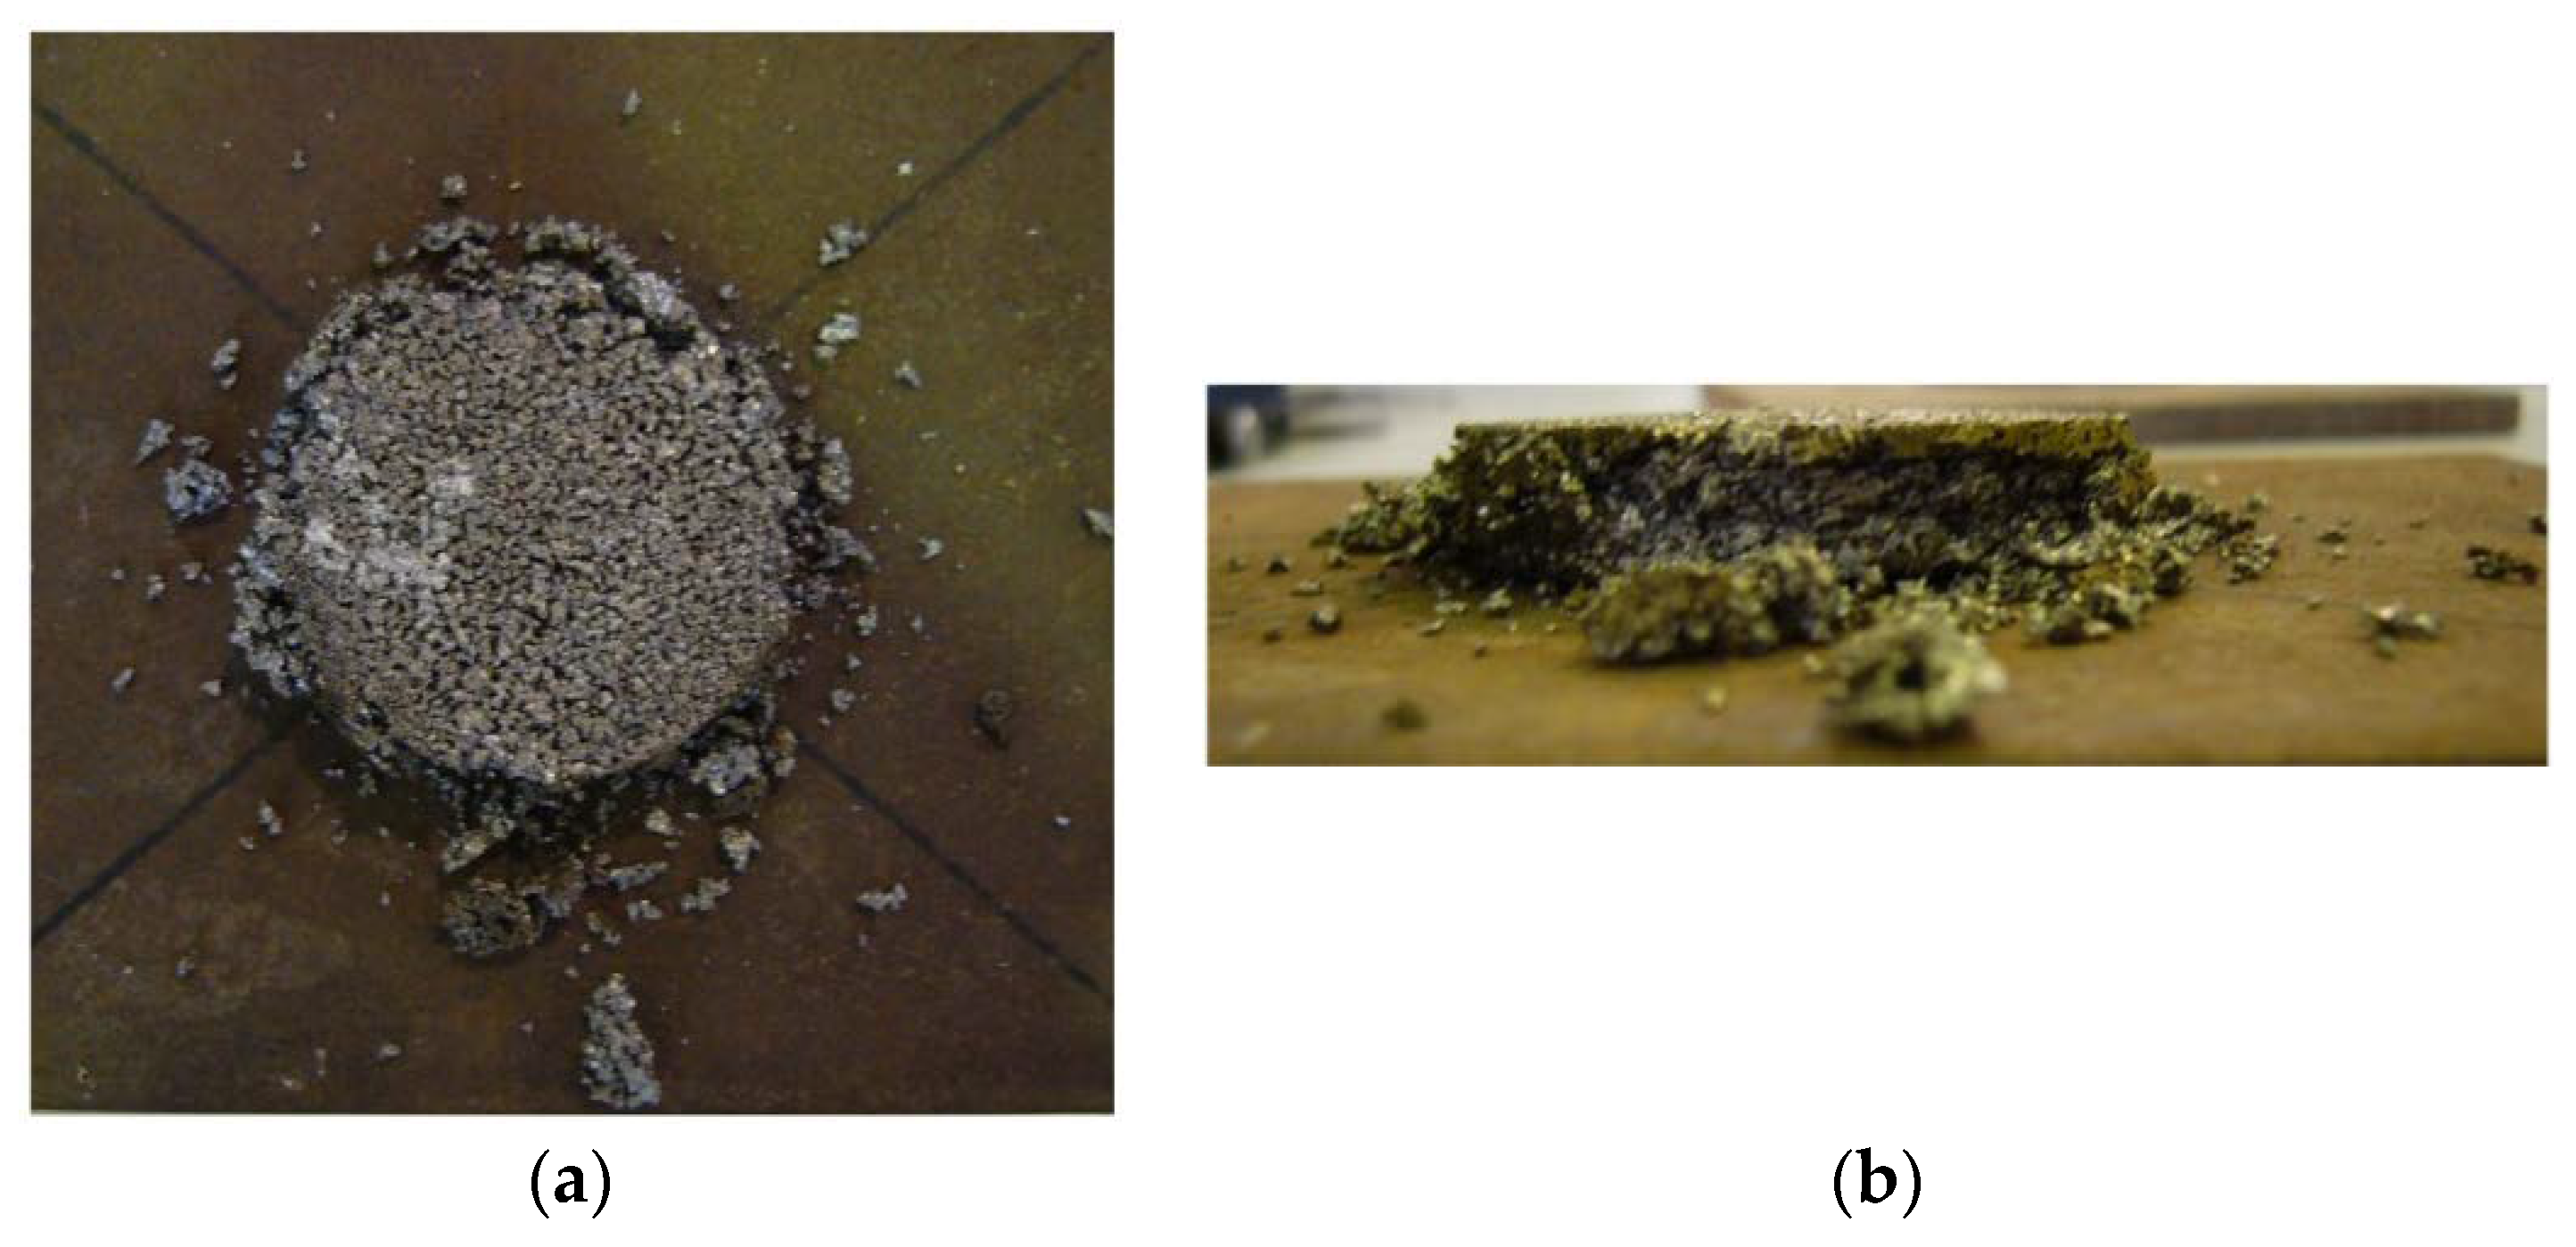
Figure 7.
Nominal stress vs. nominal strain-1.0 MPa: (a) first test; (b) second test; (c) third test; (d) fourth test.
Figure 7.
Nominal stress vs. nominal strain-1.0 MPa: (a) first test; (b) second test; (c) third test; (d) fourth test.
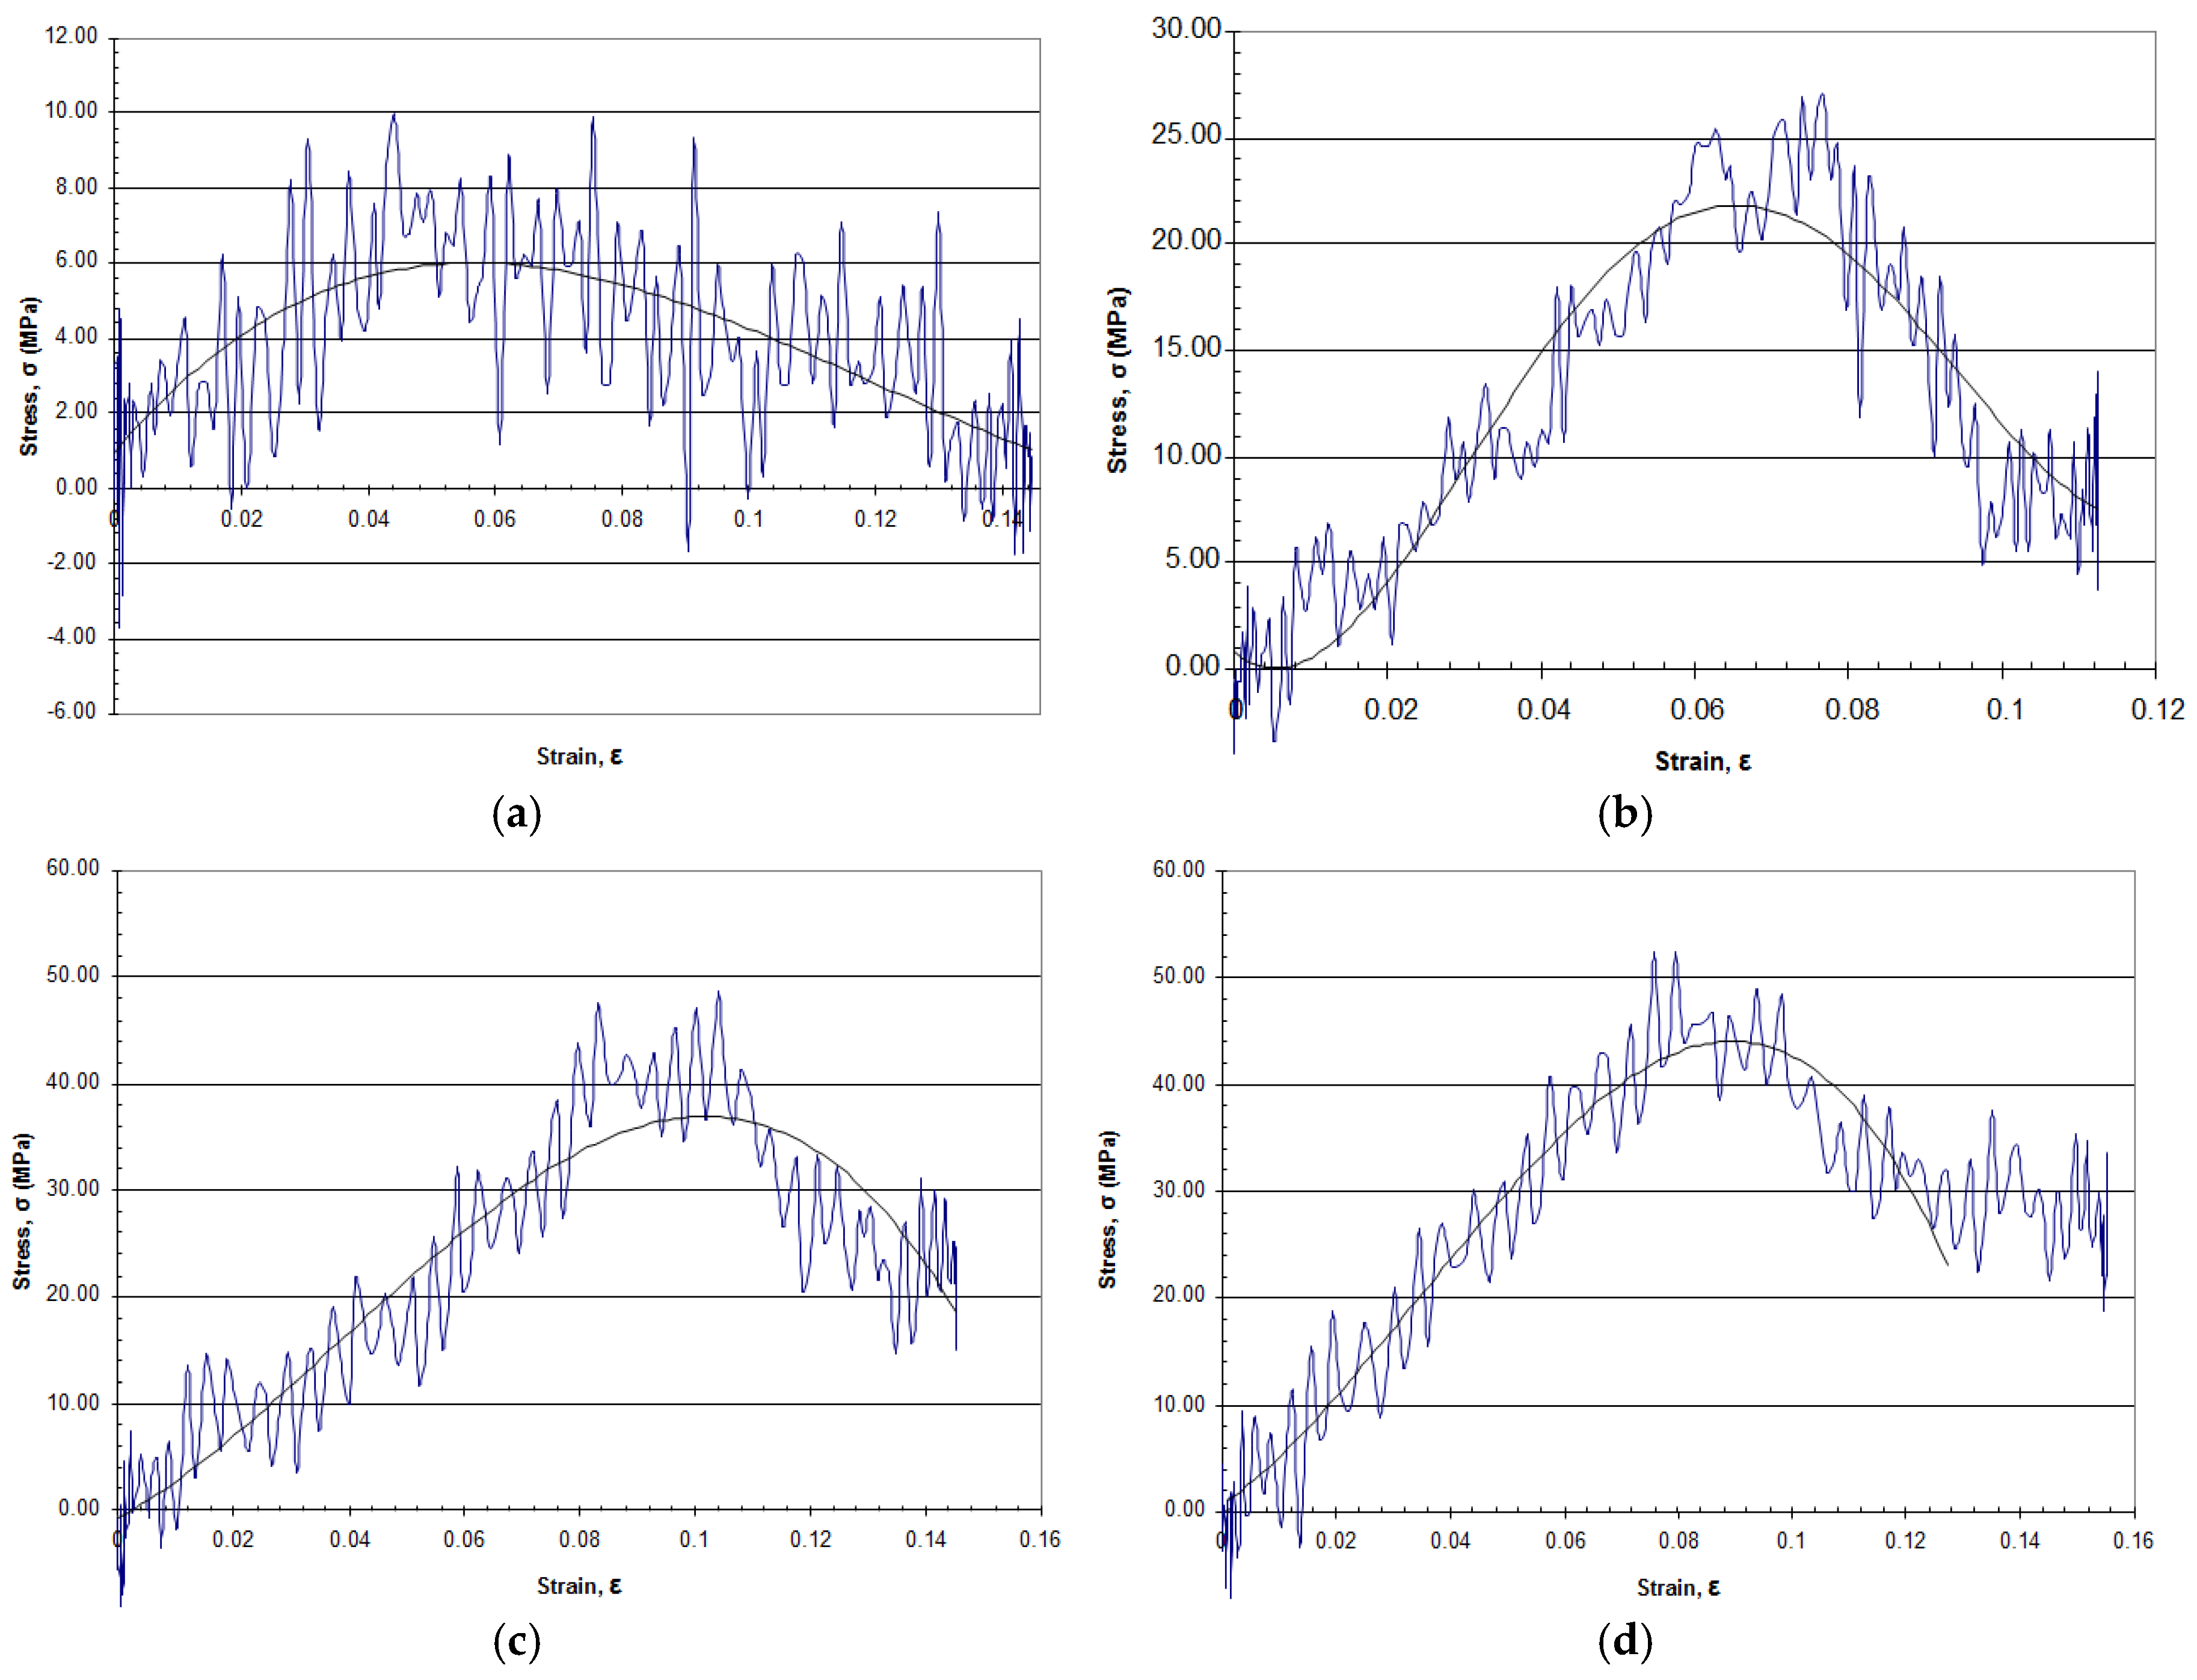
Figure 8.
Nominal stress vs. nominal strain-1.5 MPa: (a) first test (specimen 1); (b) second test (specimen 1); (c) first test (specimen 2); (d) second test (specimen 2).
Figure 8.
Nominal stress vs. nominal strain-1.5 MPa: (a) first test (specimen 1); (b) second test (specimen 1); (c) first test (specimen 2); (d) second test (specimen 2).

Figure 9.
Specimen 1 after: (a) first test; (b) second test.
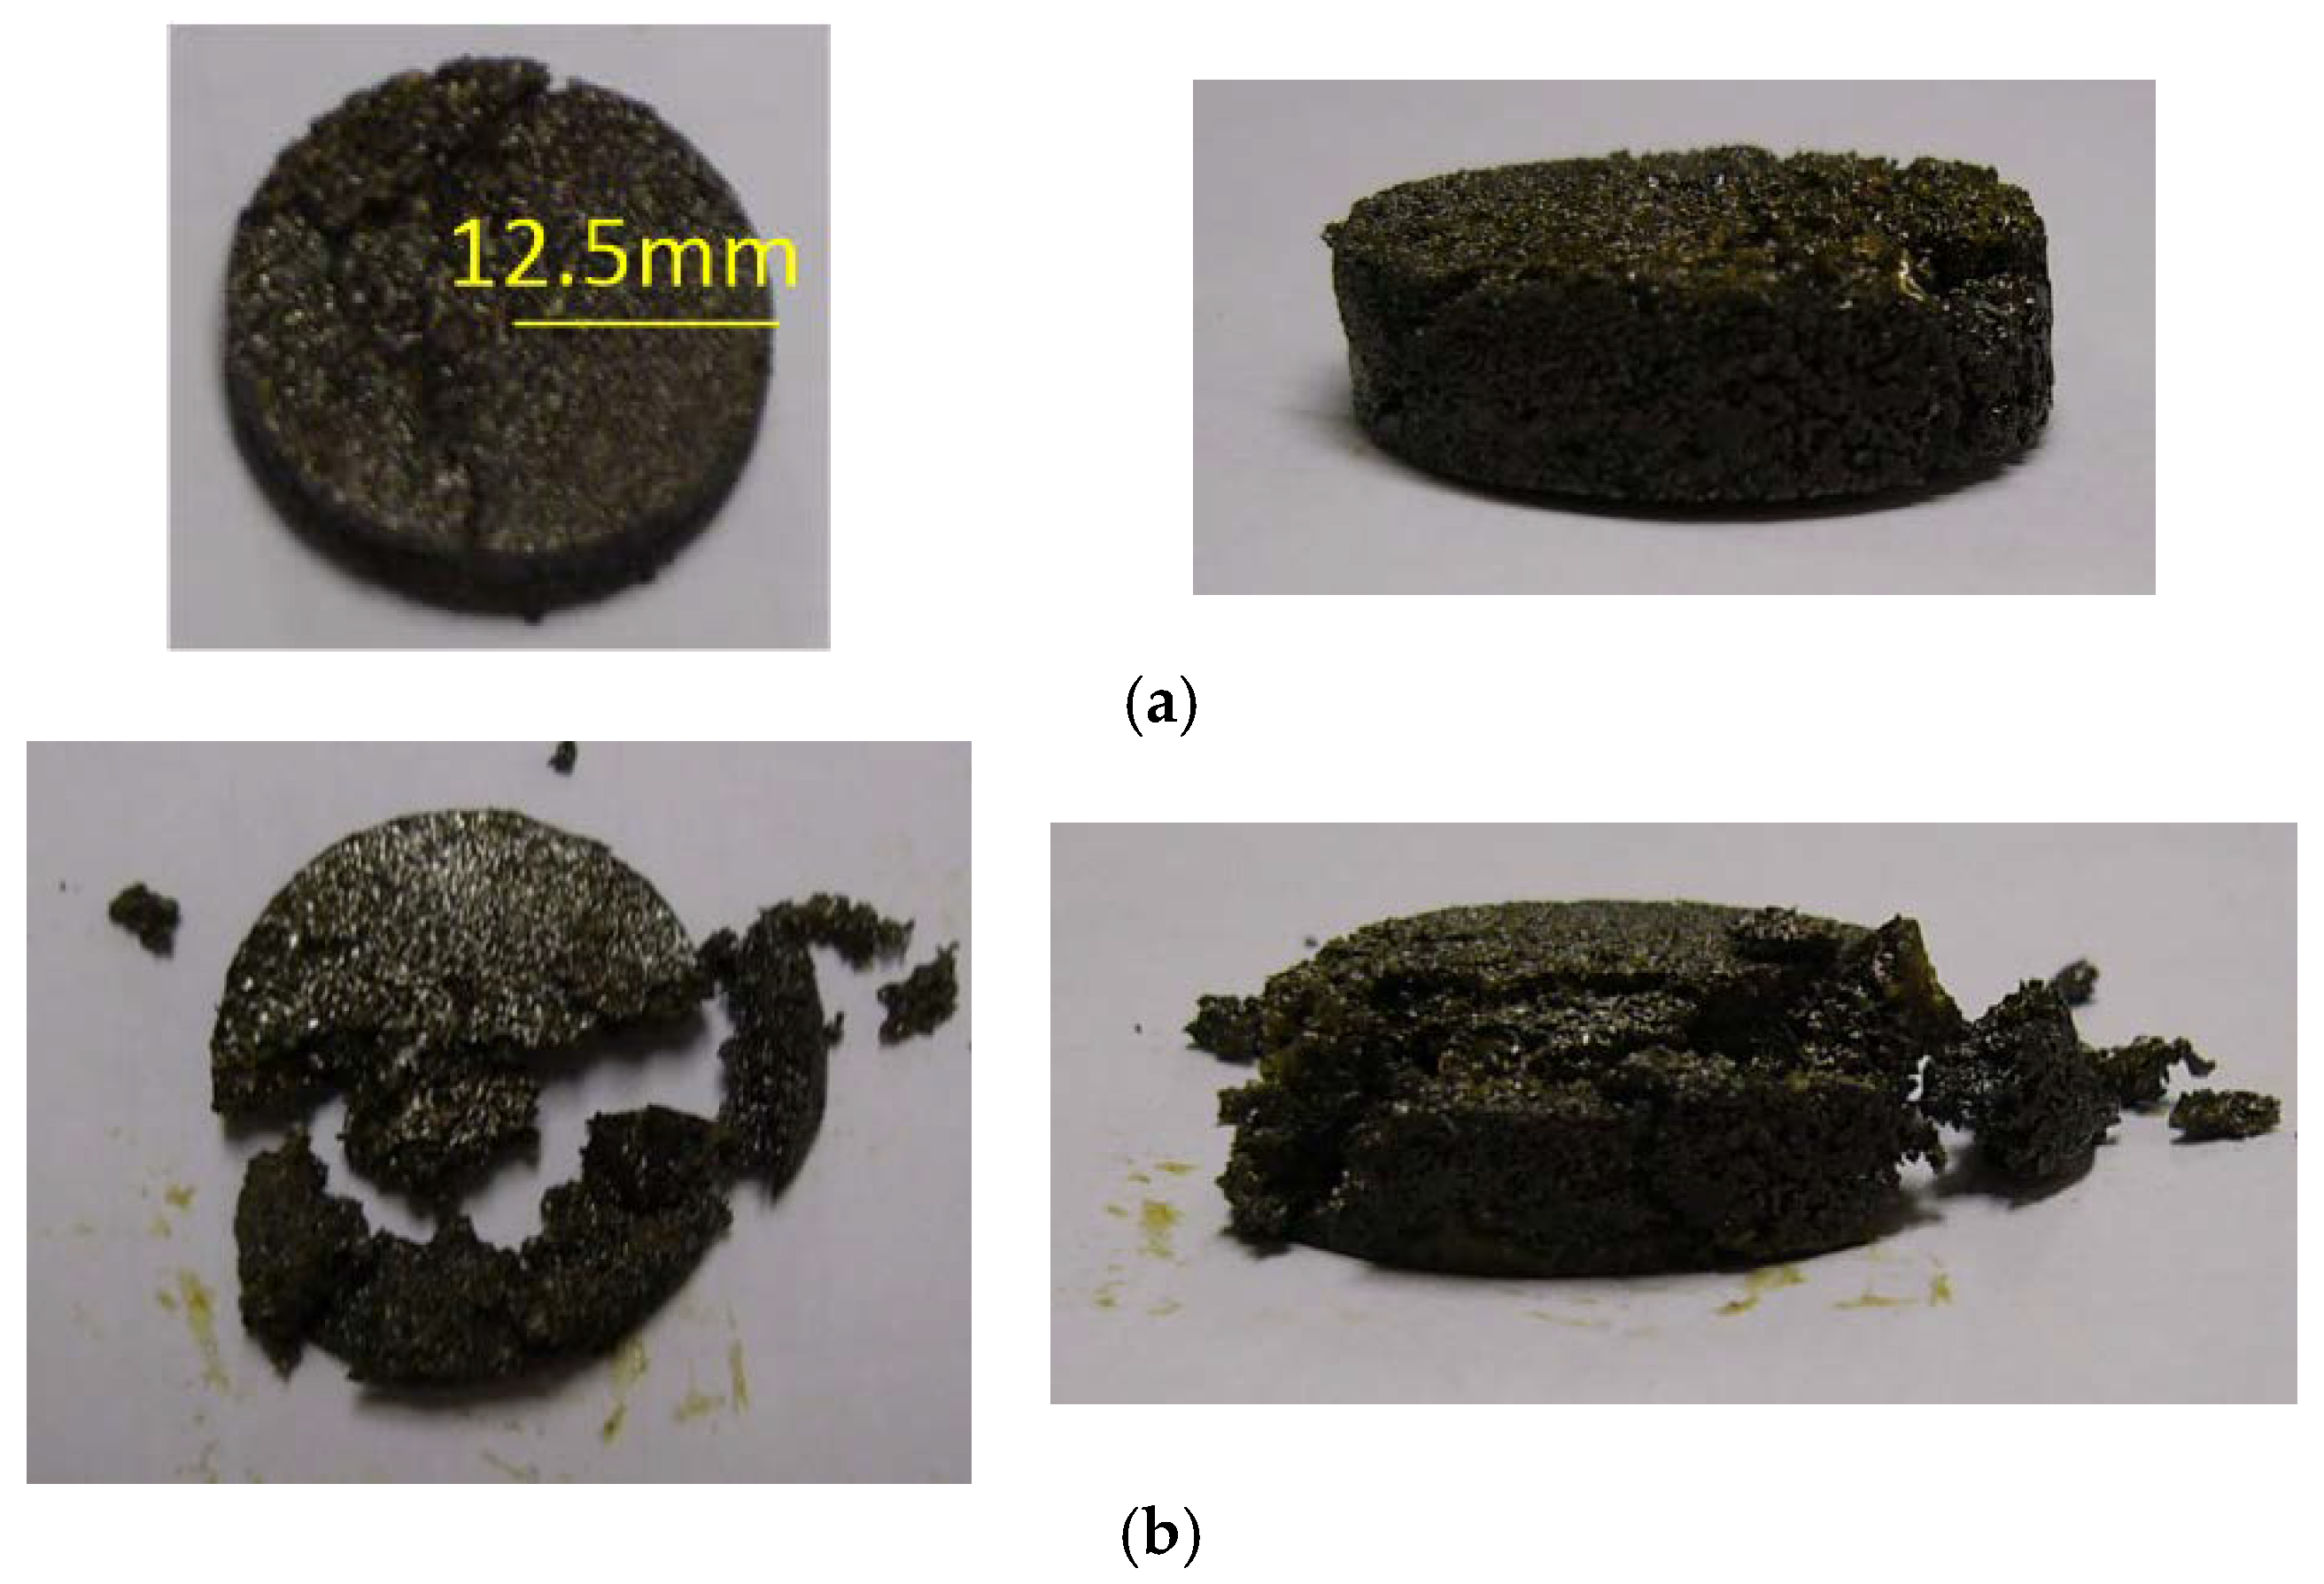
Figure 10.
Joint failure of shape memory NiTi foam in SHPB test (1.5 MPa).
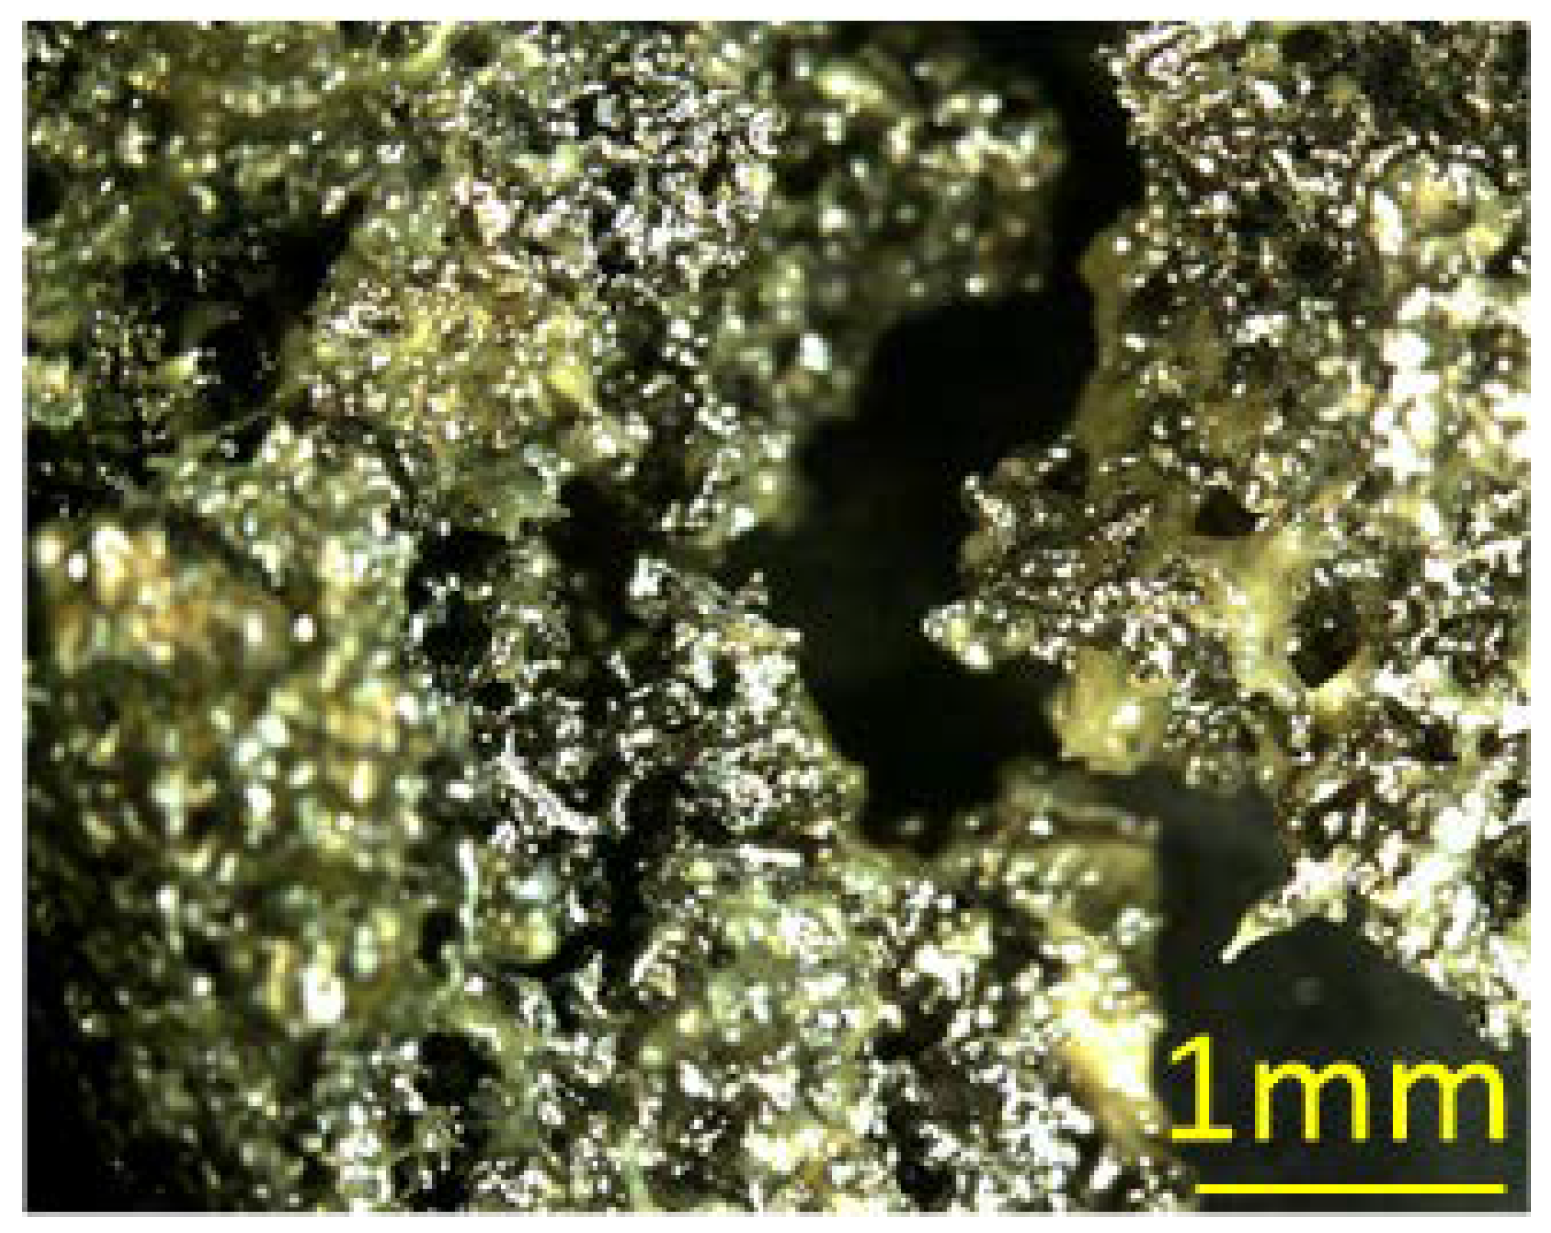
Figure 11.
Stress vs. strain-2.0 MPa, first test (specimen 1).

Table 1.
Test record for quasi-static test: 10% strain.
| Test No. | Deformation | Dimension of Specimen | |||||
|---|---|---|---|---|---|---|---|
| Before Test | After Test | After Recovery | |||||
| Thickness (mm) | Diameter (mm) | Thickness (mm) | Diameter (mm) | Thickness (mm) | Diameter (mm) | ||
| 1 | 10% | 12.20 | 40.00 | 11.75 | 40.12 | 11.92 | 40.18 |
| 2 | 10% | 11.92 | 40.18 | 11.56 | 40.40 | 11.67 | 40.17 |
| 3 | 10% | 11.67 | 40.17 | 11.54 | 40.41 | 11.63 | 40.22 |
| 4 | 10% | 11.63 | 40.22 | 11.55 | 40.40 | 11.62 | 40.21 |
| 5 | 10% | 11.62 | 40.21 | 11.53 | 40.40 | 11.61 | 40.23 |
Table 2.
Test record for quasi-static test: 20% strain.
| Test No. | Deformation | Dimension of Specimen | |||||
|---|---|---|---|---|---|---|---|
| Before Test | After Test | After Recovery | |||||
| Thickness (mm) | Diameter (mm) | Thickness (mm) | Diameter (mm) | Thickness (mm) | Diameter (mm) | ||
| 1 | 20% | 12.75 | 40.00 | 12.10 | 40.30 | 12.39 | 40.10 |
| 2 | 20% | 12.39 | 40.10 | 11.25 | 41.10 | 11.65 | 40.90 |
| 3 | 20% | 11.65 | 40.90 | 10.65 | 42.12 | 11.18 | 41.57 |
| 4 | 20% | 11.18 | 41.57 | 10.32 | 42.25 | 10.80 | 42.14 |
Table 3.
Loading and recovery of specimens in SHPB tests.
| Test No. | Pressure (MPa) | Striker Velocity (m/s) | Before Test | After Test | After Recovery | |||
|---|---|---|---|---|---|---|---|---|
| Thickness (mm) | Diameter (mm) | Thickness (mm) | Diameter (mm) | Thickness (mm) | Diameter (mm) | |||
| 1-1 | 1.0 | 14.133 | 8.84 | 25.00 | 7.71 | 25.15 | 7.95 | 25.13 |
| 1-2 | 1.0 | 13.414 | 7.95 | 25.13 | 7.51 | 25.41 | 7.81 | 25.35 |
| 1-3 | 1.0 | 13.922 | 7.81 | 25.35 | 7.13 | 25.48 | 7.29 | 25.39 |
| 1-4 | 1.0 | 13.904 | 7.29 | 25.39 | 7.00 | 25.52 | 7.05 | 25.52 |
| 2-1 | 1.5 | 16.696 | 10.80 | 25.00 | 8.89 | 25.65 | 9.15 | 25.53 |
| 2-2 | 1.5 | 16.467 | 9.15 | 25.53 | 7.79 | 26.47 | 8.14 | 26.10 |
| 3-1 | 1.5 | 16.206 | 9.42 | 25.00 | 7.62 | 25.83 | 7.86 | 25.53 |
| 3-2 | 1.5 | 16.727 | 7.86 | 25.53 | 6.75 | 25.92 | 6.93 | 25.94 |
| 4-1 | 2.0 | 24.812 | 10.44 | 25.00 | 7.55 | 26.96 | 7.63 | 26.88 |
Note: the first digit of the test no. is specimen number, and the second digit of the test no. is the loading number for a certain specimen.
© 2018 by the authors. Licensee MDPI, Basel, Switzerland. This article is an open access article distributed under the terms and conditions of the Creative Commons Attribution (CC BY) license (http://creativecommons.org/licenses/by/4.0/).
Share and Cite
MDPI and ACS Style
Wang, X.; Zhou, H. Failure Pattern Transition of Shape Memory NiTi Foam Subjected to Compression: From Quasi-Static to Dynamic. Appl. Sci. 2018, 8, 741. https://doi.org/10.3390/app8050741
AMA Style
Wang X, Zhou H. Failure Pattern Transition of Shape Memory NiTi Foam Subjected to Compression: From Quasi-Static to Dynamic. Applied Sciences. 2018; 8(5):741. https://doi.org/10.3390/app8050741
Chicago/Turabian StyleWang, Xiaojuan, and Hongyuan Zhou. 2018. "Failure Pattern Transition of Shape Memory NiTi Foam Subjected to Compression: From Quasi-Static to Dynamic" Applied Sciences 8, no. 5: 741. https://doi.org/10.3390/app8050741
Note that from the first issue of 2016, this journal uses article numbers instead of page numbers. See further details here.