Using Neural Networks in Modeling Customer Loyalty in Passenger Cars Maintenance and Repair Services

1
Faculty of Economic and Legal Sciences, Kazimierz Pulaski University of Technology and Humanities, Chrobrego 31, 26-600 Radom, Poland
2
Public High School of Engineering in Ciechanów, Narutowicza 9, 06-400 Ciechanów, Poland
3
Faculty of Mechanical Engineering, Lublin University of Technology, Nadbystrzycka 36, 20-618 Lublin, Poland
*
Author to whom correspondence should be addressed.
Appl. Sci. 2018, 8(5), 713; https://doi.org/10.3390/app8050713
Submission received: 4 April 2018
/
Revised: 24 April 2018
/
Accepted: 2 May 2018
/
Published: 3 May 2018
Abstract
:Featured Application
A proposed model of the segmentation of customers, which were obtained with the use of neural networks, can be useful for quality managers in automotive, auto repair shops owners, insurance companies managers, allowing for predicting customer loyalty on a basis of formal characteristics and to take proper activities to make or keep customer loyal.
Abstract
Background: In the study, we researched if it is possible to identify the segments of customers of auto repair shops with the use of neural networks? The study attempts to contribute to literature by way of classifying customers of the auto repair shops, accordingly to their loyalty, with the use of advanced statistical methods. Methods: The paper covers classification trees, neural networks, and cluster analyses that were applied in order to classify customers according to their loyalty. Results: It has been proved that three groups of factors influence loyalty: (1) social and demographic factors concerning customer characteristics; (2) technical factors concerning the vehicle and the manner of its use; and (3) factors defining the evaluation of the service quality provided by the auto repair shops. Four segments of customers which vary in terms of formal characteristics and assessment of the quality of services were obtained. Conclusions: (1) identification of factors shaping customers’ loyalty; (2) possibility of checking which changes of the quality of services may influence the loyalty of the customers; and (3) identification of the segments of the customers in the case of which the marketing strategies applied to increase the loyalty, must be treated with the utmost priority.
1. Introduction
The use of automobile vehicles plays a key role in the road transportation system. However, vehicles cannot remain new forever [1]. A continuous use of the vehicles results, both in their general wear and tear, as well as breakdowns [2]. Vehicle maintenance refers to a practice, where an automobile is serviced on a regular basis in order to prevent a major breakdown or the need for major repair. It is believed that an automobile vehicle will last longer and will operate better if its maintenance is carried out according to the prescribed schedule [3]. Designs of modern vehicles have advanced to a very sophisticated level. Therefore, the modern trend of mechanical services requires the use of more complex and highly technological diagnostic equipment, specialized tools, as well as competent stuff to analyze vehicle faults for repair and service. As vehicle technology and maintenance processes are advancing, the problems that are faced by auto repair shops and vehicle users have compounded [1].
Despite improvements in the new passenger car quality, reliability, and durability, opportunities to provide service for these vehicles are expected to arise as more of them reach prime aftermarket service age [4]. The challenges that are faced by the auto repair shops are connected with the manner of the maintenance and repair of the vehicles, the construction of which becomes more and more complicated. The next aspect concentrates on the customers, whose requirements are constantly rising. They represent high level of awareness and expert knowledge gained thanks to the unlimited access to various sources of information and they have less trust for marketing communication [5]. Thus, the loyalty of the customers has an outstanding value. In the light of strong competition, the organizations become customer seekers [6]. The recognition of the profiles of customers’ behaviors constitutes a basis of relations with customers, systems of services, and shaping their loyalty. There are around 19,500 independent auto repair shops and 1500 authorized service stations in Poland. Within a year, the Poles are visiting the auto repair shops around 38.5 million times for technical inspection or repair [7], and 76% of the customers used the services that were delivered by at least two auto repair shops.
Links between the quality, customer satisfaction, and loyalty are one of the most popular research topics among service researchers [8,9]. The link between perceived quality, customer satisfaction, and loyalty is naturally expected. This has been proved by many researchers over time [10,11,12]. These researches show that the quality of services is the key to customers’ satisfaction, which leads to loyalty. Other studies carried out by Yi [13], as well as Bloemer and Kasper [14], also show the importance of products and services quality in enhancing customers’ loyalty.
Bennett and Rundle [15], as well as Schultz [16], state that customers satisfied with a product or service will form a loyal behavior. This behavior will lead to repetitive purchases and share of a positive word of mouth. This finding is in line with [17], who states that customer loyalty can be formed if the customer is satisfied with the brand or the level of service received.
Summing up and referring to the various results of different empirical studies, it can be concluded that services quality, customer satisfaction, and loyalty are important to both customers and companies [18].
In connection with the above, the purpose of the paper is to identify the segments of customers of the auto repair shops with the consideration of various loyalty measures.
The following hypotheses have been formed:
Hypotheses 1 (H1):
the incentive loyalty of the customers of the auto repair shops measured by the Net Promoter Score (NPS) indicator is low;
Hypotheses 2 (H2):
the loyalty of customers to the auto repair shops is in various degree conditioned by three groups of factors: socio-demographic, technical and factors defining the quality of the services;
Hypotheses 3 (H3):
the model based on neural networks allows for a proper projection of the loyalty of the customers of the auto repair shops; and,
Hypotheses 4 (H4):
The customers of the auto repair shops create segments varied by their level of loyalty.
Formed hypotheses have been empirically verified.
2. Literature Review
The researchers are identifying the loyalty models based on the customers satisfaction, their relations with the brand, image of an organization, social factors, and the approaches of the two most frequently encountered approaches encompass the phenomenon of the loyalty of the customers from (1) behavioral and (2) emotional point of view concentrating on the feelings, values, and attitude [19,20]. The first type of the loyalty covers cognitive and conative loyalty, and the second type includes affective and incentive loyalty [21].
From the perspective of behavioral loyalty, despite of the quantitative attitude, it is also significant to consider the value attitude. Thus, despite of the frequency of purchasing goods or services, their value is analyzed as well [19], and a factor, the so called SOW (Share of Wallet) is often applied [22]. It specifies the share of general expenses of a customer falling to a given supplier.
Loyalty in the behavioral perspective is currently superseded by the loyalty understood as an attitude, customer’s approach determining his behavior [20]. The behavior of the customer is as important as the incentive of this behavior. This approach has been introduced in order to distinguish the customers who are loyal, merely due to the duress or lack of any alternative. These days, it is commonly claimed that incentive is the key element of the behavior of the customers [23]. D. Gremler and S. Brown [24] suggested the analysis of the definition of loyalty by way of combining its various aspects. According to their thesis, loyalty is the degree of (1) repeatability of a purchase in a given company; of (2) the positive attitude to a company; and (3) in case of a need of another purchase, the degree in which they consider buying a given product or service exclusively in that company.
A library query presents that in literature, we may encounter numerous papers on the factors that are shaping the loyalty of customers taking advantage of automobile services [25,26,27,28,29,30,31,32,33].
The first paper includes the measurement of expectations within the scope of the quality of vehicles’ repairs, as well as the measurement of satisfaction of the customers derived from the completion of this process in order to work out and to improve the customer service process [25].
The other authors offer a compound model identifying the attributes of the quality that determine the selection of the auto repair shop by a customer [26]. It has been proven that the attributes influencing the selection of a given auto repair shop do in fact differentiate the assessment of the quality level of provided services.
The next researchers analyzed determinants forming customer loyalty on the basis of three services industries, including automobile repairs [27]. The influence of the quality of the product, quality of services, and fair prices exerted on the loyalty has been examined. It has been shown that customer satisfaction depends on these factors and it results in their loyalty. Other authors have also considered the impact of the quality of products and services in the automobile industry on the loyalty of the customers, especially on the intent of the next purchases [28]. The existence of the presumed positive connection has been confirmed here.
Another study of the same author concentrates mainly on the factors that are affecting the brand loyalty of the customers of the automobile industry [29]. It has been proved that the more satisfied the customer is, the more loyal with the brand he/she will be. Especially, after-sale service and an unbroken and positive relationship with the customer keep the organization alive. Furthermore, the study discovered a relationship between customer’s trust and loyalty. Another paper provides a structural equation model with latent variables for modeling this complex relationship [30]. It reveals that high satisfaction leads to loyalty, but it is heavily affected by moderating variables, including entry barriers and variety seeking.
Customer retention can be analyzed from the behavioral, as well as from the economic point of view [31]. The author was able to show, from an economic point of view, that customer retention can be explained as a rational buyer behavior, since a long-term relationship generally helps to reduce agency costs if some type of contingent contract with the seller can be established.
Then, another paper provides a theoretical basis for modeling the complex relationship between satisfaction and loyalty [32]. Accordingly, customers move categorically from problem solving behavior to an evoked set of preferred alternatives as satisfaction increases. This should result in an increase in the impact of satisfaction on loyalty at a relatively high level of satisfaction, which subsequently decreases at an extreme level of satisfaction. Also, research on a relationship between customer service and product quality with customer satisfaction and loyalty in the context of the automotive industry was published, and it resulted in pointing out links between these four variables [33].
V. Maheshwari, together with his team [34], emphasized in the study the loyalty in the automotive market, that the role of the brand in the creation of customers’ loyalty is considerably significant. On the other hand, E. Izogo and I. Ogba [35] examined the dependence between the quality of services that are offered in the auto repair shops and the loyalty of the customers. The results of their study show that service quality dimensions are significant predictors of customer satisfaction and loyalty with the commitment dimension accounting for the highest degree of this impact.
It is worth mentioning that a great number of cited authors of the case studies indicate that the models that were proposed by them are the result of the research that was carried out in the territory of a given state. Moreover, no model based on the artificial intelligence with the ability to comprehensively specify the loyalty of the customers in the market of vehicle repairs, has been published. Such a model was proposed in the empirical part of this paper.
3. Methods
The empirical study was carried out in 2017 on the basis of a sample of 381 customers of auto repair shops with the use of traditional survey method. The questionnaire was composed of 50 questions that were divided into six sections. The first part of the questionnaire constituted formal characteristics of the customers (five variables), vehicles and the manner of their operation (four variables). In total, these characteristics cover nine variables. The second part of the questionnaire (13 variables) is represented by indicators that are describing two areas: customer loyalty for a given auto repair shop (six variables) and the price of provided services (four variables). The remaining three variables from this part concerning the purpose of the visit and other attributes have been treated as the independent ones and used for the creation of a quasi-activation function for neural networks. Whereas, the third part covers 28 statements, thanks to which we may assess various aspects of the quality of services that are provided by the auto repair shops on the seven-points Likert scales. The list of variables that are used in the research is attached in the Appendix A.
On the basis of the literature [19,23,24,36], it was presumed that customer loyalty would be considered in the behavioral and incentive aspect. Thus, three loyalty measures are proposed:
- behavioral and quantity-oriented (measured by the percentage of the visits in a given auto repair shop in the total number of visits—L). This is the number of visits of a customer in a favourite auto repair shop divided by the total number of visits of this customer in any auto repair in a given period of time. It is interpreted in % and it can take values from between 0% and 100%. The higher value of this index, the higher customer loyalty. This is a measure proposed by us;
- behavioral and value-oriented (measured by the share of a given auto repair shop in the expenses of the customer—SOW). This is the sum of expenses that were incurred by a customer in a favourite auto repair shop divided by the total expenses incurred by this customer in a given period of time. It is interpreted in % and can take values from between 0% and 100%. The higher value of this index, the higher customer loyalty. This is a measure proposed by us; and,
- incentive (measured by a tendency of the customer for giving recommendations for taking advantage of the services provided by a given auto repair shop). The NPS (Net Promoter Score) indicator that was recommended by F. Reichheld [36] was applied for the measurement of the incentive loyalty. Customers are divided into three groups, depending on their inclinations for recommending an organization to others:
- promoters (recommendation probability 9–10);
- fence sitters (recommendation probability 7–8); and,
- detractors (recommendation probability 0–6).
The value of the NPS indicator is a difference between the fraction of promoters and detractors. Since it is a difference of two percentage values, it is interpreted as an absolute measure (with no %) [36]. It can take values from the range from −100 to 100 points. The higher value of this index, the higher customer loyalty. Its author, F. Reichheld, suggests that in a decent, “positive” situation, it should be above 0. Average value of NPS equals to 10–15 points in many industries worldwide, while NPS = 50 means an excellent situation for an organization. For the leaders in creating customer loyalty, it can reach even 70–80 points (Harley Davidson, Amazon, Apple).
The presented analysis that is applied by selecting variables from 12 acknowledged models of services quality [37,38,39,40,41,42,43,44,45,46,47,48].
The analysis used classification trees, neural networks, and cluster analysis. Classification trees have been applied as the method, according to which the variables were selected for the model. The above mentioned trees are the hierarchic and the explorative method that is used in the analysis of the structure of the set of observations applied in order to align the cases to k classes, which have not been known earlier. CART (C&RT) algorithm that was elaborated by Breiman and co-authors, was selected for the presented analysis [49].
Then, the creation of the model used the neural networks being the part of the non-parametric iteration methods, which are included within the scope of the machine learning [50]. In this study, we applied neural networks of the MLP type (Multilayer Perceptron), which are a popular form of this method [51]. In order to choose the best model, 16 models of neural networks have been elaborated. They differ from each other in respect of:
- the structure (typology) of network meaning the number of the layers of the network, the number of neurons of the particular layers and the way they are connected with each other;
- activation function applied initially; and,
- values of the weight coefficients of the neurons building the network.
The applied networks have been created with the use of the R programming language and the neuralnet package. Network topology has been worked out on the basis of two techniques: generic and crossing technique widely discussed by R. Parekh, J. Yang, and V. Honavar [52]. Two activation functions have been tested: logistic function and tangent. Activation functions were the same for all the neurons in a given network. The following network learning algorithms have been used: backprop—backpropagation, rprop—Resilient backPROPagation, and smallest absolute gradient based on the change of its value in relation to the other. These algorithms belong to the traditional algorithms of the neural network learning based on the backpropagation [50], and they are most frequently used in machine learning [53]. In order to assess the created neural networks, the following measures have been used, appropriate for a particular type of projected data: ASE (Average Squared Error) for L and SOW measures and MR (Misclassification Rate) for the NPS measure.
On the other hand, a cluster analysis that is used in the grouping of similar object into categories has been applied in order to carry out the segmentation of the customers of the auto repair shops. The term cluster analysis was introduced by R. Tryon [54] and was then developed by R. Cattell [55]. The purpose of this analysis is to divide the objects into the groups in a way allowing for establishing the strongest relationship between the objects among one group and the weakest relationship between the objects from the remaining groups. The k-means method i.e., a non-hierarchic method, has been applied. Non-hierarchic methods are computationally the fastest, however they require that the presumed number of clusters be declared, what affects the obtained segmentation [56].
4. Results
4.1. A Conceptual Model
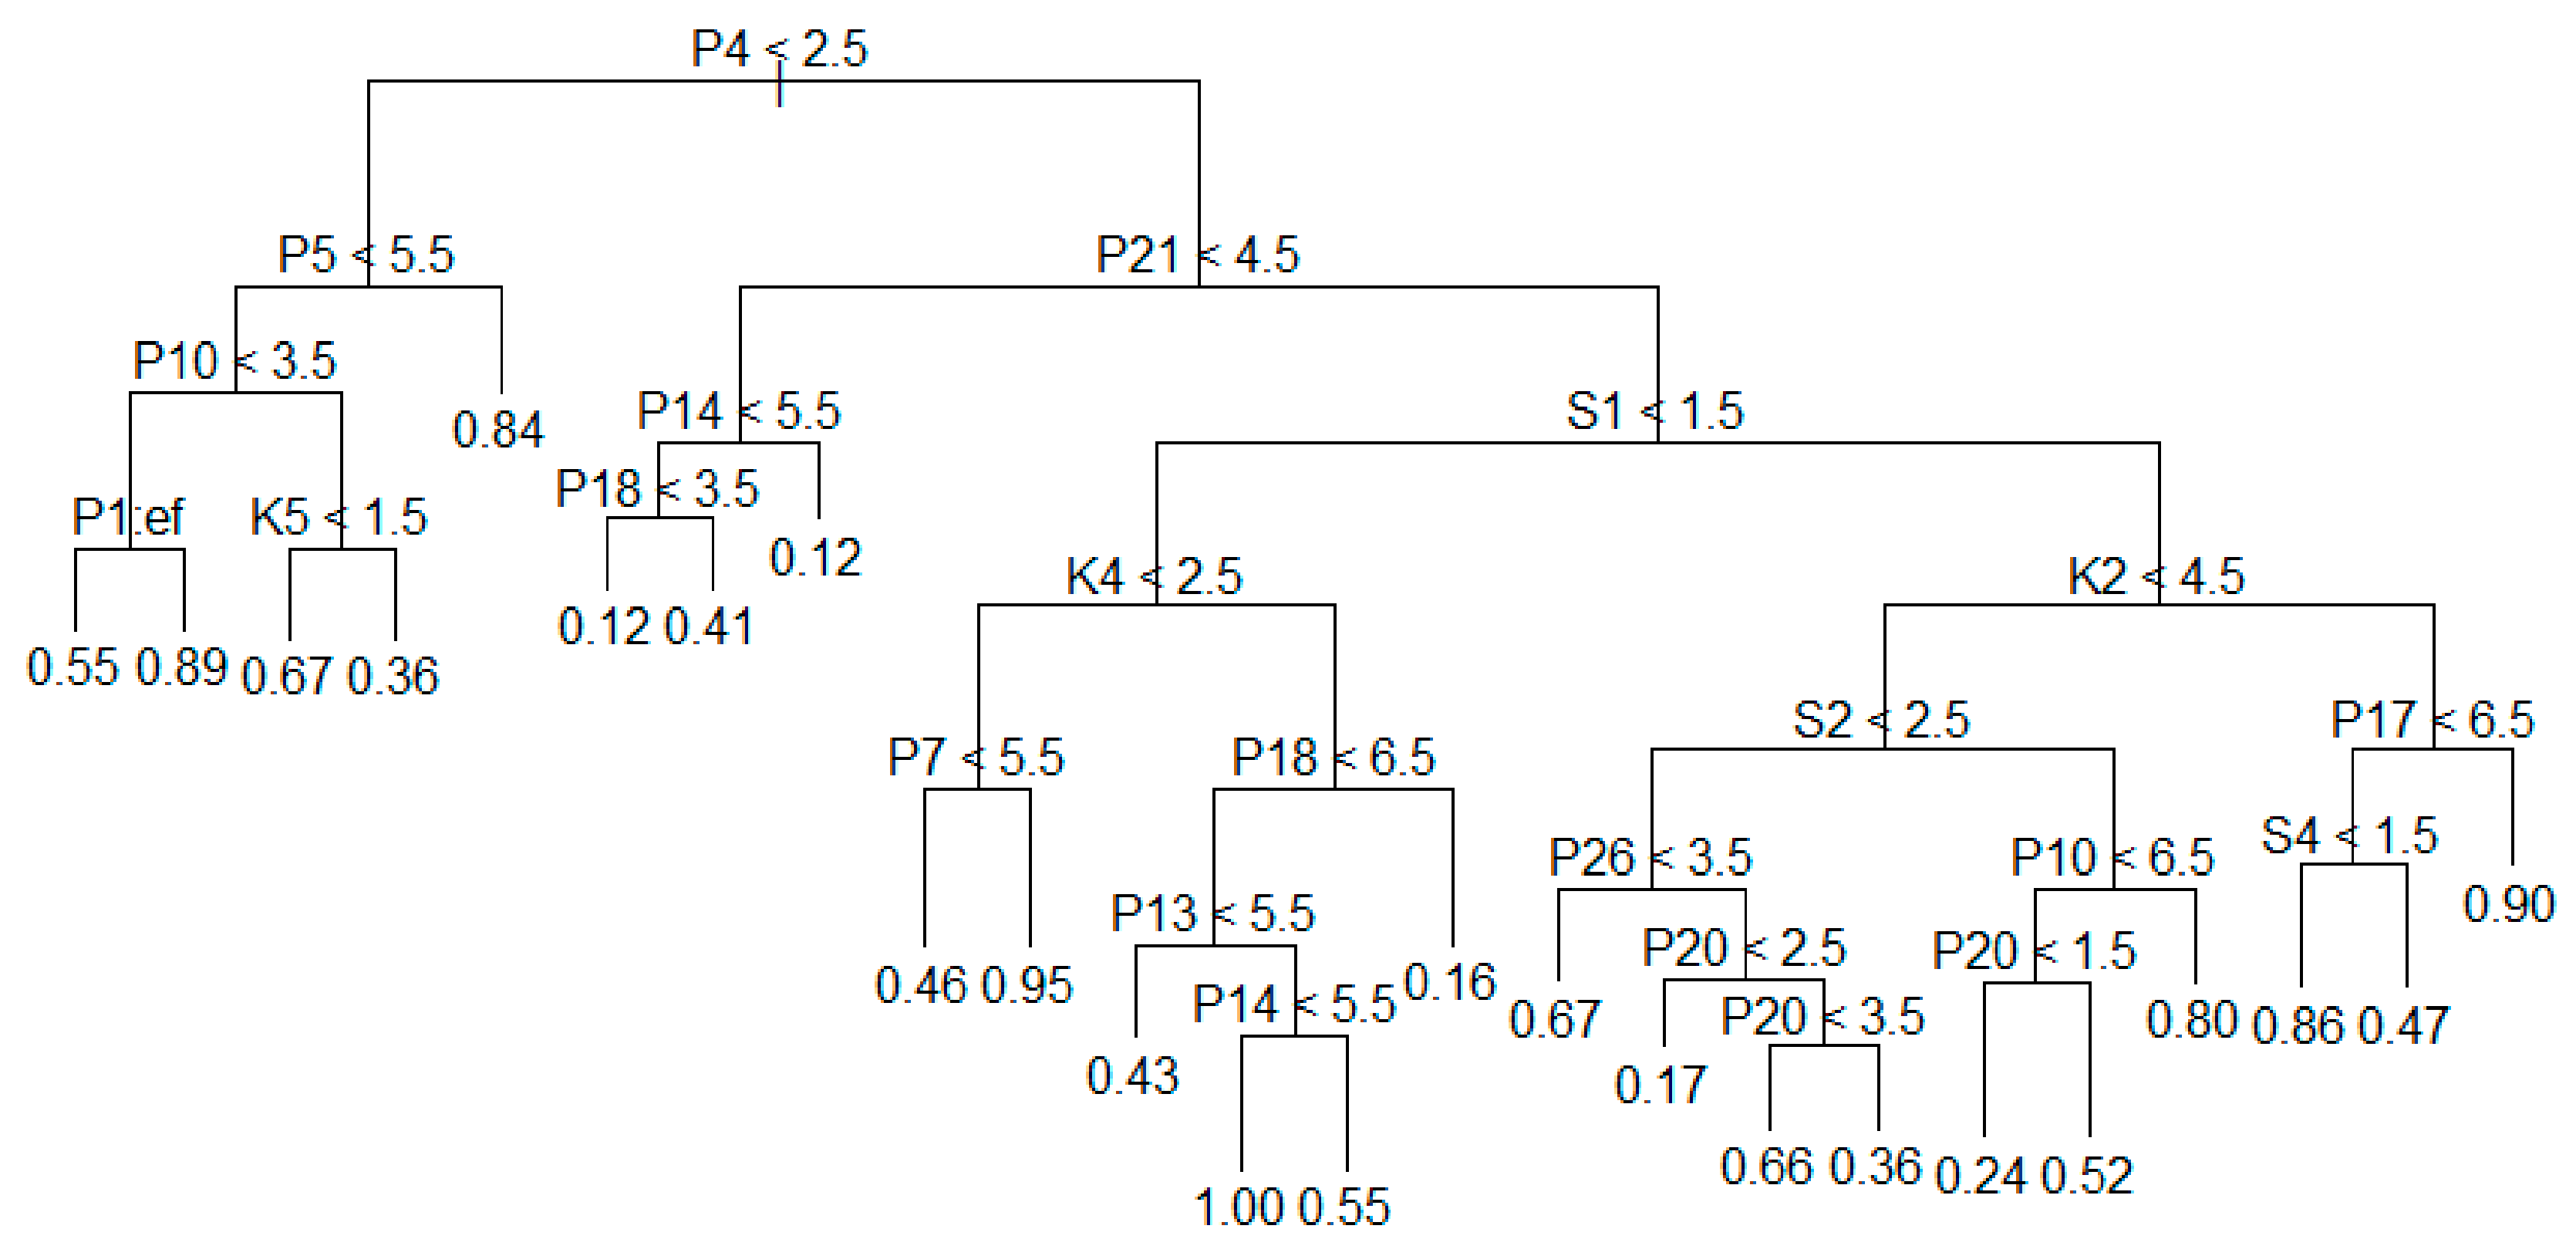
It is assumed that the loyalty is affected by various factors, which may concern the particular features of a given respondent, the manner of the use of a vehicle and the perception of the quality of services that are offered by the auto repair shops. Figure 1 presents a decision tree in the behavioral, counted (quantitative) perspective, i.e., the frequency of taking advantage of the services that are provided by the auto repair shops. It was pruned merely to the most important factors.
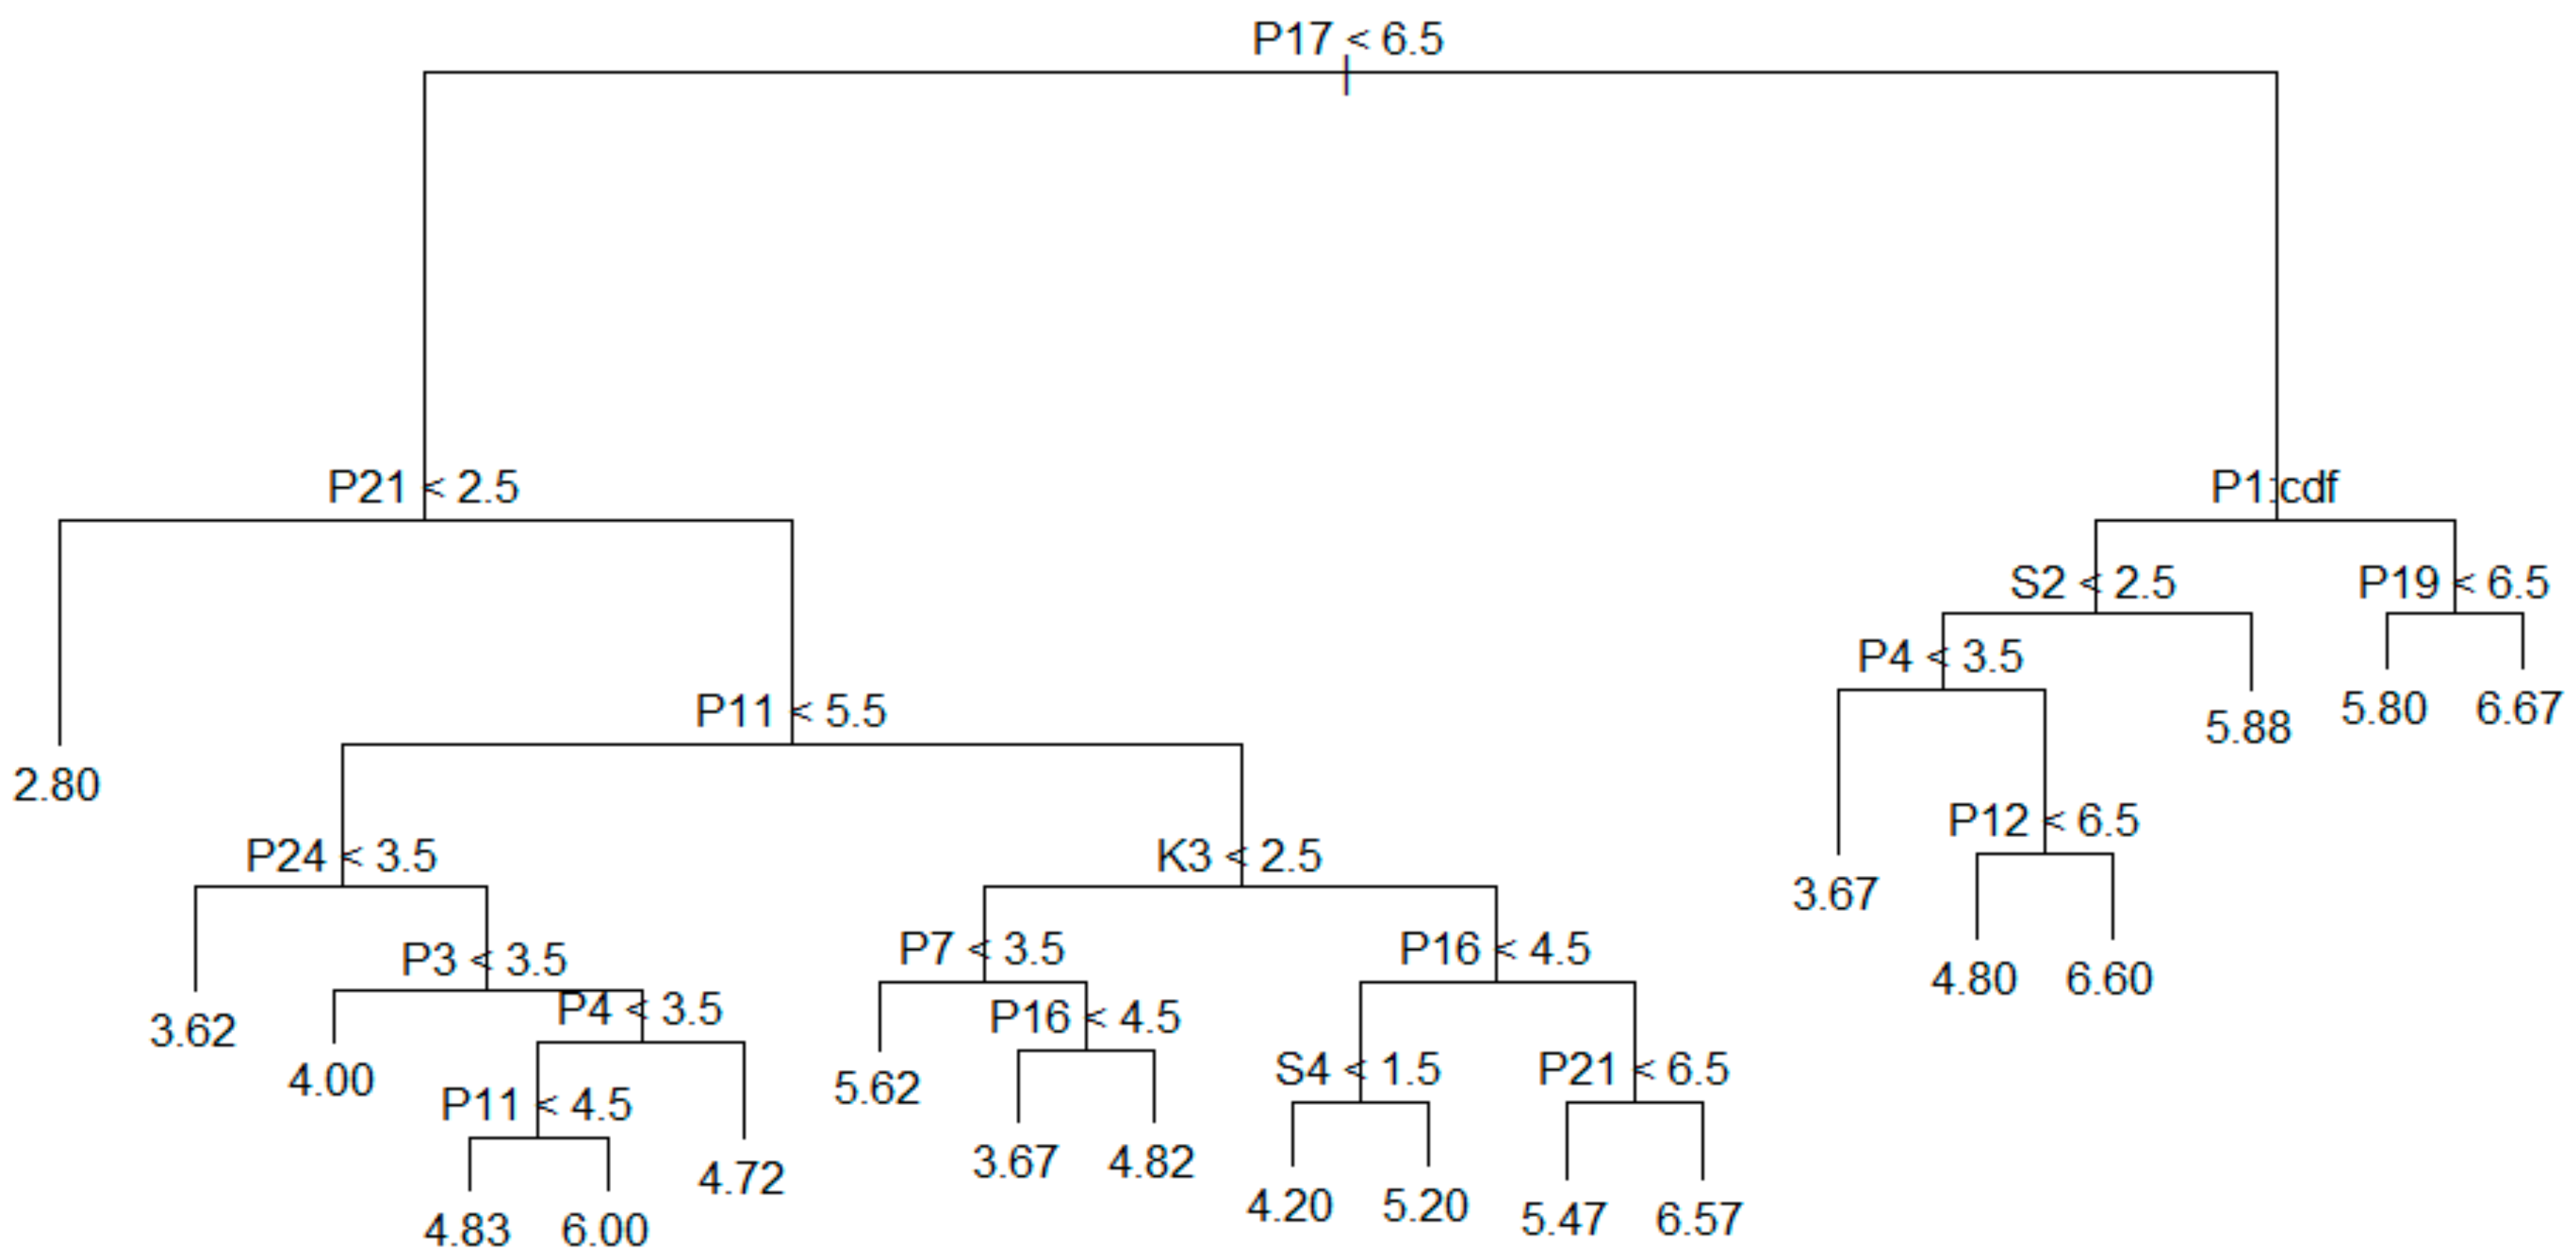
The analysis of Figure 1 proves that the variables, which differentiate the customers in respect to the loyalty in the best way, include: the origin of a vehicle (S1) and the variables being the attributes of the quality of services that are provided by the auto repair shops: attractiveness of promotional materials concerning provided services (P4), assistance from the auto repair shop employee when selecting spare parts (P19), modern equipment (P1), cleanness and tidiness in the auto repair shop (P6), as well as complexity of provided services (P21). Whereas, Figure 2 demonstrates a loyalty classification tree in the value-oriented perspective.
The analysis of Figure 2 proves that the key role in the loyalty classification in the value-oriented perspective is also played by the quality of the services that are provided by a given auto repair shop. The most diversifying factor is the attractiveness of information materials concerning the services that were offered by an auto repair shop (P4). The same factor is also significant in the case of the quantity-oriented perspective. The next factors are the following attributes of service quality, including: complexity of provided services (P21), availability of maintenance materials and spare parts at the moment of need (P5), proper documentation connected with the provision of a given service by the auto repair shop (P10), individualization of services that are provided by the auto repair shop, their adjustment to the needs of the customers (P14), and the origin of the vehicle (bought as a new or used vehicle—S1). The comparison of these two perspectives shows that significant variables are repeated in both cases. On the other hand, a decision tree for the incentive perspective is presented in Figure 3.
On the basis of data included in Figure 3, it may be stated that the key significance should be ascribed to the variables concerning the perception of the quality of services that are provided by the auto repair shop. In this case, the most important factor is the kindness of the auto repair shop workers (P17) and the next in line are: comprehensibility of provided services (P21) and the modern looking equipment (P1). Variables P1 and P21 are highly significant in two other perspectives. Whereas, such variables specifying the age of a used vehicle (S2) are placed at the third level of the tree, together with the assistance in the selection of operation materials by the auto repair shop workers (P19) and the provision of the services in line with the customers’ expectations (P11).
In every case, the analysis of the first three levels of the tree reveals that 12 variables among the 37 variables that were taken into consideration in the study, are present. Four variables are included in two perspectives and one variable is found in all three cases. Thus, it may be stated that in all three perspectives, we observed a significant repeatability of the appearance of the variables.
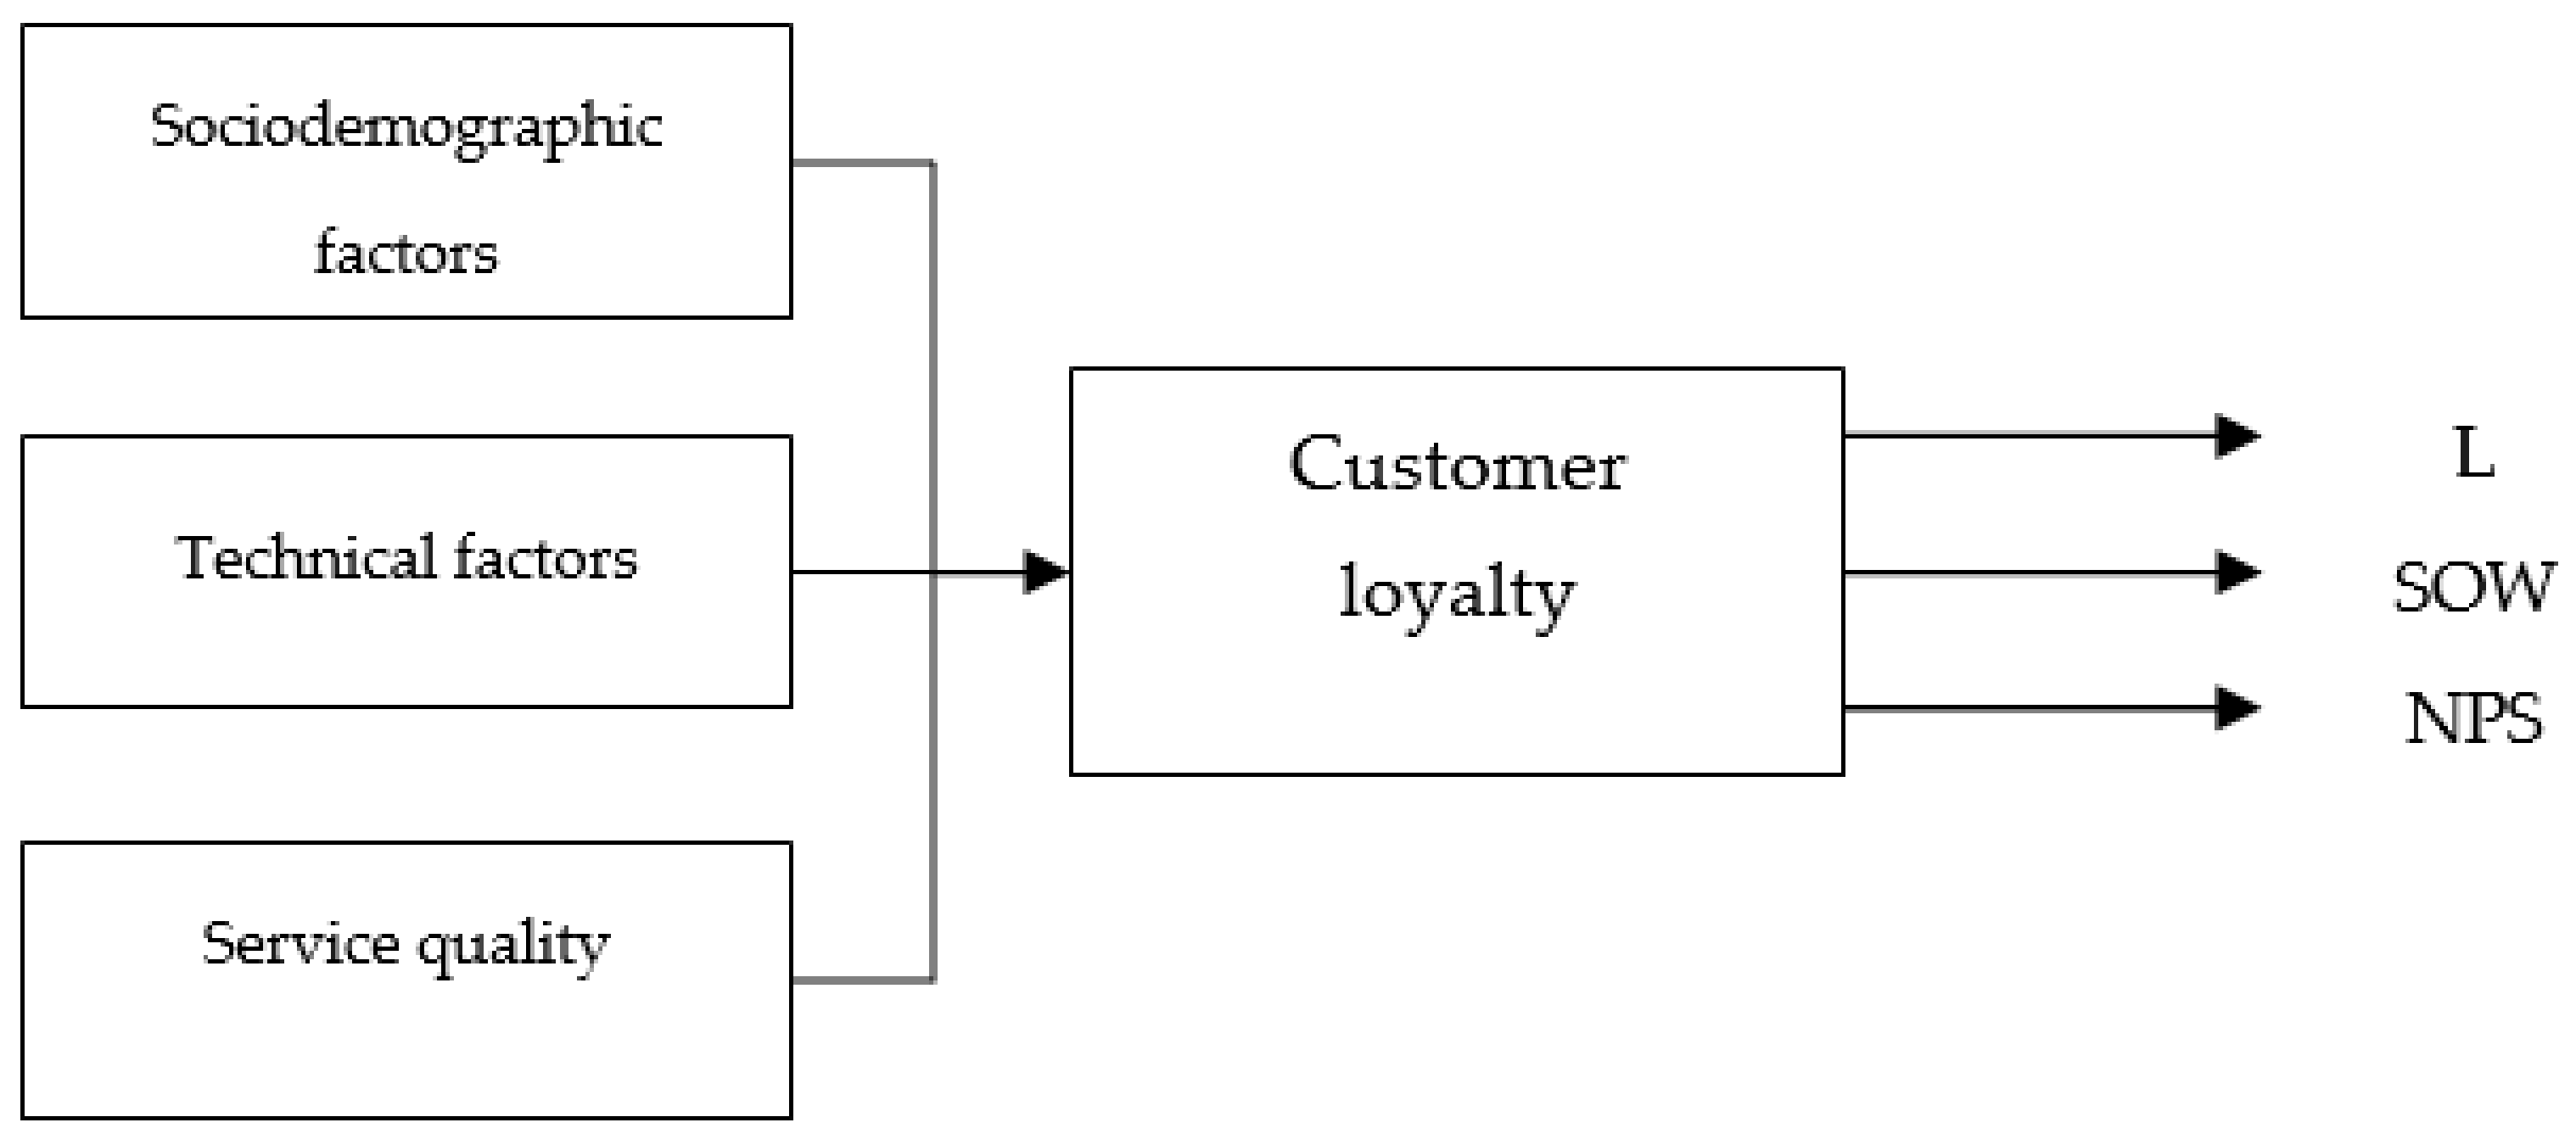
Taking the above deliberations into consideration, it is concluded that the customers loyalty towards the auto repair shops depends on various factors, which may be divided into three groups:
- socio-demographic concerning customer’s characteristics;
- technical concerning a vehicle and the manner of its operation; and,
- the ones concerning the perception and assessment of the quality of services that are provided by the auto repair shops.
Therefore, we created a conceptual model of the dependencies between three analyzed groups of factors and three perspectives of customers loyalty. The said model is presented in Figure 4.
Formulated conceptual model was transformed into a measurement model, presented in Section 4.2 of this paper.
4.2. A Model Based on Neural Networks for Predicting Customers Loyalty
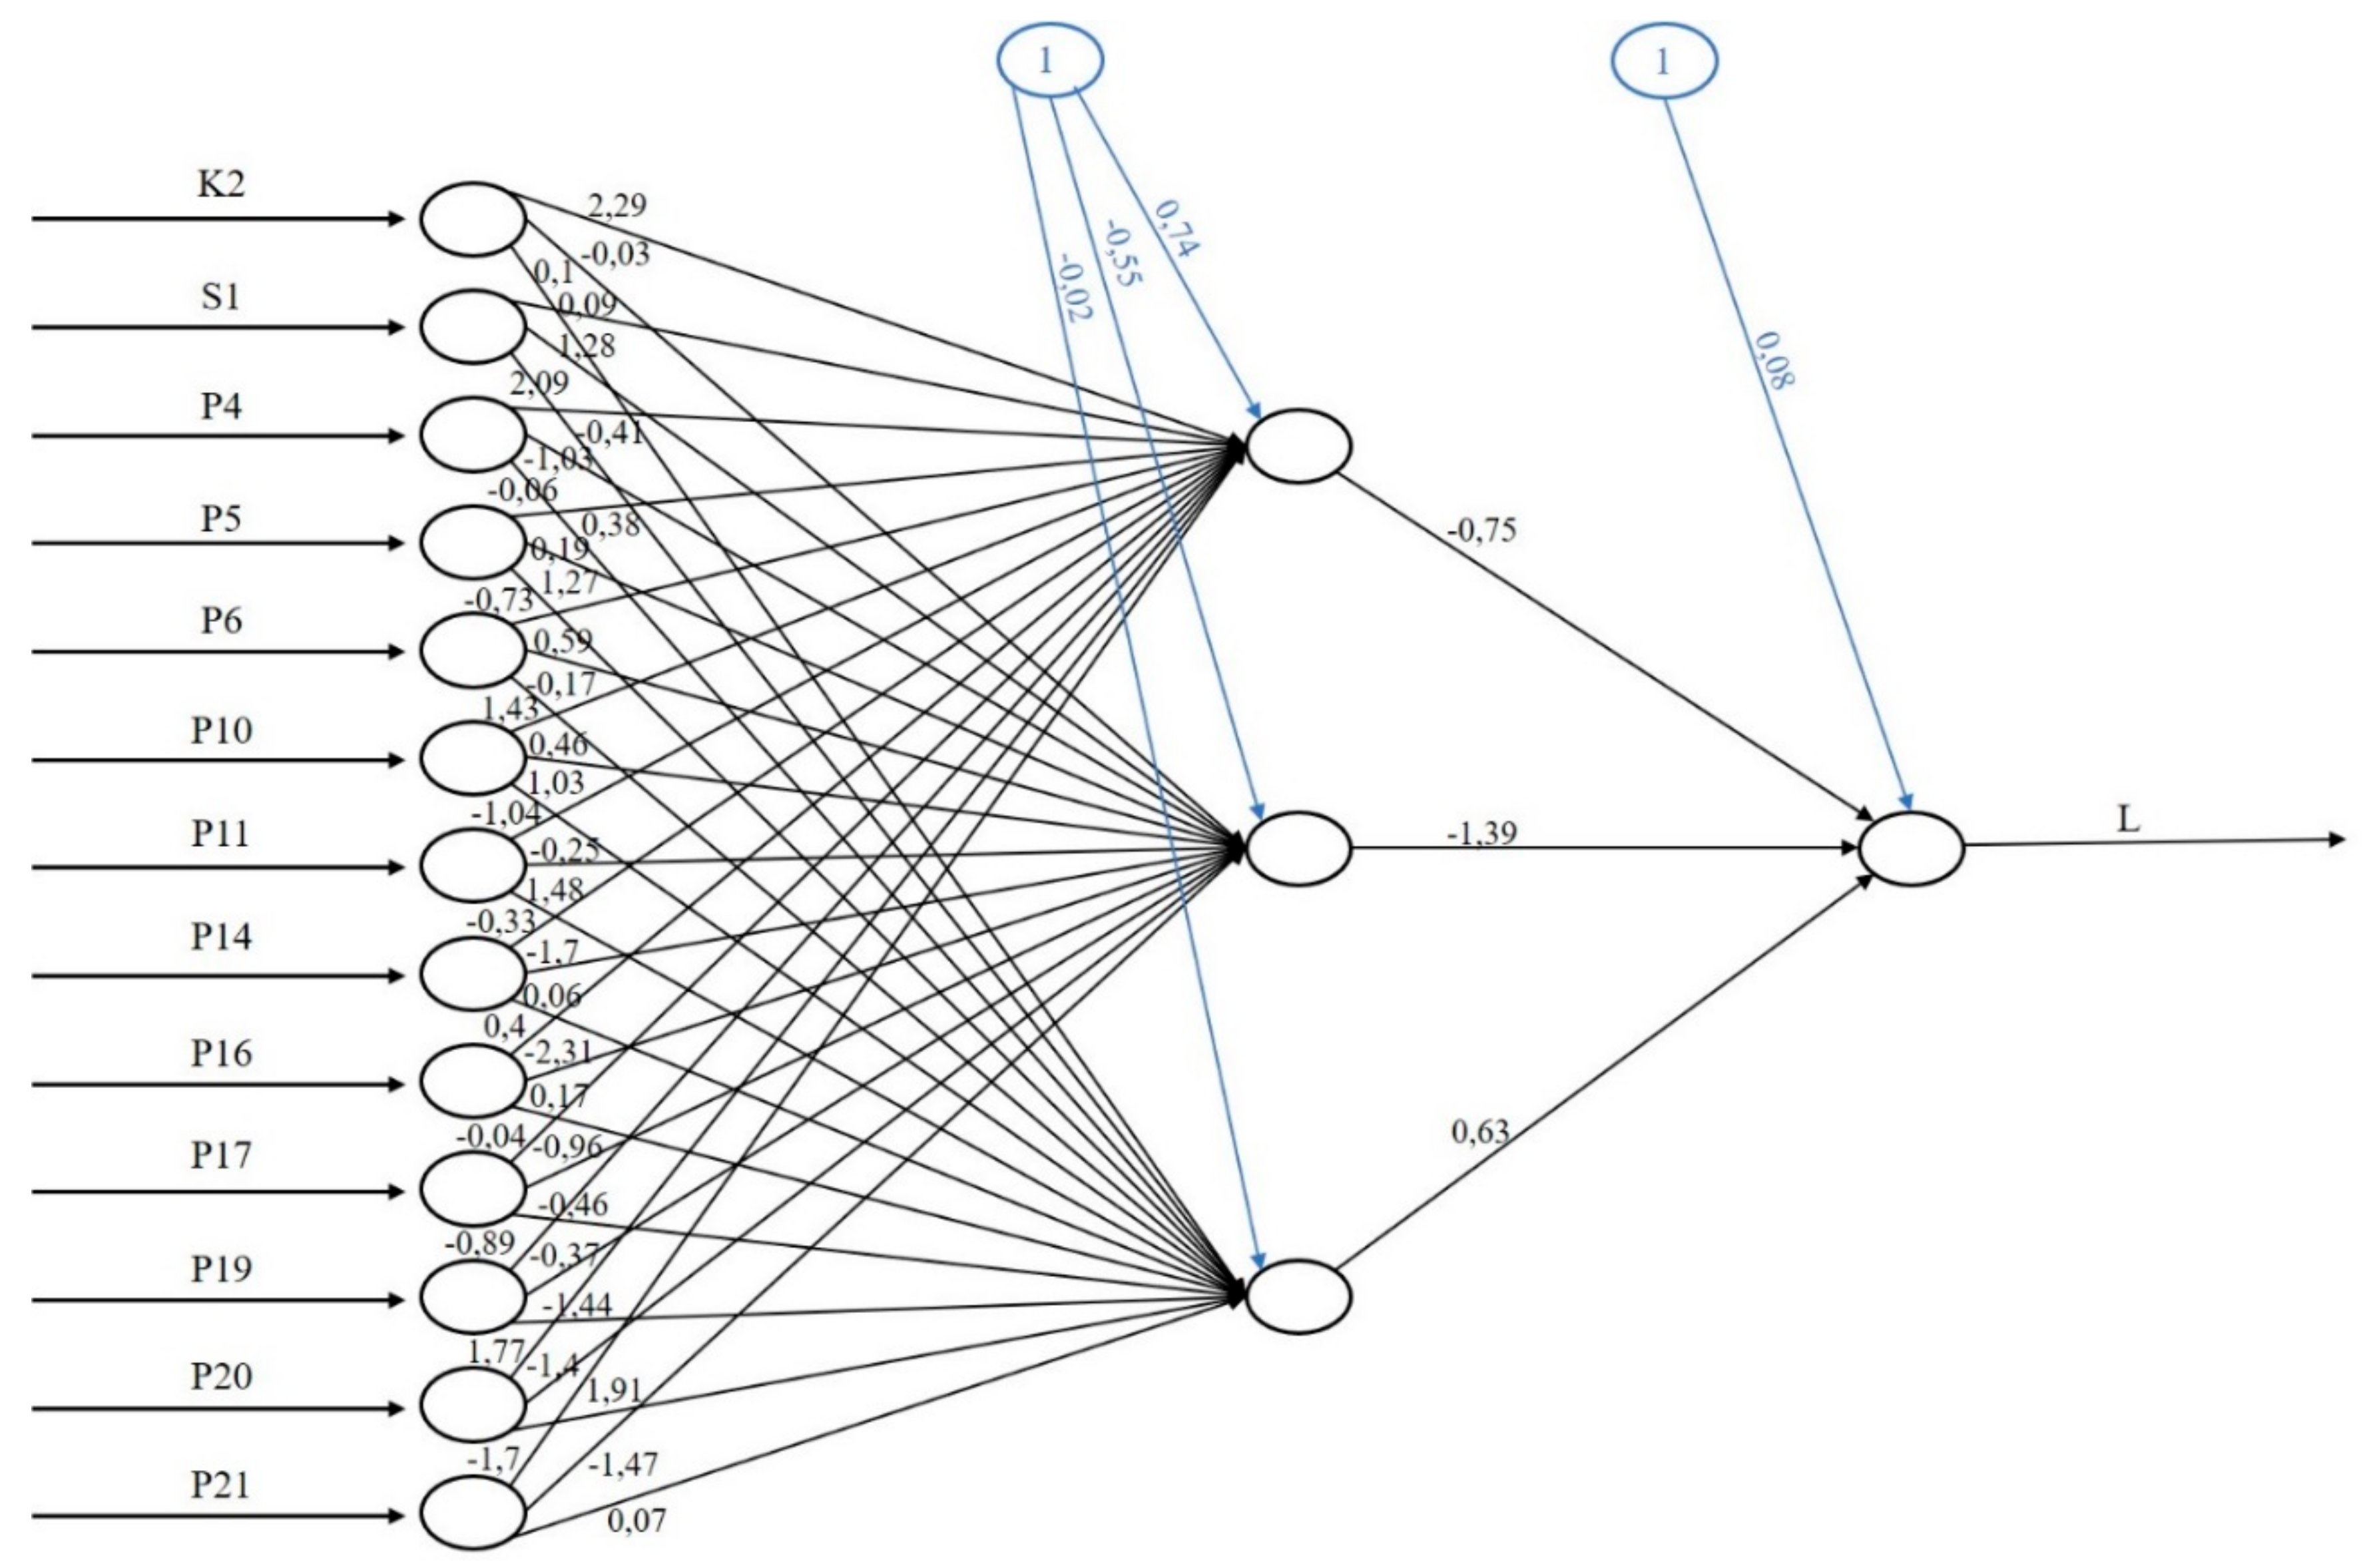
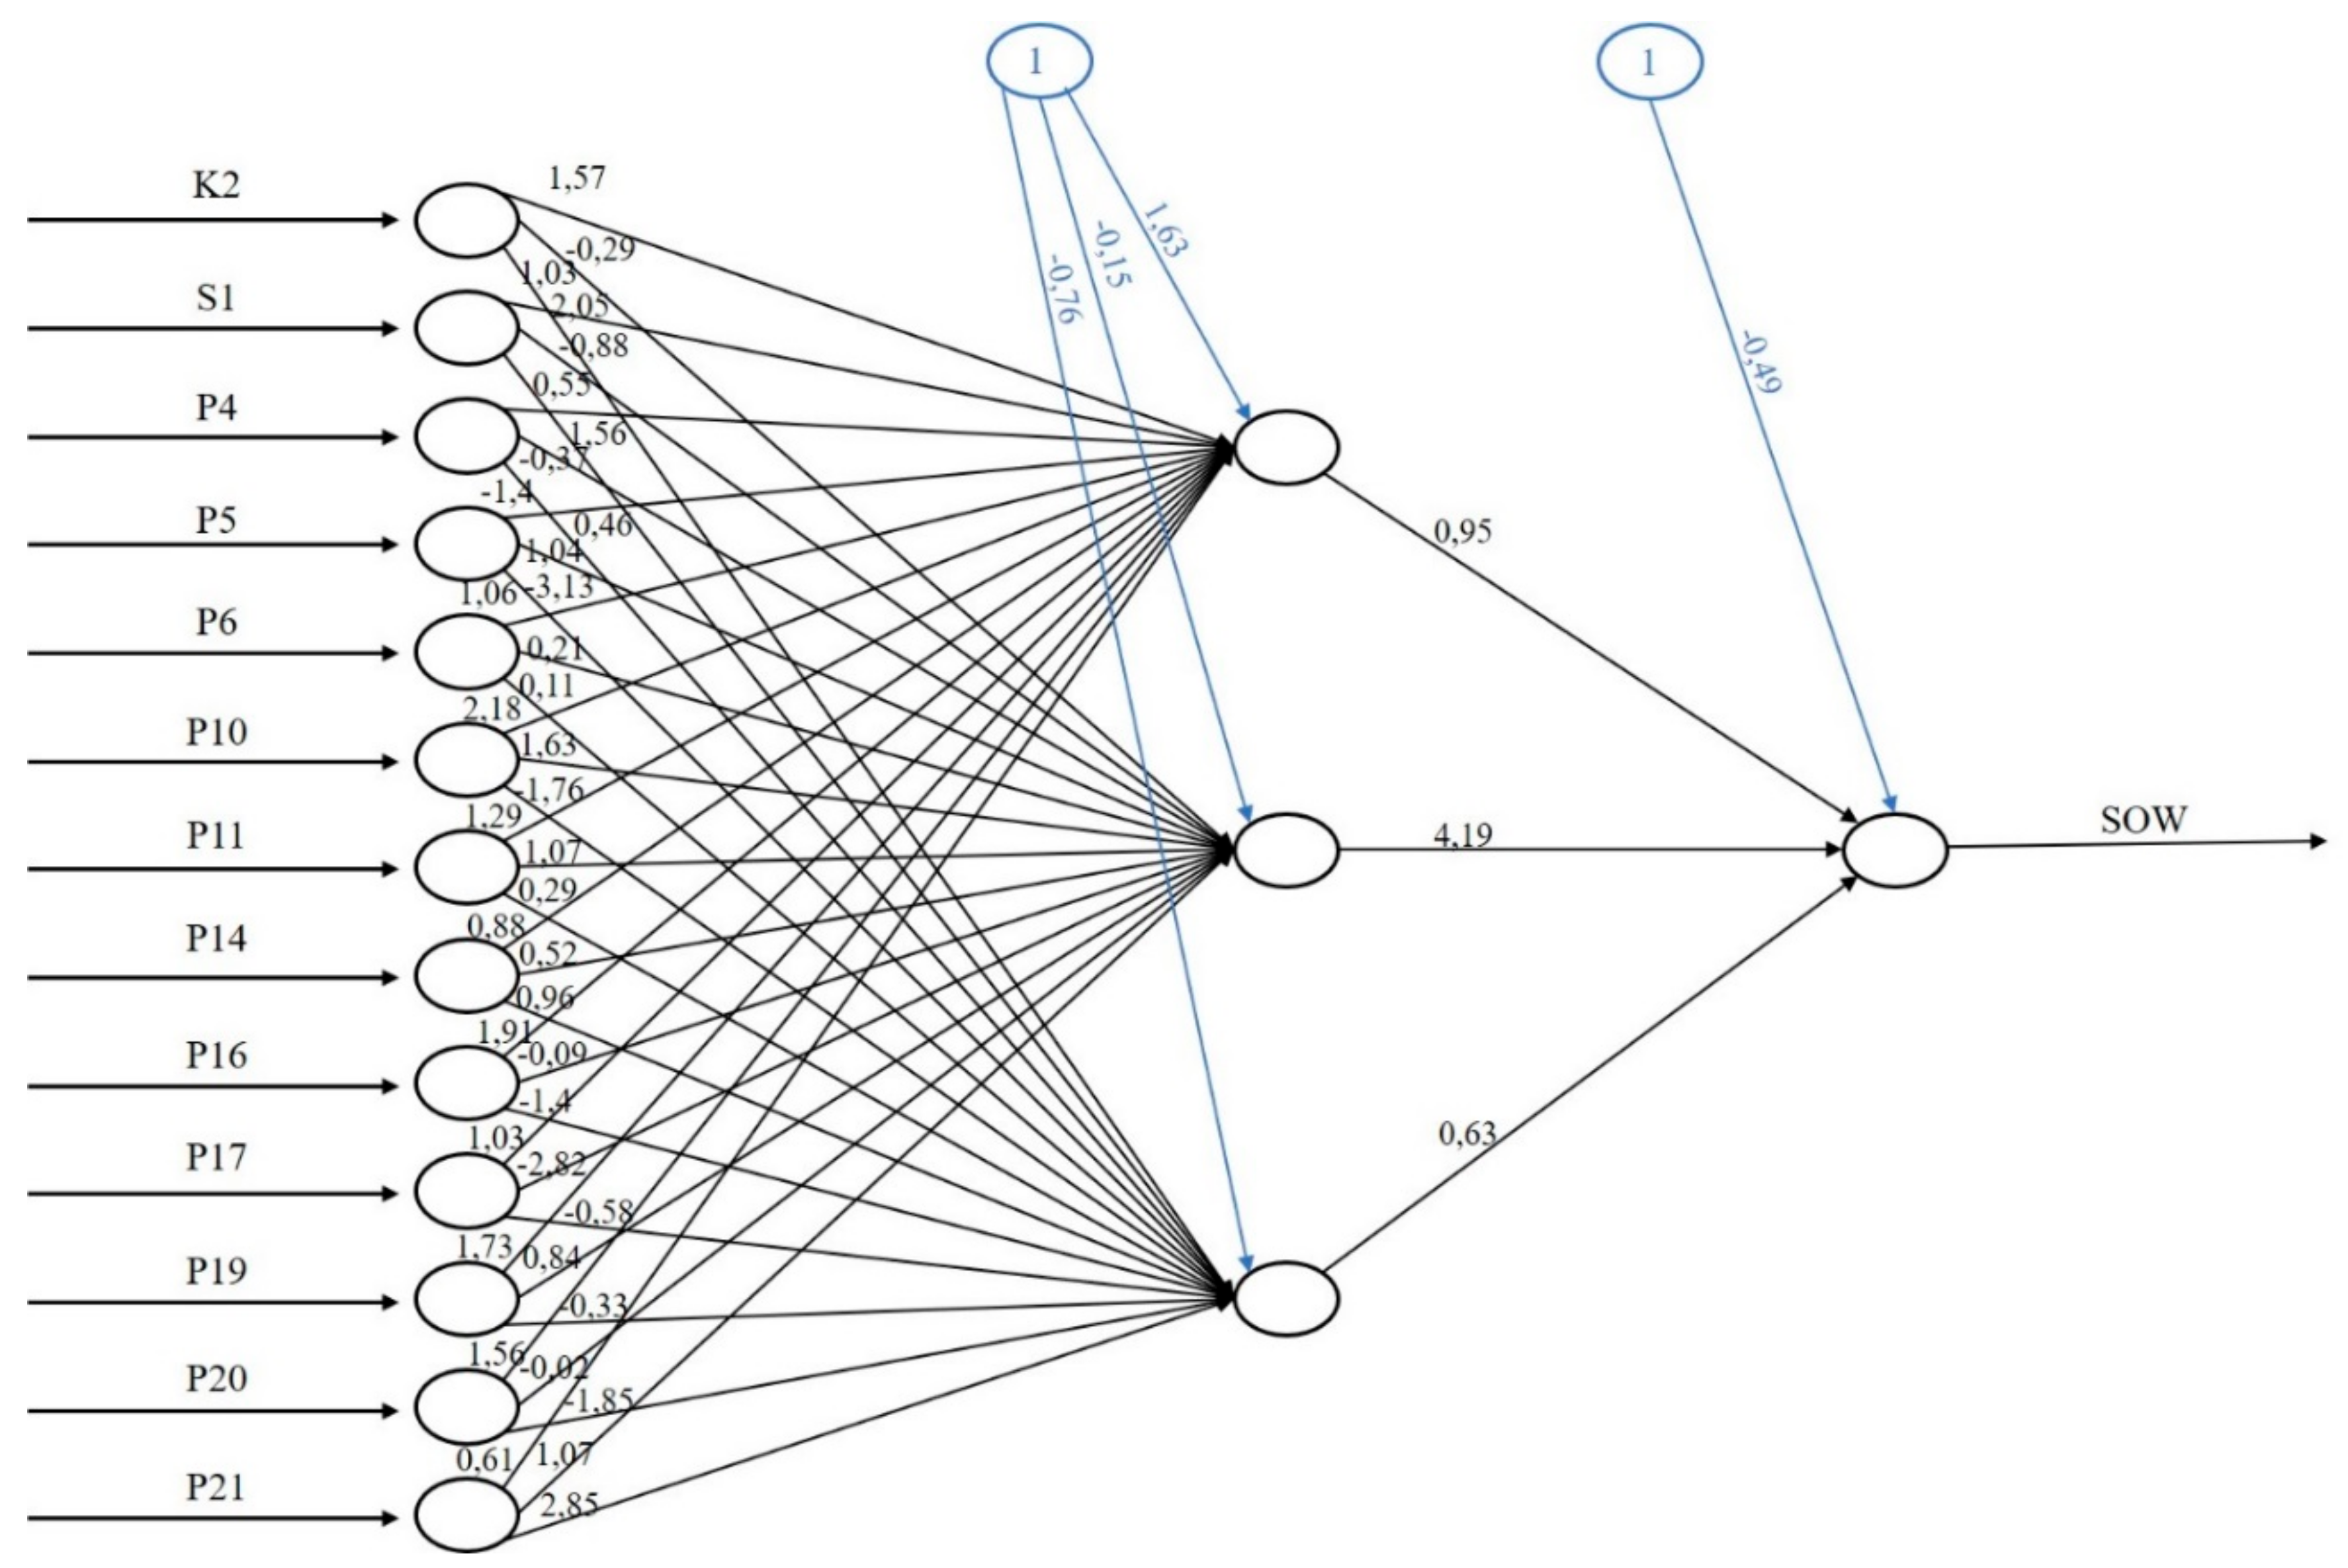
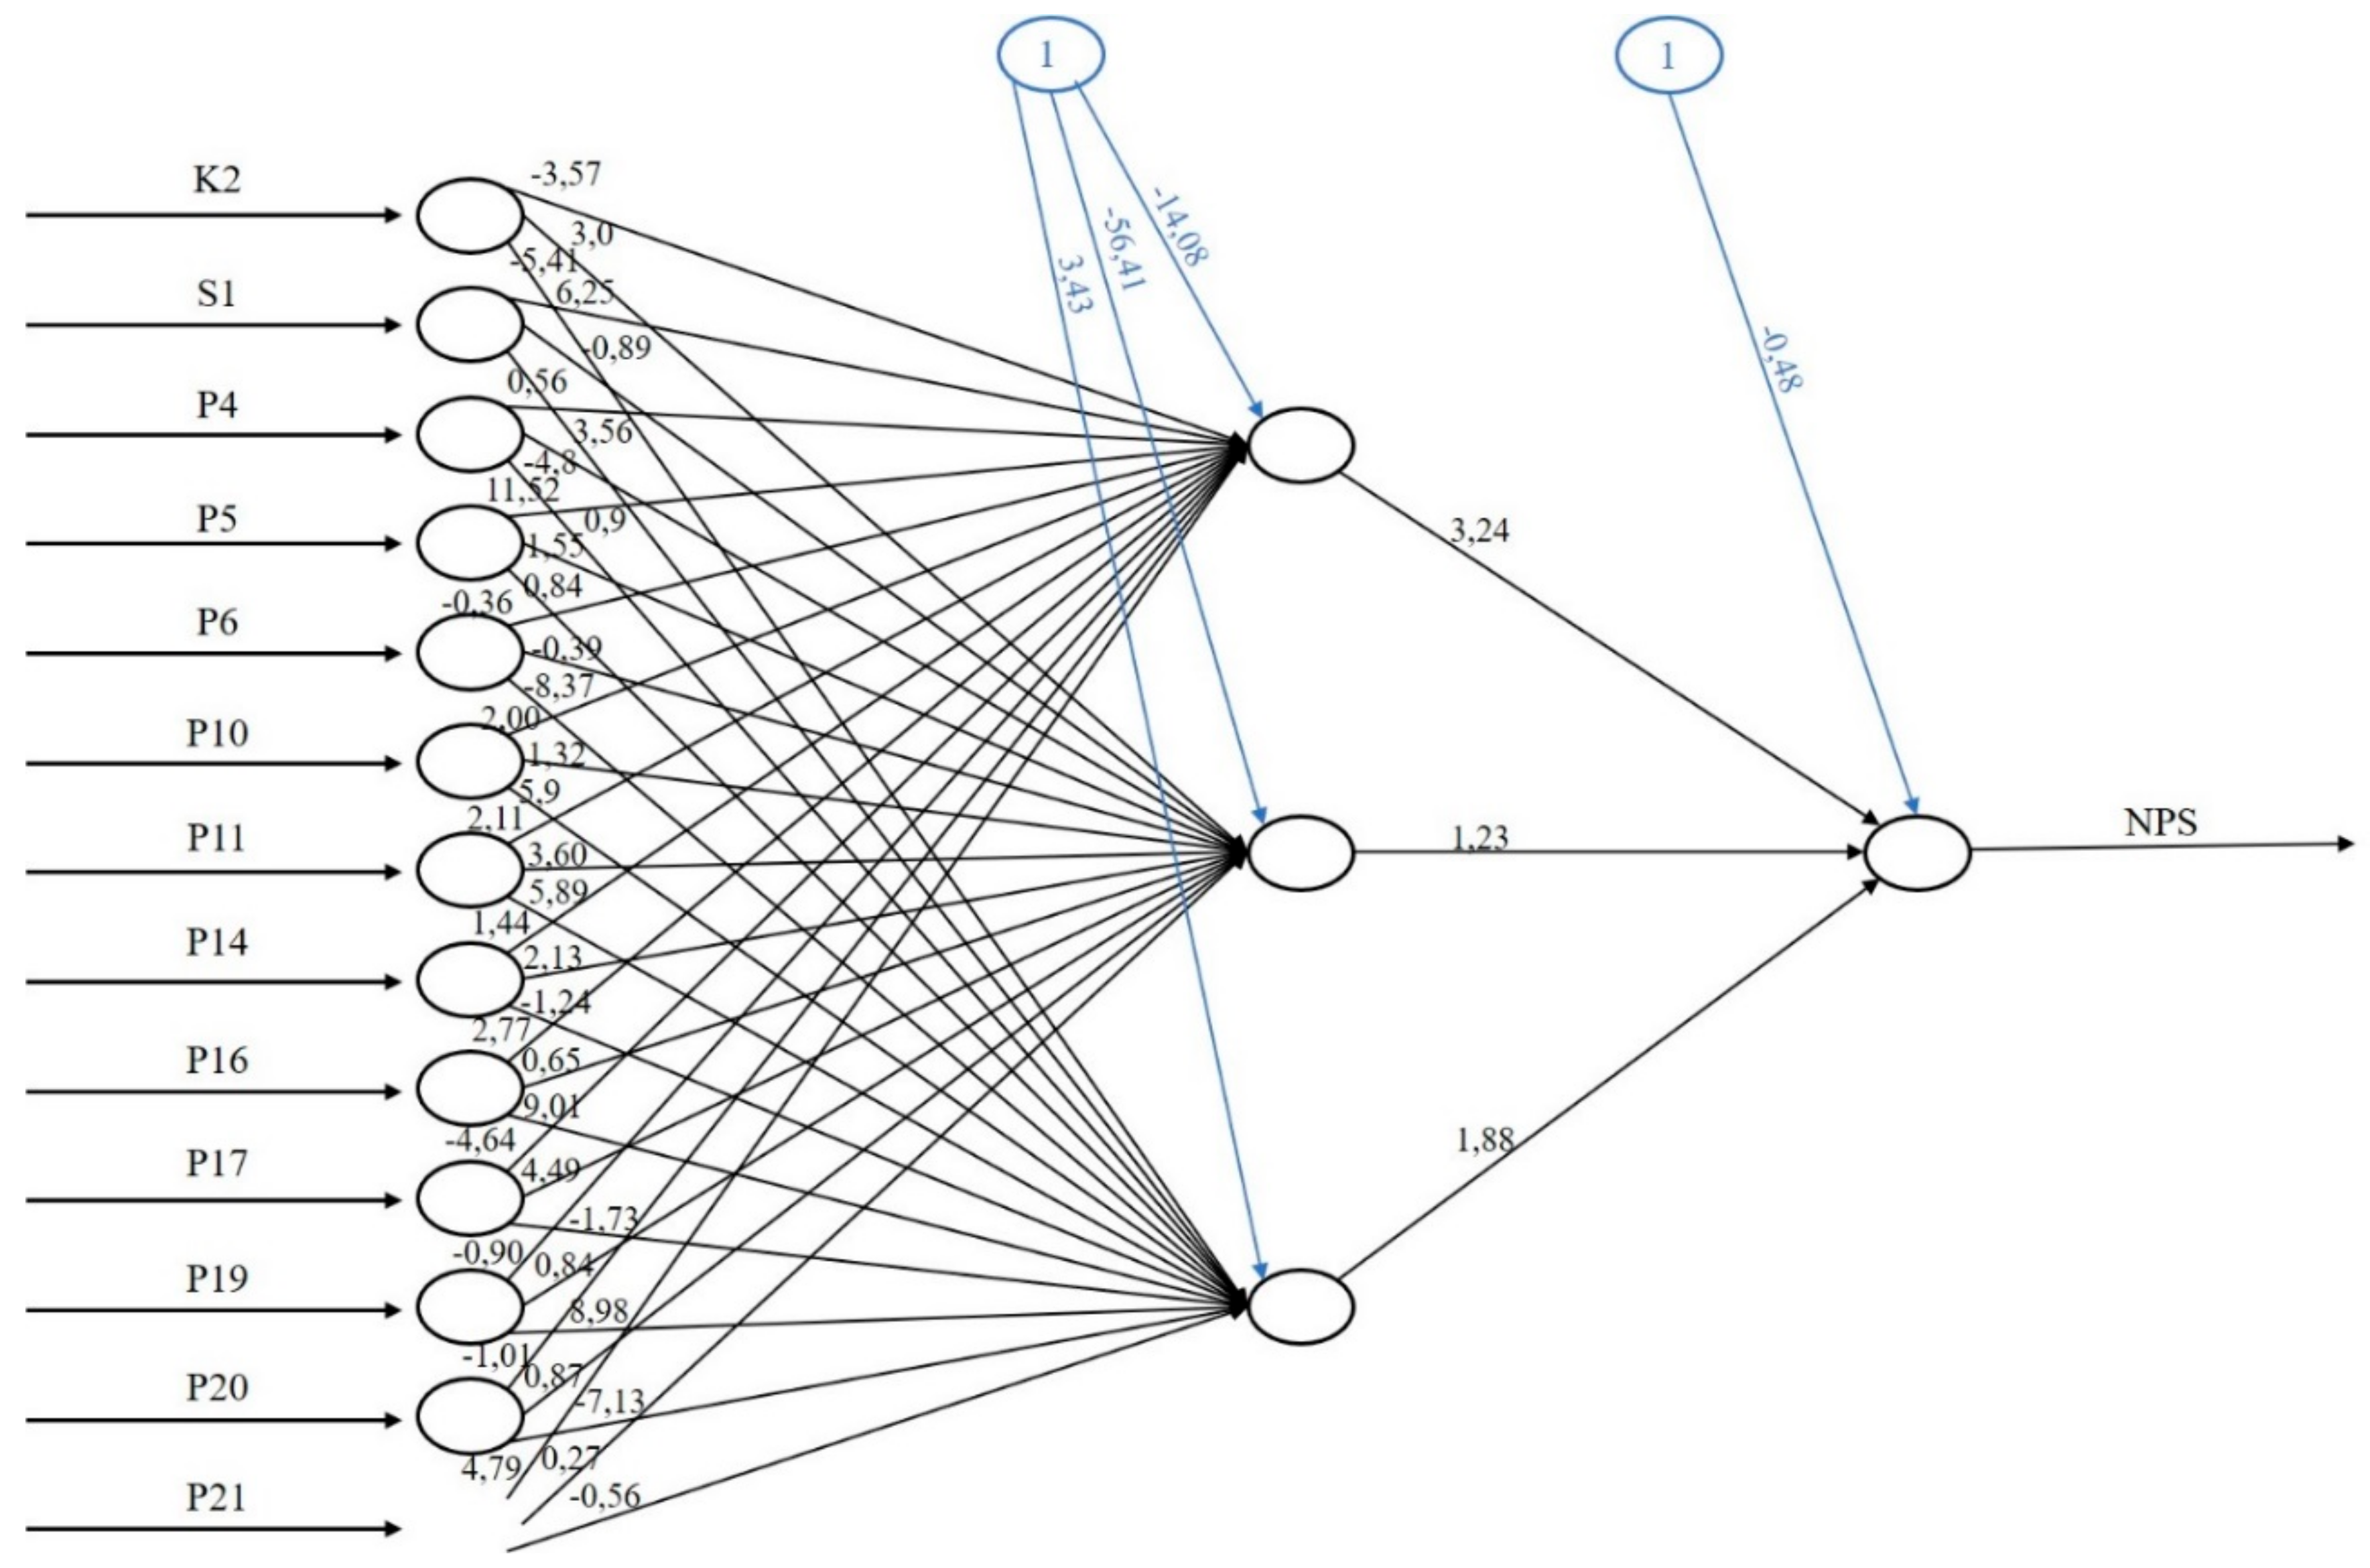
On the basis of our conclusions, 13 variables were used to project loyalty: (1) age of the respondents (K2); (2) the origin of the vehicle—new or used (S1) and the variables measuring the compatibility with the statements claiming that: (3) the materials concerning the provision of the services by the auto repair shop (leaflets, folders, website) are visually attractive (P4); (4) operation materials and spare parts that are used by the auto repair shop, which are available in the course of the provision of a service in case of need (P5); (5) the auto repair shop is clean and tidy (P6); (6) documentation connected with the provided services is correct (P10); (7) the services that are offered by the auto repair shop are in line with customers’ expectations (P11); (8) the services are individualized and adjusted to the needs of the customers (P14); (9) the auto repair shop is prepared to provide a given service every time that it is needed (P16); (10) the workers employed in the auto repair shop are kind and polite (P17); (11) the worker of the auto repair shop is helpful in selecting operation materials and spare parts (P19); (12) the auto repair shop guarantees an alternative vehicle to be used during the repair (P20); and (13) the services that are offered by the auto repair shop are provided in the comprehensive way (P21). The remaining variables were not considered due to the correlation with the variables listed above or due to the marginal impact on the projected variable. In Table 1 we present 16 different variants of models which were tested.
As can be seen in the last three columns in Table 1, from among analyzed neural networks, the model based on the backpropagation error with three hidden layers (in Table 1 marked as Mod1) proved to be the best. Average Squared Error for the loyalty expressed by the frequency of the visits (L) is 0.288 and for the loyalty in the value-oriented perspective (SOW) it is even lower and equals to 0.166. These low values translate into extremely high efficiency of the network (projection accuracy). Whereas, Misclassification Rate for the NPS measure turns out to be relatively high, with the amount of 0.75, while the projection with the use of this network gives much better results than the random classification.
The forms of the obtained neural networks are presented in Figure 5, Figure 6 and Figure 7 for the loyalty expressed by L, SOW, and NPS, respectively.
In connection with the above, it may be stated that the created neural networks project the loyalty of the customers of the auto repair shops in appropriate manner.
5. Discussion of the Obtained Customers Segmentation
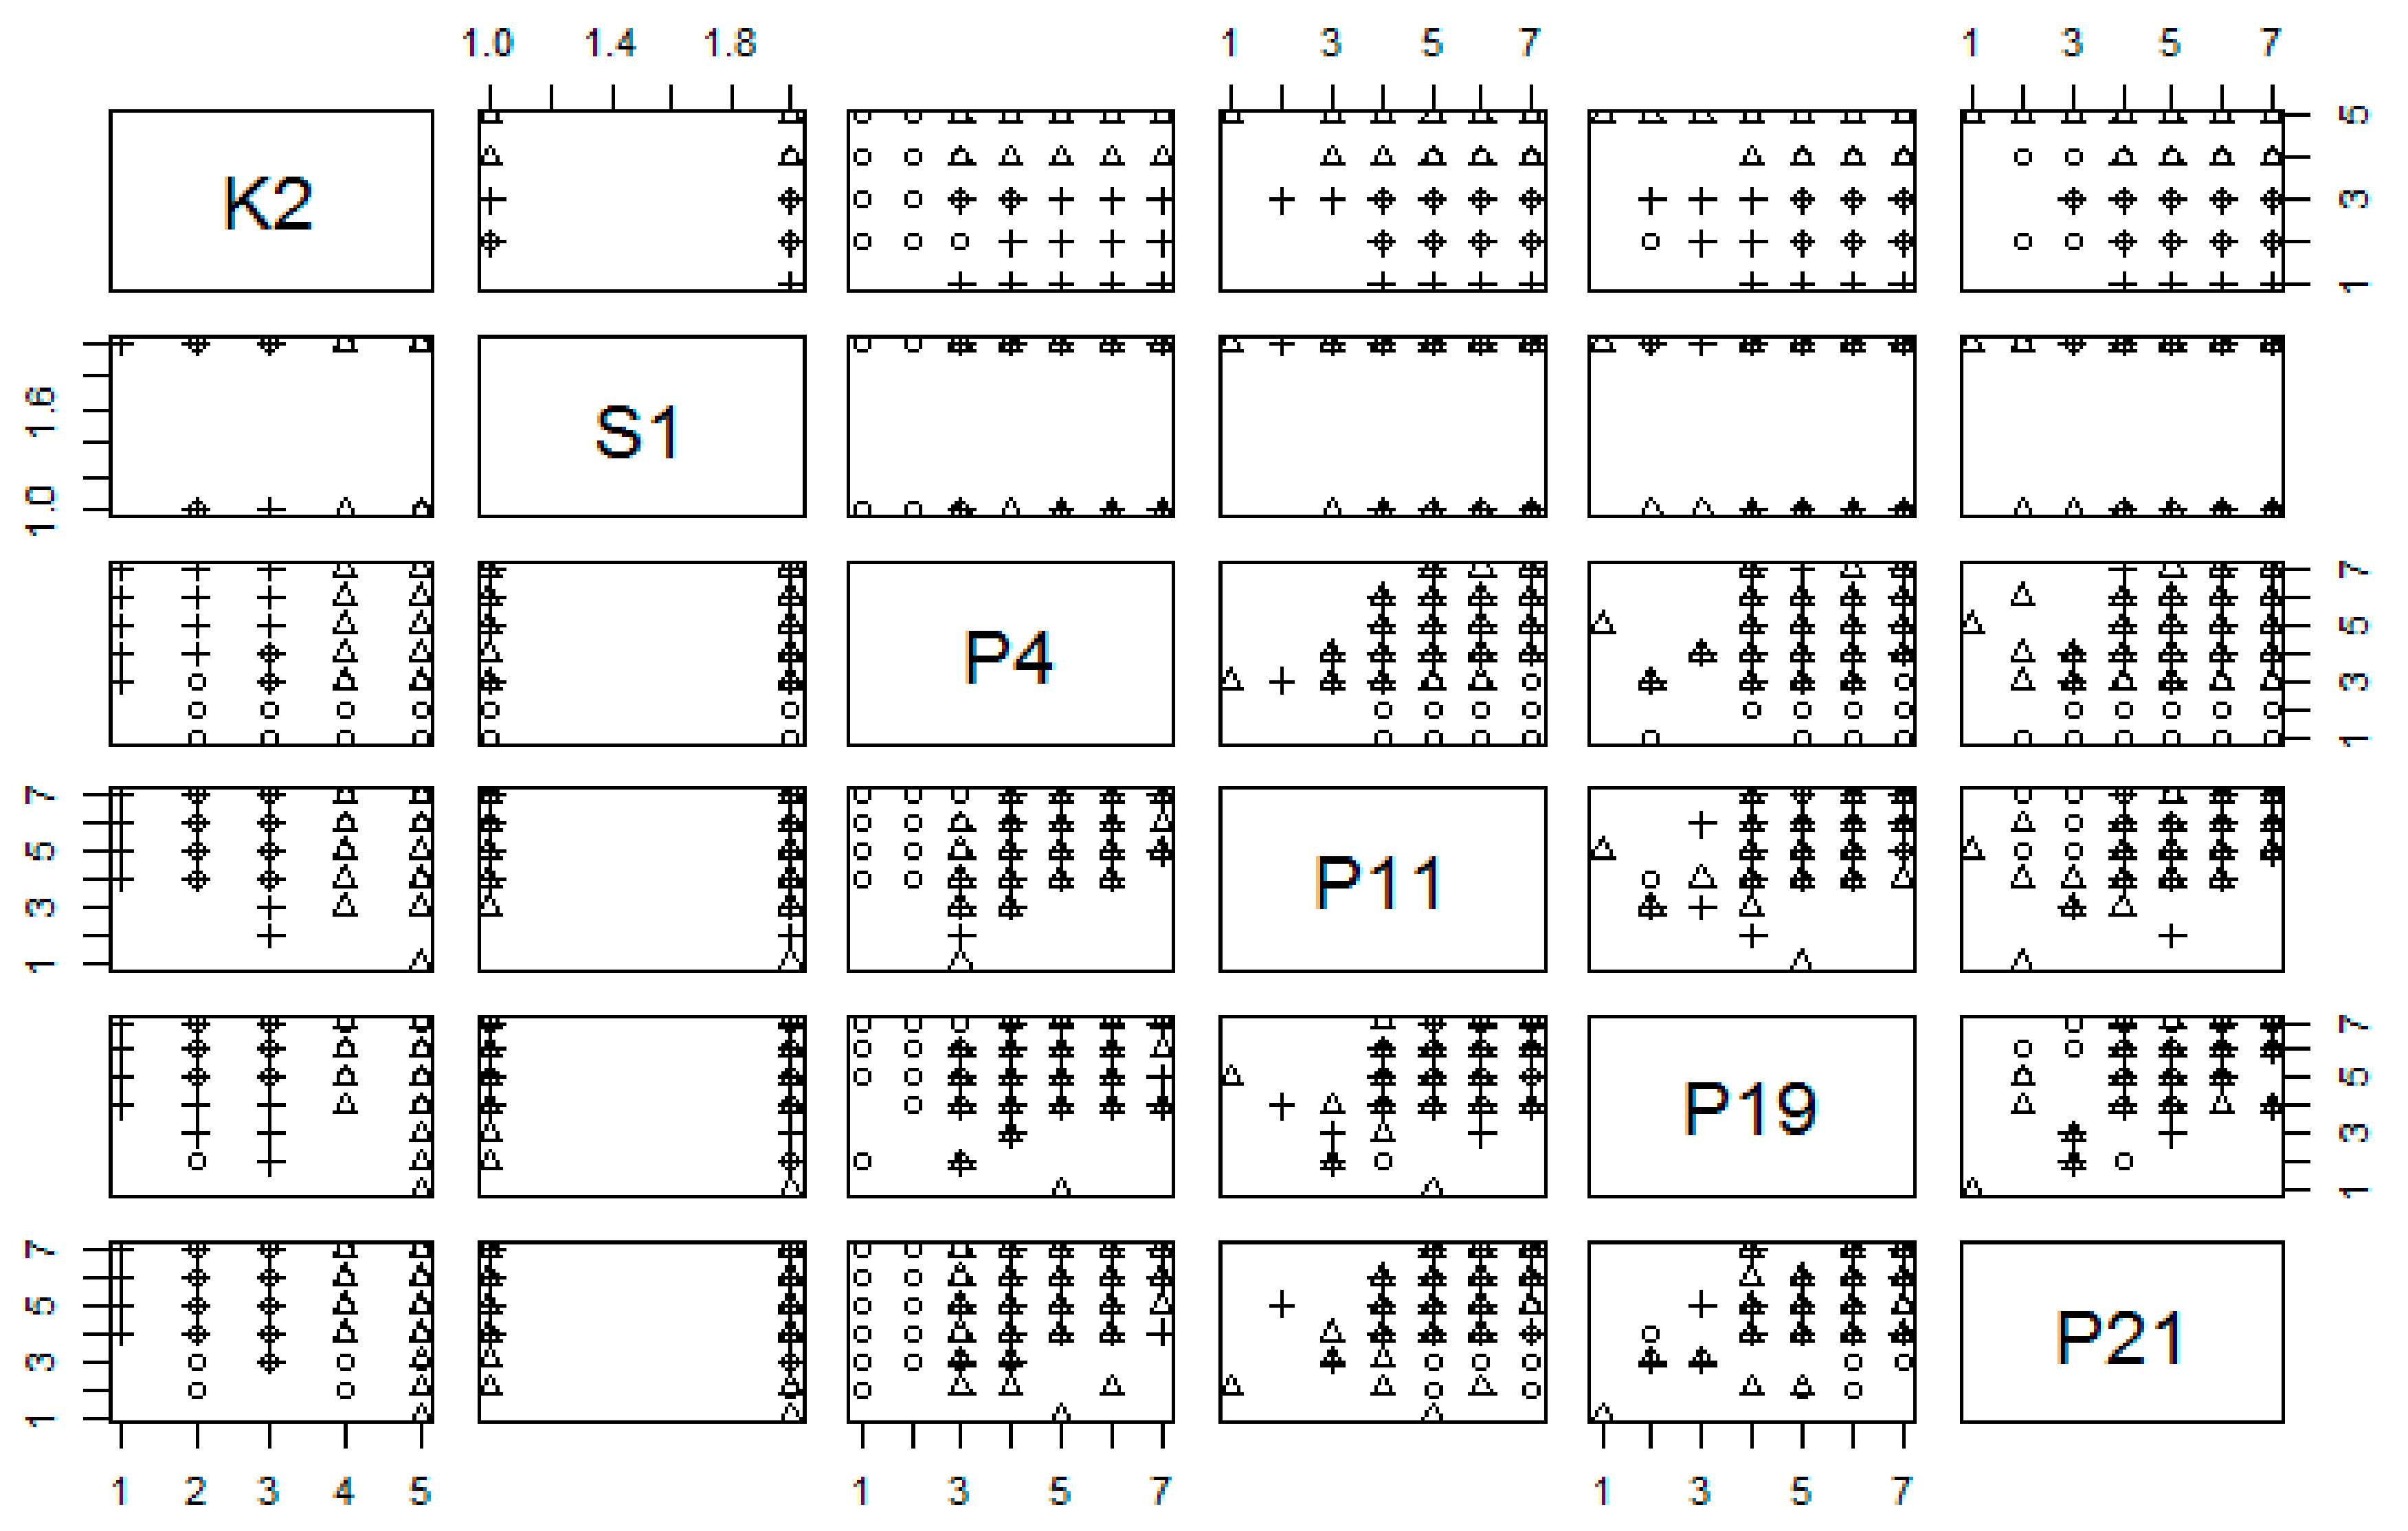
The formulated model has an application value. The significance of applications of the model and analyses is illustrated with the use of a comparison of the loyalty measures for various groups of customers. On the basis of the identified model that is based on neural networks, the most important segmentation criteria have been indicated. These are K2, S1, P4, P11, P19, and P21 variables. They have been selected in a manner, which allows for the remaining groups to differentiate customers with respect to all of the loyalty measures in the best possible way. As the k-averages algorithm requires an a priori assumption as to the number of clusters, the solutions for three, four, and five segments have been tested. The greatest differences in the values of the loyalty measures have been obtained for the solution covering four segments, which have been accepted as the final ones. Figure 8 presents segmentation of customers.
On the basis of the results of cluster analysis that are presented in Figure 8, it may be concluded that each of the four segments has its own characteristics. The first segment covers persons above 40 years of age, who more often than the other groups buy used vehicles, assess the level of the quality of the information materials presenting the services that are offered by the auto repair shops at the low level, however they simultaneously assess the assistance that is offered by the workers of the auto repair shop at the high level. The second segment includes persons above 40 years of age, but they more often buy new vehicles. Moreover, these customers assess the quality of the promotional materials of the auto repair shop and the comprehensiveness of the offered services at the high level. In the third segment, there are persons above 50 years of age, who also buy new vehicles, but they differ from the third segment in respect to the assessment of the selected attributes of the quality of provided services in that way that they assess it much worse. Whereas, the last, the fourth segment is mainly composed of young persons. Table 2 presents the values of the quality measures for each segment.
The analysis of data presented in Table 2 suggests that the particular segments significantly differ from each other in respect to the loyalty. It is especially visible in the case of L and NPS rates, in the case of which the difference between segment 1 and 4 amounts, respectively, to 20 p.p. and 37. Whereas, in the case of the SOW indicator, this difference is also high and it amounts to 9 p.p. In general, the results of the study show that taking into consideration the values of all three measures; the customers of segment 1 are the most loyal ones. In this segment, the values of all three measures are the highest and amount to: L = 80%, SOW = 53%, NPS = 0. Segment 1 mainly includes the persons above 40 years of age, who much more often buy used vehicles, they assess promotional materials of an auto repair shop at the low level, but the assistance provided by the workers of the auto repair show is highly valued. Customers from the second segment seem to be moderately loyal, as despite significantly lower values of the quantity-oriented (L = 66%) and value-oriented (SOW = 47%) measures, the level of behavioral measure is high (NPS = −5). Customers above 40 years of age are moderately loyal, but they buy new vehicles more often. Additionally, they assess the quality of promotional materials that are published by the auto repair shops high, which is similar to the comprehensiveness of the offered services. Finally, customers that are included in segment 3 and 4 are the least loyal. This group is composed of persons above 50 years of age, who mainly buy new vehicles and assess the quality of provided services at the low level (segment 3, L = 64%, SOW = 46%, NPS = −31), or in the first place, young persons i.e., segment 4 (L = 60%, SOW = 44%, NPS = −37).
6. Conclusions
The carried out analysis led to the following conclusions. Firstly, within the scope of projecting loyalty of the customers taking advantage of technical services and the repair of passenger cars:
- weak incentive-oriented loyalty of the customers is confirmed by the value of the NPS indicator, which amounts to −20.2 for the entire population under study, i.e., the hypothesis H1 has been verified;
- the loyalty of the customers towards the auto repair shops is diversified and it depends on: (1) the characteristics of the customer; (2) the characteristics of the used vehicle and the manner of its operation; and (3) the assessment of the quality of the services that are offered by the auto repair shop. The attributes of the quality of the after sales service diversify the loyalty of the customers much better than the variables concerning customer’s characteristics or vehicle’s characteristics and the manner of its operation. Therefore, hypothesis H2 has been verified;
- the obtained neural network model appropriately projects the loyalty of the customers of the auto repair shops that is expressed by each of the three accepted measures. In that way, hypothesis H3 has been verified.
Secondly, within the scope of the segmentation of the customers of the auto repair shops in respect of the loyalty, it has been stated that, when taking the values of all three loyalty measures into consideration, the customers from segment 1 present the strongest loyalty. The values of the loyalty measures are as follows: L = 80%, SOW = 53%, and NPS = 0. The customers from segment 2 are moderately loyal, which is mainly due to the relatively high value of NPS = −5, with the pruned L = 66% and SOW = 47% values. Whereas, consumers that were included in segment 3 and 4 represent the lowest level of loyalty towards the auto repair shops. The values of L measurement amount to, respectively: 64% and 60%, SOW 46%, and 44%, whereas NPS −31 and −37. Thus, the hypothesis H4 has been verified.
Author Contributions
A.L. suggested a general concept of the model, designed the whole study, analyzed customers segmentation and edited the paper. P.A.K. selected statistic tools, programmed neural networks, compared different models and suggested the best one. M.A.L. prepared a literature review, questionnaire and collected data. R.L. discussed the results and draw conclusions.
Conflicts of Interest
The authors declare no conflict of interest.
Appendix A

Table A1.
Tabular List of Variables.
| Section | No. | Abbr. | Criterion/Question/Statement |
|---|---|---|---|
| 1—Customer characteristics | 1 | K1 | Customer sex |
| 2 | K2 | Customer age | |
| 3 | K3 | Customer education | |
| 4 | K4 | How long are you a car user? | |
| 5 | K5 | Was your previous car of the same make? | |
| 2—Car characteristics | 1 | S1 | Did you buy your present car as new or used one? |
| 2 | S2 | What is the age of your present car? | |
| 3 | S3 | Please type the average annual mileage of your car | |
| 4 | S4 | Where do you maintain and repair your car (authorized, independent workshop or both)? | |
| 3—Customer Loyalty | 1 | L1 | How many times have you visited any auto repair shop last year? |
| 2 | L2 | How many times have you visited your favourite auto repair shop last year? | |
| 3 | L3 | Do you visit any other auto repair shop than your favourite? | |
| 4 | L4 | How many times have you visited auto repair shop other than your favourite last year? | |
| 5 | L5 | How likely are you to recommend your favourite auto repair shop to a friend? | |
| 6 | L6 | If it was your first visit in auto repair shop, how likely were you to visit your favourite one? | |
| 4—Price | 1 | C1 | What was your total expenditure for maintanining and repairing your car last year? |
| 2 | C2 | What was your total expenditure for maintanining and repairing your car in your favourite auto repair shop last year? | |
| 3 | C3 | What was the price of service during your last visit in your favourite auto repair shop? | |
| 4 | C4 | What was your total expenditure for maintanining and repairing your car during your last visit in auto repair shop? | |
| 5—Purpose | 1 | R1 | Would you choose service offered by an unknown auto repair shop, if it offered prices 5% lower than your favourite one? |
| 2 | R2 | What was a purpose of your last visit in your favourite auto repair shop? | |
| 3 | R3 | What kind of service was delivered to you during your last visit in your favourite auto repair shop? | |
| 4 | R4 | From what source of information did you learn about your favourite auto repair shop? | |
| 6—Service quality | 1 | P1 | Auto repair shop has modern looking equipment. |
| 2 | P2 | Physical environment of auto repair shop is visually attractive. | |
| 3 | P3 | Auto repair shops employees are tidy. | |
| 4 | P4 | Promotional materials concerning services provided by auto repair shop are attractive. | |
| 5 | P5 | Spare parts and maintenance materials in auto repair shop are available in at the moment of need | |
| 6 | P6 | Auto repair shop is clean and tidy. | |
| 7 | P7 | In auto repair shop there is a place for customers waiting for service provision. | |
| 8 | P8 | Auto shop provides services on time. | |
| 9 | P9 | Auto repair shop provides its service correctly in the first attempt. | |
| 10 | P10 | Auto repair shop prepares proper concerning service provision. | |
| 11 | P11 | Auto repair shops provides services accordingly to customer expectations. | |
| 12 | P12 | An existing fault is recognized by auto repair shop correctly in the first attempt. | |
| 13 | P13 | After providing a service by auto repair shop a car is given back to the owner in not worsen condition. | |
| 14 | P14 | Services provided by auto repair shop are customized, tailored to customer needs. | |
| 15 | P15 | Auto repair shop services are provided in hours convenient for customers. | |
| 16 | P16 | In auto repair shop there is possibility to provide a service immediately (in a moment of need). | |
| 17 | P17 | Auto repair shop employees are kind and polite. | |
| 18 | P18 | In auto repair shop time of waiting for starting customer service is short. | |
| 19 | P19 | Auto repair shop employee is helpful when selecting spare parts. | |
| 20 | P20 | For the period of providing service auto repair shop immediately proposes a spare car. | |
| 21 | P21 | Auto repair shops delivers complex services. | |
| 22 | P22 | Auto repair shop employees have proper qualifications and knowledge. | |
| 23 | P23 | Before starting service provision auto repair shop employee informs about its scope. | |
| 24 | P24 | When a problem exists, auto repair shop employees are able to solve it immediately. | |
| 25 | P25 | Auto repair shop employees serve to customers quickly and effectively. | |
| 26 | P26 | In auto repair shop time of waiting for starting service provision is short. | |
| 27 | P27 | Auto repair shop employee comprehensively presents offer and estimate of a service. | |
| 28 | P28 | In case of unplanned changes in a time or scope of a service auto repair shop employee immediately informs a customer. |
References
- Akpakpavi, M. Modern automobile vehicle repair practices in micro, small and medium garages in Ghana. Int. J. Sci. Technol. Soc. 2014, 6, 216–222. [Google Scholar]
- Akinola, A. Parts Standardization in the Motor Industry; Federal University of Technology: Akure, Nigeria, 1995. [Google Scholar]
- Akinola, B.; Ogedenge, T. Basic Automobile Technology; Olajuyin Printers: Akure, Nigeria, 2005. [Google Scholar]
- Freedonia Group. Automotive Repair and Maintenance Services; The Freedonia Group: Cleveland, OH, USA, 2007. [Google Scholar]
- Brogan, C.; Smith, J. Trust Agents: Using the Web to Build Influence, Improve Reputation, and Earn Trust; John Wiley & Sons: New York, NY, USA, 2010. [Google Scholar]
- Hayes, B. Measuring Customer Satisfaction and Loyalty; ASQ Quality Press: Milwaukee, WI, USA, 2008. [Google Scholar]
- Branża Motoryzacyjna w Polsce 2015—Liczby, Podsumowania, Analizy; Stowarzyszenie SDCM: Warszawa, Poland, 2016.
- Pilkington, A.; Chai, K. Research Themes, Concepts and Relationships: A study of International Journal of Service Industry Management (1990 to 2005). Int. J. Serv. Ind. Manag. 2008, 19, 83–110. [Google Scholar] [CrossRef]
- Chai, K.; Ding, Y.; Xing, Y. Quality and Customer Satisfaction Spillovers in the Mobile Phone Industry. Serv. Sci. 2009, 2, 93–106. [Google Scholar] [CrossRef]
- Cronin, J.; Taylor, S. Managing Service Quality: A Reexamination and Extension. J. Mark. 1992, 56, 55–68. [Google Scholar] [CrossRef]
- Patterson, P.; Spreng, R. Modeling the Relationship between Perceived Value, Satisfaction and Repurchase Intentions in a Business-to-business, Services Context: An Empirical Examination. Int. J. Serv. Ind. Manag. 1997, 8, 414–434. [Google Scholar] [CrossRef]
- Wolfinbarger, M.; Gilly, M. eTailQ: Dimensionalizing, Measuring and Predicting eTail Quality. J. Retail. 2003, 79, 183–198. [Google Scholar] [CrossRef]
- Yi, Y. A critical review of consumer satisfaction. In Review of Marketing; Zeithaml, V., Ed.; American Marketing Association: Chicago, IL, USA, 1990; pp. 68–123. [Google Scholar]
- Bloemer, J.; Kasper, H. The complex relationship between consumer satisfaction and brand loyalty. J. Econ. Psychol. 1995, 16, 311–329. [Google Scholar] [CrossRef]
- Bennet, R.; Rundle-Thiele, S. Customer satisfaction should not be the only goal. J. Serv. Mark. 2004, 18, 514–523. [Google Scholar] [CrossRef] [Green Version]
- Schultz, D. The Loyalty Paradox. Mark. Manag. 2005, 14, 10–11. [Google Scholar]
- Selnes, F. An Examination of the Effect of Product Performance on Brand Reputation, Satisfaction, Satisfaction and Loyalty. Eur. J. Mark. 1993, 27, 19–35. [Google Scholar] [CrossRef]
- Dimyati, M.; Subagio, N. Impact of Service Quality, Price and Brand on Loyalty with the mediation of Customer Satisfaction on Pos Ekspres in East Java. Mediterr. J. Soc. Sci. 2016, 7, 74–86. [Google Scholar] [CrossRef]
- Griffin, J. Customer Loyalty: How to Learn It, How to Keep It; Jossey-Bass Publishers: San Francisco, CA, USA, 1997. [Google Scholar]
- Oliver, R. Whence Customer Loyalty? J. Mark. 1999, 63, 33–44. [Google Scholar] [CrossRef]
- Banahene, S.; Ahudey, E.; Asamoah, A. Analysis of SERVQUAL Application to Service Quality Measurement and Its Impact on Loyalty in Ghanaian Private Universities. J. Manag. Strat. 2017, 8, 18–33. [Google Scholar] [CrossRef]
- Fripp, G. Increasing Customer Revenues: A Key Marketing Goal. Available online: http://www.clv-calculator.com (accessed on 18 December 2017).
- Morchett, D.; Swoboda, B.; Foscht, T. Perception of store attributes and overall attitude towards grocery retailers: The role of shopping motives. Int. Rev. Retail Distrib. Consum. Res. 2005, 15, 423–447. [Google Scholar] [CrossRef]
- Gremler, D.; Brown, S. Word-of-mouth communication and customer loyalty to service providers. In AMA Summer Educators' Conference Proceedings: Enhancing Knowledge Development in Marketing; Achrol, R., Mitchell, A., Eds.; American Marketing Association: Chicago, IL, USA, 1994; pp. 331–332. [Google Scholar]
- Stavanović, I.; Stanojević, D.; Nedić, A. Setting the after sale process and quality control at car dealerships to the purpose of increasing clients satisfaction. J. Appl. Eng. Sci. 2011, 11, 81–88. [Google Scholar]
- Brito, E.; Aguilar, R.; Brito, L. Customer choice of a car maintenance service provider: A model to identify the service attributes that determine choice. Int. J. Oper. Prod. Manag. 2007, 27, 464–481. [Google Scholar] [CrossRef]
- Bei, L.-T.; Chiao, Y.-C. The determinants of customer loyalty: An analysis of intangible factors in three service industries. Int. J. Commer. Manag. 2006, 16, 162–177. [Google Scholar] [CrossRef]
- Devaraj, S.; Matta, K.; Conlon, E. Product and service quality: The antecedents of customer loyalty in the automotive industry. Prod. Oper. Manag. 2001, 10, 585–597. [Google Scholar] [CrossRef]
- Haq, A. Satisfaction towards Customer Loyalty in Auto-Mobile Industry of Pakistan. Int. J. Manag. Bus. Res. 2012, 4, 364–371. [Google Scholar]
- Berger, H.; Peter, S.; Herrmann, A. Customer Satisfaction and Customer Loyalty in the Automotive Industry–Results of an Empirical Study. In Customer Retention in the Automotive Industry; Galber Verlag: Wiesbaden, Germany, 1997; pp. 293–315. [Google Scholar]
- Weissengerber, B. Customer Retention in the Automotive Industry—An Economic Analysis. In Customer Retention in the Automotive Industry; Gabler Verlag: Wiesbaden, Germany, 1997; pp. 317–348. [Google Scholar]
- Auh, S.; Johnson, D. The Complex Relationship between Customer Satisfaction and Loyalty for Automobiles. In Customer Retention in the Automotive Industry; Gabler Verlag: Wiesbaden, Germany, 1997; pp. 141–166. [Google Scholar]
- Jahanshahi, A.A.; Gashti, M.A.H.; Mirdamadi, S.A.; Nawaser, K.; Khaksar, S.M.S. Study the Effects of Customer Service and Product Quality on Customer Satisfaction and Loyalty. Int. J. Hum. Soc. Sci. 2011, 1, 253–260. [Google Scholar]
- Maheshwari, V.; Lodorfos, G.; Jacobsen, S. Determinants of Brand Loyalty: A Study of the Experience-Commitment-Loyalty Constructs. Int. J. Bus. Adm. 2014, 5, 13–23. [Google Scholar] [CrossRef]
- Izogo, E.; Ogba, I. Service quality, customer satisfaction and loyalty in automobile repair services sector. Int. J. Qual. Reliab. Manag. 2015, 32, 250–269. [Google Scholar] [CrossRef]
- Reichheld, F. The One Number You Need to Grow. Harv. Bus. Rev. 2003, 81, 46–54. [Google Scholar] [PubMed]
- Grönroos, C. Strategic Management and Marketing in the Service Sector; Chartwell-Bratt: London, UK, 1982. [Google Scholar]
- Parasuraman, A.; Berry, L.; Zeithaml, V. A Multiple-Item Scale for Measuring Customer Perceptions of Service Quality. J. Retail. 1988, 64, 12–40. [Google Scholar]
- Gummesson, E. Quality Management in Service Organizations; ISQA: Stoskholm, Sweden, 1996. [Google Scholar]
- Haywood-Farmer, J. A conceptual model of service quality. Int. J. Oper. Prod. Manag. 1998, 8, 19–29. [Google Scholar] [CrossRef]
- Armistead, C. Service Operation Strategy: Framework for Matching the Service Operations Task and the Service Delivery System. Int. J. Serv. Ind. Manag. 1990, 1, 6–16. [Google Scholar] [CrossRef]
- Lethinen, U.; Lethinen, J. Service Quality: A Study of Quality Dimensions; Service Management Institute: Helsinki, Finland, 1992. [Google Scholar]
- Spreng, R.; Mackoy, R. An empirical examination of a model of perceived service quality and satisfaction. J. Retail. 1996, 722, 203–218. [Google Scholar]
- Johnston, R. Service Quality; Warwick Business School: Warwick, UK, 1997. [Google Scholar]
- Johnston, R.; Silvestro, R. The determinants of service quality—A customer-based approach. In Proceedings of the Decision Science Institute Conference, San Diego, CA, USA, 20–23 November 1997. [Google Scholar]
- Zeithaml, V. Service quality, profitability and the economic worth of customers: What we know and what we need to learn. J. Acad. Mark. Sci. 2000, 28, 28–67. [Google Scholar] [CrossRef]
- Sureshchandar, G.; Rejendran, C.; Kamalanabhan, T. Customer perception of service quality: A critique. Total Qual. Manag. 2001, 12, 111–124. [Google Scholar] [CrossRef]
- Chiu, H.; Lin, N. A Service Quality Measurement Derived from the Theory of Needs. Serv. Ind. J. 2004, 24, 187–204. [Google Scholar] [CrossRef]
- Breiman, L.; Friedman, J.; Olshen, R.; Stone, C. Classification and Regression Trees; Chapman and Hall: London, UK, 1984. [Google Scholar]
- Günther, F.; Fritsch, S. Neuralnet: Training of Neural Networks. R J. 2010, 2, 30–38. [Google Scholar]
- Bergmeir, C.; Benítez, J. Neural Networks in R Using the Stuttgart Neural Network Simulator: RSNNS. J. Stat. Softw. 2012, 46, 1–26. [Google Scholar] [CrossRef]
- Parekh, R.; Yang, J.; Honavar, V. Constructive Neural-Network Learning Algorithms for Pattern Classification. IEEE Trans. Neural Netw. 2000, 11, 436–451. [Google Scholar] [CrossRef] [PubMed]
- Anastasiadis, A.; Magoulas, G.; Vrahatis, M. New globally convergent training scheme based on the resilient propagation algorithm. Neurocomputing 2005, 64, 253–270. [Google Scholar] [CrossRef]
- Tryon, R. Cluster Analysis; McGraw-Hill: New York, NY, USA, 1939. [Google Scholar]
- Cattell, R. A note on correlation clusters and cluster search methods. Psychometrica 1944, 9, 169–184. [Google Scholar] [CrossRef]
- Gore, P. Cluster Analysis. In Handbook of Applied Multivariate Statistics and Mathematical Modeling; Tinsley, H., Brown, S., Eds.; Academic Press: San Diego, CA, USA, 2000. [Google Scholar]
Figure 1.
Classification tree of the customers’ loyalty in the quantitative perspective. Source: authors’ study.
Figure 1.
Classification tree of the customers’ loyalty in the quantitative perspective. Source: authors’ study.

Figure 2.
Loyalty classification tree in the value-oriented perspective. Source: author’s study.

Figure 3.
Classification tree of customers loyalty in incentive perspective. Source: authors’ study.
Figure 3.
Classification tree of customers loyalty in incentive perspective. Source: authors’ study.

Figure 4.
Conceptual model presenting the projection of the loyalty of the customers of the auto repair shops. Source: authors’ study.
Figure 4.
Conceptual model presenting the projection of the loyalty of the customers of the auto repair shops. Source: authors’ study.

Figure 5.
Neural network for the projection of the loyalty of customers by L measure. Source: authors’ study.
Figure 5.
Neural network for the projection of the loyalty of customers by L measure. Source: authors’ study.

Figure 6.
Neural network for the projection of the loyalty of customers by Share of Wallet (SOW) measure. Source: authors’ study.
Figure 6.
Neural network for the projection of the loyalty of customers by Share of Wallet (SOW) measure. Source: authors’ study.

Figure 7.
Neural network for the projection of the loyalty of customers by Net Promoter Score (NPS) measure. Source: authors’ study.
Figure 7.
Neural network for the projection of the loyalty of customers by Net Promoter Score (NPS) measure. Source: authors’ study.

Figure 8.
Segmentation of customers of the auto repair shops with the use of cluster analysis. Source: authors’ study.
Figure 8.
Segmentation of customers of the auto repair shops with the use of cluster analysis. Source: authors’ study.

Table 1.
Characteristics of analyzed neural networks.
| Network Code | Learning Algorithm | Number of Layers | Activation Function | ASE for L Measure | ASE for SOW Measure | MR for NPS Measure |
|---|---|---|---|---|---|---|
| Mod1 | Backprop | 3 | logistic | 0.288 | 0.166 | 0.752 |
| Mod2 | rprop+ | 3 | logistic | 0.302 | 0.168 | 0.761 |
| Mod3 | rprop− | 3 | logistic | 0.328 | 0.171 | 0.759 |
| Mod4 | Sag | 3 | logistic | 0.314 | 0.173 | 0.760 |
| Mod5 | Backprop | 5 | logistic | 0.291 | 1.681 | 0.783 |
| Mod6 | rprop+ | 5 | logistic | 0.293 | 0.172 | 0.785 |
| Mod7 | rprop− | 5 | logistic | 0.305 | 0.175 | 0.783 |
| Mod8 | Sag | 5 | logistic | 0.314 | 0.177 | 0.780 |
| Mod9 | Backprop | 3 | tanh | 0.301 | 0.201 | 0.754 |
| Mod10 | rprop+ | 3 | tanh | 0.331 | 0.204 | 0.760 |
| Mod11 | rprop− | 3 | tanh | 0.335 | 0.196 | 0.761 |
| Mod12 | Sag | 3 | tanh | 0.333 | 0.192 | 0.762 |
| Mod13 | Backprop | 5 | tanh | 0.301 | 0.202 | 0.765 |
| Mod14 | rprop+ | 5 | tanh | 0.296 | 0.204 | 0.686 |
| Mod15 | rprop− | 5 | tanh | 0.327 | 0.188 | 0.774 |
| Mod16 | Sag | 5 | tanh | 0.321 | 0.192 | 0.776 |
Source: authors’ study.
Table 2.
Loyalty measures for each segment of the customers.
| Customers Segment and Loyalty Measure | Segment 1 | Segment 2 | Segment 3 | Segment 4 |
|---|---|---|---|---|
| L | 80% | 66% | 64% | 60% |
| SOW | 53% | 47% | 46% | 44% |
| NPS | 0 | −5 | −31 | −37 |
Source: authors’ study.
© 2018 by the authors. Licensee MDPI, Basel, Switzerland. This article is an open access article distributed under the terms and conditions of the Creative Commons Attribution (CC BY) license (http://creativecommons.org/licenses/by/4.0/).
Share and Cite
MDPI and ACS Style
Lotko, A.; Korneta, P.A.; Lotko, M.A.; Longwic, R. Using Neural Networks in Modeling Customer Loyalty in Passenger Cars Maintenance and Repair Services. Appl. Sci. 2018, 8, 713. https://doi.org/10.3390/app8050713
AMA Style
Lotko A, Korneta PA, Lotko MA, Longwic R. Using Neural Networks in Modeling Customer Loyalty in Passenger Cars Maintenance and Repair Services. Applied Sciences. 2018; 8(5):713. https://doi.org/10.3390/app8050713
Chicago/Turabian StyleLotko, Aleksander, Paweł Albert Korneta, Małgorzata Anna Lotko, and Rafał Longwic. 2018. "Using Neural Networks in Modeling Customer Loyalty in Passenger Cars Maintenance and Repair Services" Applied Sciences 8, no. 5: 713. https://doi.org/10.3390/app8050713
Note that from the first issue of 2016, this journal uses article numbers instead of page numbers. See further details here.