Article

Optic Disc Detection from Fundus Photography via Best-Buddies Similarity

1
School of Information Science and Engineering, Shandong Normal University, Jinan 250300, China
2
School of Information Engineering, Shandong Management University, Jinan 250357, China
3
Department of Electrical Engineering Information Technology, Shandong University of Science and Technology, Jinan 250031, China
4
Key Lab of Intelligent Computing & Information Security, Shandong Normal University, Jinan 250300, China
5
Institute of Biomedical Sciences; Shandong Provincial Key Laboratory for Novel Distributed Computer Software Technology; Key Lab of Intelligent Information Processing, Shandong Normal University, Jinan 250300, China
6
Shandong Provincial Key Laboratory for Novel Distributed Computer Software Technology, Jinan 250300, China
*
Authors to whom correspondence should be addressed.
Appl. Sci. 2018, 8(5), 709; https://doi.org/10.3390/app8050709
Submission received: 22 March 2018 / Revised: 19 April 2018 / Accepted: 25 April 2018 / Published: 3 May 2018
(This article belongs to the Section Optics and Lasers)

Abstract

:
Robust and effective optic disc (OD) detection is a necessary processing step in the research work of the automatic analysis of fundus images. In this paper, we propose a novel and robust method for the automated detection of ODs from fundus photographs. It is essentially carried out by performing template matching using the Best-Buddies Similarity (BBS) measure between the hand-marked OD region and the small parts of target images. For well characterizing the local spatial information of fundus images, a gradient constraint term was introduced for computing the BBS measurement. The performance of the proposed method is validated with Digital Retinal Images for Vessel Extraction (DRIVE) and Standard Diabetic Retinopathy Database Calibration Level 1 (DIARETDB1) databases, and quantitative results were obtained. Success rates/error distances of 100%/10.4 pixel and of 97.7%/12.9 pixel, respectively, were achieved. The algorithm has been tested and compared with other commonly used methods, and the results show that the proposed method shows superior performance.

1. Introduction

The optic disc (OD) is commonly considered one of the main features of a retinal fundus image. Accurate and early OD detection has been shown to be very important in ocular image analysis and computer-aided diagnosis. On the one hand, the change in the shape, color, or location of ODs is a critical indicator of various blinding eye diseases including glaucoma, cataract, and diabetic retinopathy [1,2,3]. On the other hand, OD detection is typically a key preprocessing component in computer algorithms developed for the automatic characterization of retinal anatomical structures (e.g., retinal vessels and the macula), which is helpful for aiding the ophthalmologist in determining the position of many retinal abnormalities such as exudates, drusen, and microaneurysms.
OD detection aims to find the location and area of ODs in retinal fundus images. In general, an OD has a very different appearance compared with the rest of the retina. It usually appears as a yellowish, circular, or slightly oval region brighter than the surrounding in fundus images. An OD is the exit point of ganglion cell axons leaving the eye, roughly one-sixth the width of the image in diameter [4,5,6,7]. Localizing the OD is the initial step of most vessel segmentation, disease diagnostic, and retinal recognition algorithms. It often works as a landmark and reference for the other features in fundus images [8,9,10]. However, because of the presence of eye diseases, light, and noise, the accurate detection of ODs is a challenging task and is the subject of much research.
There are many studies related to the detection of the OD from fundus photography. Based on the different properties of OD presented in the fundus images, methods of OD detection can be classified into different categories, such as appearance-based methods and vessel-based methods [5,11]. Due to the obvious round and bright area of the OD, and since the region of the OD in fundus photography is fixed, some scholars have proposed methods to detect ODs based on appearance features. These researchers were focused on areas in fundus images where the brightness is highest. There are many appearance-based methods. Sinthanayothin detected regions with the highest variation in the intensity of adjacent pixels between the vessels and the bright nerve fibers. Such regions are the result of this method, which are ODs [12,13]. Akyol detected ODs in fundus images by using key point detection with SURF, texture analysis, and visual dictionary techniques on bright regions [14]. Lalonde and Osareh detected ODs by template matching. Lalonde used pyramidal decomposition and Hausdorff-based template matching in low-resolution fundus images. Osareh had chosen the average of the color-normalized OD region in 25 retinal images as the template image [15,16,17]. Li found the brightest pixels in the fundus image, combined them with the clustering algorithm to segment the candidate area of the OD, and then used principal component analysis (PCA) to find the OD [18]. Vessel-based methods depend mainly upon analyzing the structure and the density of retinal vessels. Youssif and others detected ODs by analyzing the structure and the direction of the vessels, as well as the degree of template matching between the given blood vessel directions [19]. Mahfouz et al. proposed a comprehensive utilization of the direction of vessels, the converged blood vessels, and the brightness information of ODs. They found that the blood vessels in the area mostly extend along the vertical direction. Therefore, the vertical gradient component is greater than the horizontal gradient component in the region’s edge gradient. The total edge gradient in this region is greater than other regions. By the two projections, the center coordinates of ODs are located [20,21]. Foracchia proposed a geometric model of blood vessel structures to locate ODs. They used two opposite directions parabolas to describe the direction of blood vessels, because the two parabolic common vertices are located in the area of the ODs, and they detected ODs through this feature [22,23].
Both of these methods have their strengths and weaknesses. Appearance-based methods make full use of the visual features of OD such as brightness and texture. Some researchers think that the method of detecting ODs by their appearance is effective, but these methods often fail when the fundus images have lesions and the lesions are similar to the brightness of ODs, and these methods may have high computational complexity. Vessel-based methods take full advantage of information such as the structure and orientation of blood vessels and solve the detection problem caused by the disease. However, these methods require a strict geometric template, and the formulation of the template depends on accurate image segmentation, which leads to a highly complex algorithm and an unsatisfied real-time requirement of OD detection. Thus, in the process of pattern recognition, we should pay more attention to local information [24,25].
To address these problems, many studies have demonstrated that template-based matching can be used for developing faster and more robust methods for OD detection [17,19]. In the traditional template matching process, all the points in the candidate window are used for the computation of similarity. Nevertheless, these algorithms may have high computational cost and match the error area when the interested target area has nonrigid deformation and outliers.
In this paper, we propose a new method for the automated detection of ODs from fundus photography. It is carried out by applying the Best-Buddies Similarity (BBS) measure based on template matching to address the problem of OD localization [26]. Specifically, we first represent both the template and each of the candidate regions within the fundus image as two point sets. We think that only similar points in the template image and the candidate window should be considered. The BBS is then employed to measure the similarity between the two sets of points, which is computed by counting the number of mutual nearest neighbors based on statistical distance measures. For capturing the spatial distribution of patches in the templates and fundus images, we adjusted the traditional BBS model by introducing a gradient constraint term to improve the accuracy of distance measurements. Our method avoids the complex work of segmenting blood vessels and strengthens the robustness against high levels of lesions in fundus images. The experimental results show that our method has lower computational complexity and performs well when the fundus images have lesions. Experiments were conducted with both the Digital Retinal Images for Vessel Extraction (DRIVE) and Standard Diabetic Retinopathy Database Calibration Level 1 (DIARETDB1) databases, and results show that our approach outperforms state-of-the-art methods.
The rest of this paper is organized as follows. The Materials and Methods section describes the proposed methodology for the detection of ODs. The Results section presents the test design and the experimental results analysis. The Discussion section is devoted to concluding remarks and suggests future work.

2. Materials and Methods

Given a retinal fundus image, assume that the location and area of the OD have been accurately delineated by human experts. We can then obtain a template image by constructing a minimum bounding rectangle containing the whole OD region according to the manually delineated boundary (ground truth), as shown in Figure 1. The goal of our method for OD detection is to search and find a small part of new fundus photography that matches the given template image.
Specifically, we break the template and the target image into U and V distinct patches, respectively. The size of each patch is k × k . We then assume each image patch as a point, the point sets to be matched and composed by these patches. Each k × k patch is represented by its RGB values, gradient, and the x , y location of the central pixel. The value of k should be adjusted according to the size of the template. In this paper, k = 3 was chosen and fixed in all our experiments.
We then detect OD from fundus photography by computing the BBS between the template and every possible window in the target image. Details of the BBS are described in the following subsections.

2.1. Best-Buddies Similarity

Best-Buddies Similarity is based on the following assumptions: The target pixels under different backgrounds always follow the same probability distribution. The similarity between them is calculated by counting the number of matching feature points in the template and the target images candidate area.
We first define two point sets: R = r i i = 1 U and S = s j j = 1 V , where r i , s j R d , U, and V are the number of feature points in the point set of R and S, respectively. R = r i i = 1 U and S = s j j = 1 V represent the feature point set of the template and the candidate region in the target image, respectively. BBS measures the similarity between these two sets. A pair of points r i R , s j S is a Best-Buddies Pair (BBP) if r i is the nearest neighbor of s j in the set S, and vice versa. By discriminating BBP, the matching matrix of R and S is obtained. The following is the mathematical expression of BBP.
S e g r i , s j , R , S = 1 N N r i , S = s j N N s j , R = r i 0 o t h e r w i s e
where N N r i , S = a r g m i n d r i , s , s S , and d r i , s is some distance measure, ∧ is the AND operation, and N N r i , S = s j indicates that the nearest neighbor of r i in point set S is s j . BBS is then taken to be the fraction of Best-Buddies Pairs (BBPs) between these two sets and the equation of the BBS between the point sets R and S is given by
B B S R , S = 1 min V , U · U i = 1 V j = 1 S e g r i , s j , R , S .
We need to compute the distance between each pair of points to calculate the BBS between two point sets R , S . The distance measure consists of two parts in the original BBS, one part is the difference of the RGB appearance, the other part is the difference of the x , y location of the central pixel. In the actual situation, the distance measure, which only computes the difference in appearance and location, is usually limited. To improve the efficiency of OD detection, we introduced a gradient algorithm based on a first-order derivative into the distance measure, which makes the algorithm more robust and improves the accuracy of the detection results.
Mathematically, the image can be regarded as a two-dimensional discrete function, and the image gradient is the derivative of this function:
δ x , y = d x p , q + d y p , q
where d x p , q = l p + 1 , q l p , q , d y p , q = l p , q + 1 l p , q , l is the gray value of the pixel, and p , q represents the coordinates of pixels. The distance between each pair is expressed by the following equation:
d r i , s j = r i A s j A 2 2 + β r i L s j L 2 2 + r i G s j G 2 2
where superscript A denotes pixel RGB appearance and superscript L denotes pixel location ( x , y within the patch normalized to the range [0, 1]), superscript G denotes the gradient value of r i and s j , and β is the weight coefficient. β = 2 was chosen empirically and fixed in our experiments. Through Equation (4), the color, location, and gradient distribution information between the template and the target image can be well described. The algorithm is more robust for detecting ODs from fundus photography.

2.2. Template Matching Based on BBS

Our method is carried out by applying the BBS measure based on template matching to address the problem of OD detection. The template matching method is divided into three parts in this paper: image preprocessing, BBS computation, and finding the best result, respectively. The pseudocode for our algorithm is illustrated in Algorithm 1.
Algorithm 1: Optic Disc Detection using Best-Buddies-Similarity-based Template Matching.
Require: Template image T; target image I, patch size k.
1:
Resizing T and I to have rows and columns with size of a multiple of k.
2:
Breaking T and I into U and V distinct patches, respectively.
3:
for each: distinct patches s j in I do
4:
for each: distinct patches r i in T do
5:
  Compute the distance d ( r i , s j ) between s j and r i using Equation (4)
6:
end for
7:
end for
8:
for each: candidate region in I do
9:
 Compute BBS between the template and it via Equations (1) and (2).
10:
end for
Ensure: The location of the region with max value of BBS.

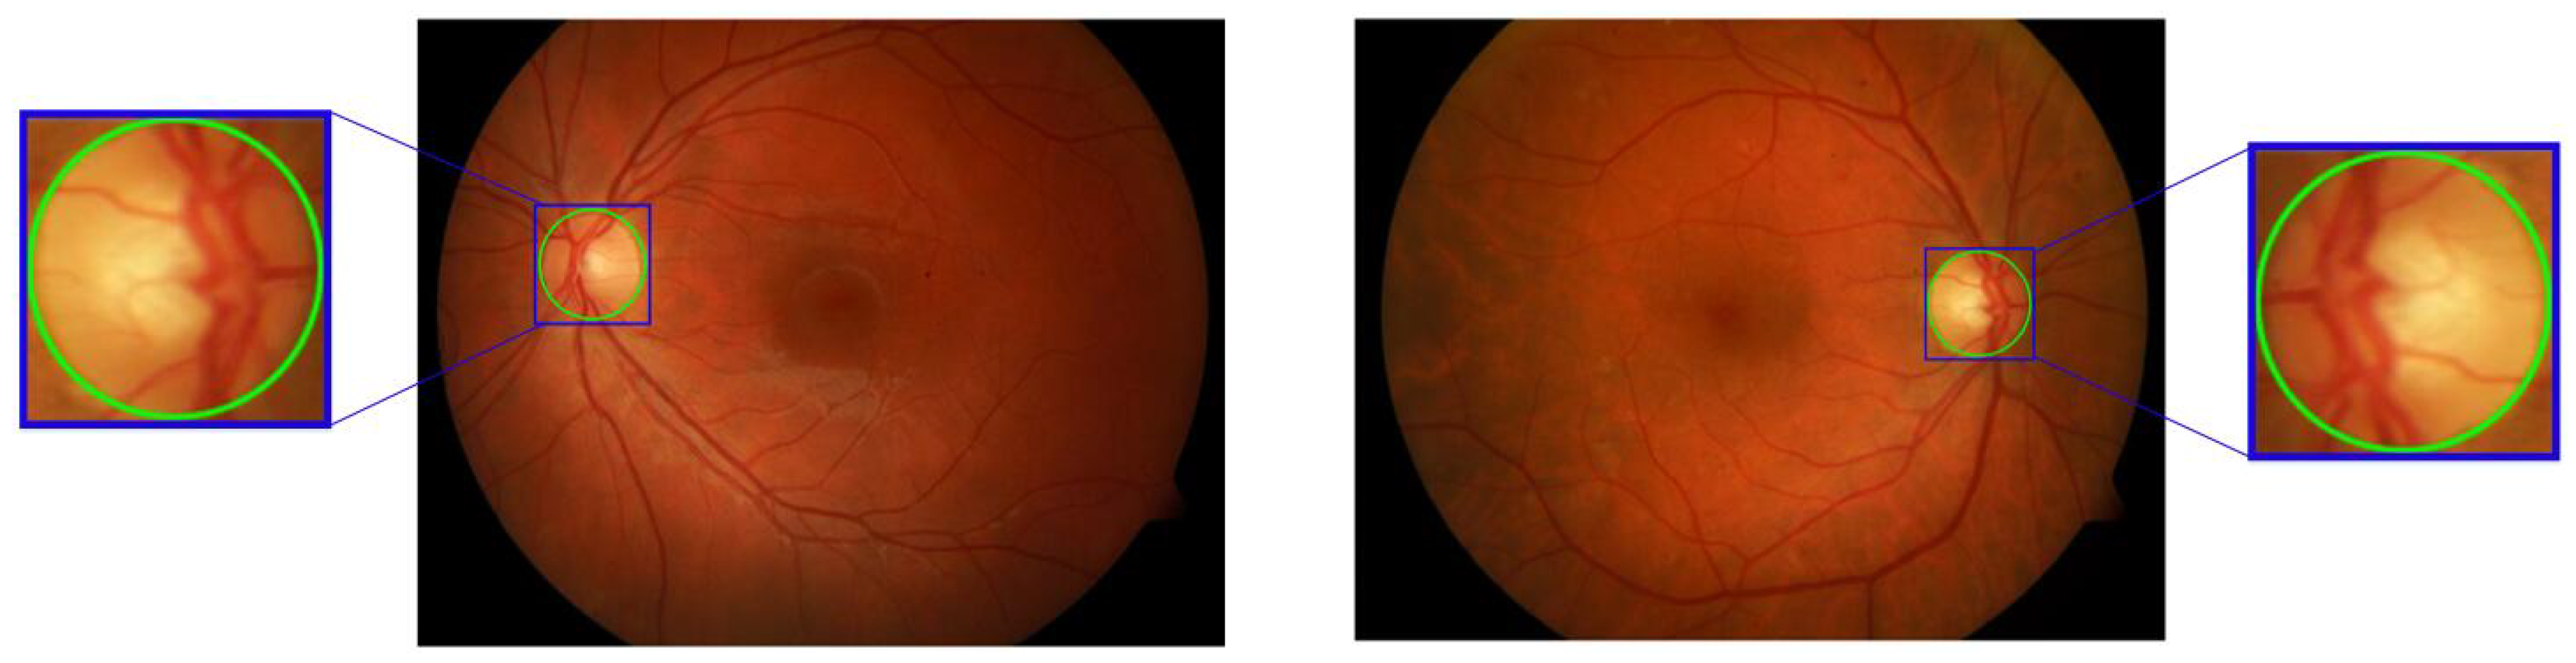
2.2.1. Image Preprocessing

We need to set the size of patch k according to the size of the template and the target image, and resize the target image and the template according to the size of the patch. In this way, we ensure that the length and width of the target image and the template can be divisible by k. The template and the target image are then divided into multiple patches.

2.2.2. BBS Computation

We compute the distance for all point pairs between the template and the candidate window in the target image according to Equation (4). We then find the BBPs between the template and the candidate window according to Equation (1). We slide the window and counting the number of BBPs between all the candidate windows and the template. The value of BBS between the template and the candidate windows is obtained according to Equation (2).

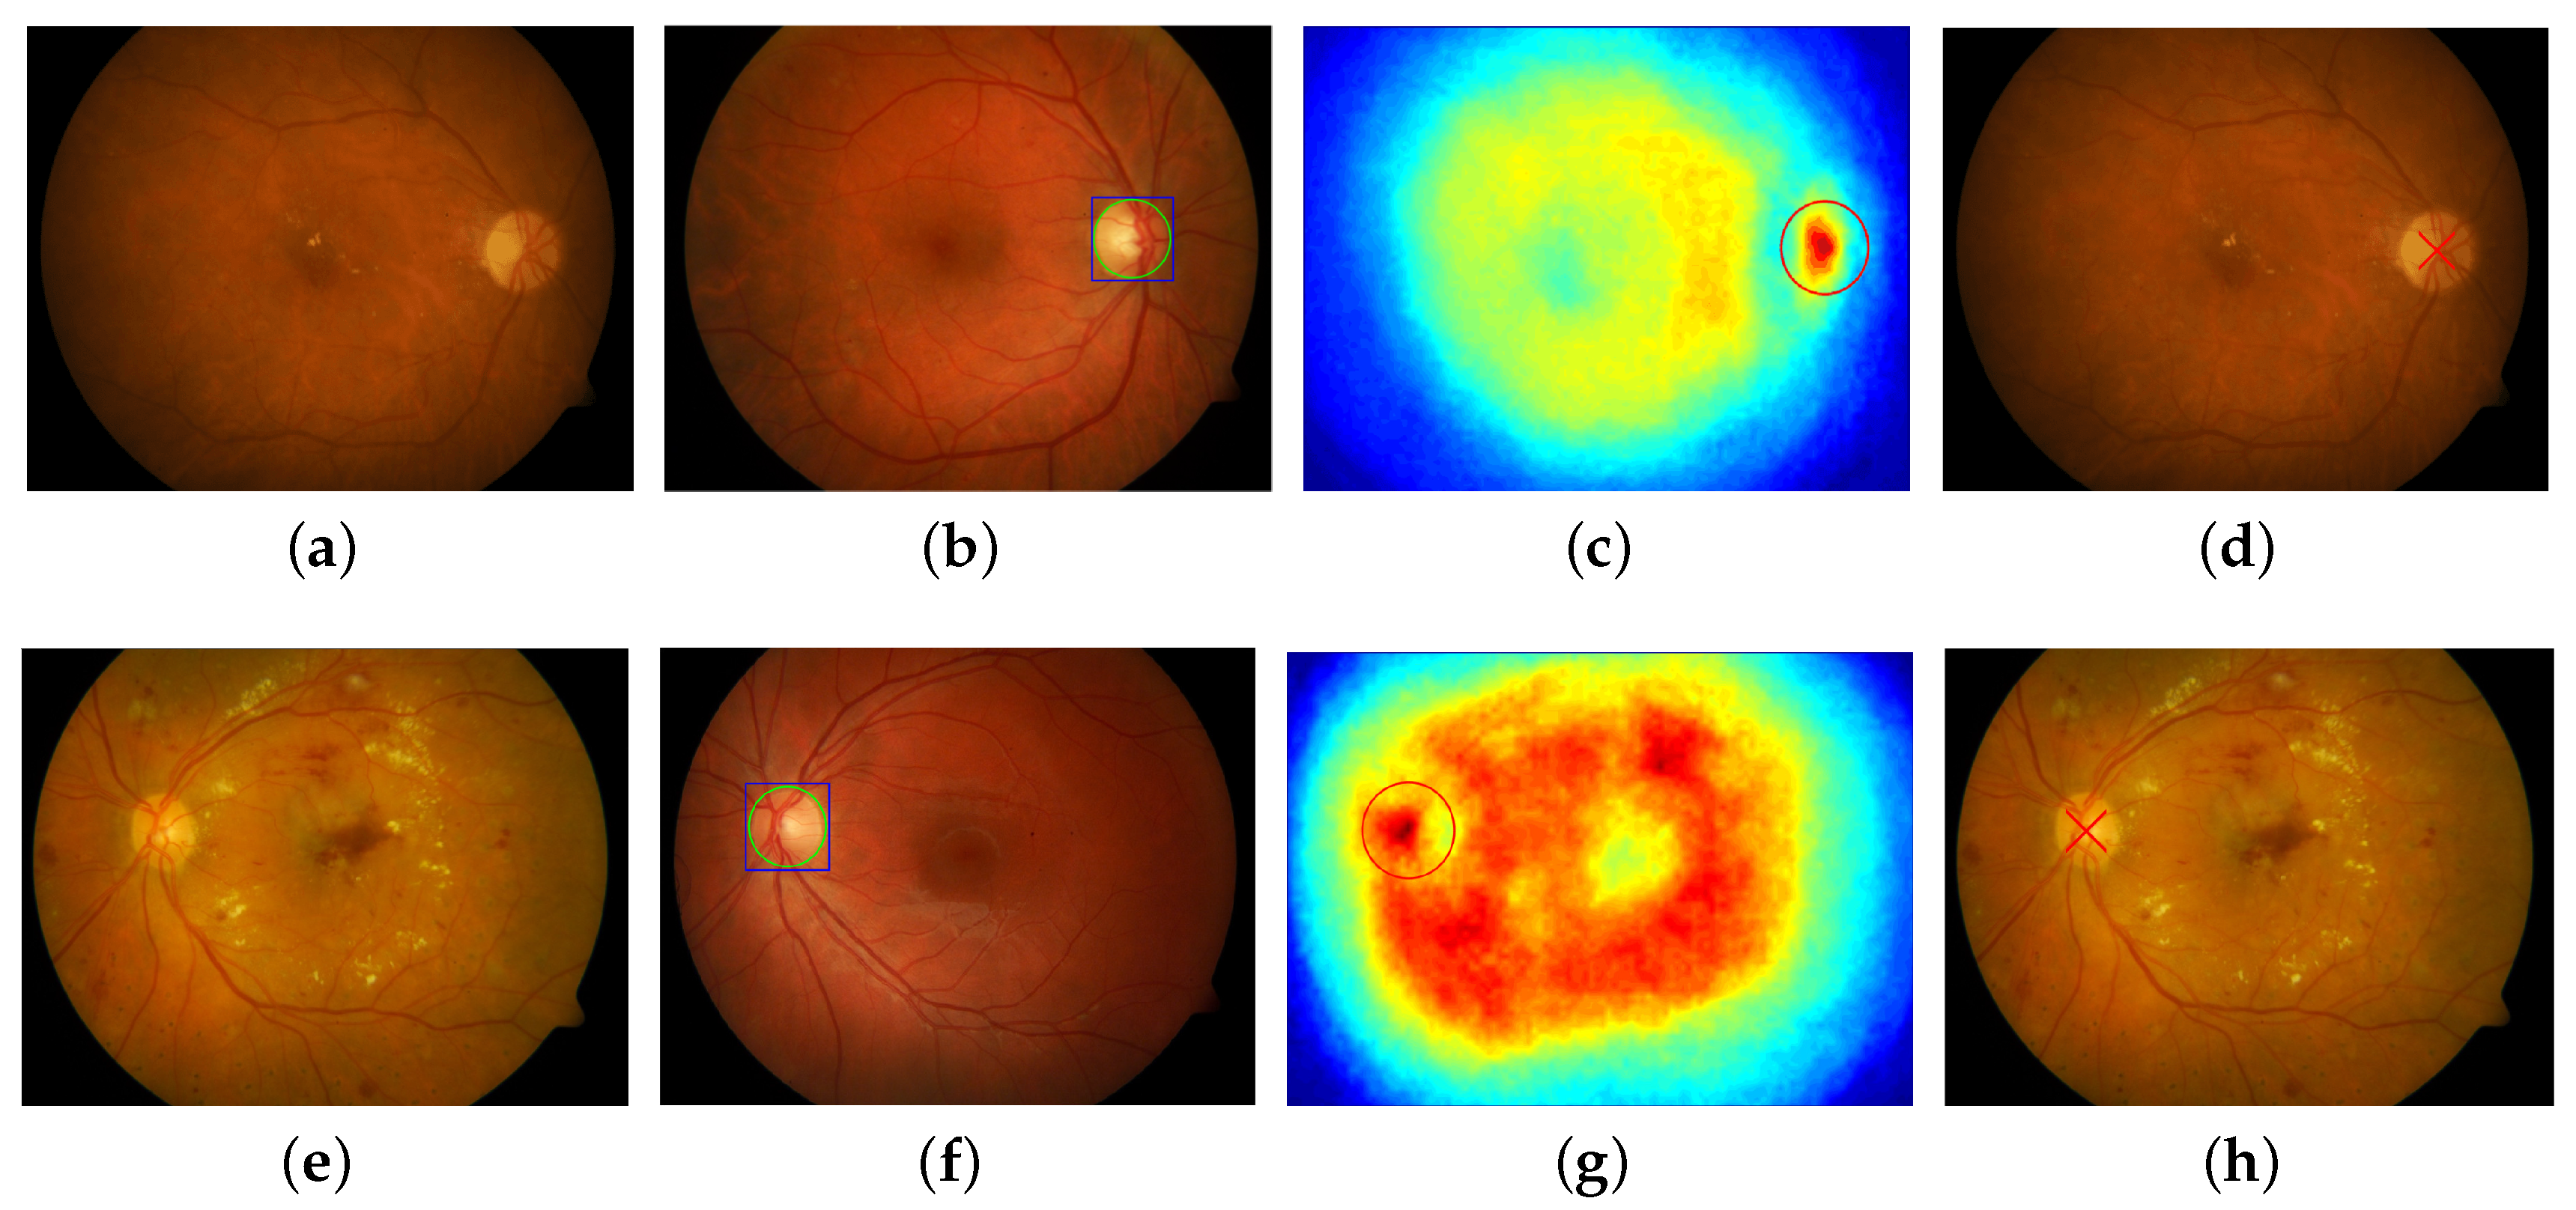
2.2.3. Finding the Best Result
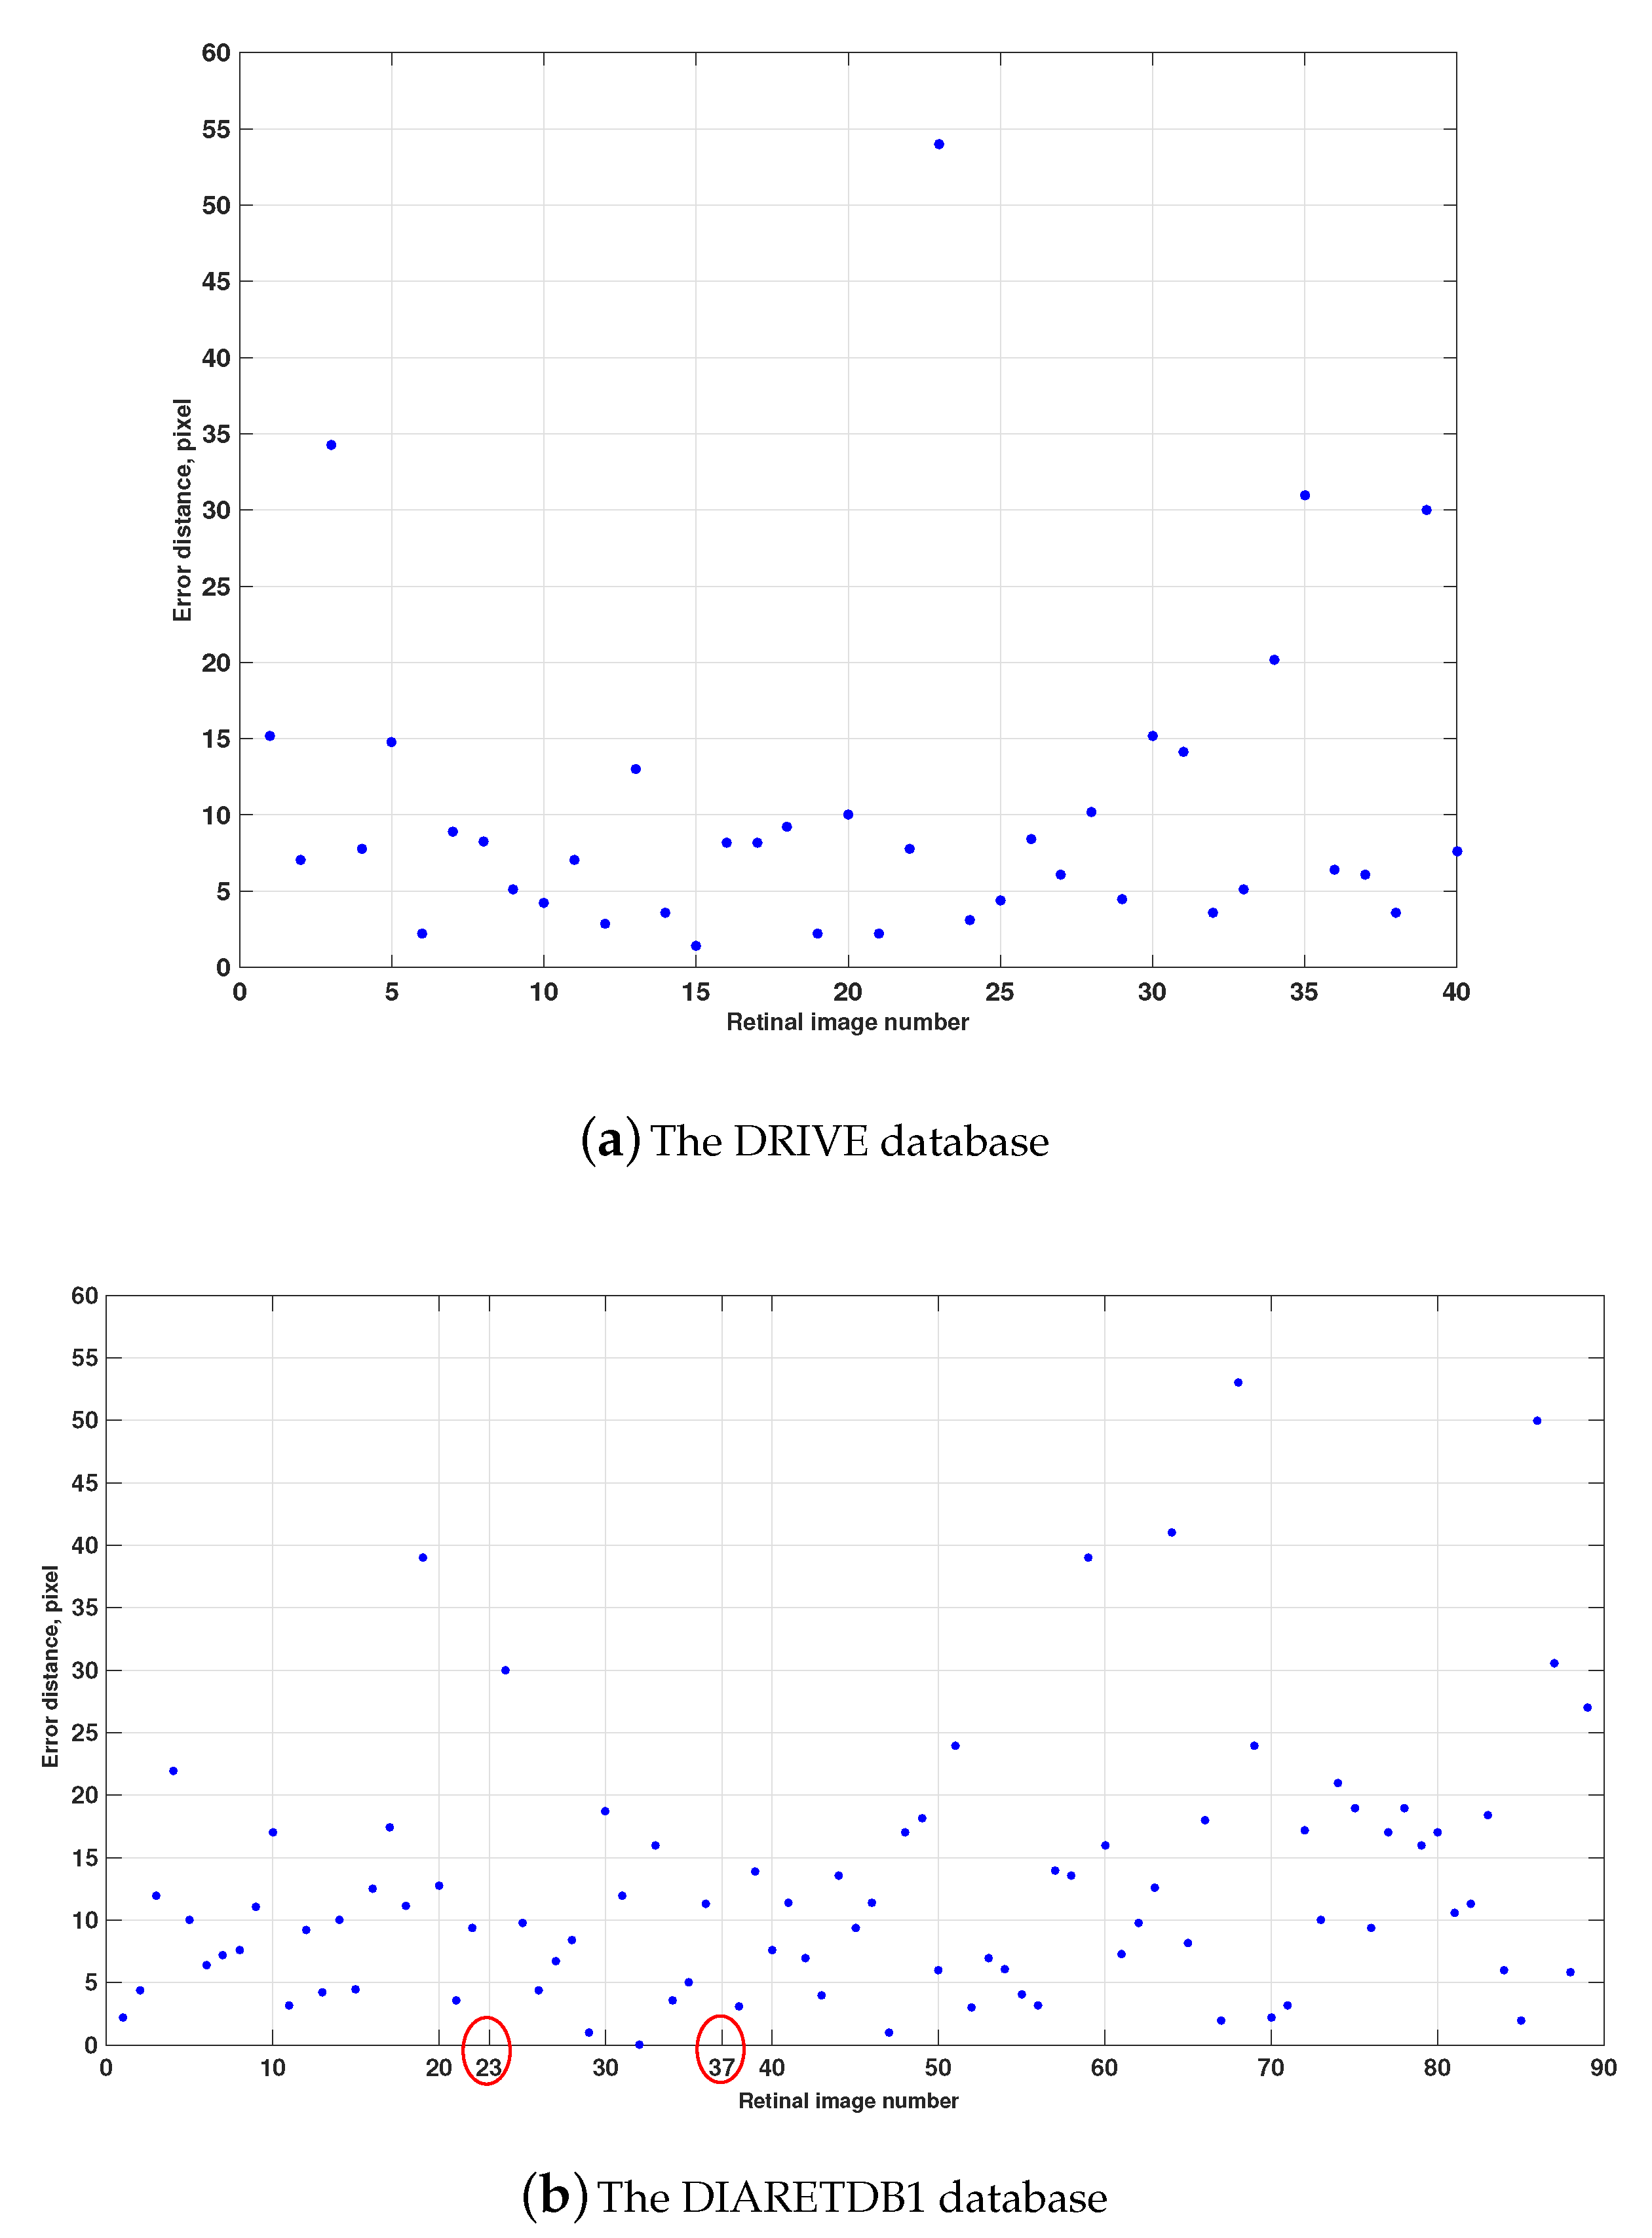
The sum of BBPs divided by the number of patches is normalized to obtain a confidence map. The brightest region with the maximum BBS value is the target location.

3. Results

3.1. Data and Parameter Settings

Algorithm performance was tested and comprehensively analyzed on the DRIVE and DIARETDB1 database, respectively. The DRIVE database contains 40 images obtained from a diabetic retinopathy screening program in The Netherlands. The images were acquired using a Canon CR5 non-mydriatic 3CCD camera (Canon, Tochigiken, Japan) with a 45-degree field of view (FOV). Each image is 565 × 584 pixel and 8 bits per color channel. The set of 40 images was divided into a training and a test set, both containing 20 images [27]. The DIARETDB1 database consists of 89 retinal images, of which 84 contain at least mild diabetic retinopathy and 5 are considered normal. Images were captured using the same 50-degree field-of-view digital fundus camera with varying imaging settings, and each image is 1500 × 1152 pixel. To test our method, the OD boundary and center of each image from both databases were manually marked by a trained ophthalmologist, which were used as the ground truth for constructing the template image and evaluating the performance of OD detection, respectively.
The appearance of OD such as the shape, color, and size showed large variance, especially in the presence of retinopathies. Choosing different fundus images to construct templates and a different number of templates will correspondingly affect the final results. We selected fundus images with representative features of ODs from the DRIVE and DIARETDB1 databases at random, and we constructed minimum bounding rectangles containing the entire OD region on the basis of these images as template images. The different results using different numbers of templates are shown in the Results section. Because the proposed method has strong robustness, we only need a small number of images with complete features of ODs as template images. During the experiment, the target image selected as the template was matched using other templates without matching it to itself.
To obtain the specific performance indicators of our method, we defined criteria for correctly detecting ODs, whereby the estimated OD center was inside the contour of the OD in the fundus photograph, and the distance between the estimated OD center and its manually identified OD center was within 60 pixel [5].

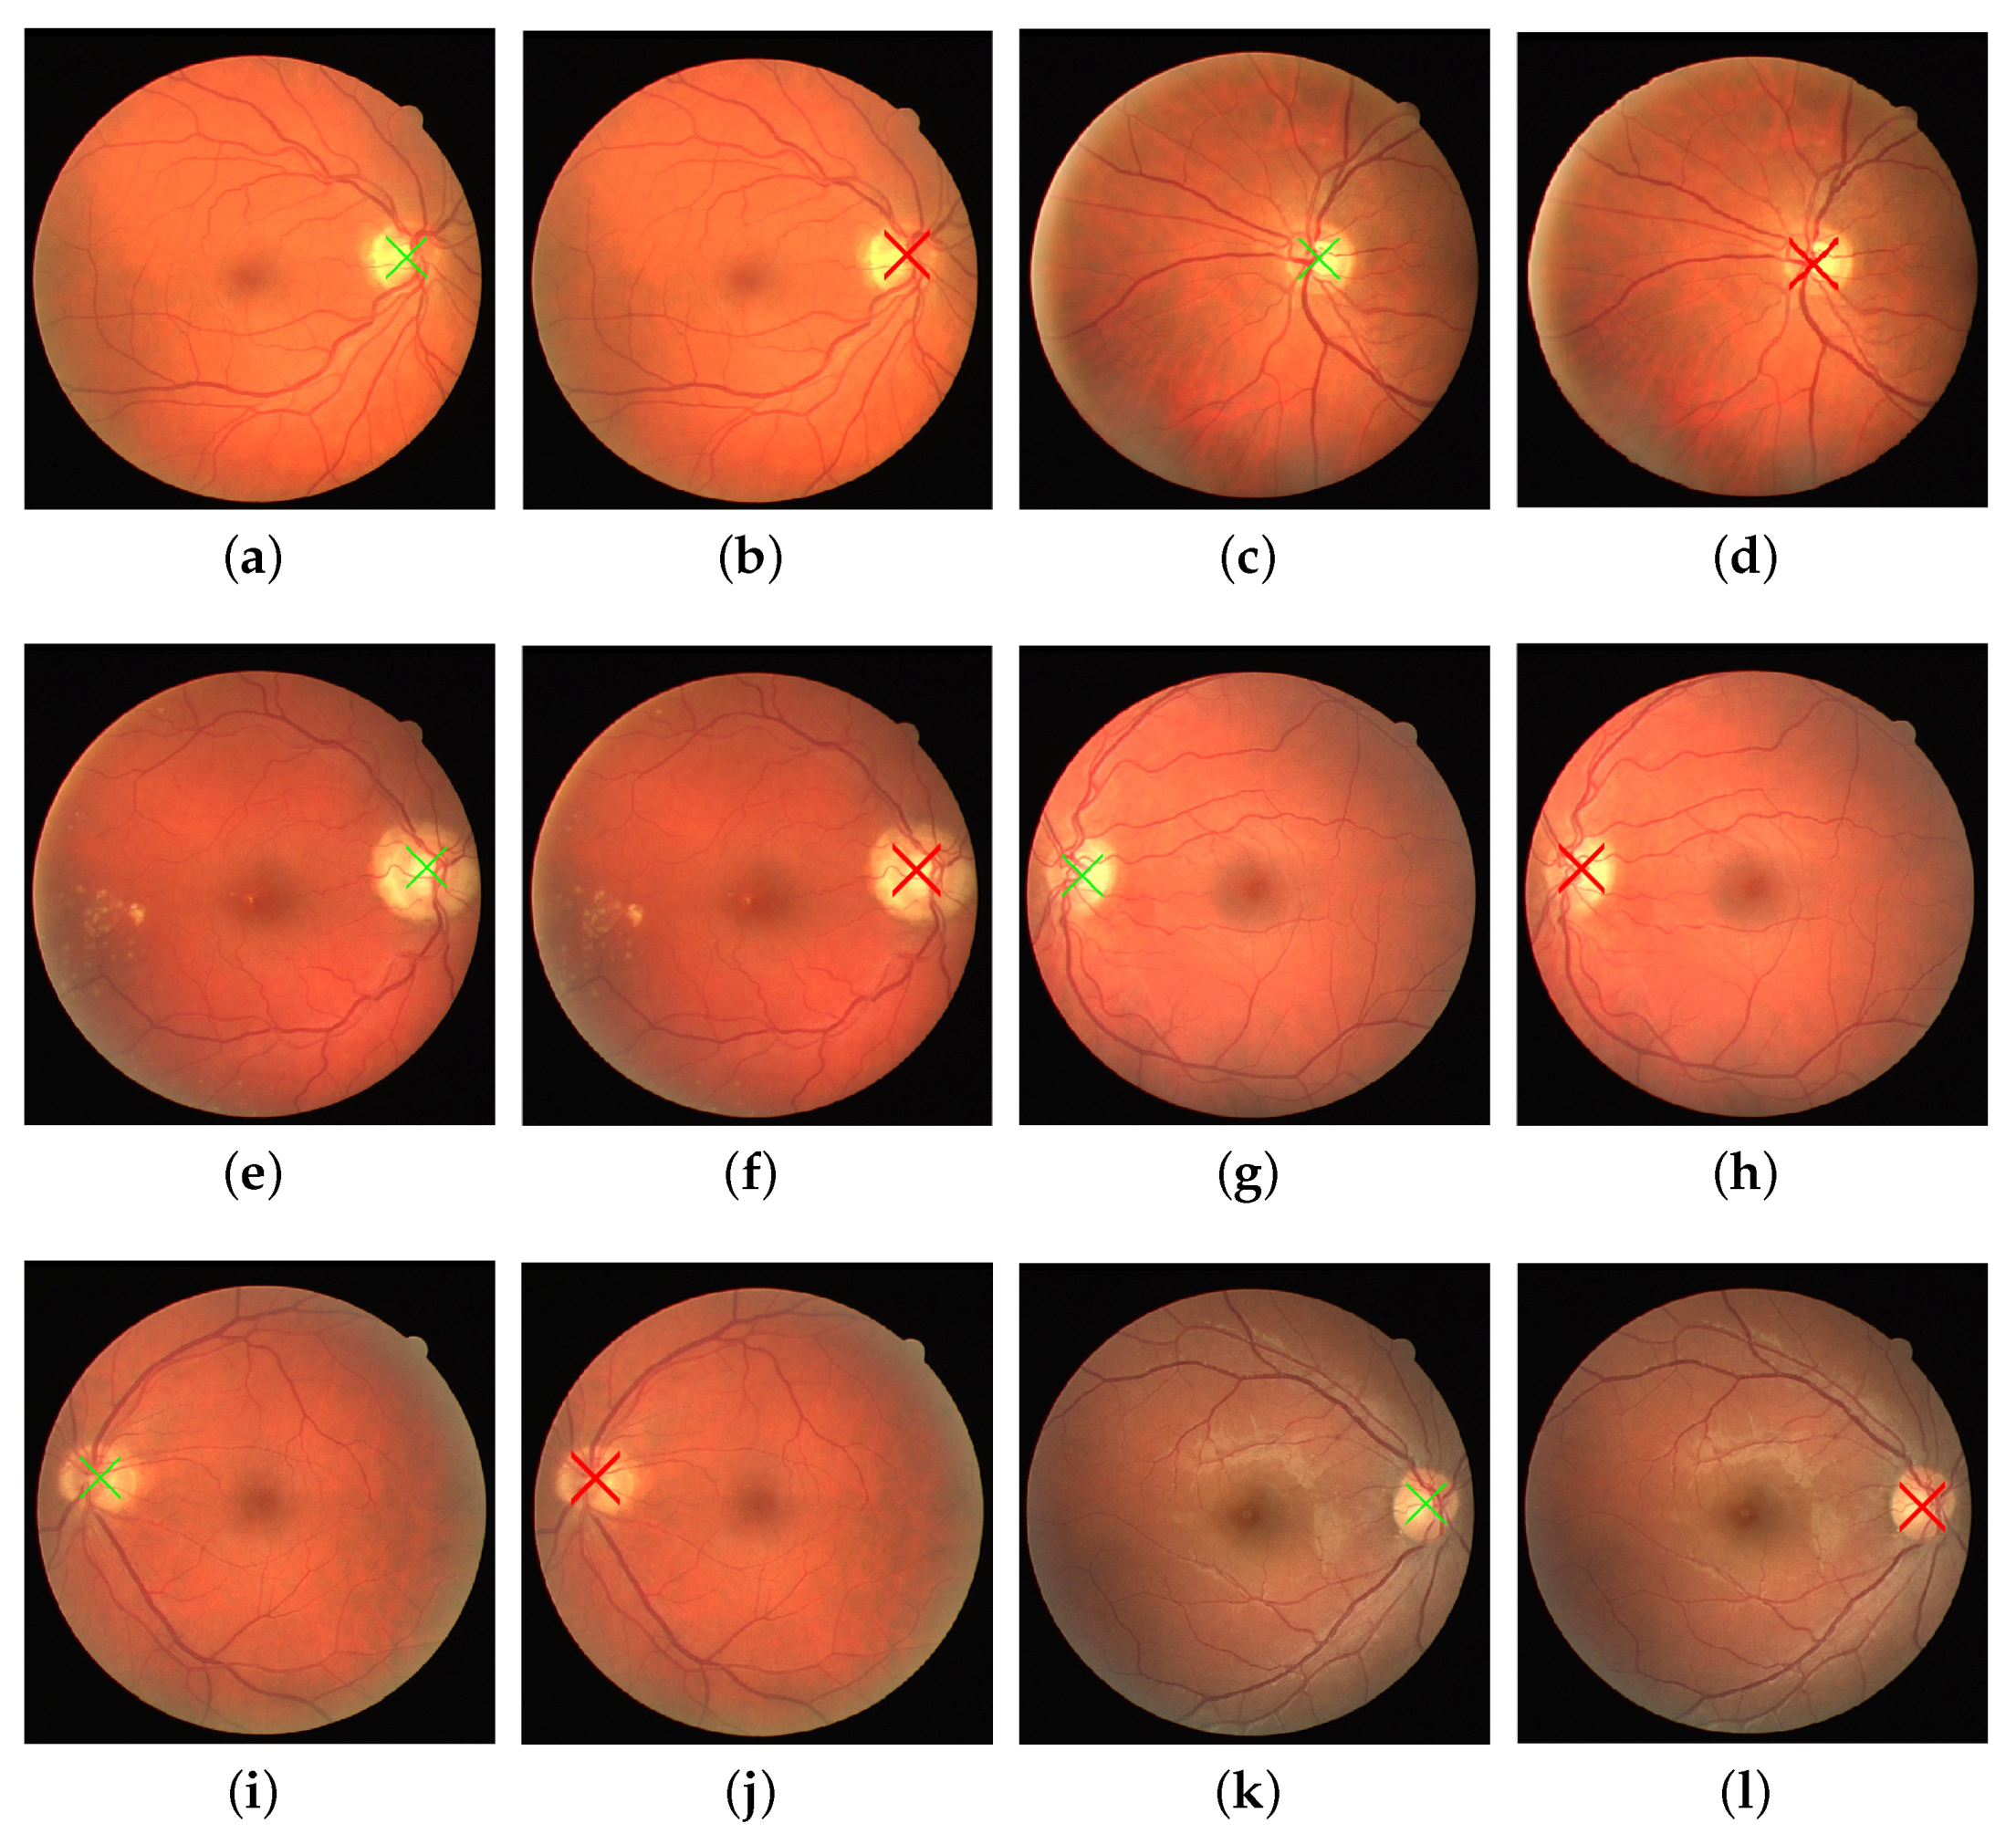
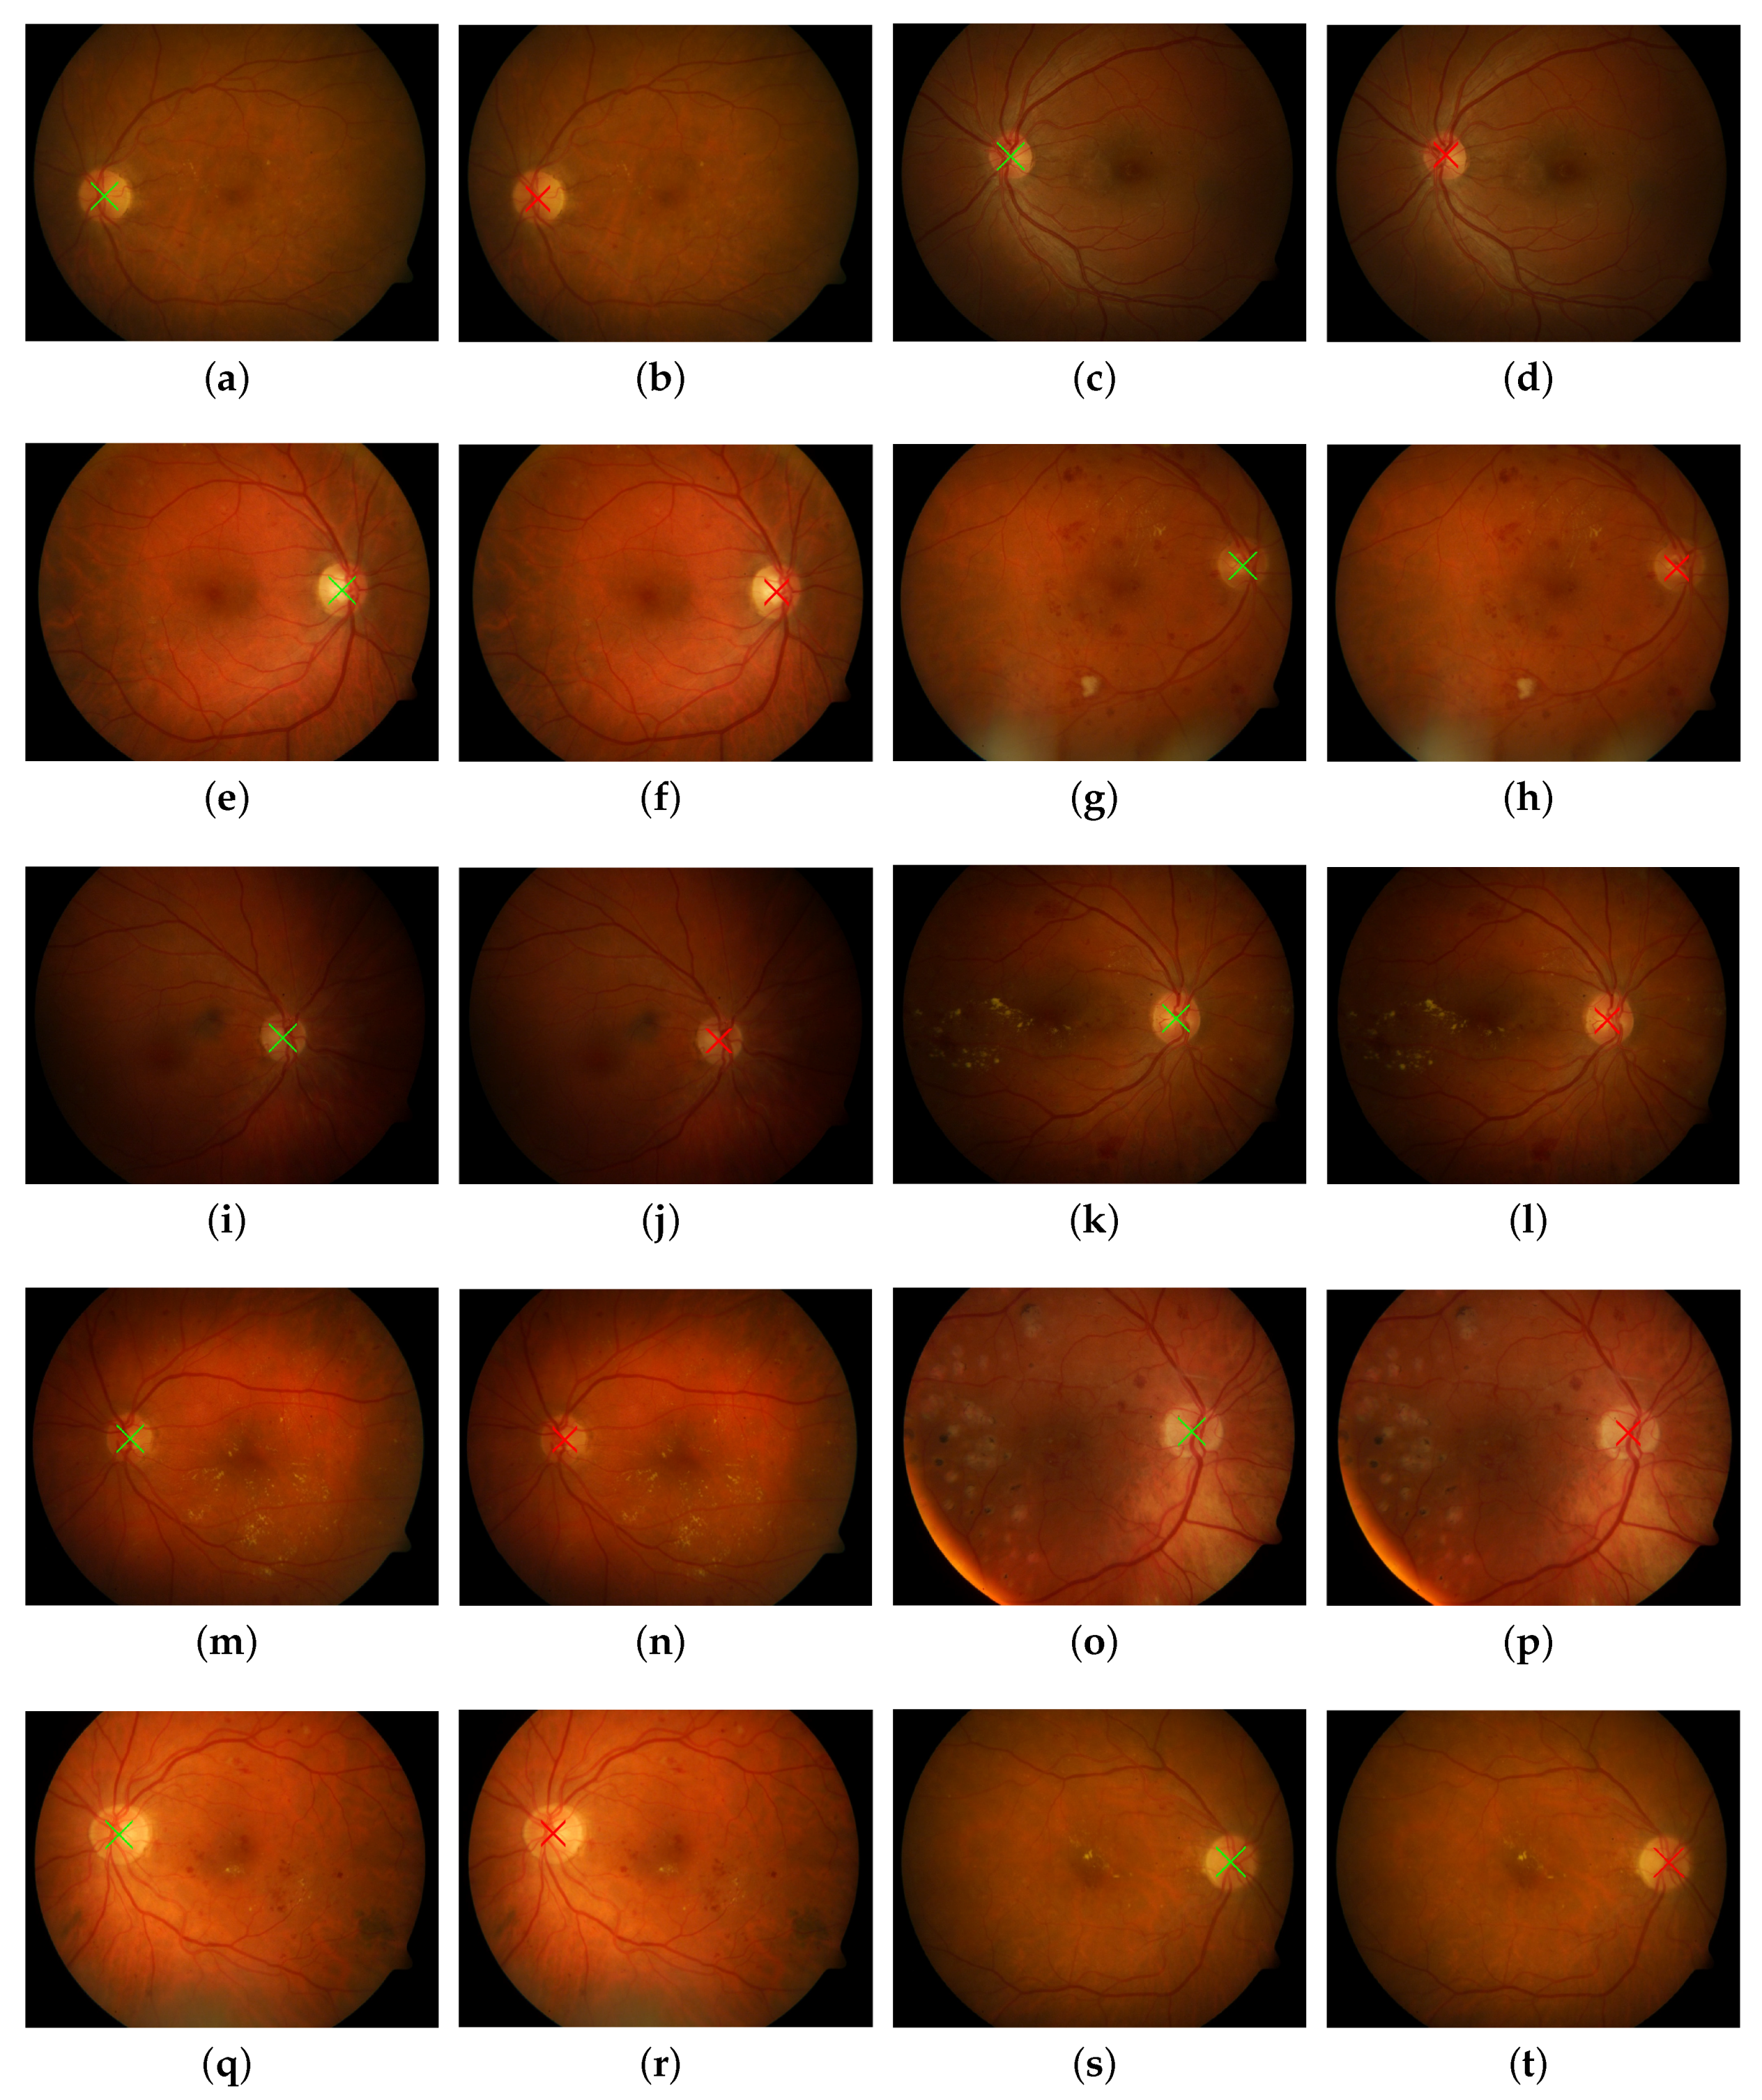
3.2. Results Analysis

We presented the results of the proposed method in Table 1 on both databases, and the steps of our method to detect OD are shown in Figure 2. Some detection results are shown in Figure 3 and Figure 4.
Specifically, the success rate in Table 1 was 100% and 97.7% for both databases when we selected 4 images from DRIVE and 8 images from DIARETDB1 as templates, respectively. The success rate is the percentage of correct detection among all attempts. The error distance is the distance between the estimated OD center and the manually identified OD center. The average error distances are 10.4 and 12.9 pixel for the DRIVE and DIARETDB1 databases, respectively, and the value of each image is shown in Figure 5.
The error distances and success rates of the different databases computed using different numbers of template images are shown in Figure 6. The results of our method show success rates/error distances of 87.5%/20 pixel, 100%/17.37 pixel, 100%/16.54 pixel, and 100%/10.4 pixel when we construct 1 , 2 , 3 , 4 template images from the DRIVE database, respectively. The success rates/error distances are 63%/20.58 pixel, 80.9%/13.1 pixel, 91%/12.9 pixel, and 97.7%/12.7 pixel when we construct 2 , 4 , 6 , 8 template images from the DIARETDB1 database, respectively. Therefore, as templates increase, the detection success rate of the proposed method increases, and the error distances drop. The results show that the proposed method is validated, has better robustness, and can obtain very precise detection results by increasing the number of templates. We can determine the number of templates according to the different requirements of the actual application.
Table 2 shows the comparison of the success rate with different methods. From these data, we can easily conclude that the proposed method is a robust method and performs well on various public databases.

4. Discussion

OD detection in fundus photography is an important prerequisite for the diagnosis and treatment of retinopathy. Accurate and early detection of ODs in retinal fundus images has been shown to be an initial and critical step in both ocular image analysis and computer-aided diagnosis. However, many OD detection methods often fail when the fundus images have lesions that are similar to the brightness of ODs. Vessel-based methods can take full advantage of information, such as the structure and orientation of blood vessels, to solve problems caused by easily confused lesions. However, these methods require a strict geometric template which depends on accurate image segmentation, rendering high computational complexity of the algorithms. The template-based matching techniques are capable of developing fast and robust OD detection algorithms, but these algorithms often require high computational cost and simple targets without nonrigid deformation and outliers.
In this paper, a new method for the automated detection of OD from fundus photography is proposed, which is achieved by applying the BBS measure for template matching to deal with the problem of OD localization. First, the template and each of the candidate regions within the fundus image can be represented as two point sets. We then measure the similarity between the two sets of points by employing the BBS computed by counting the number of mutual nearest neighbors based on some statistical distance measures. Furthermore, we adjust the traditional BBS model by combining a gradient constraint term to improve the accuracy of distance measurements to capture the spatial distribution of patches in the templates and fundus images.
The performance of our method was validated on the DRIVE and DIARETDB1 databases and obtained quantitative results.The success rate was 100% and 97.7% for the DRIVE and DIARETDB1 databases, and the average error distance between the estimated and the manually identified optic disc center was 10.4 and 12.9 pixel, respectively. The proposed method compared with other commonly used methods shows superior performance, with high localization success rates and fast localization speeds. The proposed method avoids the complex work of segmenting blood vessels and is robust against high levels of lesions in fundus images. Experiments were conducted on both the DRIVE and DIARETDB1 databases and show that our approach outperforms state-of-the-art methods. Future work will explore a novel multiple target localization model, which can be used to detect multiple retinal components such as vessels, drusens, and ODs.

Author Contributions

K.H. and Y.Z. conceived the proposed method of OD detection. K.H. and Y.H. implemented the algorithm and performed the experiments. K.H. and W.J. wrote the paper. J.L. and N.L. contributed to the analysis and assessment of the results.

Funding

National Nature Science Foundation of China (No. 61572300), the Natural Science Foundation of Shandong Province in China (ZR2017BC013, ZR2014FM001), and the Taishan Scholar Program of Shandong Province of China (No.: TSHW201502038).

Acknowledgments

This work is supported by the National Nature Science Foundation of China (No. 61572300), the Natural Science Foundation of Shandong Province in China (ZR2017BC013, ZR2014FM001), and the Taishan Scholar Program of Shandong Province of China (No.: TSHW201502038).

Conflicts of Interest

The authors declare no conflict of interest.

References

  1. Li, H.; Chutatape, O. Automated feature extraction in color retinal images by a model based approach. IEEE Trans. Biomed. Eng. 2004, 51, 246–254. [Google Scholar] [CrossRef] [PubMed]
  2. Chen, P.; Cen, R.J.; Xiao-Ming, W.U. The pressure distribution in the entrance region of a tapered vessel. J. Jinan Univ. 2000. [Google Scholar]
  3. Bhuiyan, A.; Kawasaki, R.; Wong, T.Y.; Rao, K. A New and Efficient Method for Automatic Optic Disc Detection Using Geometrical Features. In World Congress on Medical Physics and Biomedical Engineering; Springer: Berlin/Heidelberg, Germany, 2009; pp. 1131–1134. [Google Scholar]
  4. Chen, X.; Xu, Y.; Yan, S.; Wong, D.W.K.; Wong, T.Y.; Liu, J. Automatic Feature Learning for Glaucoma Detection Based on Deep Learning; Springer International Publishing: Cham, Switzerland, 2015; pp. 669–677. [Google Scholar]
  5. Monteiro, F.C.; Cadavez, V. Optic disc detection by earth mover’s distance template matching. In Proceedings of the International Conference on Medical Image and Signal Computing, World Academy of Science, Engineering and Technology (WASET), Washington, DC, USA, 16–18 May 2011; Number 59. pp. 1254–1258. [Google Scholar]
  6. Quigley, H.A.; Varma, R.; Tielsch, J.M.; Katz, J.; Sommer, A.; Gilbert, D.L. The relationship between optic disc area and open-angle glaucoma: the Baltimore Eye Survey. J. Glaucoma 1999, 8, 347–352. [Google Scholar] [CrossRef] [PubMed]
  7. Ullah, H.; Jan, Z.; Qureshi, R.J.; Shams, B. Automated localization of optic disc in colour fundus images. World Appl. Sci. J. 2013, 28, 1579–1584. [Google Scholar]
  8. Devasia, T.; Jacob, P.; Thomas, T. Automatic Optic Disc Boundary Extraction from Color Fundus Images. Int. J. Adv. Comput. Sci. Appl. 2014, 5. [Google Scholar] [CrossRef]
  9. Baroni, M. Multiscale Filtering And Neural Network Classification for Segmentation and Analysis of Retinal Vessels. Biomed. Eng. 2012, 134, 9–20. [Google Scholar]
  10. Chen, H.T.; Wang, C.M.; Chan, Y.K.; Yang-Mao, S.F.; Chen, Y.F.; Lin, S.F. Statistics-based initial contour detection of optic disc on a retinal fundus image using active contour model. J. Med. Biolog. Eng. 2013, 33, 388–393. [Google Scholar] [CrossRef]
  11. Zhang, D.; Yi, Y.; Shang, X.; Peng, Y. Optic disc localization by projection with vessel distribution and appearance characteristics. In Proceedings of the International Conference on Pattern Recognition, Tsukuba, Japan, 11–15 November 2012; pp. 3176–3179. [Google Scholar]
  12. Sinthanayothin, C.; Boyce, J.F.; Cook, H.L.; Williamson, T.H. Automated localisation of the optic disc, fovea, and retinal blood vessels from digital colour fundus images. Br. J. Ophthalmol. 1999, 83, 902–910. [Google Scholar] [CrossRef] [PubMed]
  13. Sinthanayothin, C.; Kongbunkiat, V.; Phoojaruenchanachai, S.; Singalavanija, A. Automated screening system for diabetic retinopathy. In Proceedings of the International Symposium on Image and Signal Processing and Analysis, Rome, Italy, 18–20 September 2003; Volume 2, pp. 915–920. [Google Scholar]
  14. Akyol, K.; Şen, B.; Bayır, Ş. Automatic Detection of Optic Disc in Retinal Image by Using Keypoint Detection, Texture Analysis, and Visual Dictionary Techniques. Comput. Math. Methods Med. 2016. [Google Scholar] [CrossRef] [PubMed]
  15. Osareh, A.; Mirmehdi, M.; Thomas, B.; Markham, R. Automated identification of diabetic retinal exudates in digital colour images. Br. J. Ophthalmol. 2003, 87, 1220–1223. [Google Scholar] [CrossRef] [PubMed]
  16. Wang, J.; Wang, H. A study of 3D model similarity based on surface bipartite graph matching. Eng. Comput. 2017, 34, 174–188. [Google Scholar] [CrossRef]
  17. Lalonde, M.; Beaulieu, M.; Gagnon, L. Fast and robust optic disc detection using pyramidal decomposition and Hausdorff-based template matching. IEEE Trans. Med. Imaging 2001, 20, 1193–1200. [Google Scholar] [CrossRef] [PubMed]
  18. Li, H.; Chutatape, O. Automatic location of optic disk in retinal images. In Proceedings of the 2001 International Conference on Image Processing, Thessaloniki, Greece, 7–10 October 2001; Volume 2, pp. 837–840. [Google Scholar]
  19. Youssif, A.A.H.A.R.; Ghalwash, A.Z.; Ghoneim, A.A.S.A.R. Optic disc detection from normalized digital fundus images by means of a vessels’ direction matched filter. IEEE Trans. Med. Imaging 2008, 27, 11–18. [Google Scholar] [CrossRef] [PubMed]
  20. Mahfouz, A.E.; Fahmy, A.S. Fast localization of the optic disc using projection of image features. IEEE Trans. Image Process. 2010, 19, 3285–3289. [Google Scholar] [CrossRef] [PubMed]
  21. Mahfouz, A.E.; Fahmy, A.S. Ultrafast localization of the optic disc using dimensionality reduction of the search space. Med. Image Comput. Comput. Assist. Interv. 2009, 12, 985–992. [Google Scholar] [PubMed]
  22. Foracchia, M.; Grisan, E.; Ruggeri, A. Detection of optic disc in retinal images by means of a geometrical model of vessel structure. IEEE Trans. Med. Imaging 2004, 23, 1189–1195. [Google Scholar] [CrossRef] [PubMed]
  23. Ruggeri, A.; Forrachia, M.; Grisan, E. Detecting the optic disc in retinal images by means of a geometrical model of vessel network. In Proceedings of the International Conference on Engineering in Medicine and Biology Society, Cancun, Mexico, 17–21 September 2003; Volume 1, pp. 902–905. [Google Scholar]
  24. Wang, Y.; Zhang, H.; Yang, F. A Weighted Sparse Neighbourhood-Preserving Projections for Face Recognition. Iete J. Res. 2017, 63, 358–367. [Google Scholar] [CrossRef]
  25. Zhang, H.; Cao, L.; Gao, S. A locality correlation preserving support vector machine. Pattern Recognit. 2014, 47, 3168–3178. [Google Scholar] [CrossRef]
  26. Dekel, T.; Oron, S.; Rubinstein, M.; Avidan, S.; Freeman, W.T. Best-buddies similarity for robust template matching. In Proceedings of the IEEE Conference on Computer Vision and Pattern Recognition (CVPR), Boston, MA, USA, 7–12 June 2015; pp. 2021–2029. [Google Scholar]
  27. Staal, J.; Abràmoff, M.D.; Niemeijer, M.; Viergever, M.A.; Van Ginneken, B. Ridge-based vessel segmentation in color images of the retina. IEEE Trans. Med. Imaging 2004, 23, 501–509. [Google Scholar] [CrossRef] [PubMed]
  28. Walter, T.; Klein, J.C.; Massin, P.; Erginay, A. A contribution of image processing to the diagnosis of diabetic retinopathy-detection of exudates in color fundus images of the human retina. IEEE Trans. Med. Imaging 2002, 21, 1236–1243. [Google Scholar] [CrossRef] [PubMed]
  29. Dehghani, A.; Moghaddam, H.A.; Moin, M.S. Optic disc localization in retinal images using histogram matching. EURASIP J. Image Video Process. 2012, 2012, 19. [Google Scholar] [CrossRef]
  30. Rangayyan, R.M.; Zhu, X.; Ayres, F.J.; Ells, A.L. Detection of the optic nerve head in fundus images of the retina with Gabor filters and phase portrait analysis. J. Digit. Imaging 2010, 23, 438–453. [Google Scholar] [CrossRef] [PubMed]
  31. Ying, H.; Zhang, M.; Liu, J.C. Fractal-based automatic localization and segmentation of optic disc in retinal images. In Proceedings of the 29th Annual International Conference of the IEEE Engineering in Medicine and Biology Society, Lyon, France, 22–26 August 2007; pp. 4139–4141. [Google Scholar]
  32. Godse, D.A.; Bormane, D.S. Automated localization of optic disc in retinal images. Int. J. Adv. Comput. Sci. Appl. 2013, 4, 65–71. [Google Scholar]
Figure 1. The construction of template image. The blue rectangle is the minimum bounding rectangle containing the whole OD region marked by a green circle.
Applsci 08 00709 g001
Figure 2. The steps of our method to detect ODs in normal fundus photography and fundus photography containing pathologies. (a,e) Target image. (b,f) The blue rectangle is marked as the template, the green circle is the true optic disc. (c,g) Confidence map. The red circle is the result of our method in the confidence map. (d,h) The red cross is the final detection result.
Applsci 08 00709 g002
Figure 3. Results of the proposed method (the red cross represents the estimated OD center). (a,c,e,g,i,k) The OD center annotation ground truth. (b,d,f,h,j,l) Results of the proposed method on the DRIVE database.
Applsci 08 00709 g003
Figure 4. Results of the proposed method (the red cross represents the estimated OD center). (a,c,e,g,i,k,m,o,q,s) The OD center annotation ground truth. (b,d,f,h,j,l,n,p,r,t) Results of the proposed method on the DIARETDB1 database.
Applsci 08 00709 g004
Figure 5. Error distances of OD detection for all databases. The numbers circled in red indicate images in (b) that failed to detect ODs.
Applsci 08 00709 g005
Figure 6. Error distances and success rates of OD detection using different numbers of templates.
Applsci 08 00709 g006
Table 1. Results of the proposed method.
DatasetNumber
of Images
Optic Disc
Detected
Average Error
Distance (Pixels)
Success
Rate
DRIVE404010.4100%
DIARETDB1898712.997.7%
Table 2. Results of different algorithms.
Localization MethodsDatasetNumber of ImagesAverage Error
Distance (Pixels)
Success Rate
Sinthanayothin et al. [12]DRIVE40-60%
Walter et al. [28]DRIVE40-80%
Dehghani et al. [29]DRIVE4015.995%
Rangayyan et al. [30]DRIVE4023.2100%
Ying et al. [31]DRIVE4027100%
Kemal Akyol et al. [14]DRIVE40-95%
DIARETDB189-94.38%
Godse and Bormane. [32]DRIVE40-100%
DIARETDB189-96.62%
The proposed methodDRIVE4010.4100%
DIARETDB18912.997.7%

