CFD Simulation of Vortex Induced Vibration for FRP Composite Riser with Different Modeling Methods

1
School of Civil and Architectural Engineering, Shandong University of Technology, Zibo 255000, China
2
School of Civil and Environmental Engineering, University of Illinois Urbana-Champaign, Champaign, IL 61801-2352, USA
3
School of Engineering and Information Technology, University of New South Wales Canberra, Campbell, ACT 2600, Australia
4
Shandong Longquan Pipeline Engineering Share Co., Ltd., Zibo 255200, China
*
Authors to whom correspondence should be addressed.
Appl. Sci. 2018, 8(5), 684; https://doi.org/10.3390/app8050684
Submission received: 18 March 2018
/
Revised: 18 April 2018
/
Accepted: 24 April 2018
/
Published: 27 April 2018
(This article belongs to the Section Materials Science and Engineering)
Abstract
:Featured Application
Three different risers, i.e., conventional steel riser, composite riser with orthogonal reinforcements and tailored composite riser, are compared for their VIV characteristics. The effects of 2D and 3D models and fluid–structure interaction (FSI) have been considered and two different modeling methods are established to simulate the FRP composite risers. This paper will serve to further understand the dynamic characteristics of the FRP composite risers and improve the utilization of the FRP composite risers in real projects. We believe present paper would appeal to the researchers working on the design and analysis of composite structures and their optimizations.
Abstract
Steel risers are widely used in offshore oil and gas industry. However, the production capacity and depths are limited due to their extreme weight and poor fatigue and corrosion resistance. Nowadays, it is confirmed that fiber reinforced polymer (FRP) composite risers have apparent advantages over steel risers. However, the study of vortex induced vibration (VIV) for composite risers is rarely involved. Three different risers (one steel riser and two composite risers) were compared for their VIV characteristics. The effects of 2D and 3D models and fluid–structure interaction (FSI) were considered. The models of composite risers are established by effective modulus method (EMM) and layered-structure method (LSM). It is found that 2D model are only suitable for ideal condition, while, for real situation, 3D model with FSI has to be considered. The results show that the displacements of the FRP composite risers are significantly larger than those of the steel riser, while the stresses are reversed. In addition, the distributions of the displacements and stresses depend on the geometries, material properties, top-tension force, constraints, etc. In addition, it is obvious that EMM are suitable to study the global working condition while LSM can be utilized to obtain the results in every single composite layer.
1. Introduction
The exploitation and utilization of marine resources, such as oil and gas, lead to the development of offshore structures. Risers which act as a transport component between the production platforms and sub-sea wellheads are an indispensable part for the offshore exploitation and transportation system. Currently, risers are normally made from high grade steel. Their extreme weight results in the significant increase of the requirement in top tension forces, thereby leading to the limitation of the numbers of risers that can be attached to current platforms or larger platforms to carry the same number of risers with the increase of depths.
It is well acknowledged that fiber reinforced polymer (FRP) composites have great mechanical properties and lower density; therefore, using FRP composites instead of steel can indeed reduce the weight of individual riser, thereby the requirement of top tension forces, which results in lower operational costs [1]. Meanwhile, FRP composites also have better performance in fatigue, corrosion and thermal insulation compared with steel, leading to lower maintenance costs [2]. It should be noted that the design results of a composite riser can be quite different, even for the same operational situation. The design variables of the geometries of a composite riser basically include liner and composite materials, stacking sequences of laminate, fiber orientations, lamina thicknesses, etc. Therefore, more challenges and complexities of design and analysis are produced for the use of composites in risers.
During the past 40 years, several design studies and projects have been conducted to confirm the feasibility of composite risers. The initial attempt to fabricate and test composite risers was accomplished by Institut Francais du Petrole (IFP) and Aerospatiale of France [3] in the 1980s. In the 1990s, tests of mechanical capacities of the composite riser tube were performed by National Institute of Standards and Technology (NIST) and Advanced Technology Programs (ATPs) [4]. Then, more tests, including field tests and optimized designs of composite risers, were conducted by different research institutes and global enterprises [5,6,7,8,9,10,11,12,13]. These prototypes prove that FRP composite risers have significant benefits in weight saving compared to steel risers. In addition, using optimization methodologies in the designs would lead to more benefits for the composite risers with the same load-carrying capacity.
Vortex-induced vibrations (VIV) are motions induced on bodies interacting with an external fluid flow, produced by—or the motion producing—periodical irregularities on this flow. VIV would cause the fatigue damage of risers, leading to the construction and environmental disaster. Therefore, many studies of VIV have been conducted in the past decades. The study of VIV started with experiment in 1960s using wind tunnel [14]; then, many tests were conducted for the VIV of risers [15,16,17,18]. Besides tests and experiments, researchers proposed different empirical models to solve the VIV problem of risers. Initially, Hartlen and Gurrie built the lift-oscillator model [19], and then this model was developed and applied in the VIV study of flexible slender cylinders [20]. More recently, the wake oscillator models were modified and developed by different researchers according to different parameters and situations [21,22,23,24,25,26]. Nowadays, computational fluid dynamics (CFD) has been employed in the VIV simulation and different models and methodologies have been set up. 2D simulation of risers was done by Huang and Wang [27]. Ji and Liu et al. simulated the VIV response of in-line two risers [28,29]; and a top tension riser was used as an example to examine fatigue safety factor of the riser and the effects of the random coefficient [30].
From the previous studies including tests, theoretical analyses and CFD simulations, the VIV of conventional steel riser were understood. However, the study of VIV for composite risers, the late-model risers, are rarely involved. The complexity and design variety of composite risers enhance the difficulty for the study of VIV for composite risers. A global–local analysis methodology was built to investigate the VIV responses of composite riser under semi-empirical fluid load models [31]. Huang and Chen et al. compared the dynamic performance of composite and steel risers using ABQUS and SHEAR7 [32,33]. These studies normally employed empirical models and no fluid–structure interaction (FSI) was included. The design variety for the composite risers’ geometries and the VIV response in every lamina of composite riser were not considered either.
In this paper, the VIV responses of three different risers, i.e., conventional steel riser (Riser 1), composite riser with orthogonal reinforcements (Riser 2) and tailored composite riser (Riser 3), are investigated and compared considering the effects of 2D and 3D models and FSI. The simulation of risers’ VIV was achieved by ANSYS 17.0 including modules of Geometry, ACP, Transient Structural, Fluid Flow and System Coupling. Effective modulus method (EMM) and layered-structure method (LSM) were built to model composite risers in ACP and Transient Structural and the flow situation is simulated in Fluid Flow (Fluent). System coupling with the data exchange between risers and fluids were utilized to achieve FSI. The VIV responses, such as coefficient of drag (CD), coefficient of lift (CL), displacement and stress under VIV, were obtained and compared for all the three risers with different modeling methods.
2. Risers’ Geometries and Materials and FE Modeling
Three different risers, i.e., conventional steel riser (Riser 1), composite riser with orthogonal reinforcements (Riser 2) and tailored composite riser (Riser 3), were investigated and compared. For Riser 1, high grade steel (X80) was used, while, for Risers 2 and 3, AS4/PEEK composites with polyetheretherketone (PEEK) liner were employed. The CFD simulation of VIV for these risers are conducted by ANSYS (Version 17.0, Ansys, Inc., Canonsburg, PA, USA, 2016).
2.1. Riser Geometries
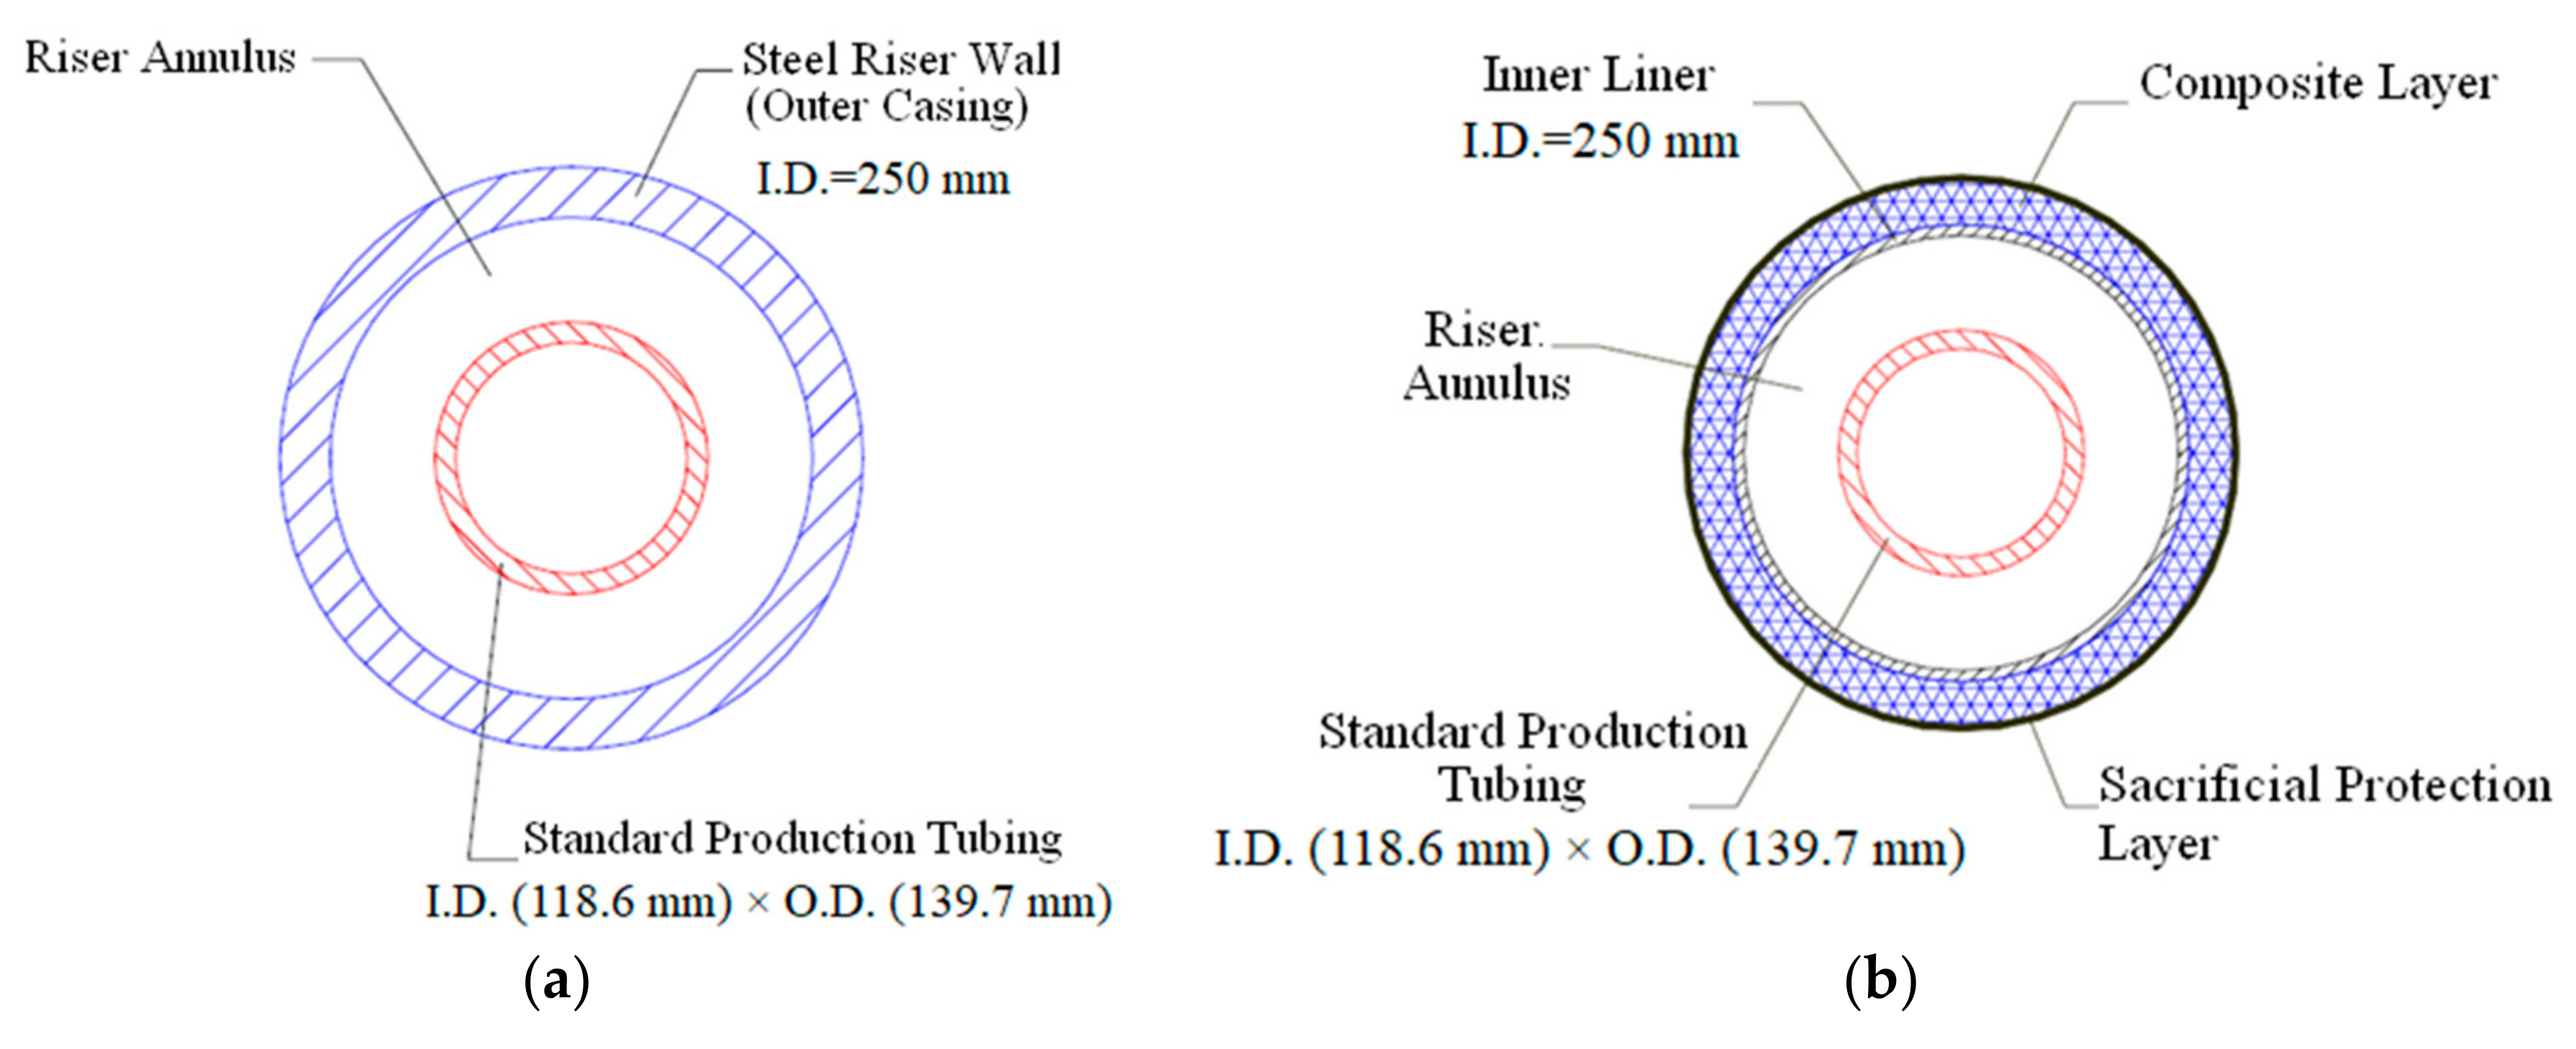
The internal diameter (I.D.) of the riser joints was fixed at 250 mm. The outer diameter (O.D.) varied from riser to riser depending on the wall thickness of segment determined by the design. To satisfy the same functional requirements, the thicknesses for Risers 1, 2 and 3 were 25 mm, 38 mm and 30 mm, respectively. The steel riser was monolithic, while the composite risers consisted of an inner liner, a composite structural body and an external sacrificial layer (Figure 1).
2.2. Materials for the Risers
High grade steel X80 was selected as the material for Riser 1, while AS4/PEEK composites with PEEK liner were chosen for Risers 2 and 3. The properties of these materials are listed in Table 2.
The material properties listed in the table were utilized for steel riser directly, as well as composite risers with layered-structure method (LSM). In terms of the composite risers with effective modulus method (EMM), a MATLAB code (Version 9.1 R2016b, MathWorks, Inc., Natick, MA, USA, 2016) of 3D laminate property theory [34,35] was created for calculating composite tube’s 3D effective properties using Equations (1)–(6). Table 3 shows the effective properties of FRP composite risers for effective modulus method.
where is the lamina elasticity matrix, is the principle elasticity matrix of each composite lamina, is the effective elastic compliance matrix of the composite laminate, is the laminate stiffness, and is the principal compliance matrix for transversely isotropic composite lamina.
2.3. FE Modeling
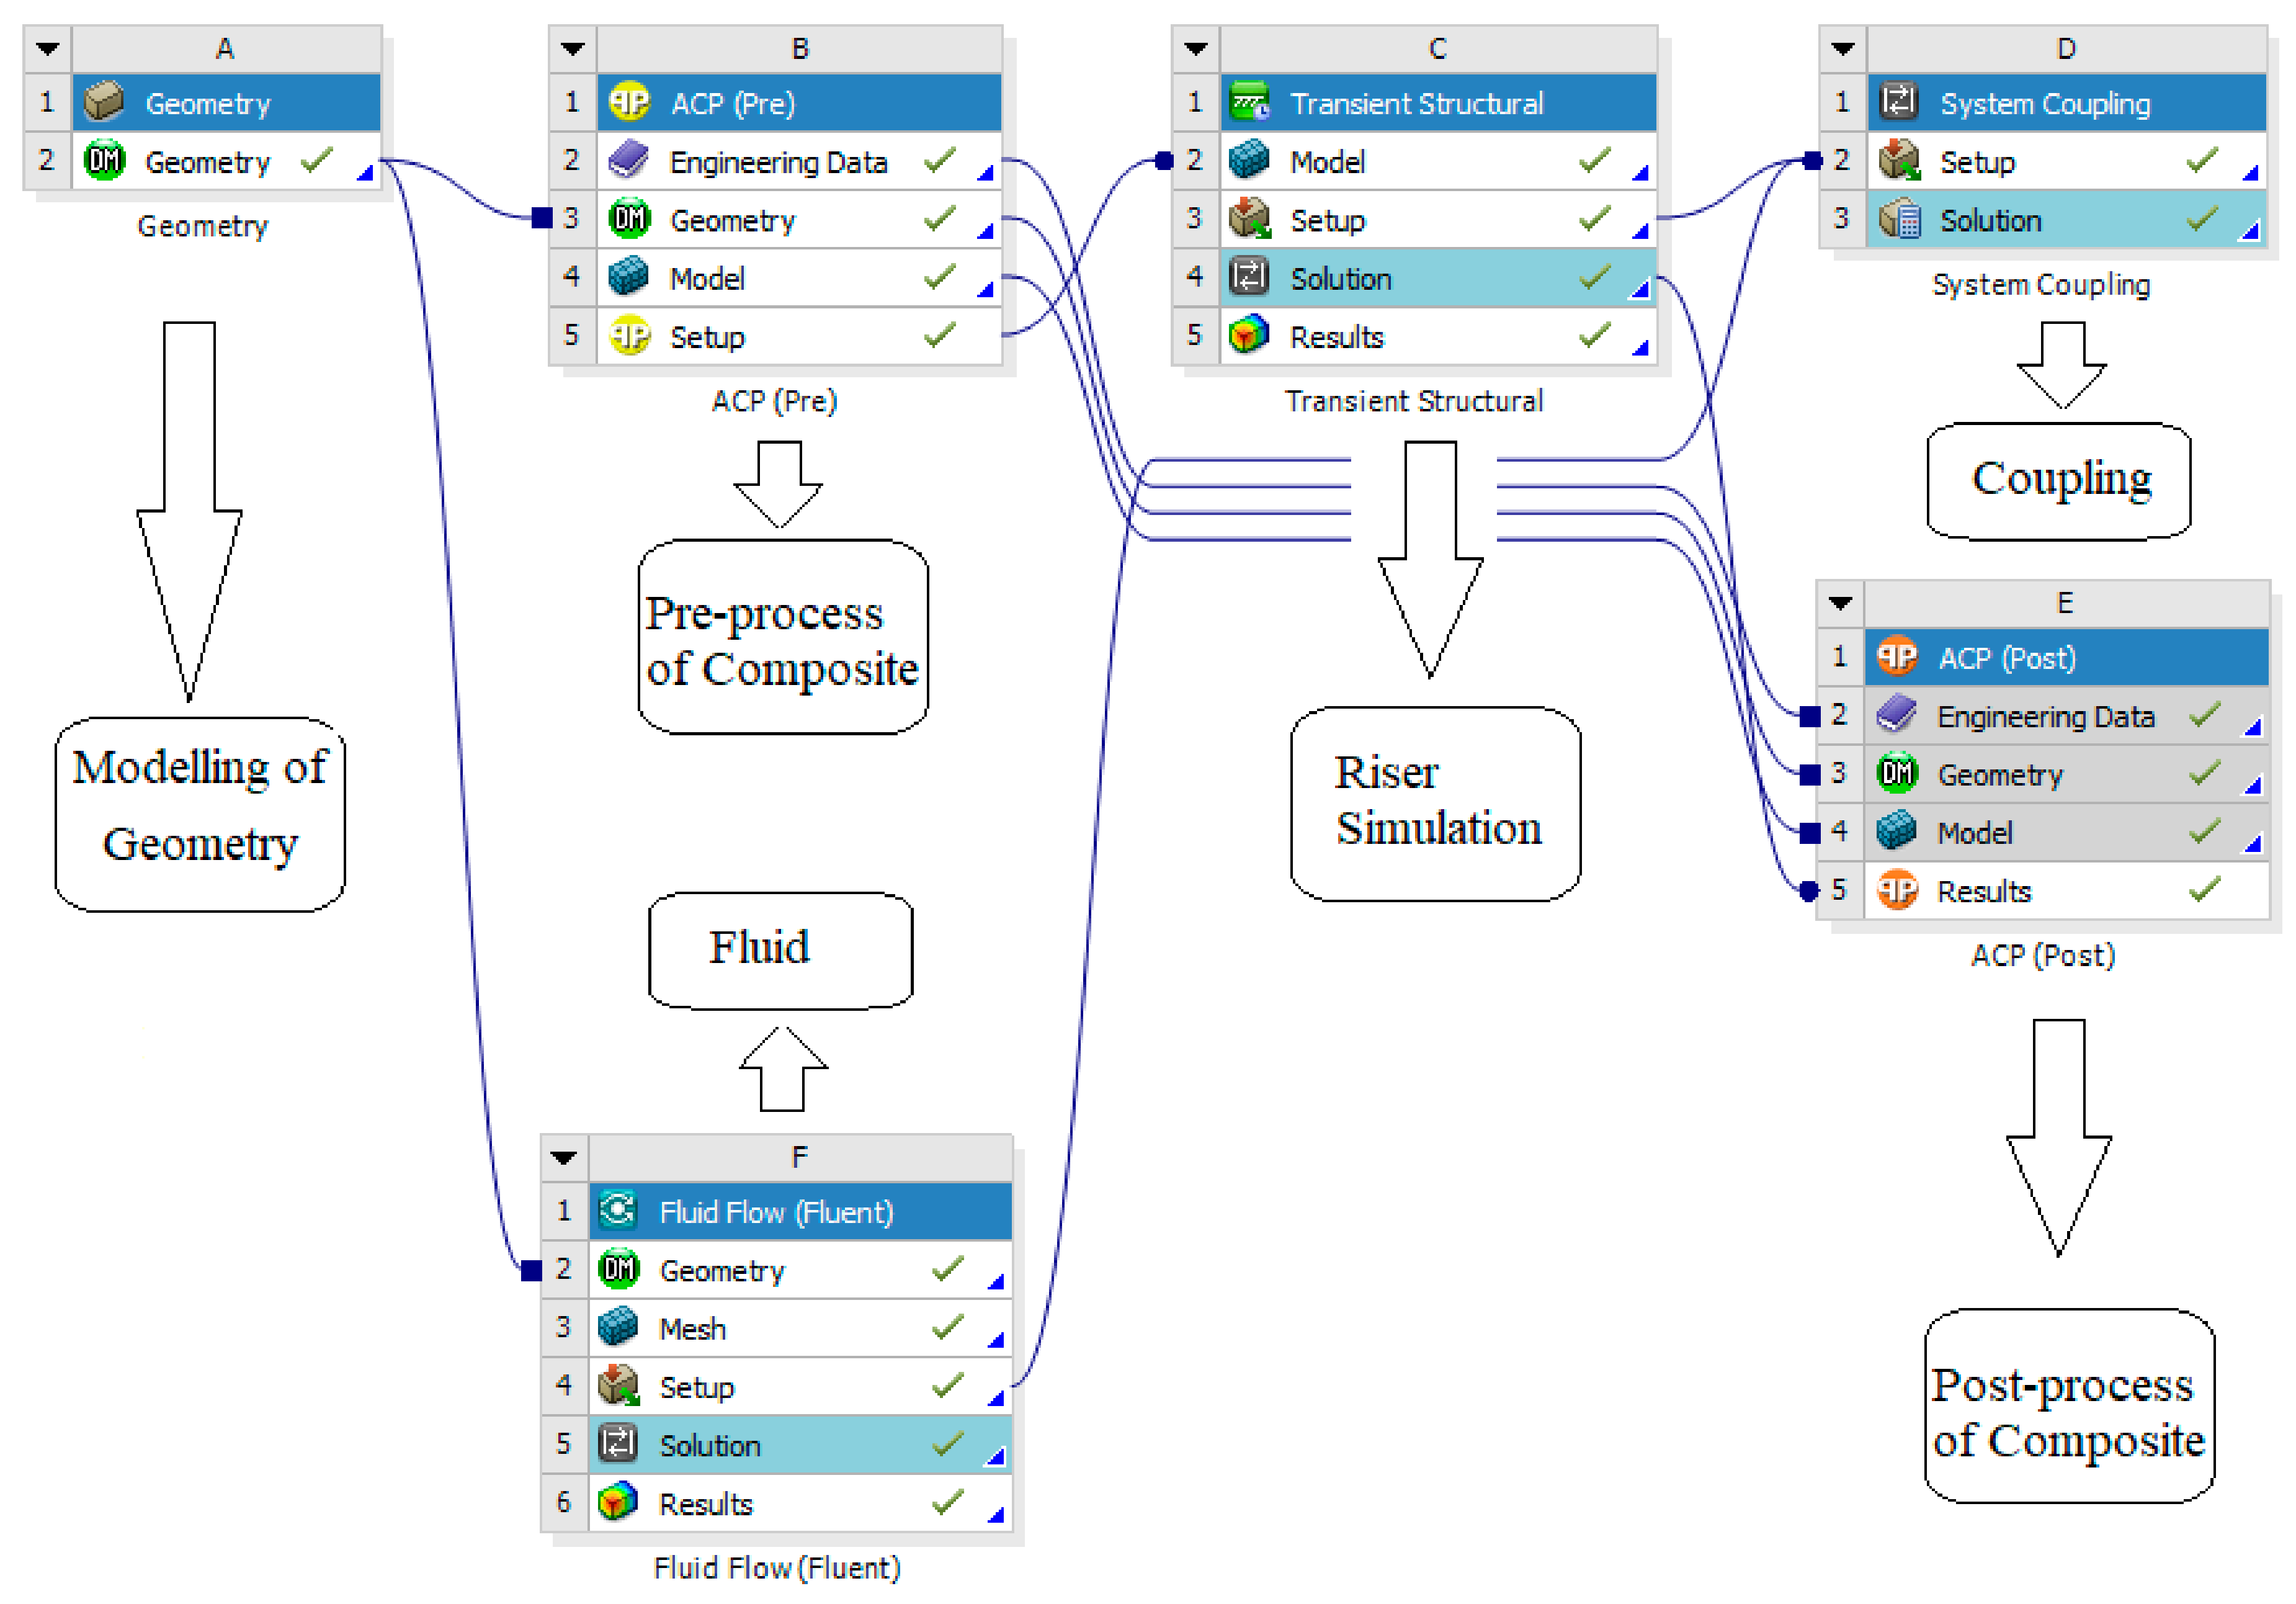
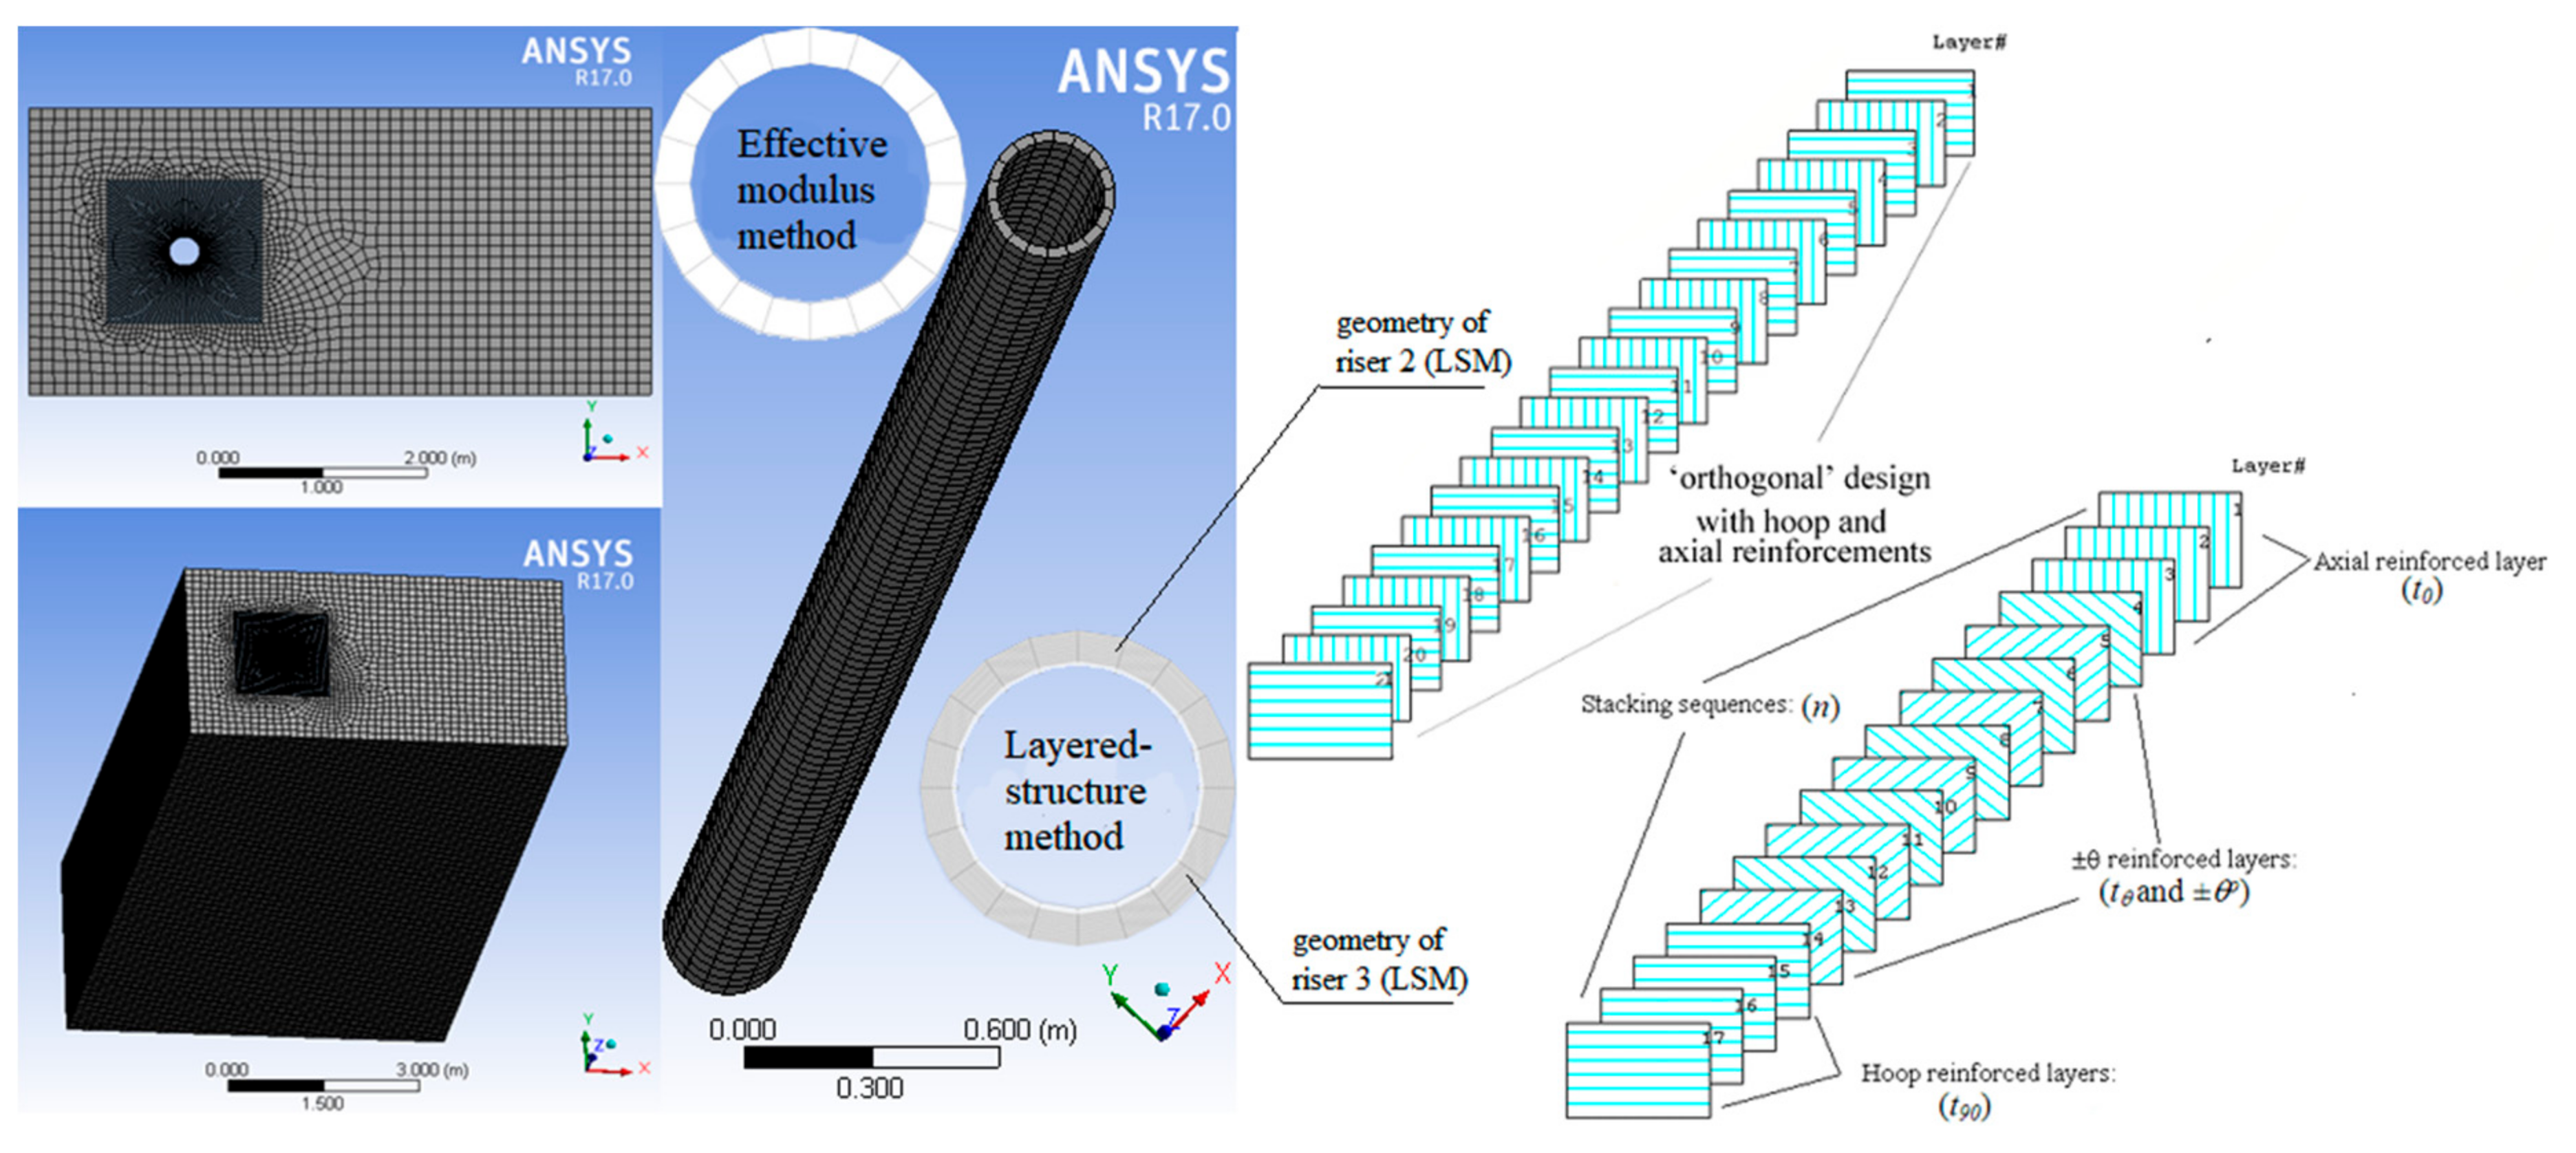
The simulation of risers’ VIV was achieved by ANSYS17.0 including modules of Geometry, ACP, Transient Structural, Fluid Flow and System Coupling (Figure 2).
The following geometry was utilized to create the basic geometry of flow field: 10D × 20D for 2D simulation and 10D × 20D × 12.5 m for 3D simulation. The basic geometry of the risers were based on previous design results [6,7,10,13].
Flow situation was simulated by Fluid Flow (Fluent) including flow dimension, flow model, flow properties, flow boundary conditions, etc. The surface size of the flow field is defined by 10D × 20D, where D is the outside diameter of the risers. The riser center is 5D from the inlet. One-year winter storm situation in Gulf of Mexico [36], i.e., velocity U = 0.36 m/s and kinematic viscosity coefficient υ = 1.06 × 10⁻⁶, was used as the design velocity in this paper. Large eddy simulation (LES) which allows the largest and most important scales of the turbulence to be resolved (small eddies are modeled), while greatly reducing the computational cost incurred by the smallest scales, was selected for the CFD simulation. Resolving only the large eddies allows larger time-step and coarser mesh sizes than direct numerical simulation (DNS). However, LES still requires finer meshes than Reynolds Averaged Navier–Stokes (RANS). Meanwhile, LES has to be run for a sufficiently long flow-time to obtain stable statistics of the flow. As a result, the computational cost (memory and CPU time) involved with LES is normally higher than that in RANS calculations. The inlet, outlet, left and right sides and top and bottom sides were defined as boundary conditions of velocity inlet, outflow, symmetry and wall, respectively. More specifically, velocity inlet consisted of 0.36 m/s (all three risers) for velocity magnitude; 3.78% (Riser 1), 3.75% (Riser 2), and 3.77% (Riser 3) for turbulent intensity (Equation (7)); O.D. of each riser for hydraulic diameter; 1.0 was utilized for flow rate weight in outflow boundary; symmetry boundaries were used for the left and right sides to reduce the extent of computational resource; in the wall boundary, stationary wall was used for wall motion and no slip for shear condition. To use LES model, bounded second order implicit transient formulation must be chosen as solution method.
where I is turbulent intensity and Re is Reynolds numbers.
ACP (Pre) was utilized to create the lamination of composite risers (Table 1 and Table 2) including material properties for liner and composites, liner and composite lamina thicknesses, fiber orientation, numbers of reinforced layers, and laminate stacking sequences (Figure 3) for the layered-structure method.
Transient Structural was utilized to simulate the dynamic response of risers including displacement history, global stress distribution, etc. Besides the geometry of the riser, the input parameters also included the gravity, top-tension force (Table 4), buoyancy (based on the geometry of the riser and the density of the fluid), simple support at the top end, fixed support at the bottom end and the fluid solid interface.
ACP (Post) was utilized to present the dynamic stress and deformation response for each lamina of the composite risers for the layered-structure method.
System Coupling was utilized to transfer the data between Transient Structural and Fluid Flow to achieve the two-way fluid structure interaction. In this module, analysis type was set as transient and the duration time was set as 200 s (step size is 0.2 s). For the Co-Sim. Sequence, Fluid Flow (Fluent) was 1 and Transient Structural was 2.
Table 4 presents the flow situation and Reynolds numbers (Re) and the tension forces for all the risers. Reynolds numbers are calculated by Equation (8), where U is the flow velocity, D is the outside diameter of the riser, and υ is kinematic viscosity coefficient.
To ensure the accuracy of the simulation for vortex shedding phenomenon, the fluid grid for the 5D × 5D area around the riser was refined to take the data exchange between the riser and flow into account. The dynamic mesh was employed in the refined zone. The dynamic mesh zones involved seven faces, i.e. the six surrounding planes of the refined zone (set as stationary) and the contact surface between fluid and riser (set as system coupling). Smoothing and remeshing were utilized as the dynamic mesh methods. For smoothing method, 0.6 and 0.8 were used for spring constant factor and Laplace node relaxation, respectively. Remeshing method included local cell, local face and region face; also, the sizing function is turned on.
In terms of the flow surface (XY-direction), 4478 elements were employed (including the refined area) for both 2D and 3D simulation; in the depth of the flow (Z-direction), 150 elements were applied for 3D simulation. In total, 671,700 elements, which balanced the accuracy and computational cost, were utilized in the flow zone (3D simulation). The number of the elements for the fluid zone was decided based on convergence study, i.e., reducing the number might lead to the loss of accuracy while increasing the number could not change the result obviously.
For the steel riser, the traditional modeling method was utilized with isotropic steel. For the composite risers (Risers 2 and 3), two different methods, effective modulus method and layered-structure method, were established. In effective modulus method, composite riser is regarded as an anisotropic monolithic structure rather than layered-structure using Equations (1)–(6), i.e., only the effective properties for the entire riser in Table 3 is required. In the layered-structure method, the properties for the liner and each composite lamina (Table 2) are required as well as the lamination configuration of the riser (Table 1) to create the real structure of the composite riser. Comparatively speaking, EMM is easier during the modeling process and needs less computational resource to obtain the global results, while LSM can be used to get the response of each composite lamina at the expense of larger computational resource and longer calculation time. The risers are modeled by Solid185; 240 elements in length direction and 20 elements in hoop direction were employed. In total, 4800 elements were utilized in the riser based on convergence study. Compared to the element number in the fluid zone, the number of elements for risers would not lead to significant difference in the requirement of computational resource and calculation time. All the risers were fixed at the bottom and simple supported at the top. Top tension force was also employed at the top end of the risers, which equals to 1.5 times the weight for the steel riser and 2 times the weight for the composite riser (Table 4).
In the two-way FSI, the riser deformation, the flow data variation and the influence between them were considered. Figure 3 shows the FE model of the flow and riser.
3. Results and Comparison
In this section, VIV characteristics of three different risers are compared. The effects of 2D and 3D models and fluid–structure interaction (FSI) have been considered, as well as the effect of the two different modeling methods for composite risers.
3.1. Properties for Different Risers
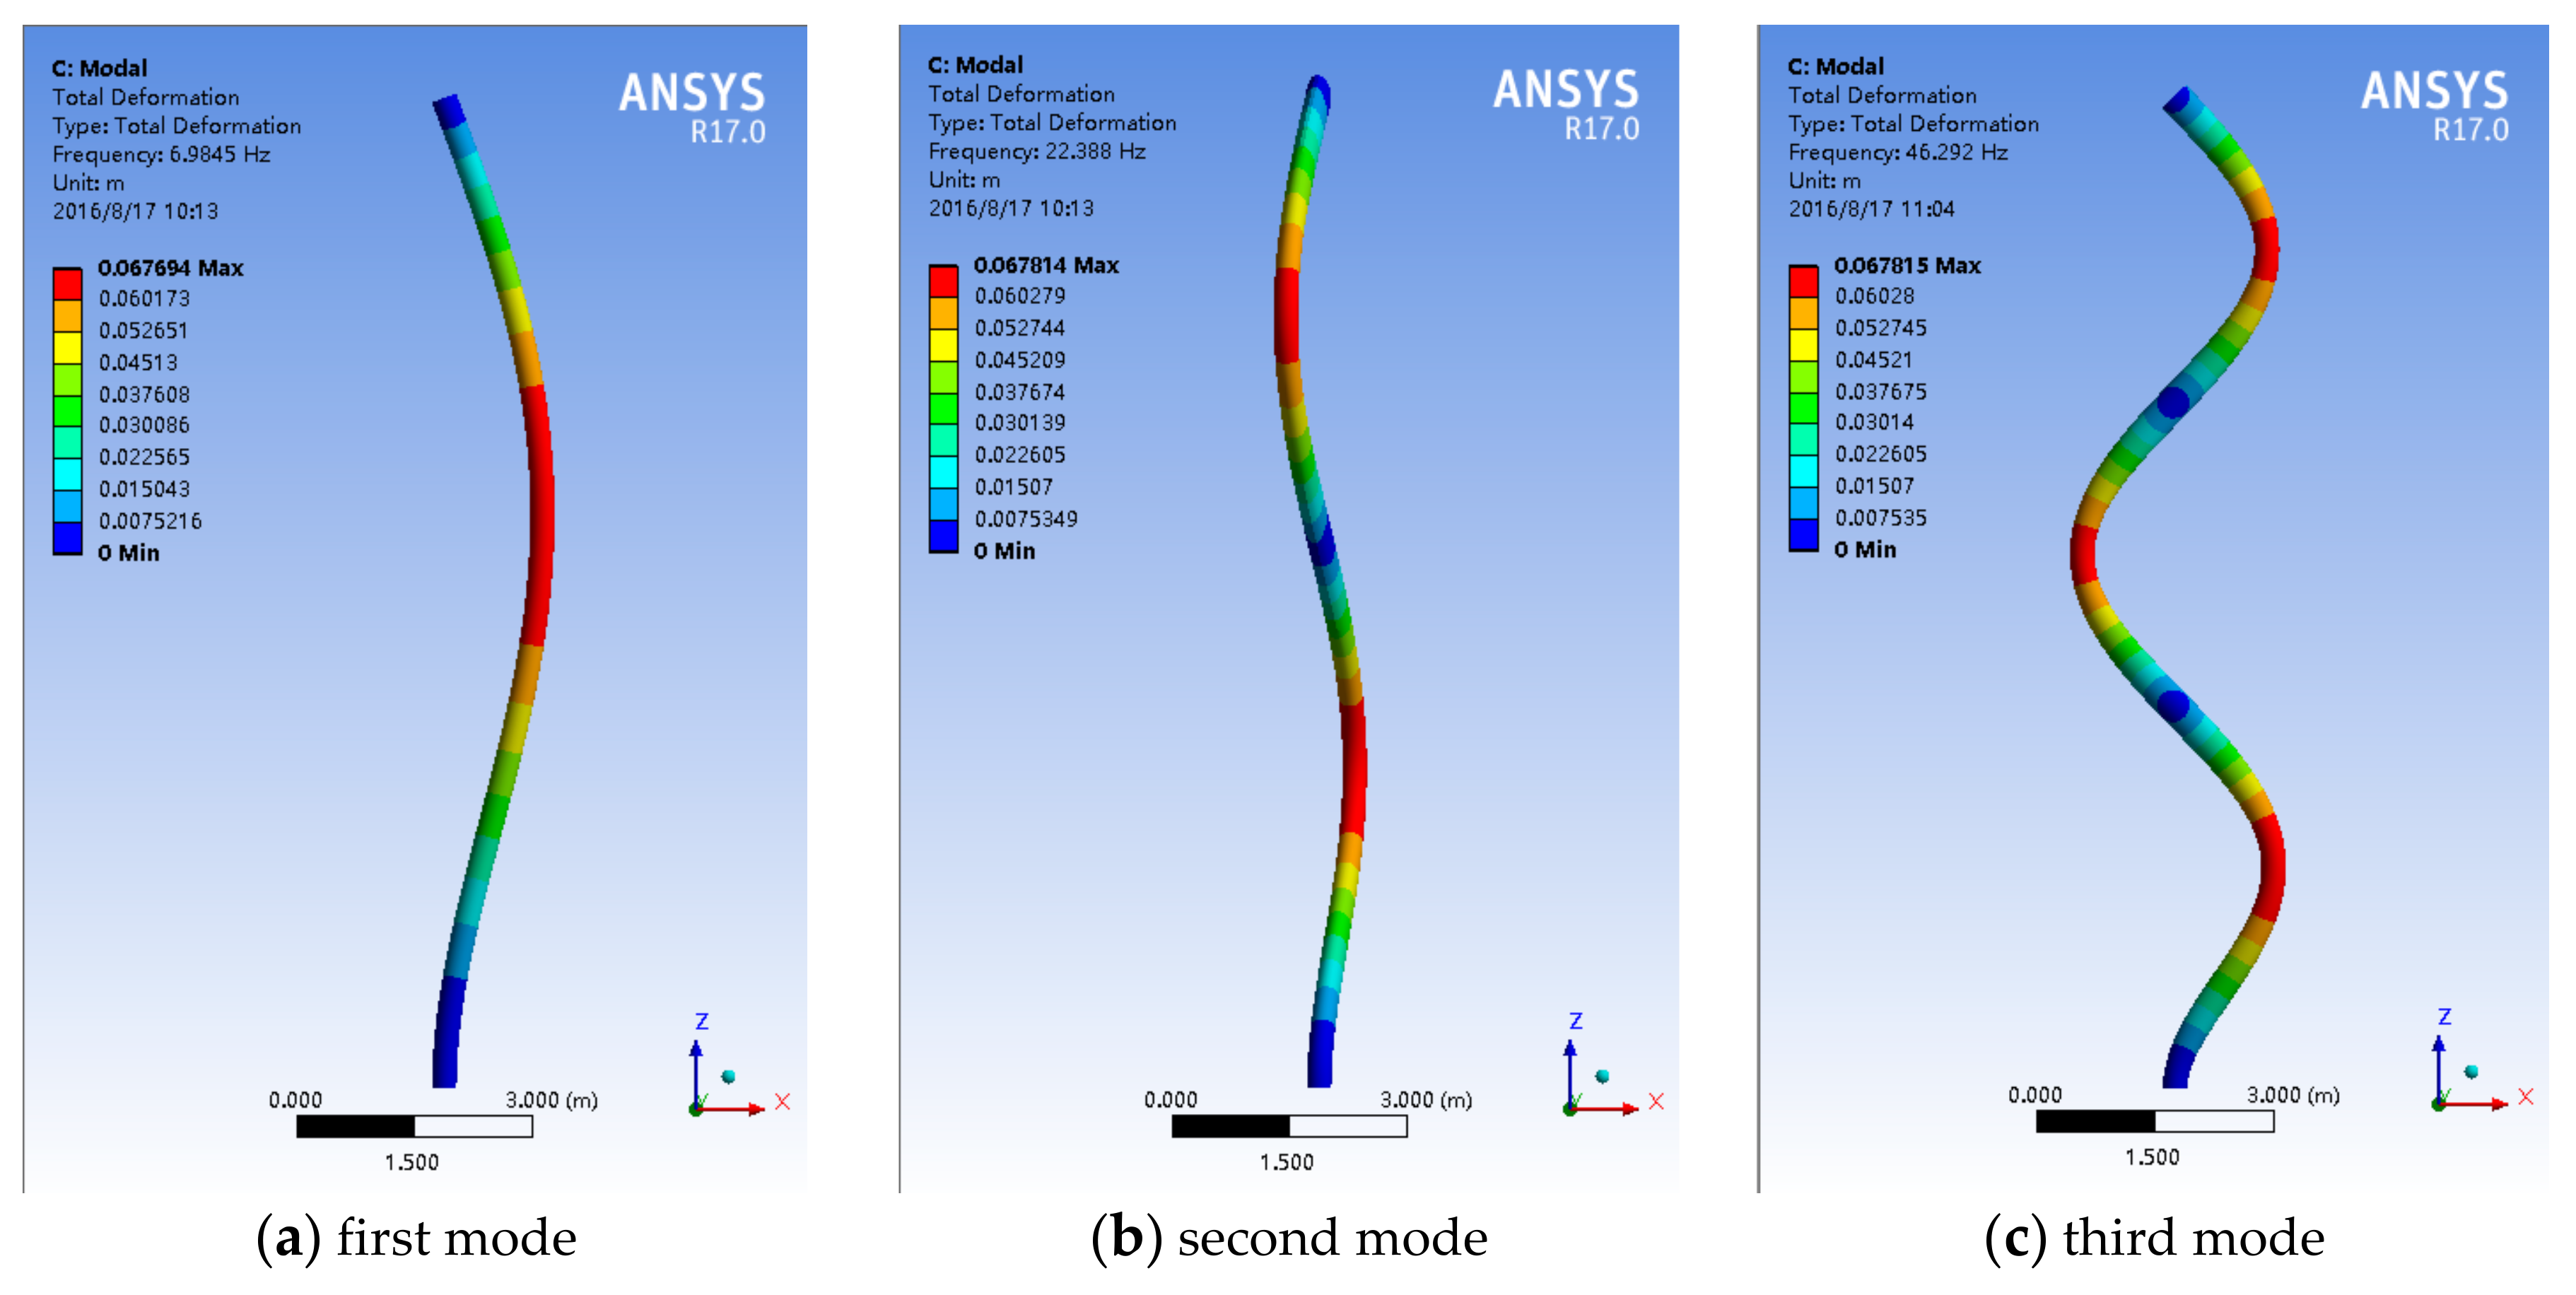
Based on the risers’ geometries, material properties, buoyancy and top tension forces, pre-stress modal analysis is conducted to obtain the natural frequencies and modal shapes for the risers, as shown in Figure 4 and Table 5.
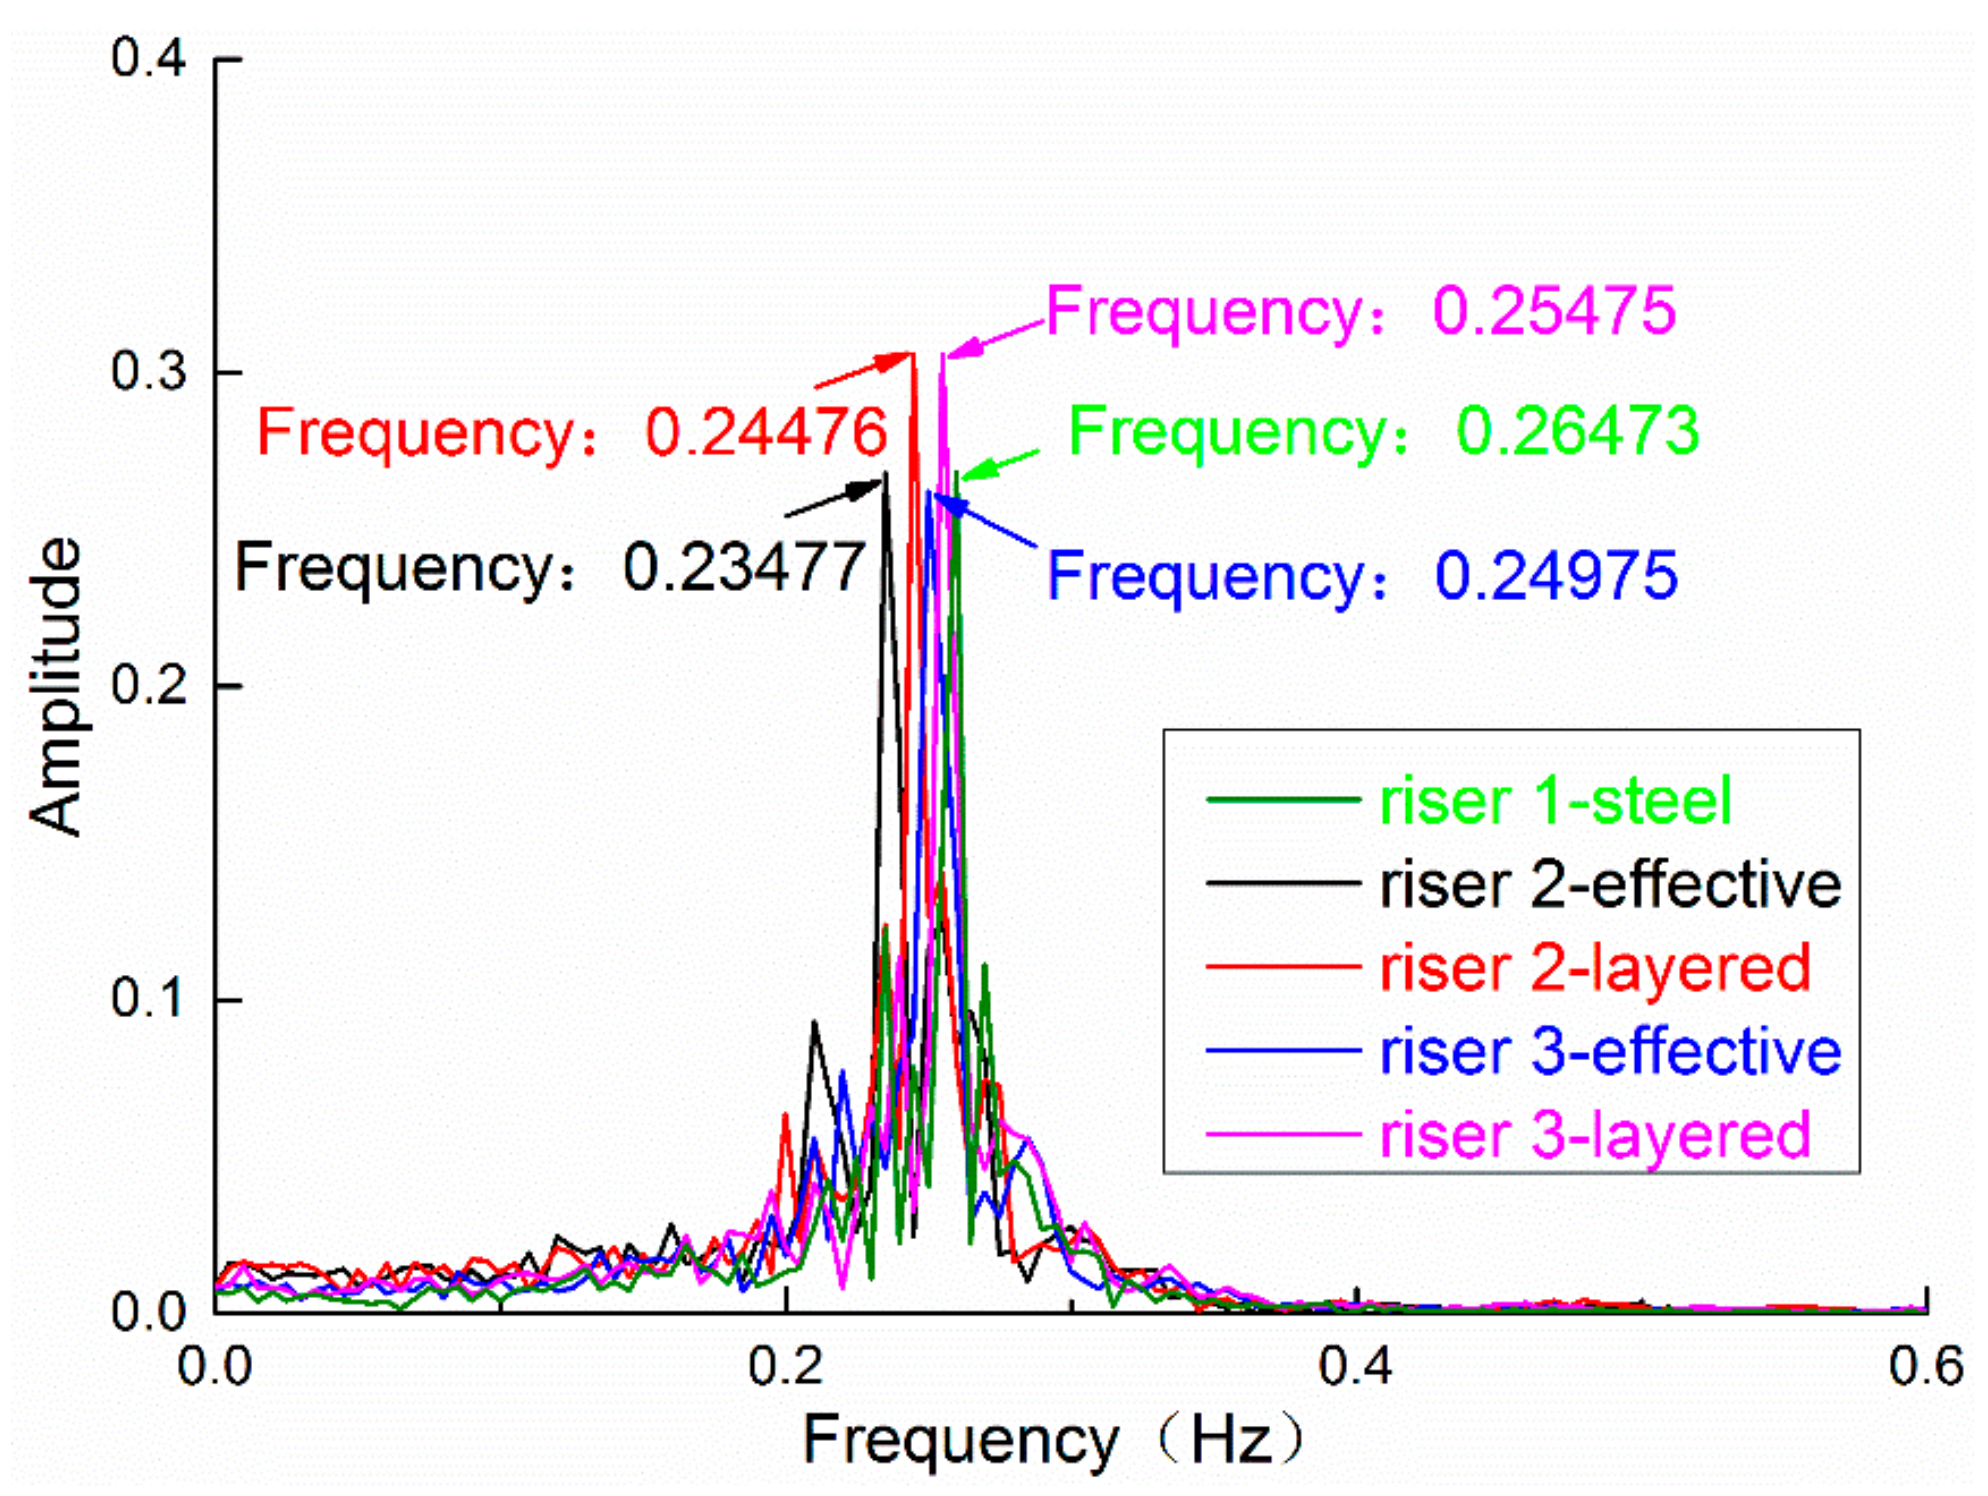
When the vortex shedding frequency becomes close to the natural frequency of the riser, the phenomenon of “lock-in” happens, which results in large and damaging vibrations leading to the fatigue failure of the riser. The vortex shedding frequency can be calculated by Equation (9) which includes Strouhal number , the outside diameter of riser D and the flow velocity U. According to the relationship between Re and , the Strouhal number for all the risers is 0.21.
For a riser, the vortex shedding frequency can also be obtained by a fast Fourier transform (FFT) of the lift coefficient CL (Figure 5). These results are compared and summarized in Table 5.
In addition, the possibility of a riser’s “lock-in” using reduced velocity Ur was estimated using Equation (10). When Ur ranges 4–8 [5], “lock-in” occurs. The Ur of all the risers are listed in Table 5.
From the results listed in Table 5, it can be seen the natural frequencies are far from their vortex shedding frequencies and the reduced velocity Ur are not in the range of 4–8. Hence, for all the risers, “lock-in” is unlikely to happen.
3.2. Effects of 2D and 3D Models
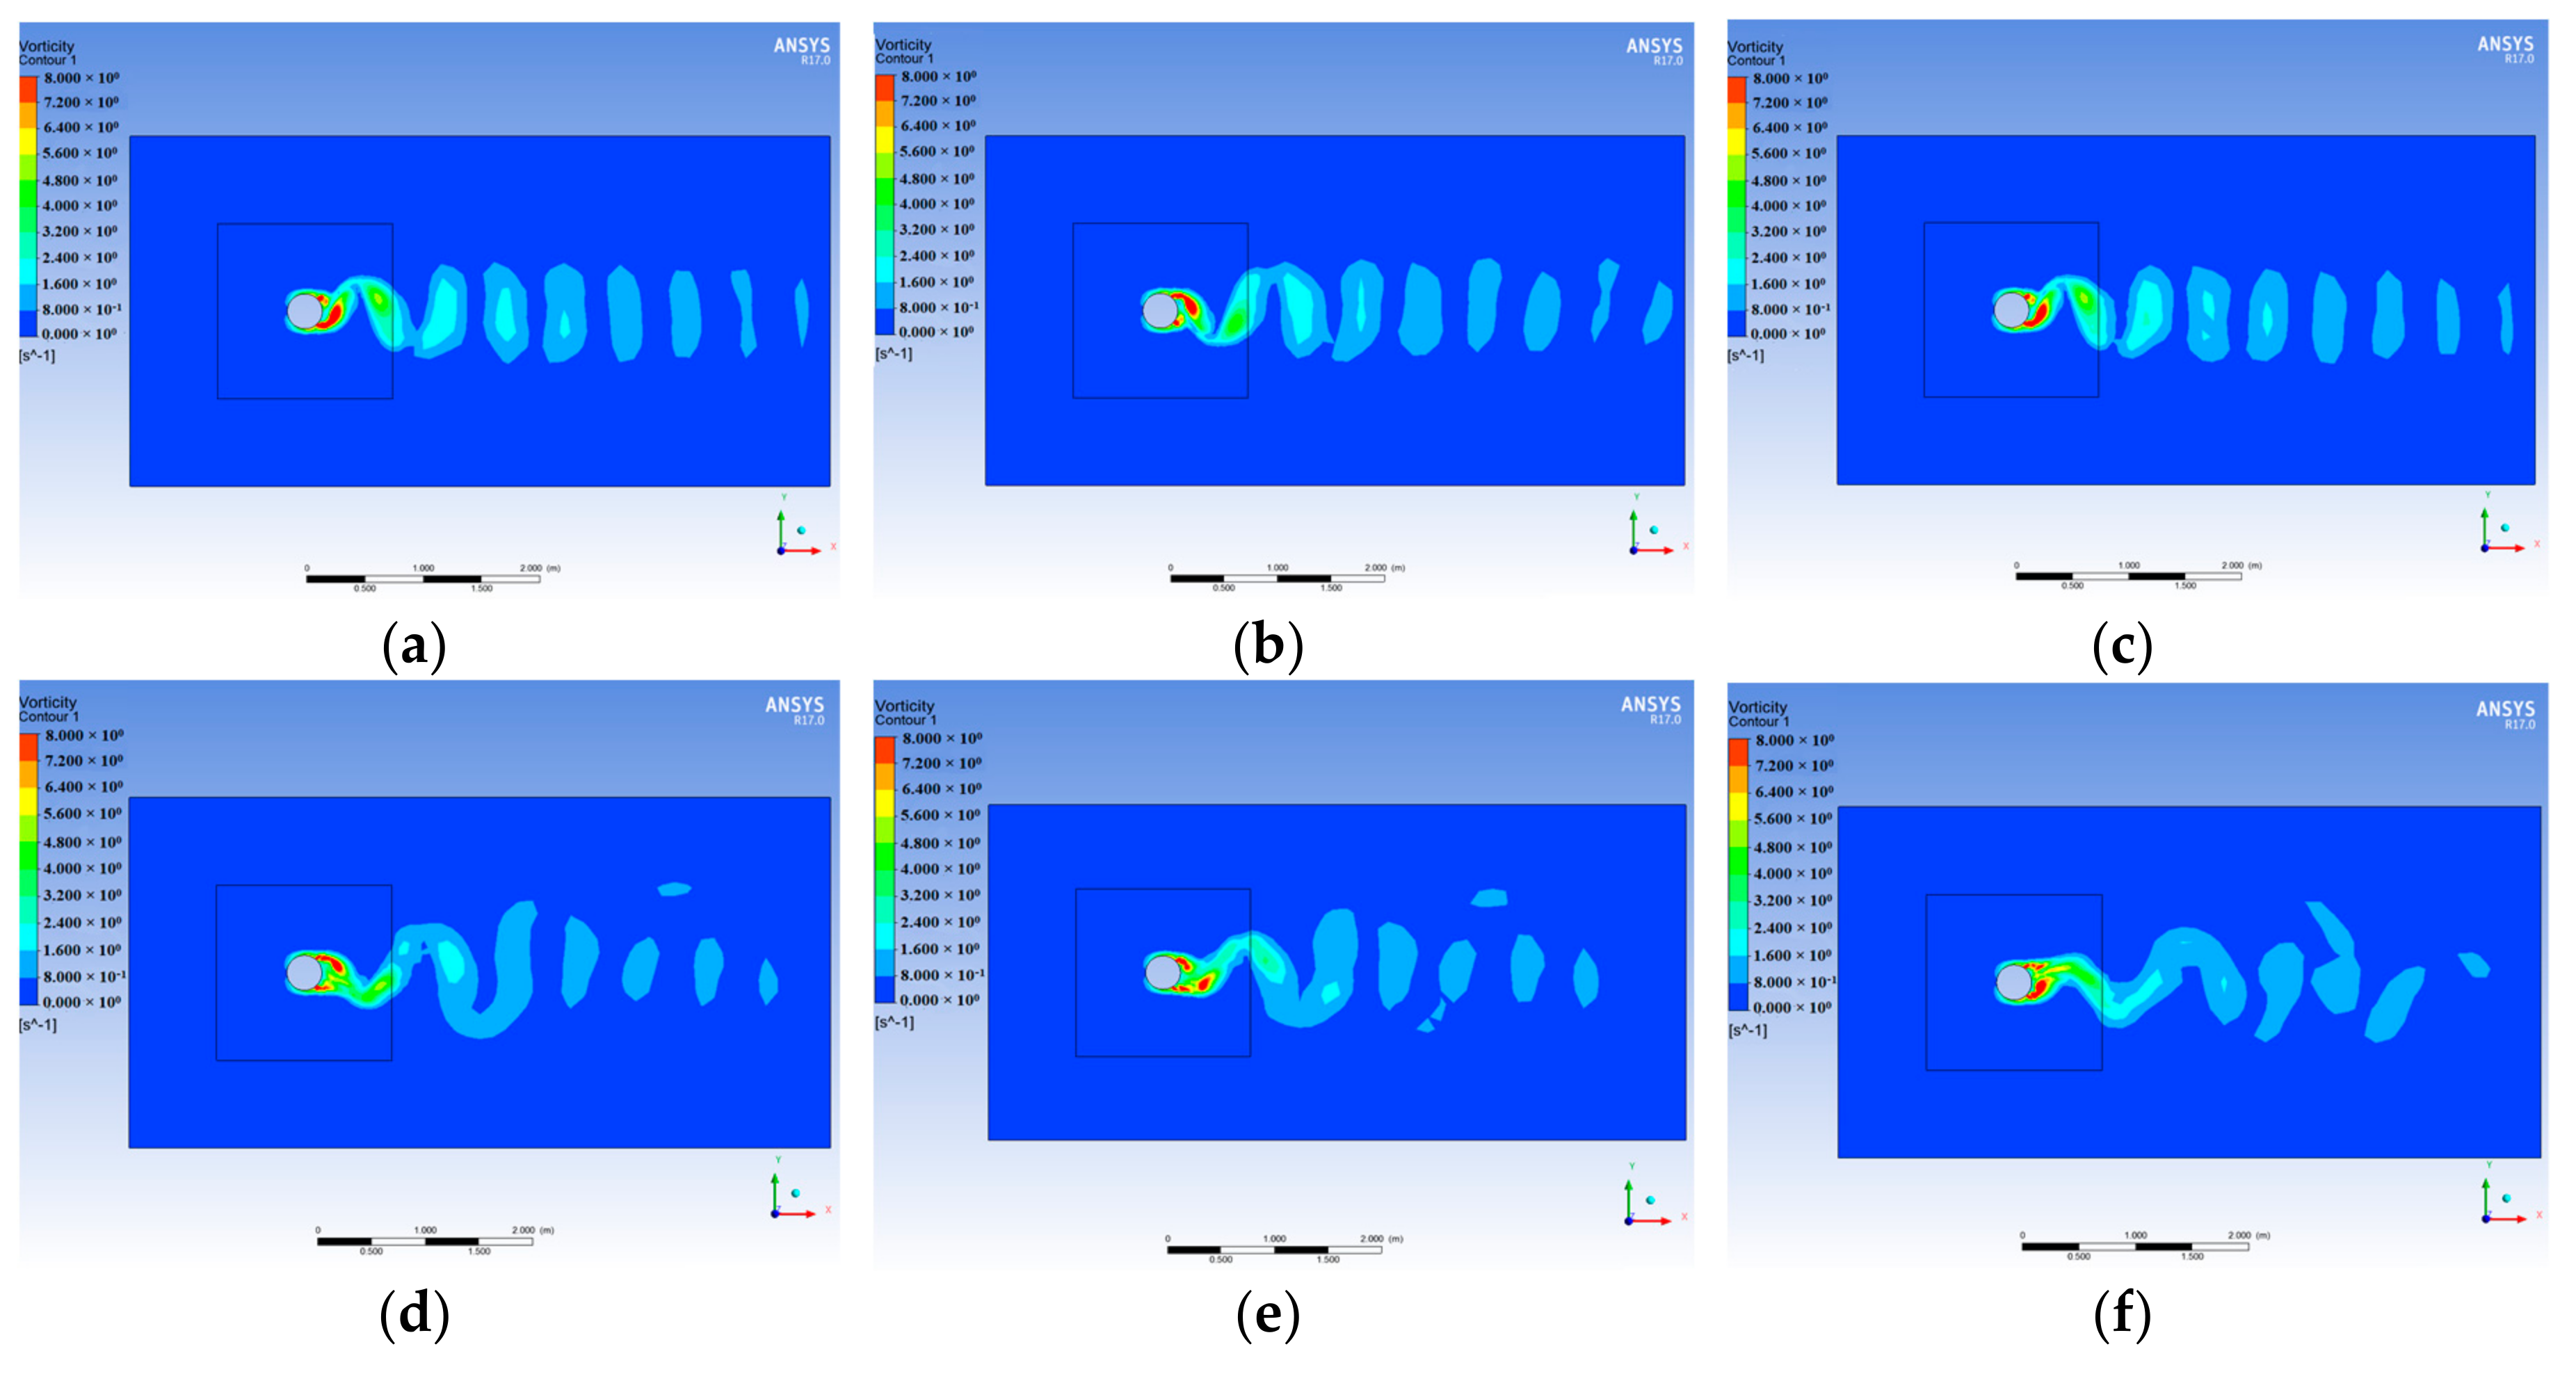
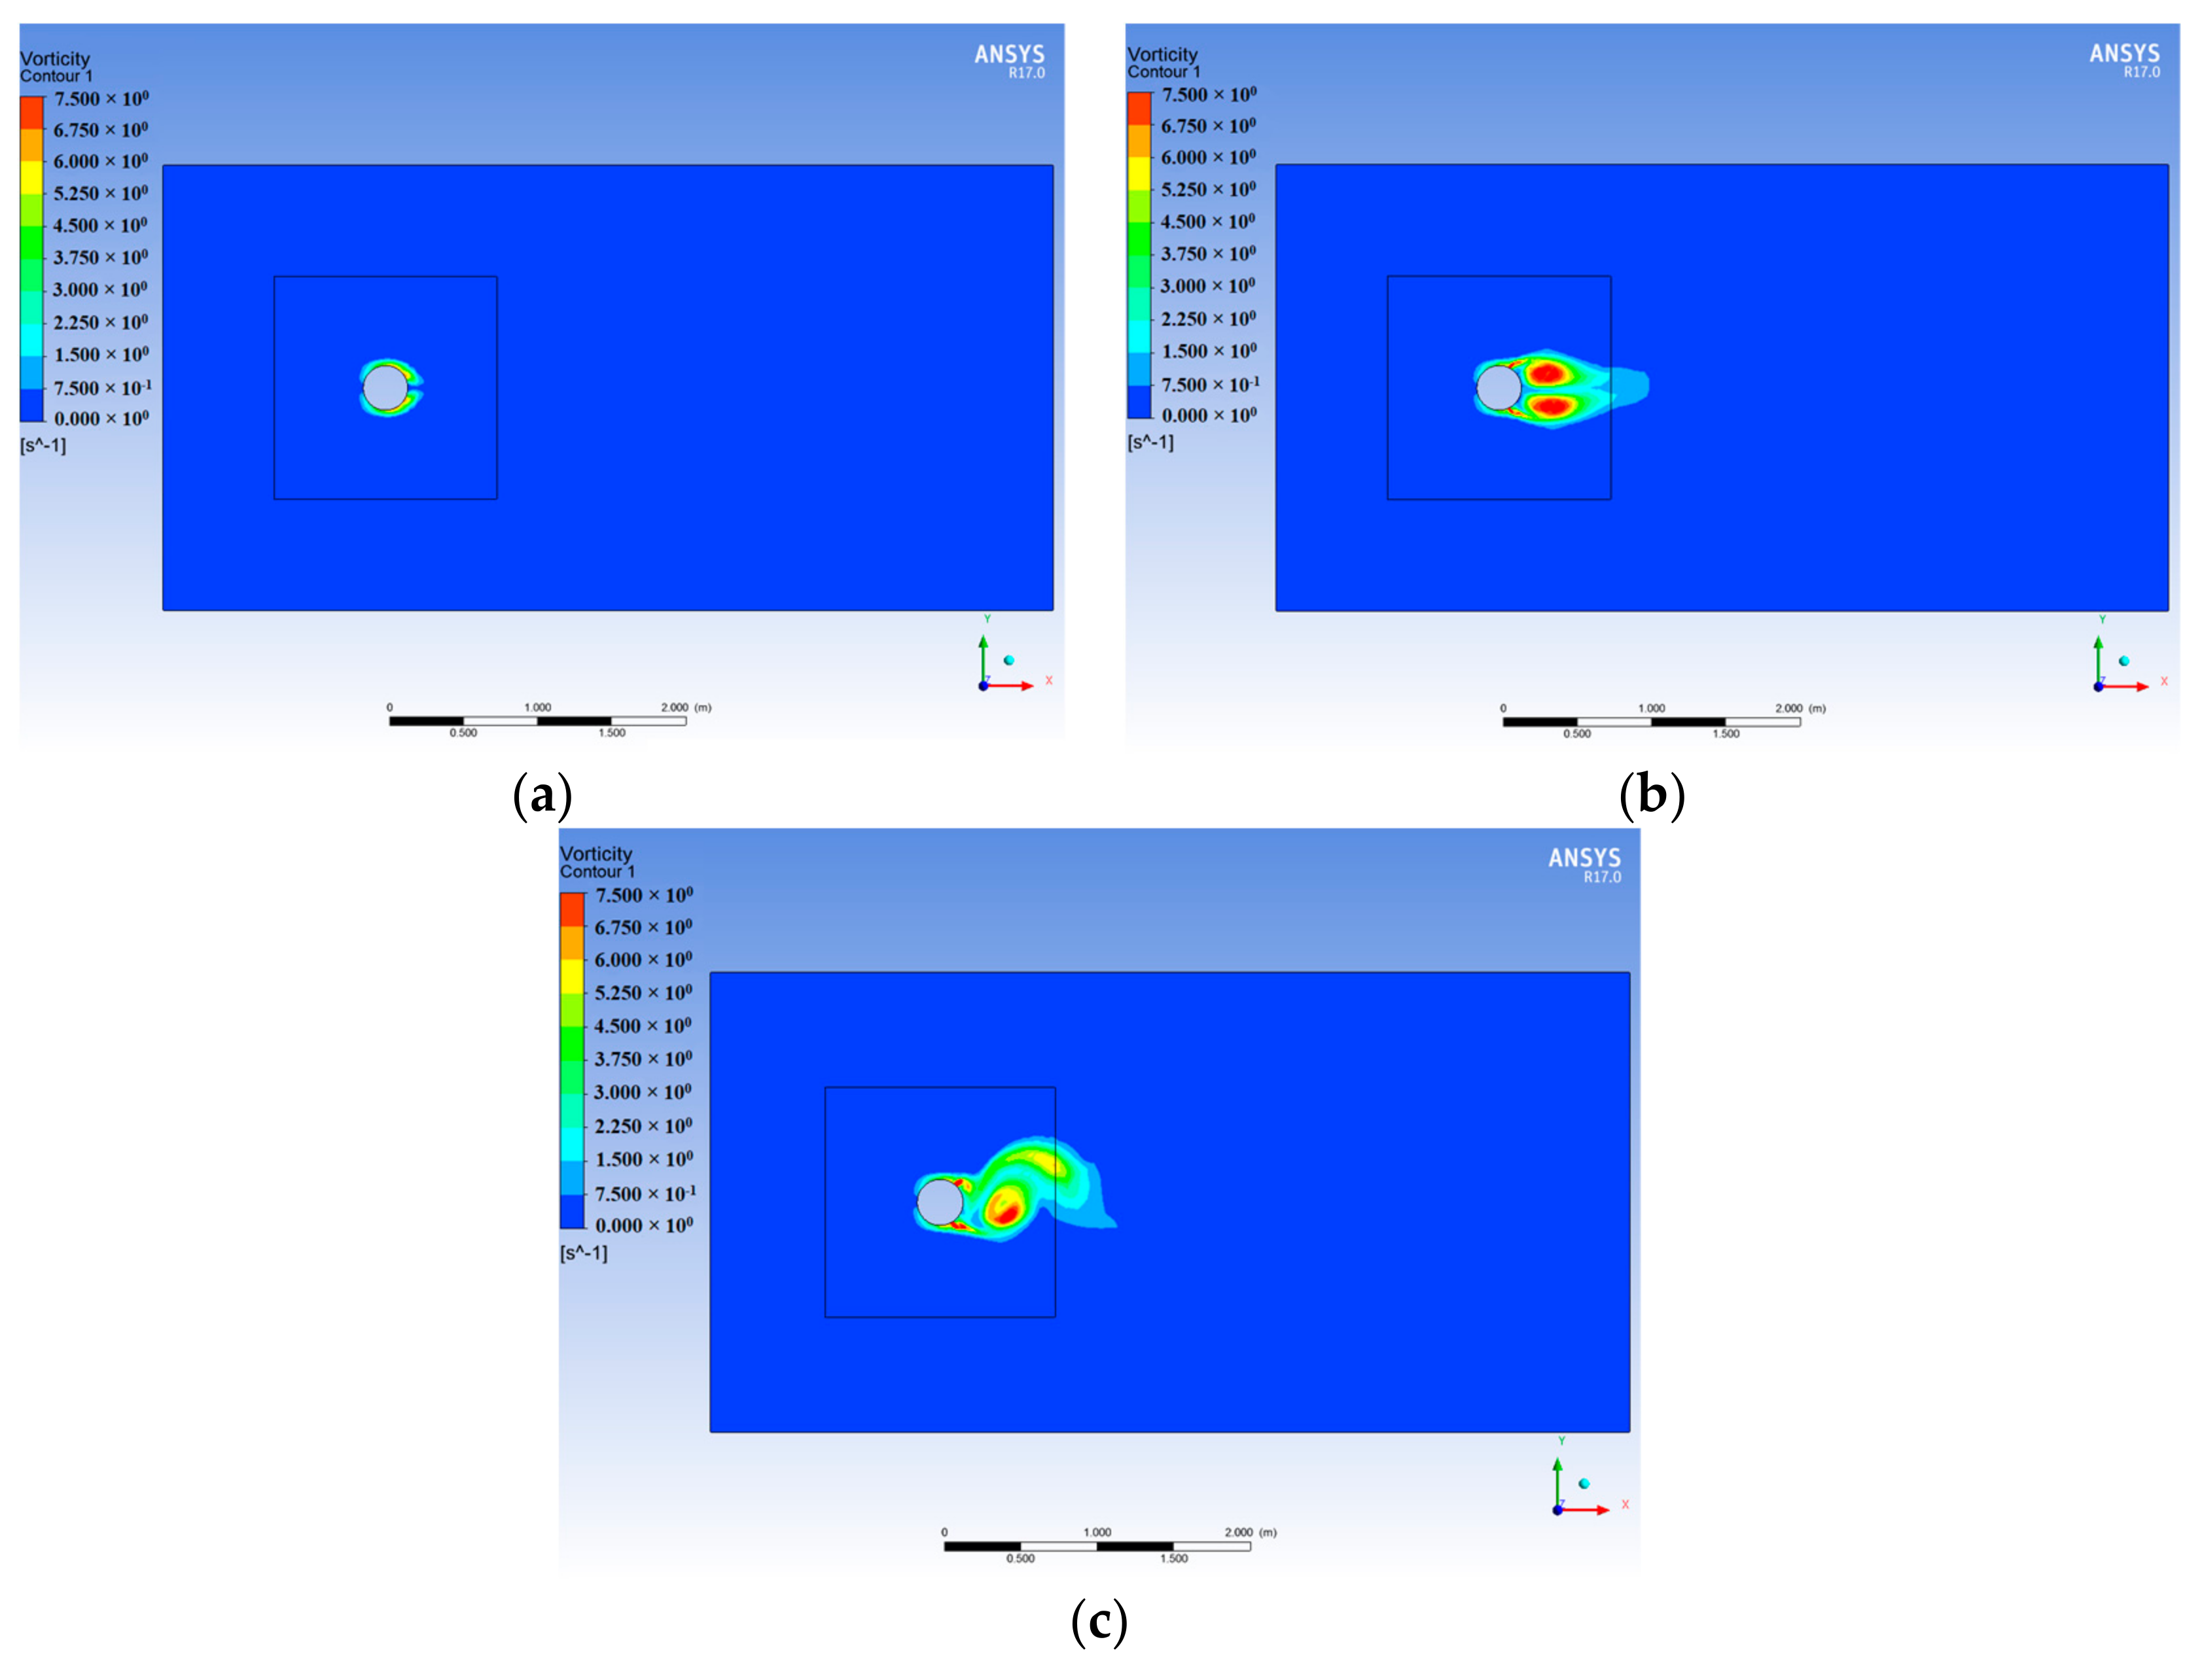
Figure 6a–c presents the vorticities for Risers 1, 2 and 3 with 2D models while Figure 6d–f illustrates the vorticities for Risers 1, 2 and 3 with 3D models. As can be seen in Figure 6, the vortex shedding modes for all three risers are 2S (two single vortices per cycle). However, the vorticities from the 2D model are more stable as in the ideal condition.
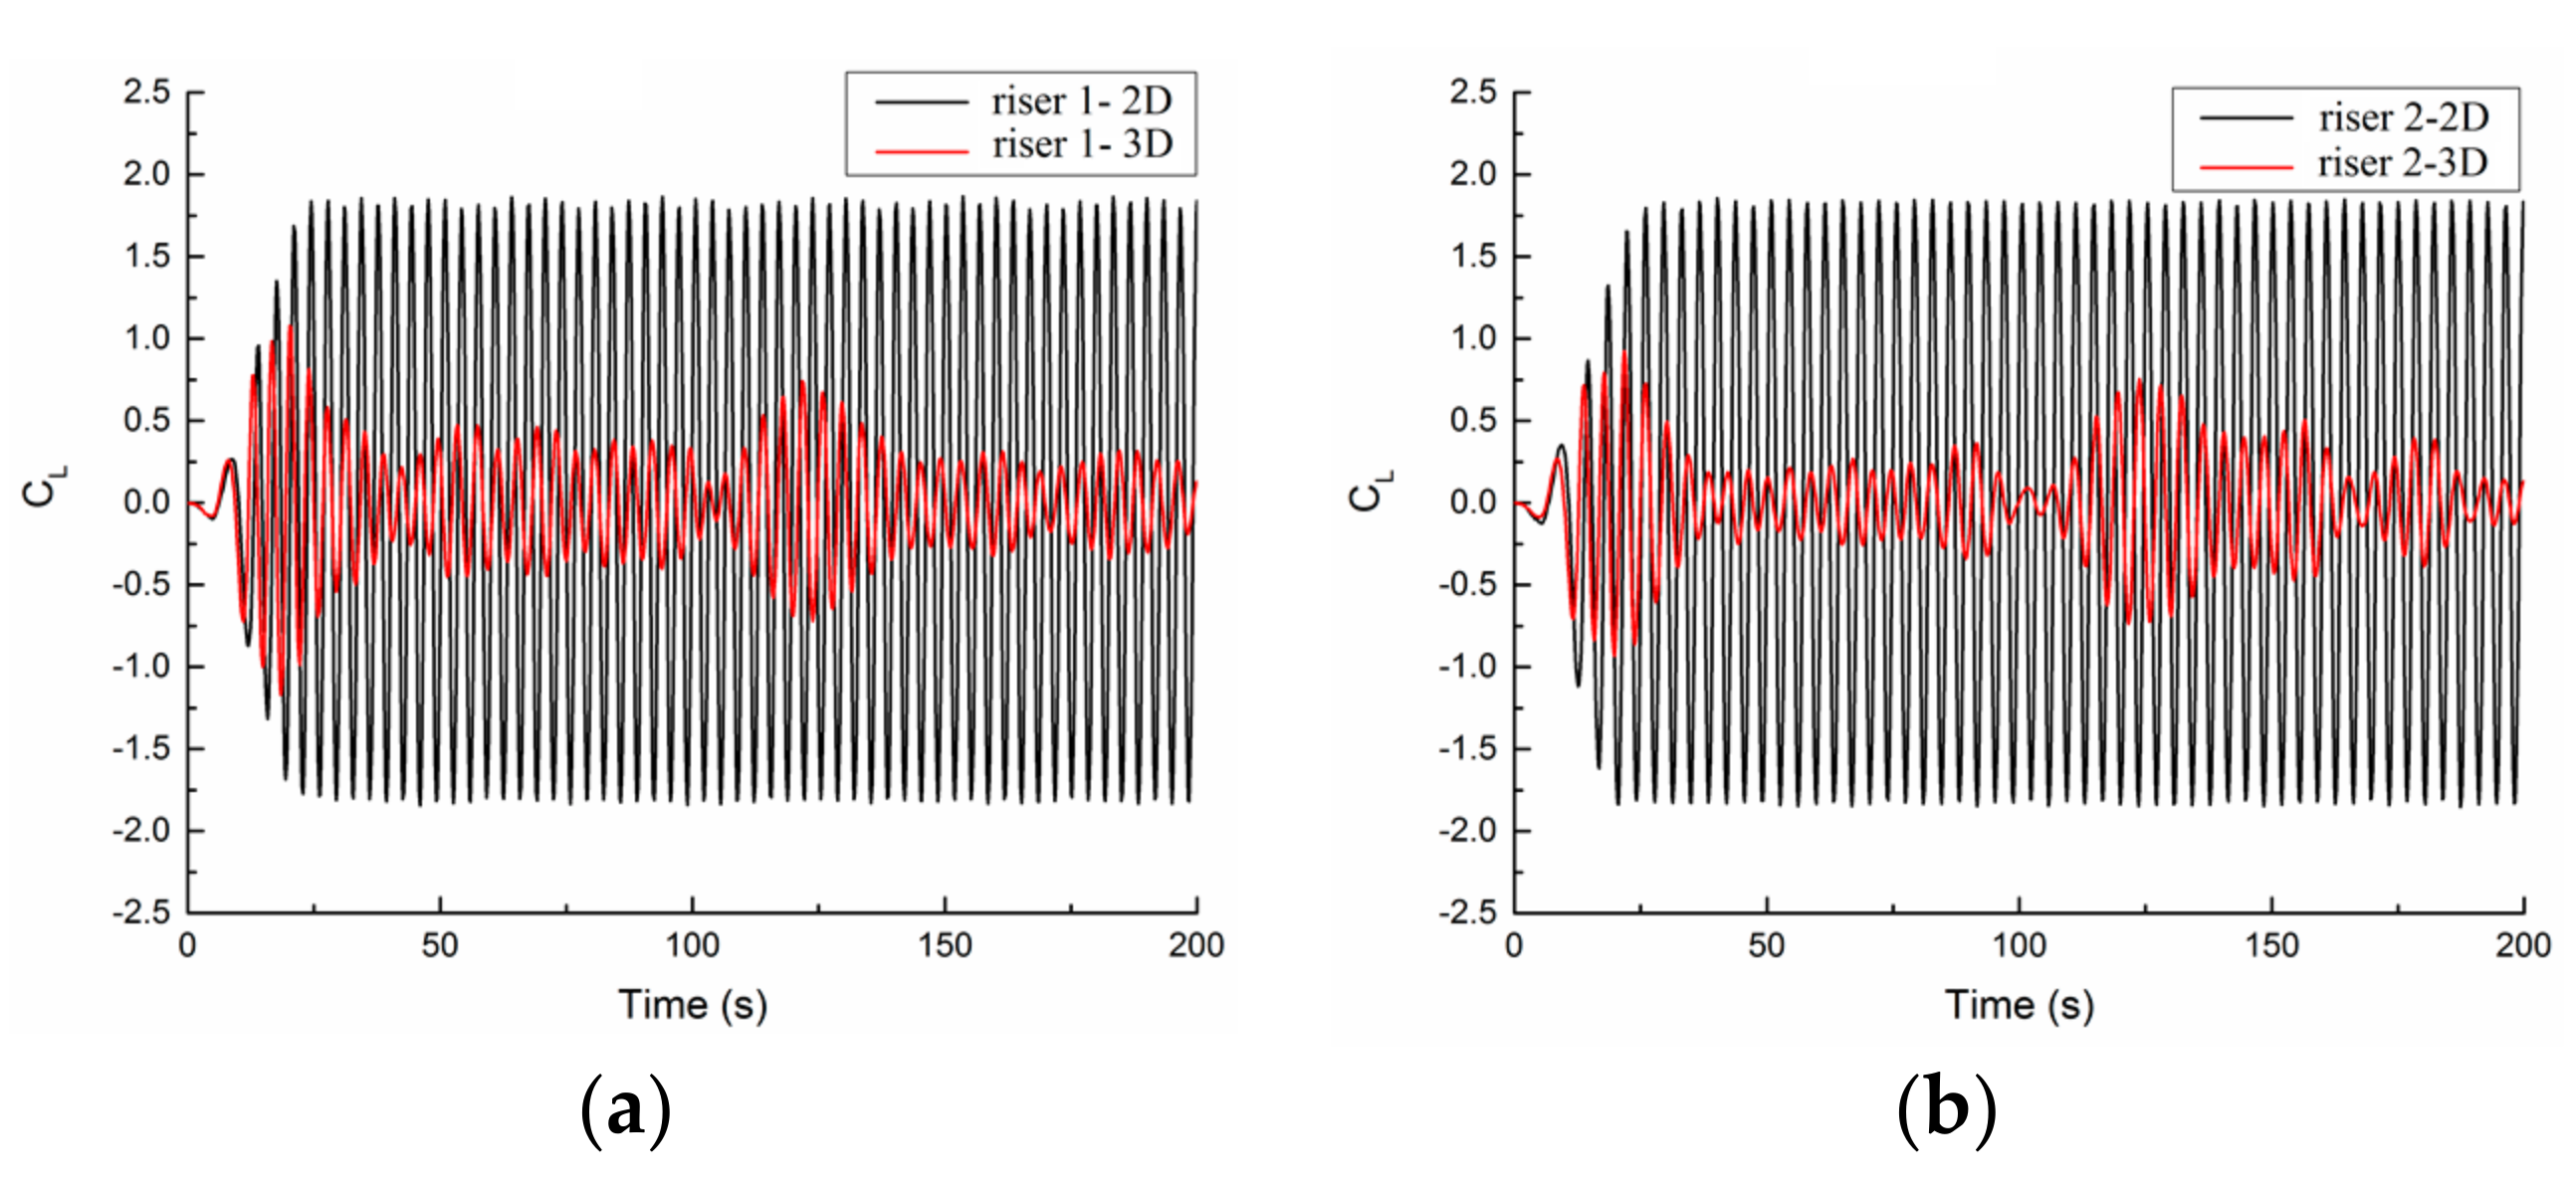
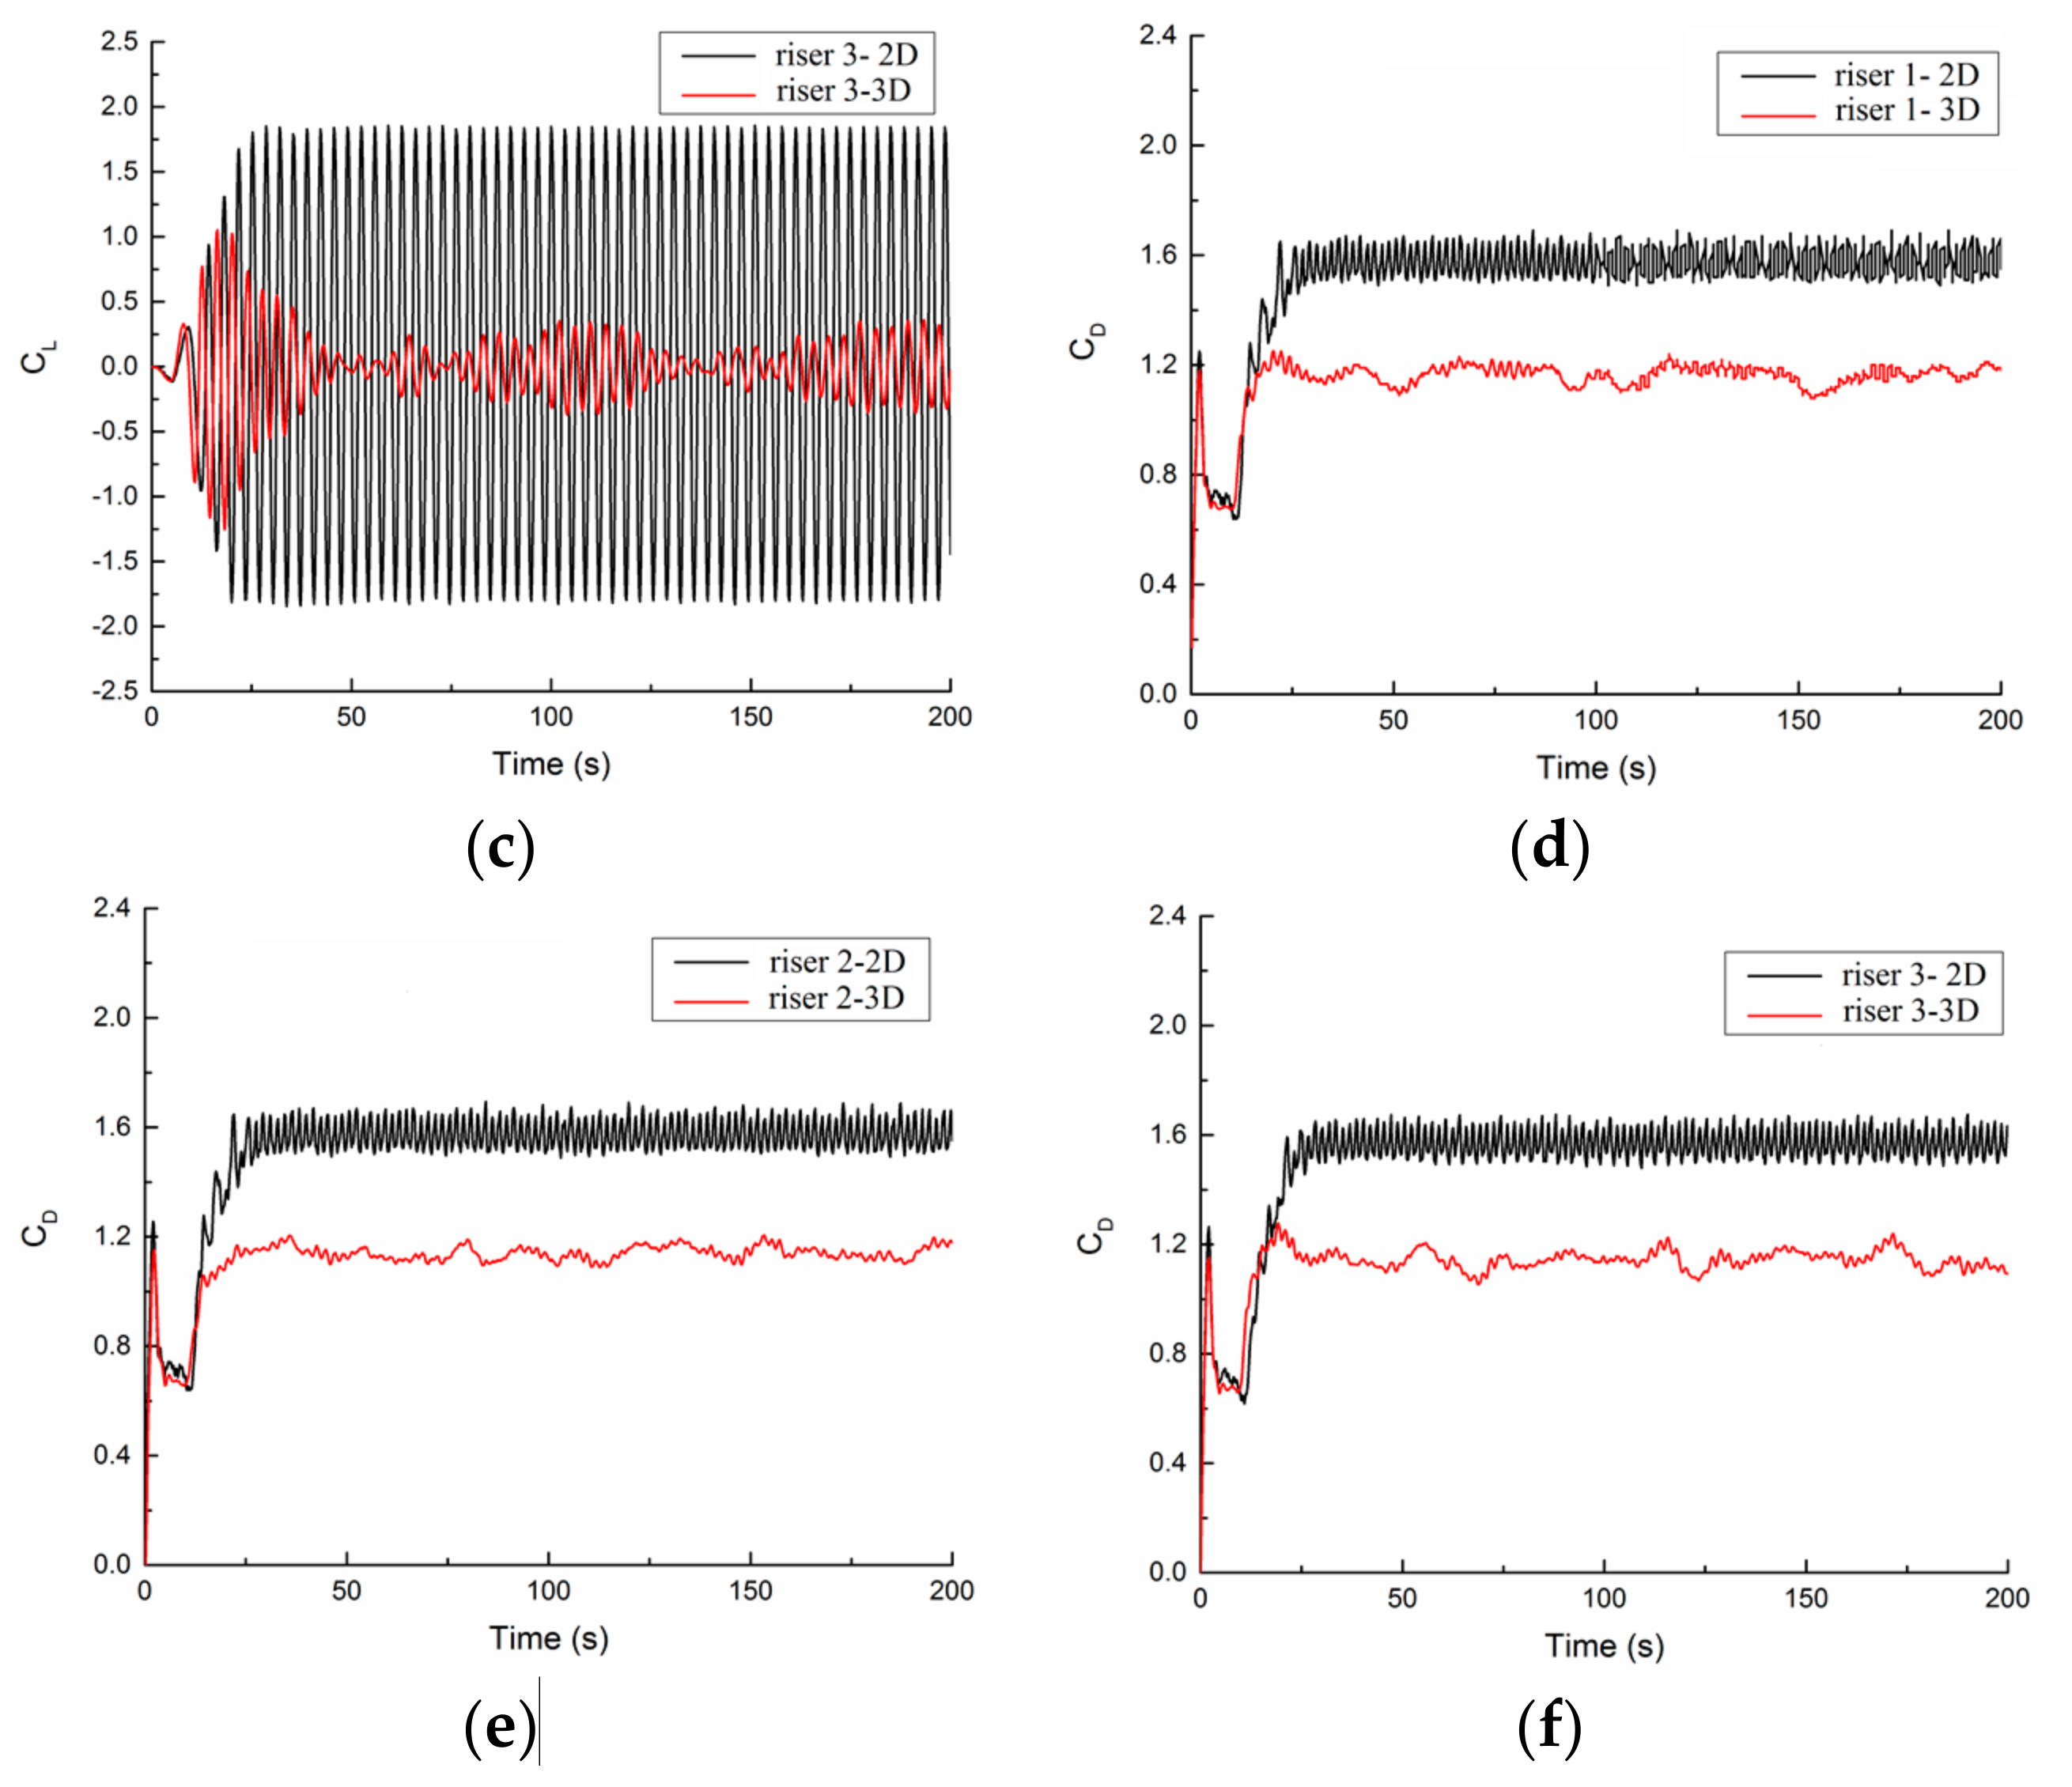
Figure 7a–c presents the CL for Risers 1, 2 and 3 with 2D and 3D models, while Figure 7d–f illustrates the CD for Risers 1, 2 and 3 with 2D and 3D models.
In Figure 7, the value and stability of CL and CD with 2D and 3D models are quite different, although the trend for CL and CD with 2D and 3D simulation are similar. The curves of CL and CD for all the risers with 2D model are more stable and the values are significantly larger than those with 3D models. It also can be seen that the “beat” phenomenon of CL occurs in the 3D simulation, i.e., CL increases and decreases periodically.
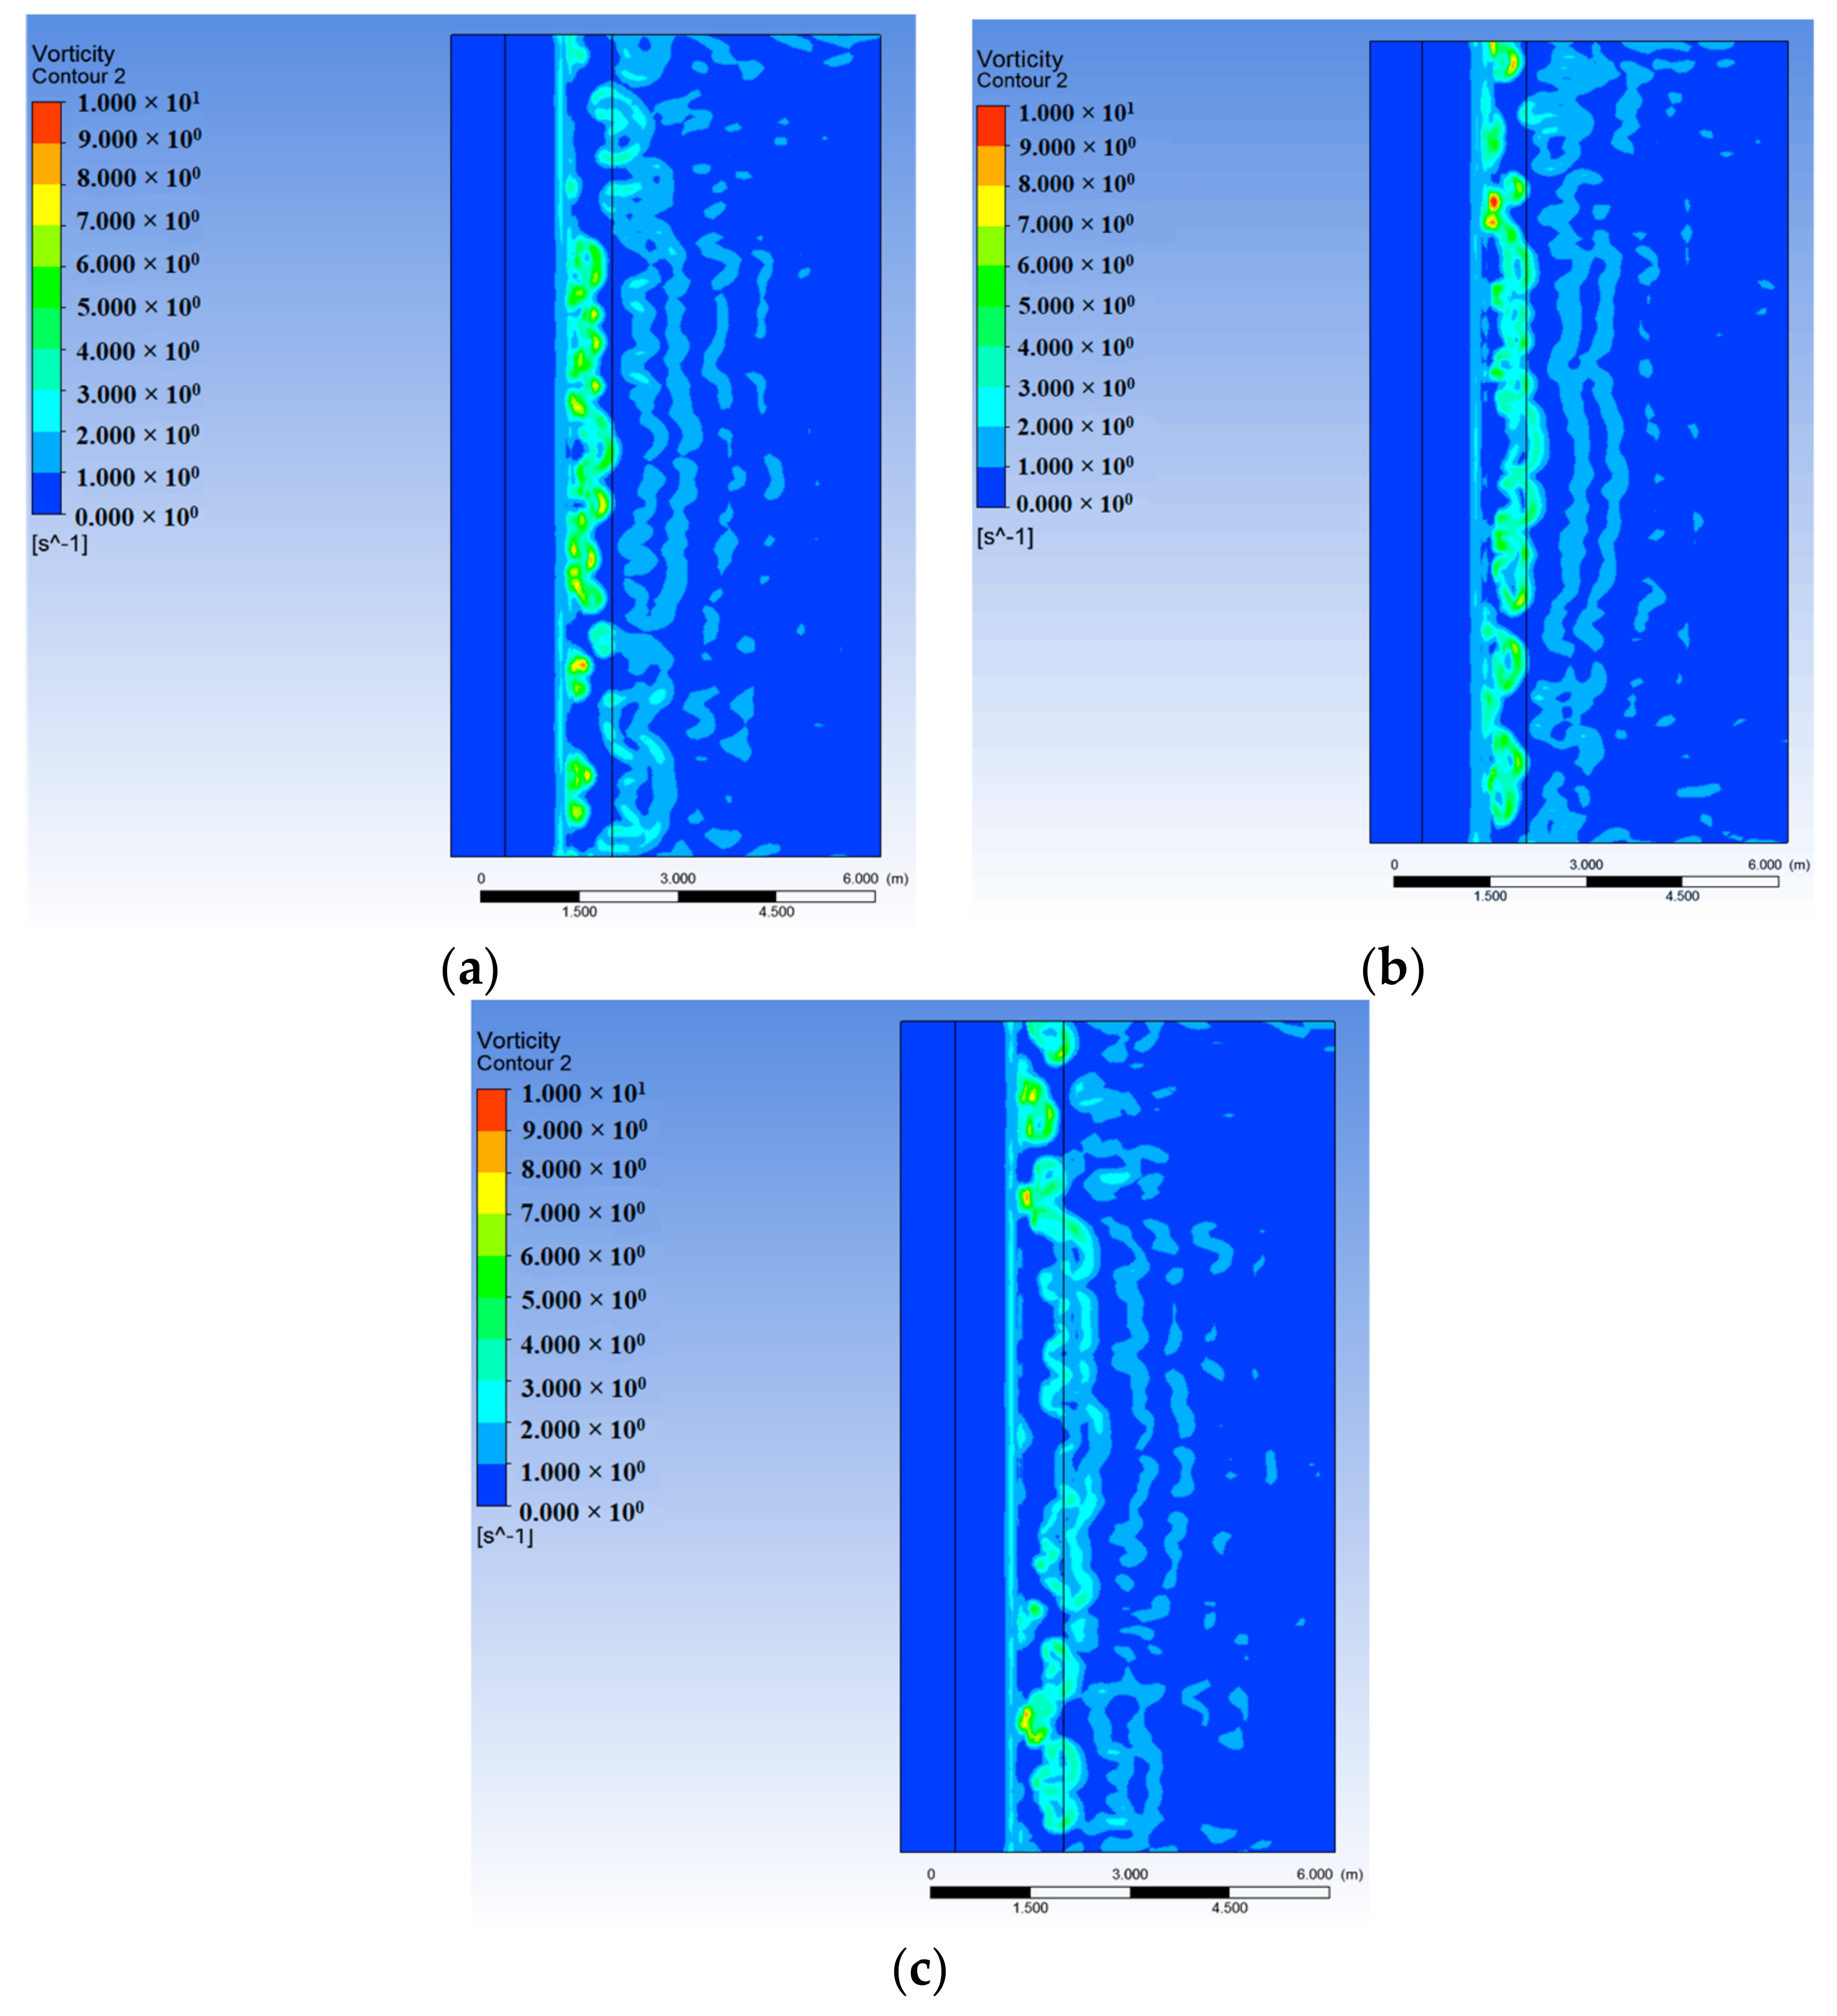
In the 2D simulation, the size in depth direction (Z-direction) is omitted; therefore, the effects of depth of the flow field on the VIV are not considered in 2D simulation. However, in any real flow, 3D effects are included and the 3D vorticity profiles of Risers 1, 2 and 3 are presented in Figure 8a–c, respectively. It can be seen in Figure 8 that the VIV of the risers have obvious 3D feature.
3.3. Effects of the Models with/without FSI
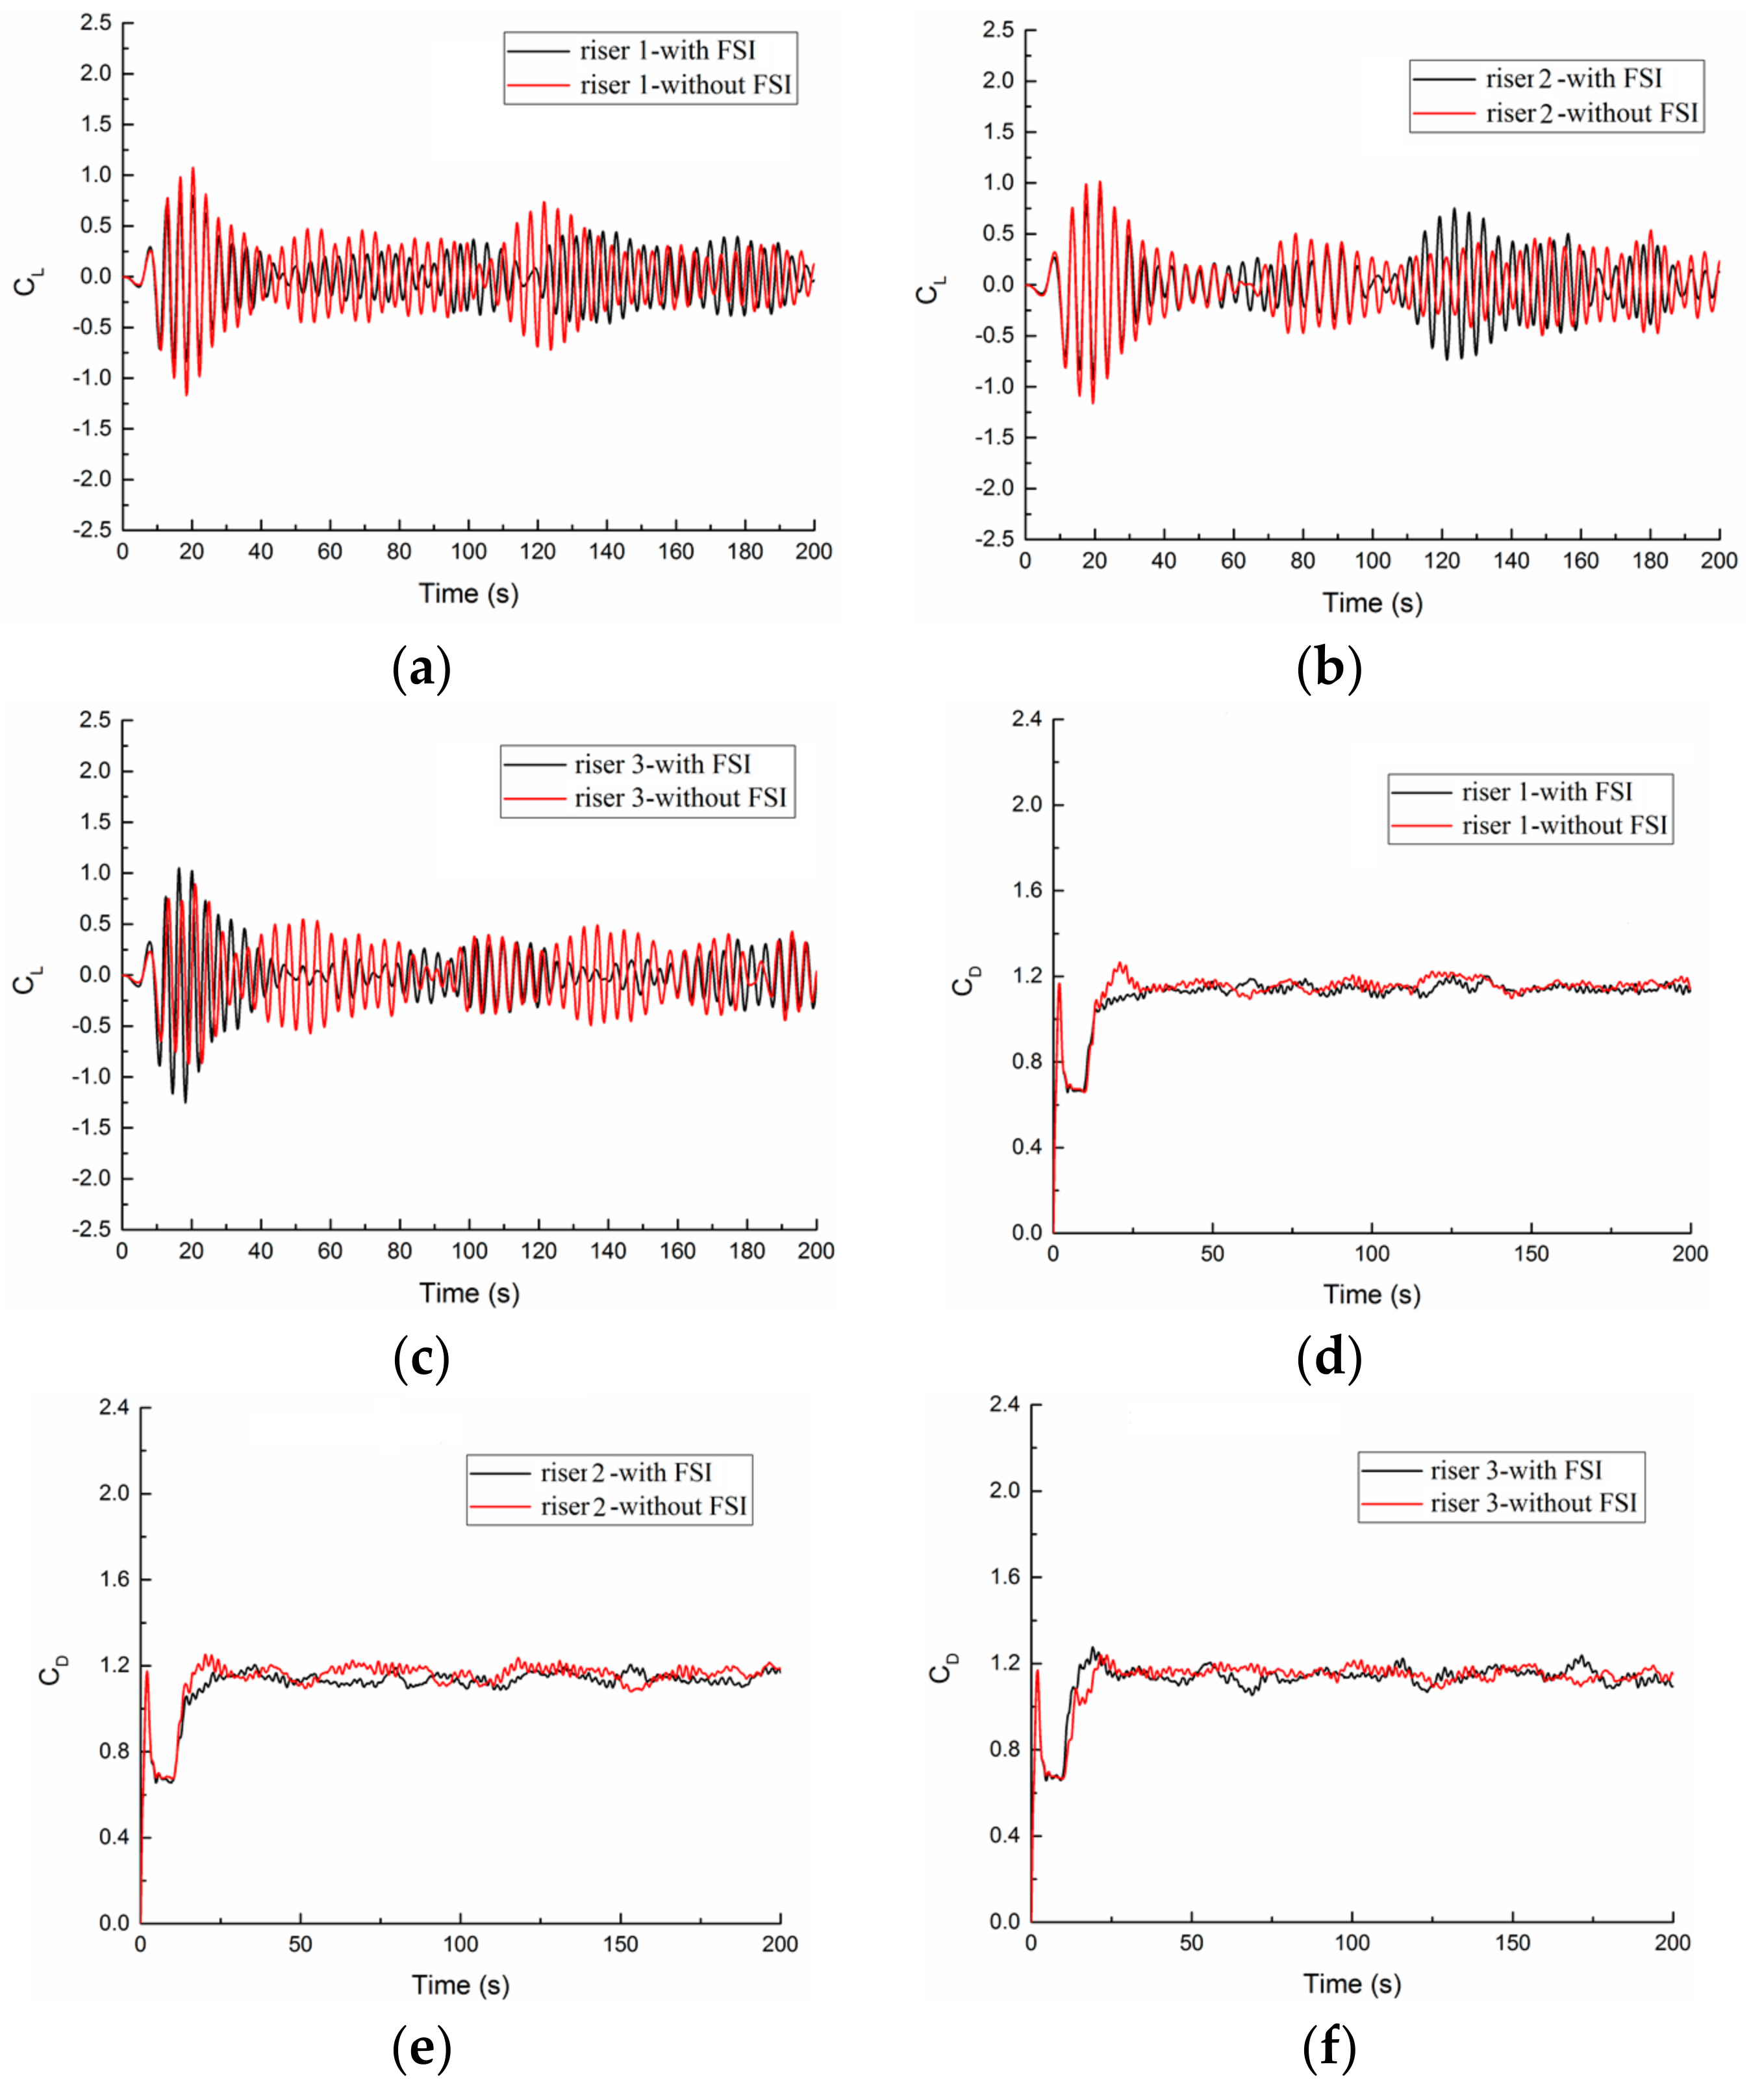
Figure 9a–c presents the CL for Risers 1, 2 and 3 with/without FSI while Figure 9d–f illustrates the CD for Risers 1, 2 and 3 with/without FSI.
As can be seen in Figure 9, FSI affects all the risers’ CD and CL. In general, the FSI has greater effect on CL than CD. From the graph of CD, the curve of CD ascends initially, then descends, after that rises again, and at last tends to be stable. Through the development of vortex shedding, it is found that the reason for the change of the CD curve is that, due to the impingement of the water flow, the riser is subjected to a large resistance in the forward direction of the X-axis for 0.4 s (Figure 10a). After 0.4 s, a pair of symmetrical vortices begins to form, and these symmetrical vortices develop steadily until 8 s (Figure 10b). Because of the existence of the vortices behind the riser, the riser is subjected to a negative force along the X-axis. Hence, the resistance of the riser along the X-axis is reduced and the CD curve decreases. After 8 s, the symmetric tail vortices begin to fall off gradually, and the CD begins to increase until 14 s (Figure 10c). When one of the symmetric vortices completely falls off, the CD returns to a relatively large value.
3.4. Results for 3D VIV with FSI Using Different Modeling Methods
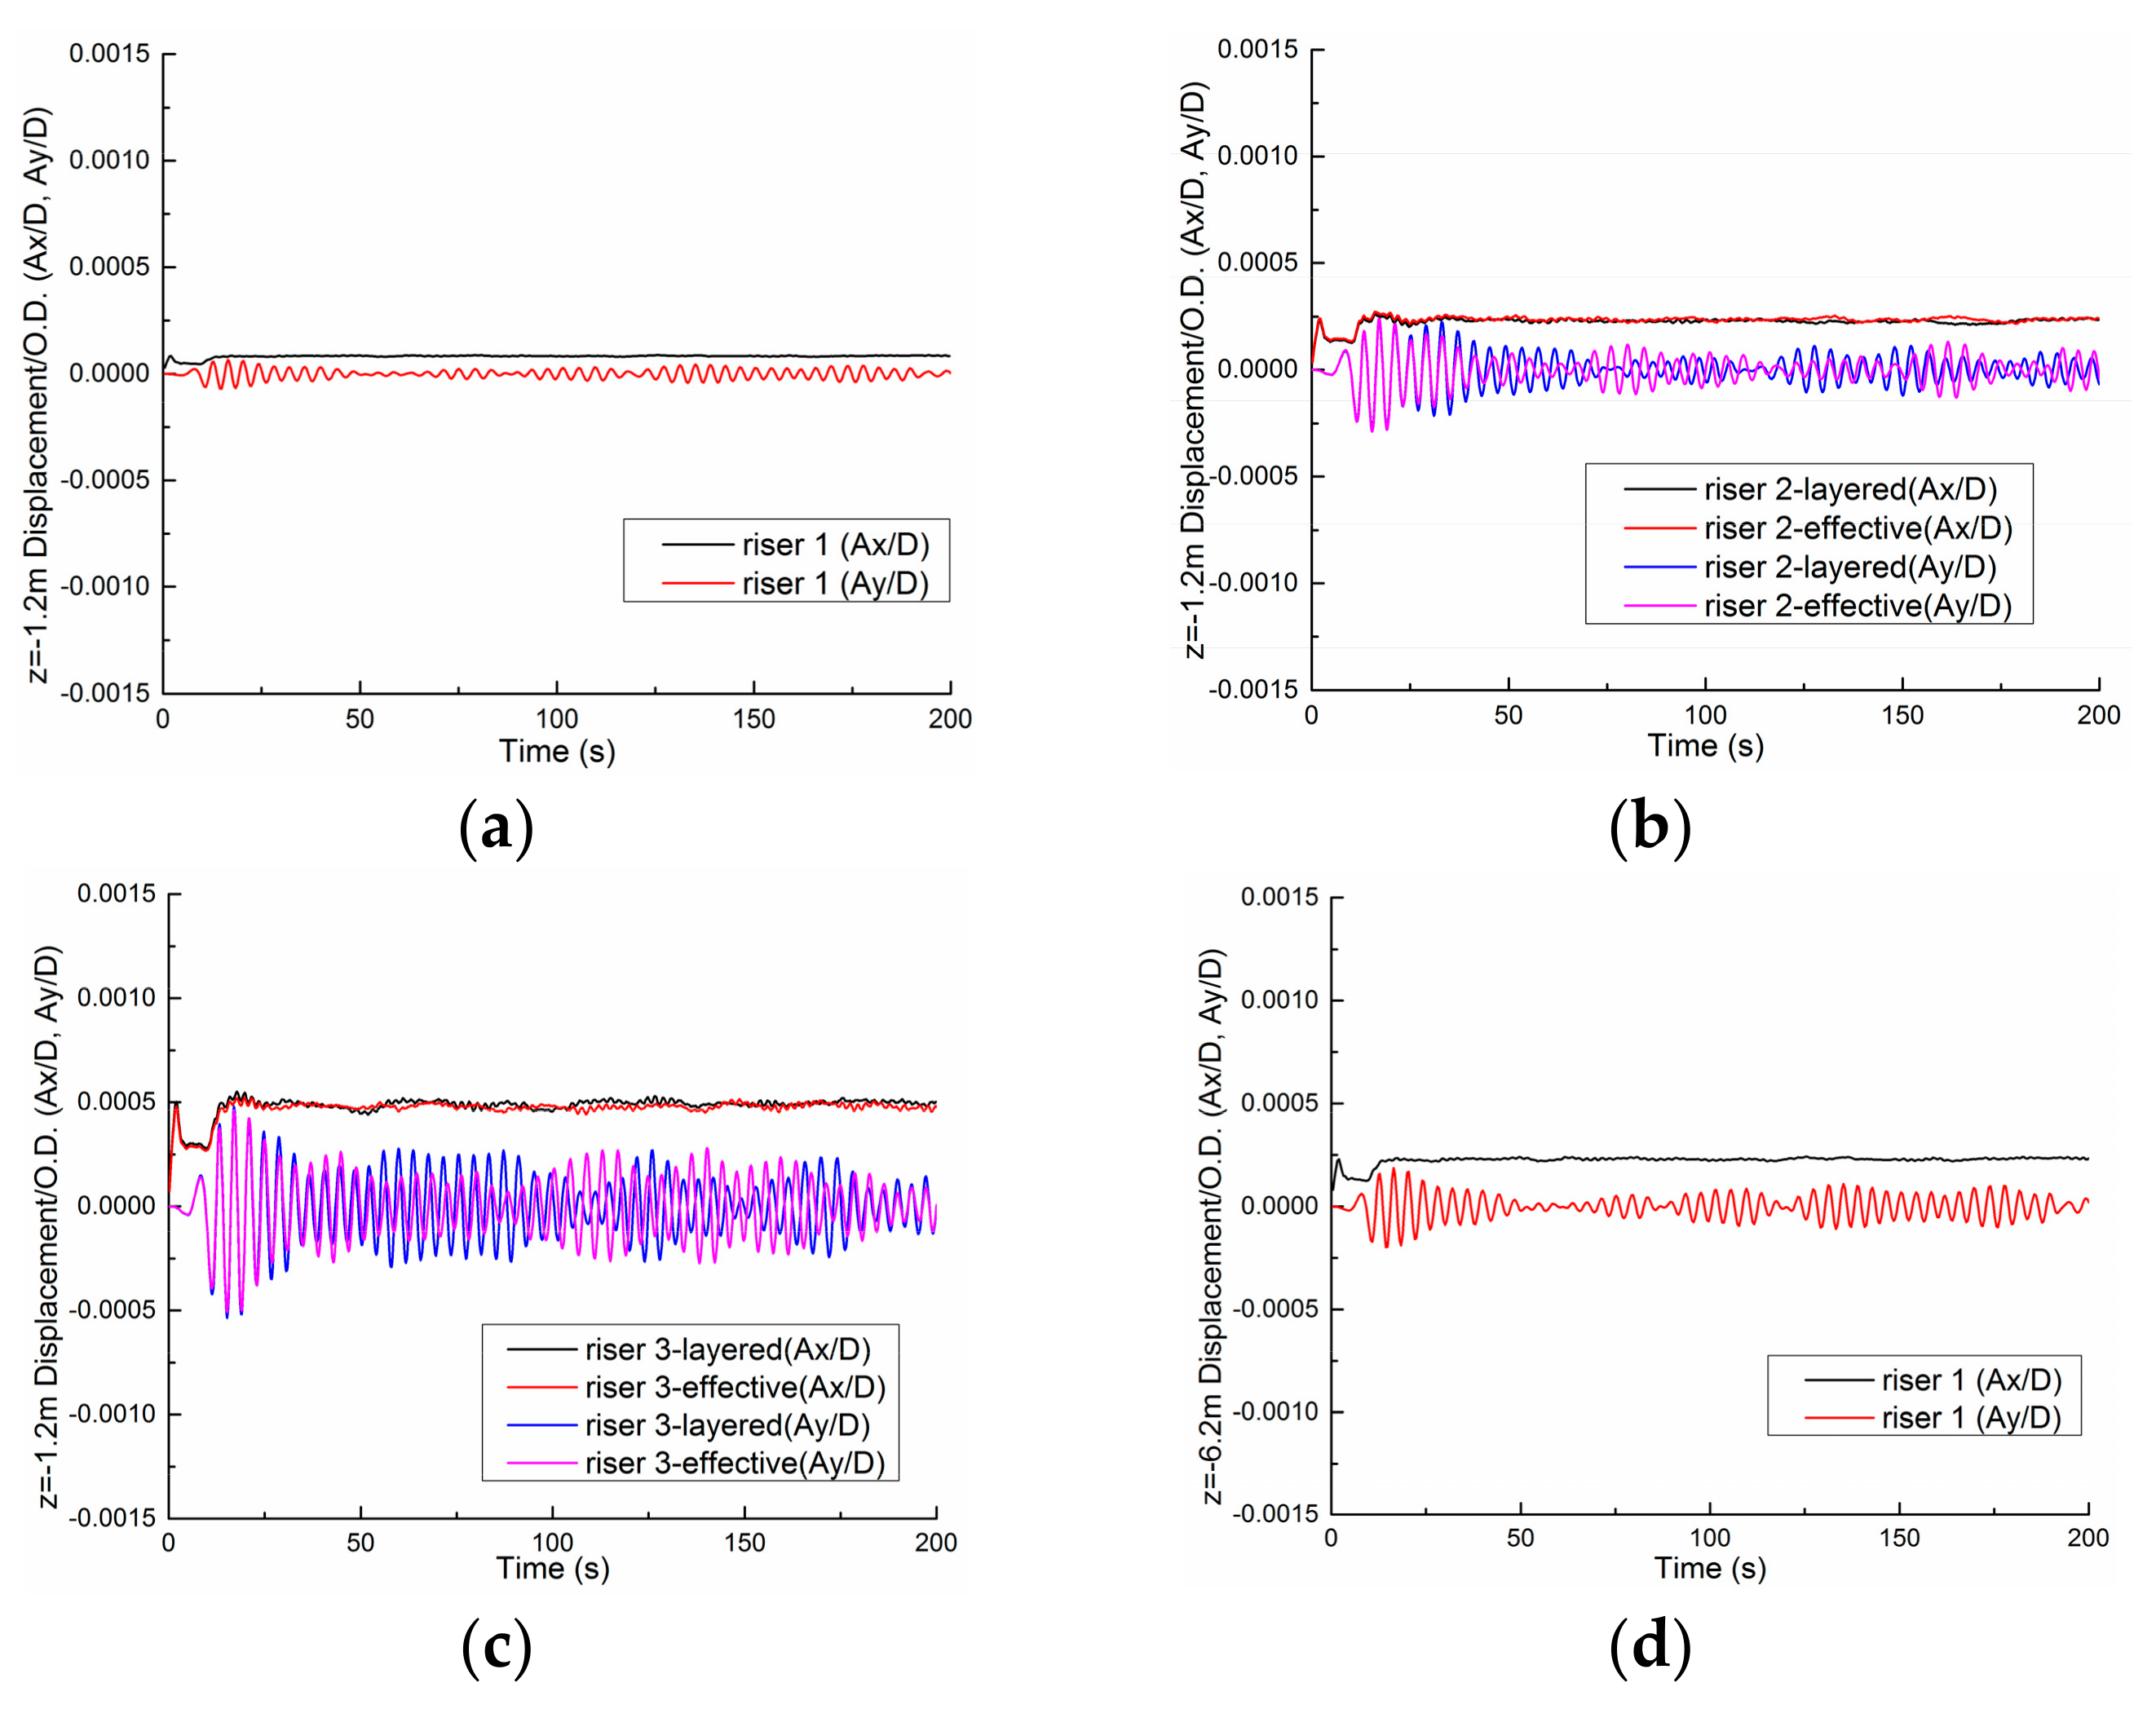
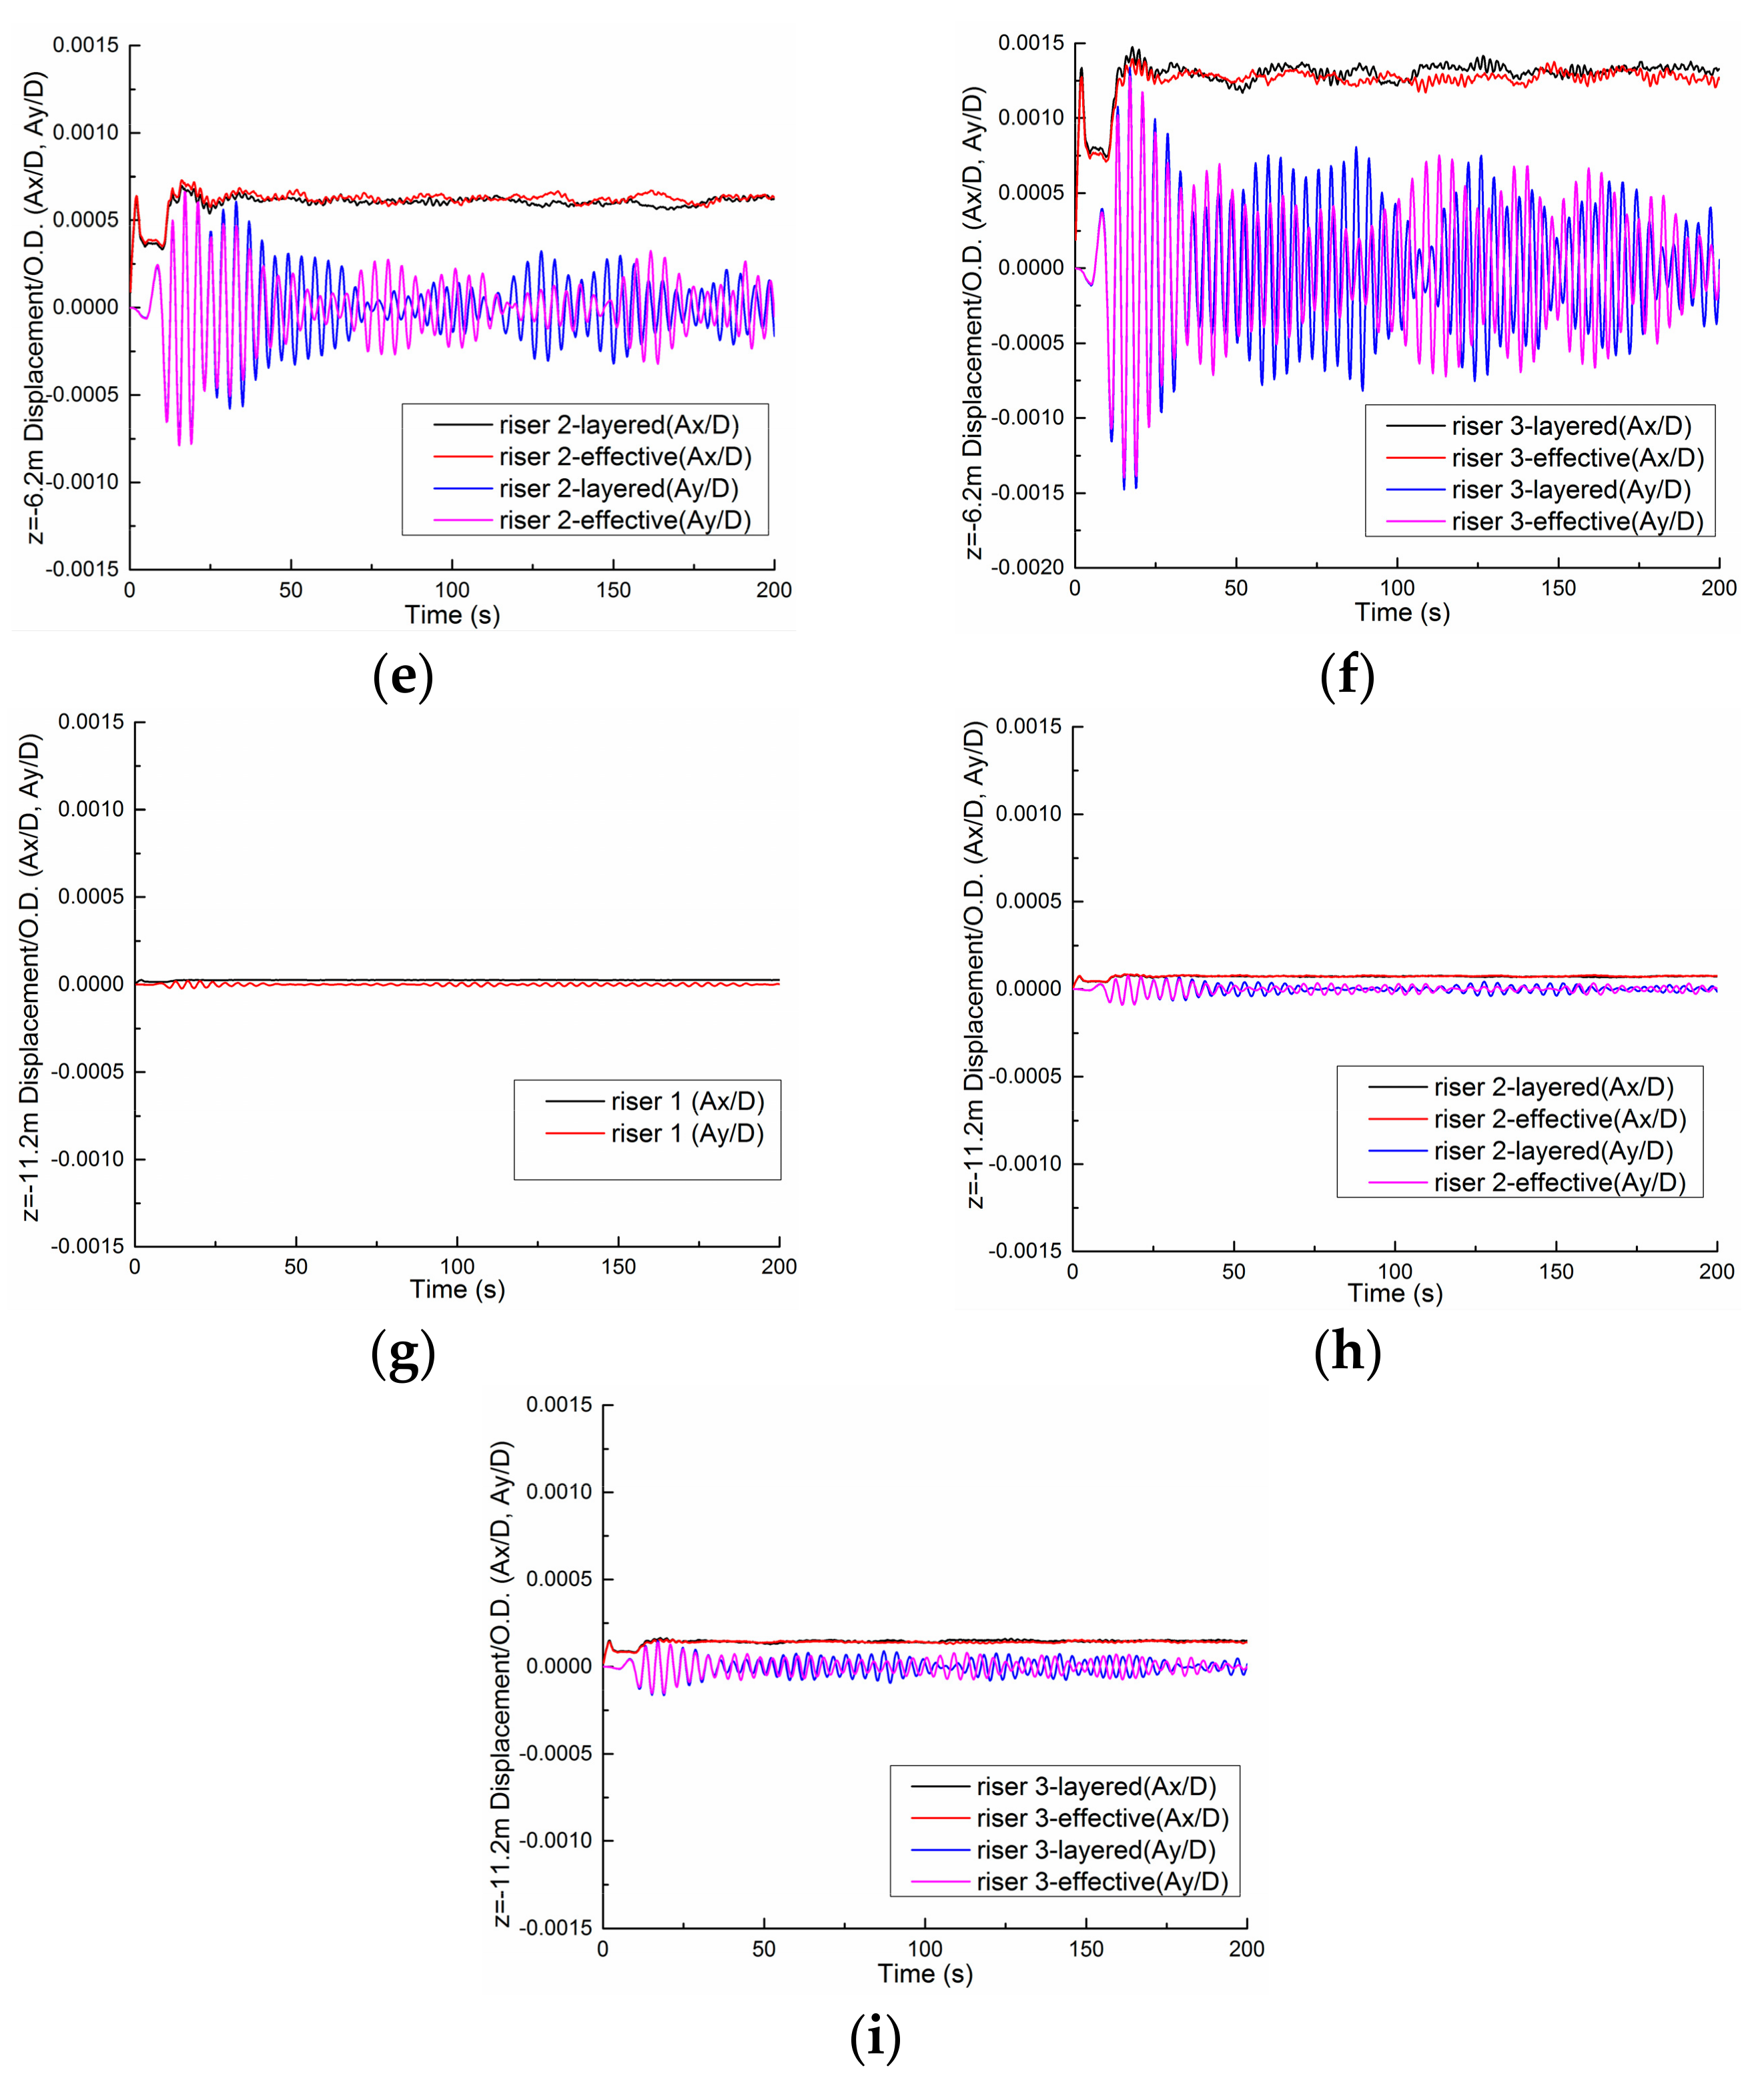
The 3D CFD simulation with FSI is adopted for the VIV of all the risers. For Riser 1 (steel riser), monolithic model is utilized and for Risers 2 and 3 (composite risers), two different modeling methods, i.e., effective modulus method (EMM) and layered-structure method (LSM) are employed. The displacement time history of all three types of risers are plotted in Figure 11 for three typical location, which are 1.2 m, 6.2 m and 11.2 m below the water surface. More specifically, Figure 11a–c shows the displacement time history at −1.2 m for Risers 1, 2 and 3, respectively; Figure 11d–f shows the displacement time history at −6.2 m for Risers 1, 2 and 3, respectively; and Figure 11g–i shows the displacement time history at −11.2 m for Risers 1, 2 and 3, respectively.
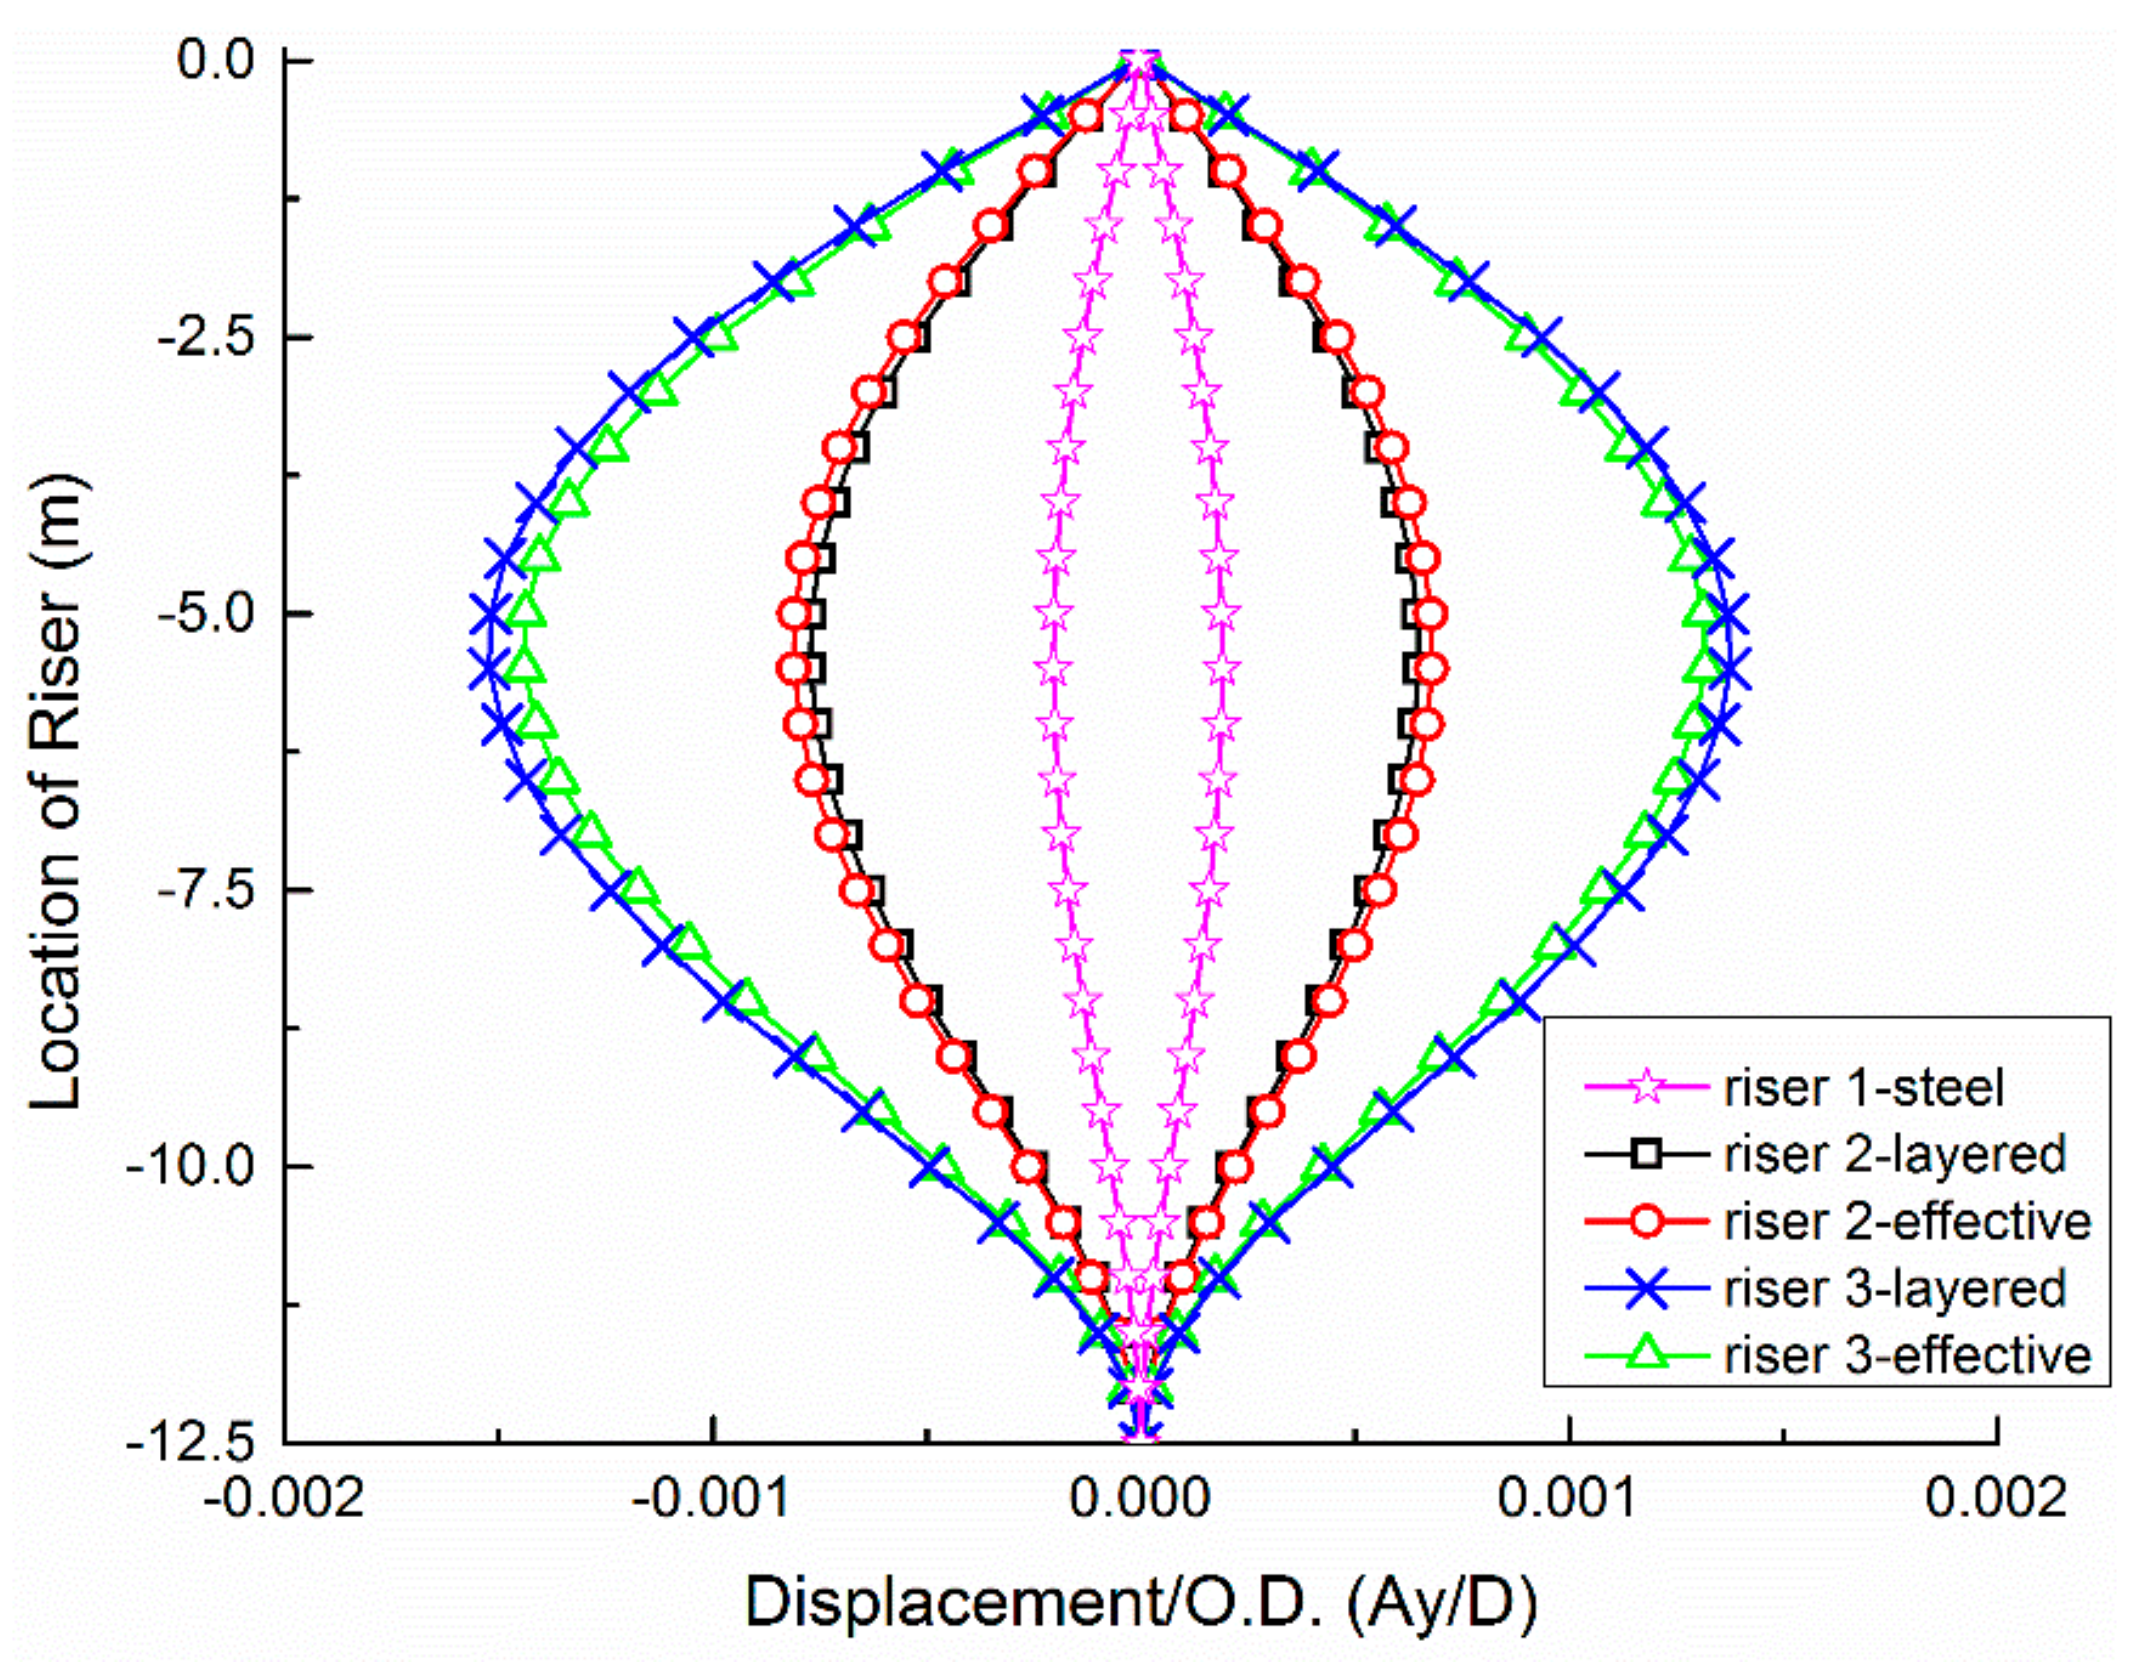
Figure 12 plots the maximum cross-flow displacement of the risers with different modeling methods.
- (1)
- For the same riser: (i) different modeling methods lead to similar results for riser’s displacement time history; (ii) the deformation in the middle part of the riser is larger than that in both ends, and the deformation close to the fixed end is the minimum; (iii) the deformation in the flow-direction is relatively stable at a specific value while the deformation in the cross-flow direction increases and decreases periodically; and (iv) the vibration in cross-flow direction is more obvious than that in flow direction.
- (2)
- For the different risers, Riser 1’s displacement is less than Riser 2’s displacement, which is less than Riser 3’s displacement, due to their different bending modulus and tension forces.
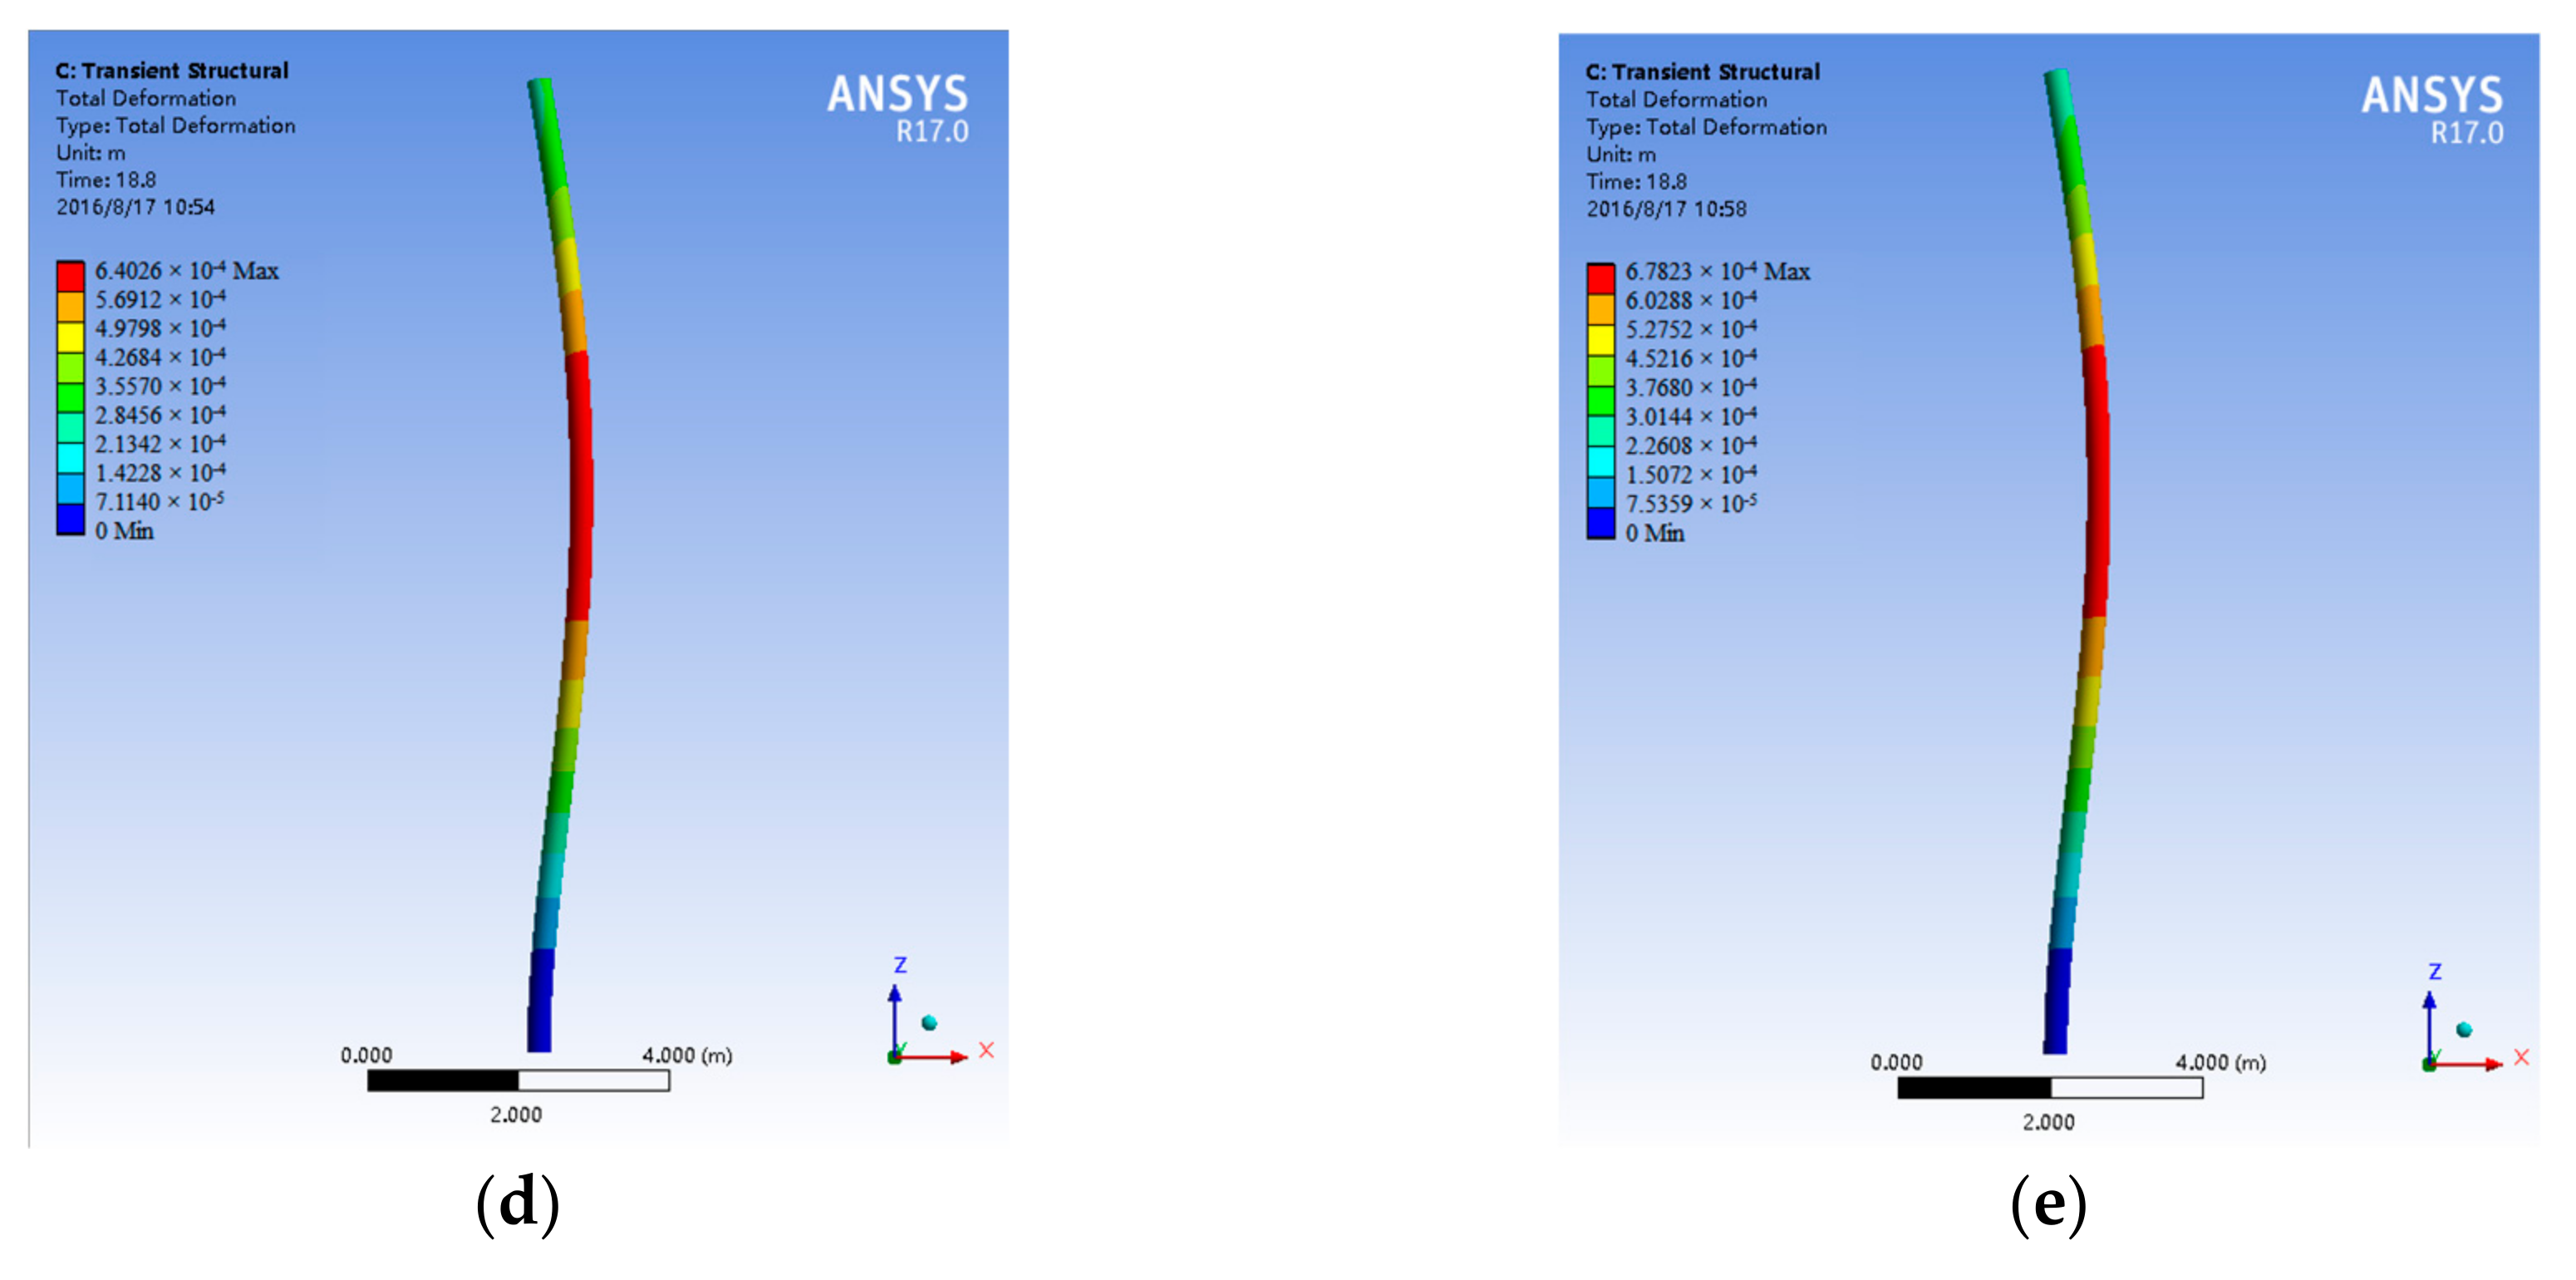
The time history of displacement for all the risers in flow direction is quite different from that in cross-flow direction, that is, the flow-direction displacement will maintain at a relatively stable value and vibrate slightly after the initial growth. Figure 13 illustrate the maximum displacement of the risers in flow-direction for all the risers with different modeling methods. Figure 13a shows the maximum flow-direction displacement for Riser 1; Figure 13b,c presents the maximum flow-direction displacement for Riser 2 with EMM and LSM, respectively; and Figure 13d,e illustrates the maximum flow-direction displacement for Riser 3 with EMM and LSM, respectively.
The flow-direction displacements are various for different risers: Riser 1’s displacement < Riser 2’s displacement < Riser 3’s displacement. For the same riser, EMM and LSM lead to the similar flow-direction displacement.
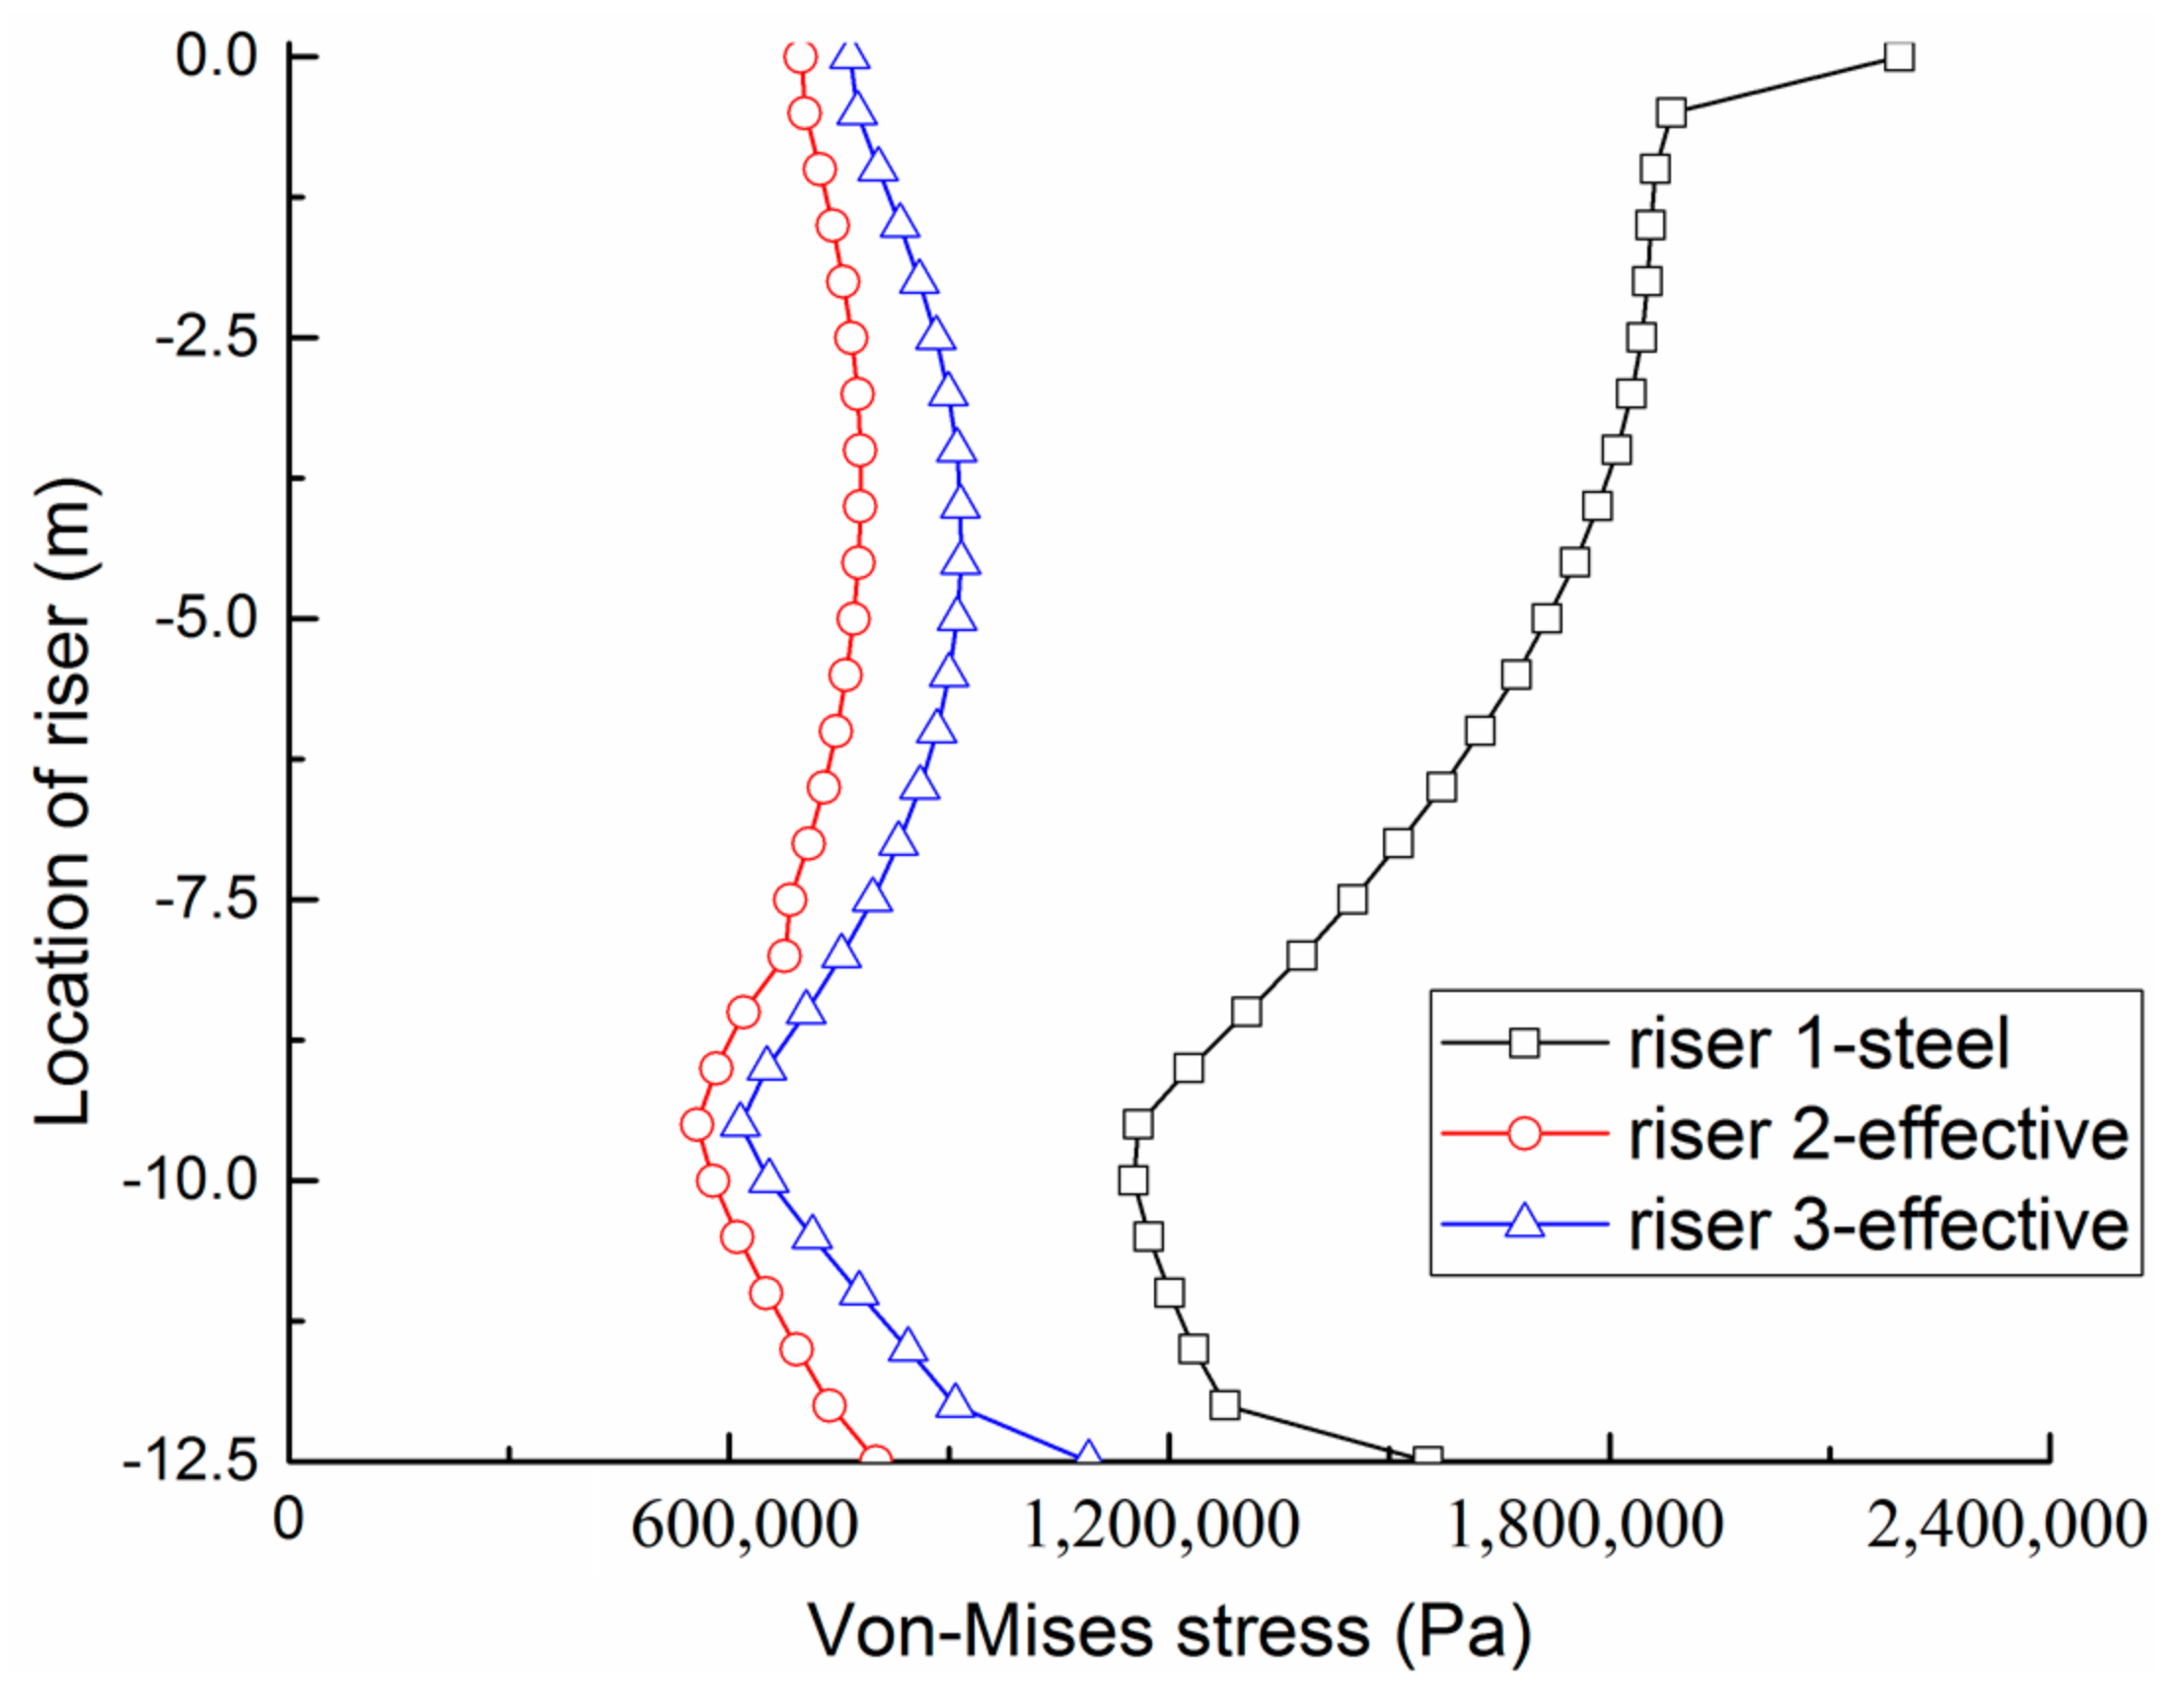
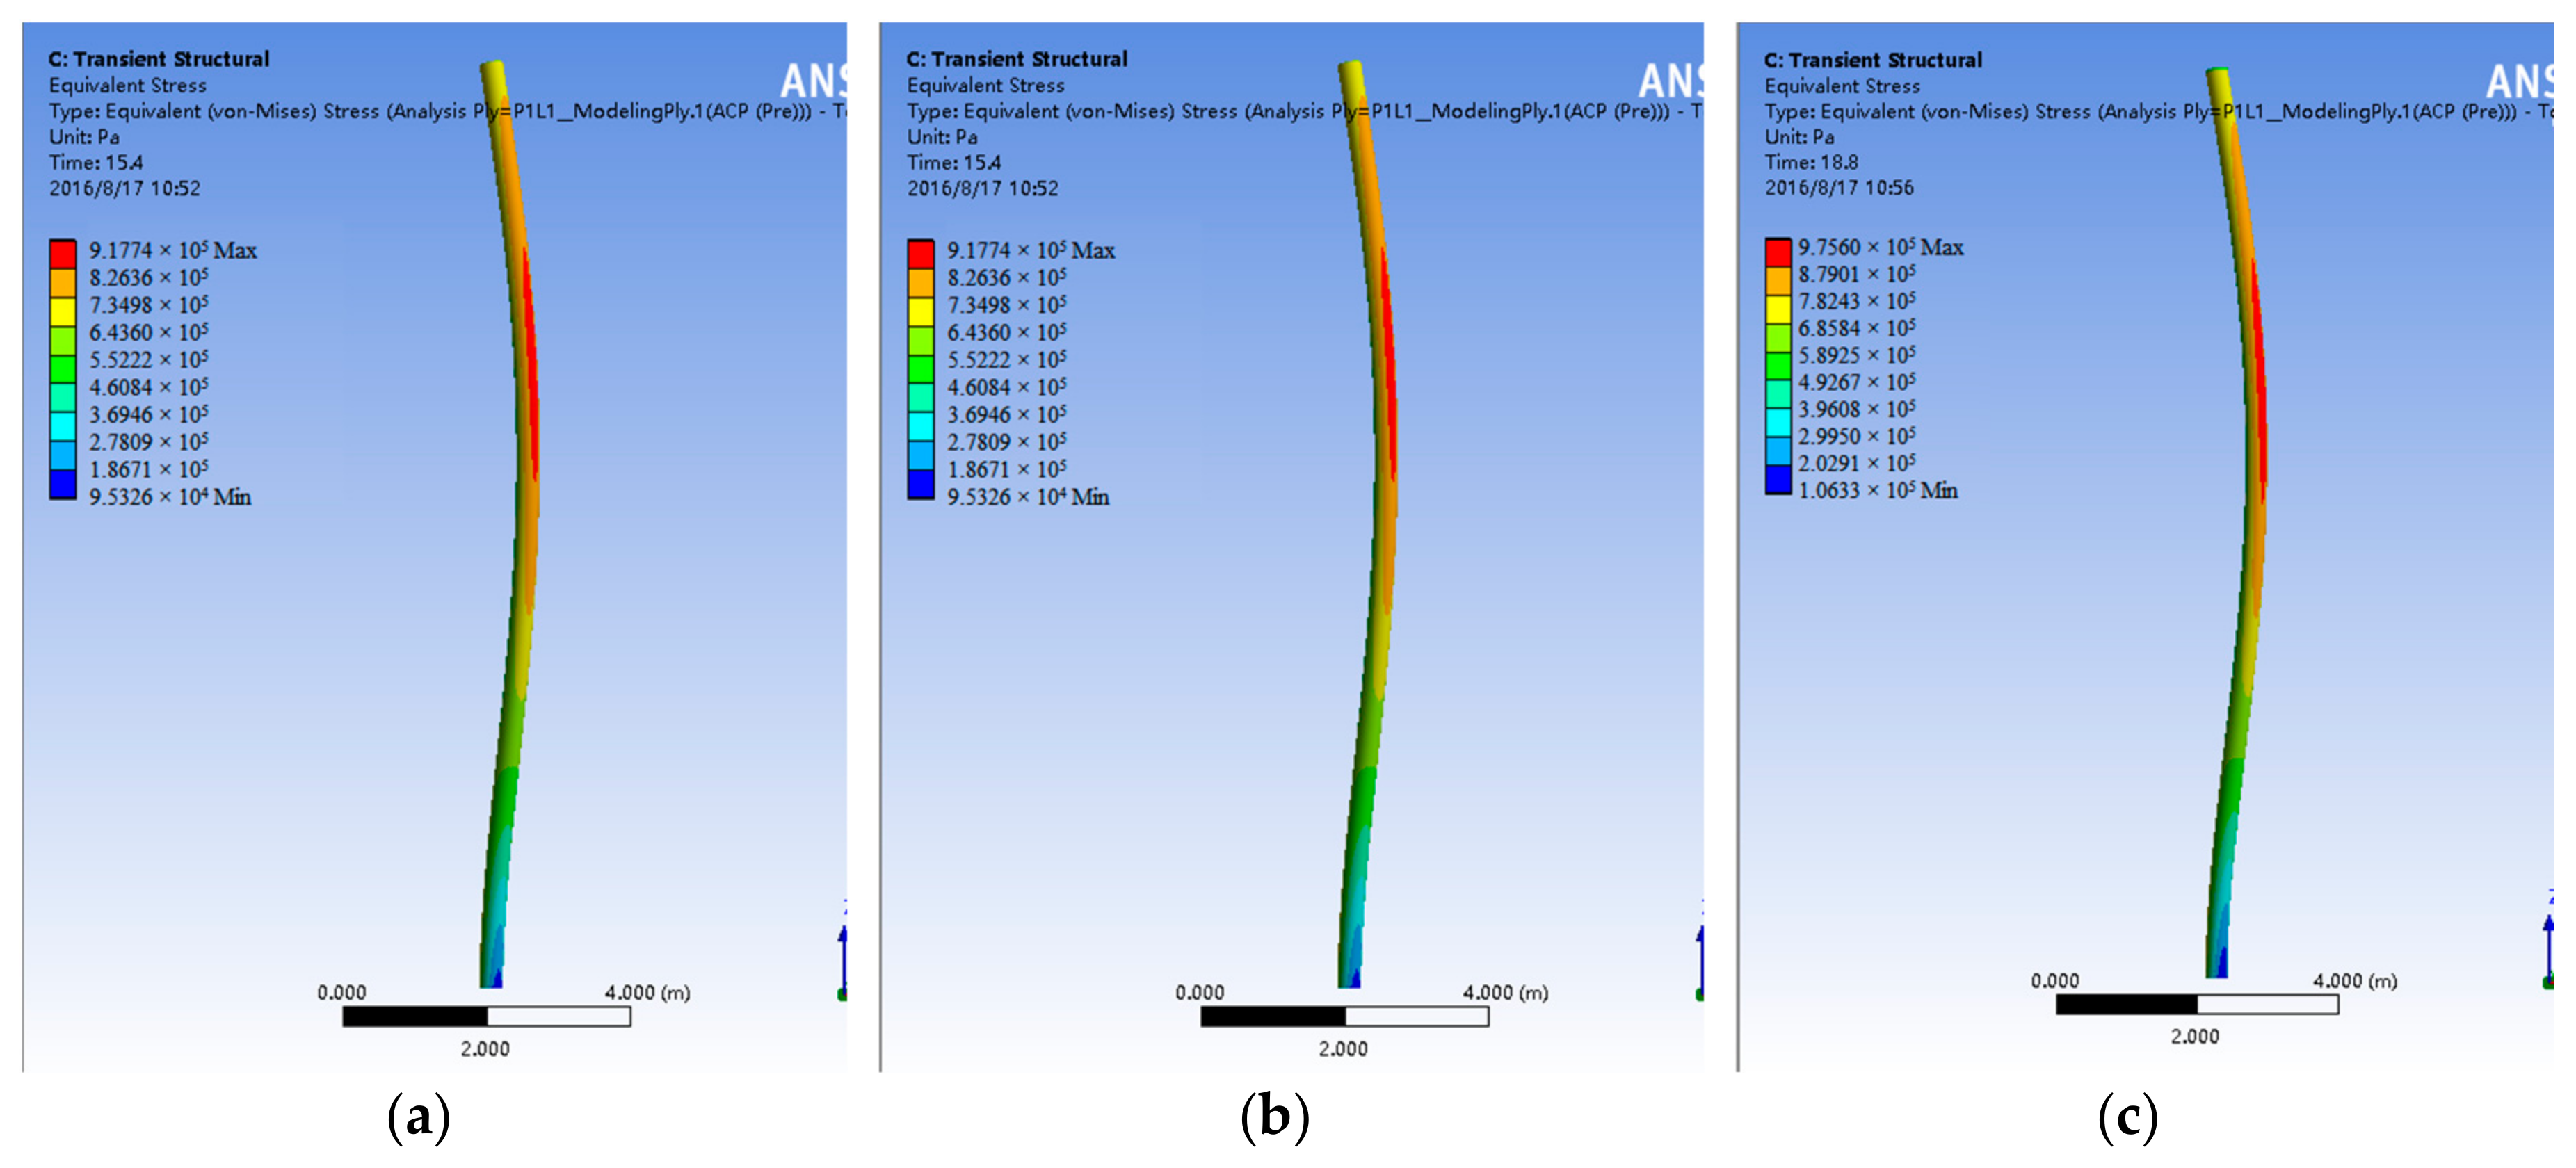
Figure 14 and Figure 15 show the maximum von Mises stress and the stress distribution diagram for the Risers 1, 2 (EMM) and 3 (EMM).
In Figure 14 and Figure 15, it is obvious that the maximum von Mises stress follows: Riser 1 > Riser 3 > Riser 2. This is not totally dependent on the risers’ modulus. Meanwhile, it can be seen that the maximum von Mises stress occurs at the top end of the steel riser (Riser 1) due to large top tension force required to resist the extreme weight of the steel riser; on the contrary, the maximum von Mises stress of the composite risers (Risers 2 and 3) take place in the middle/at the fixed end of the risers due to the large bending moments.
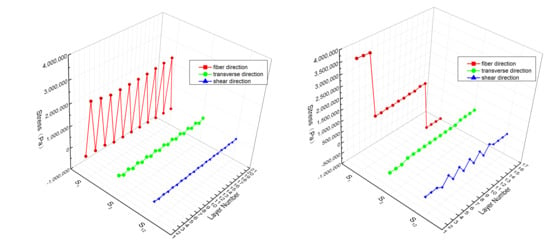
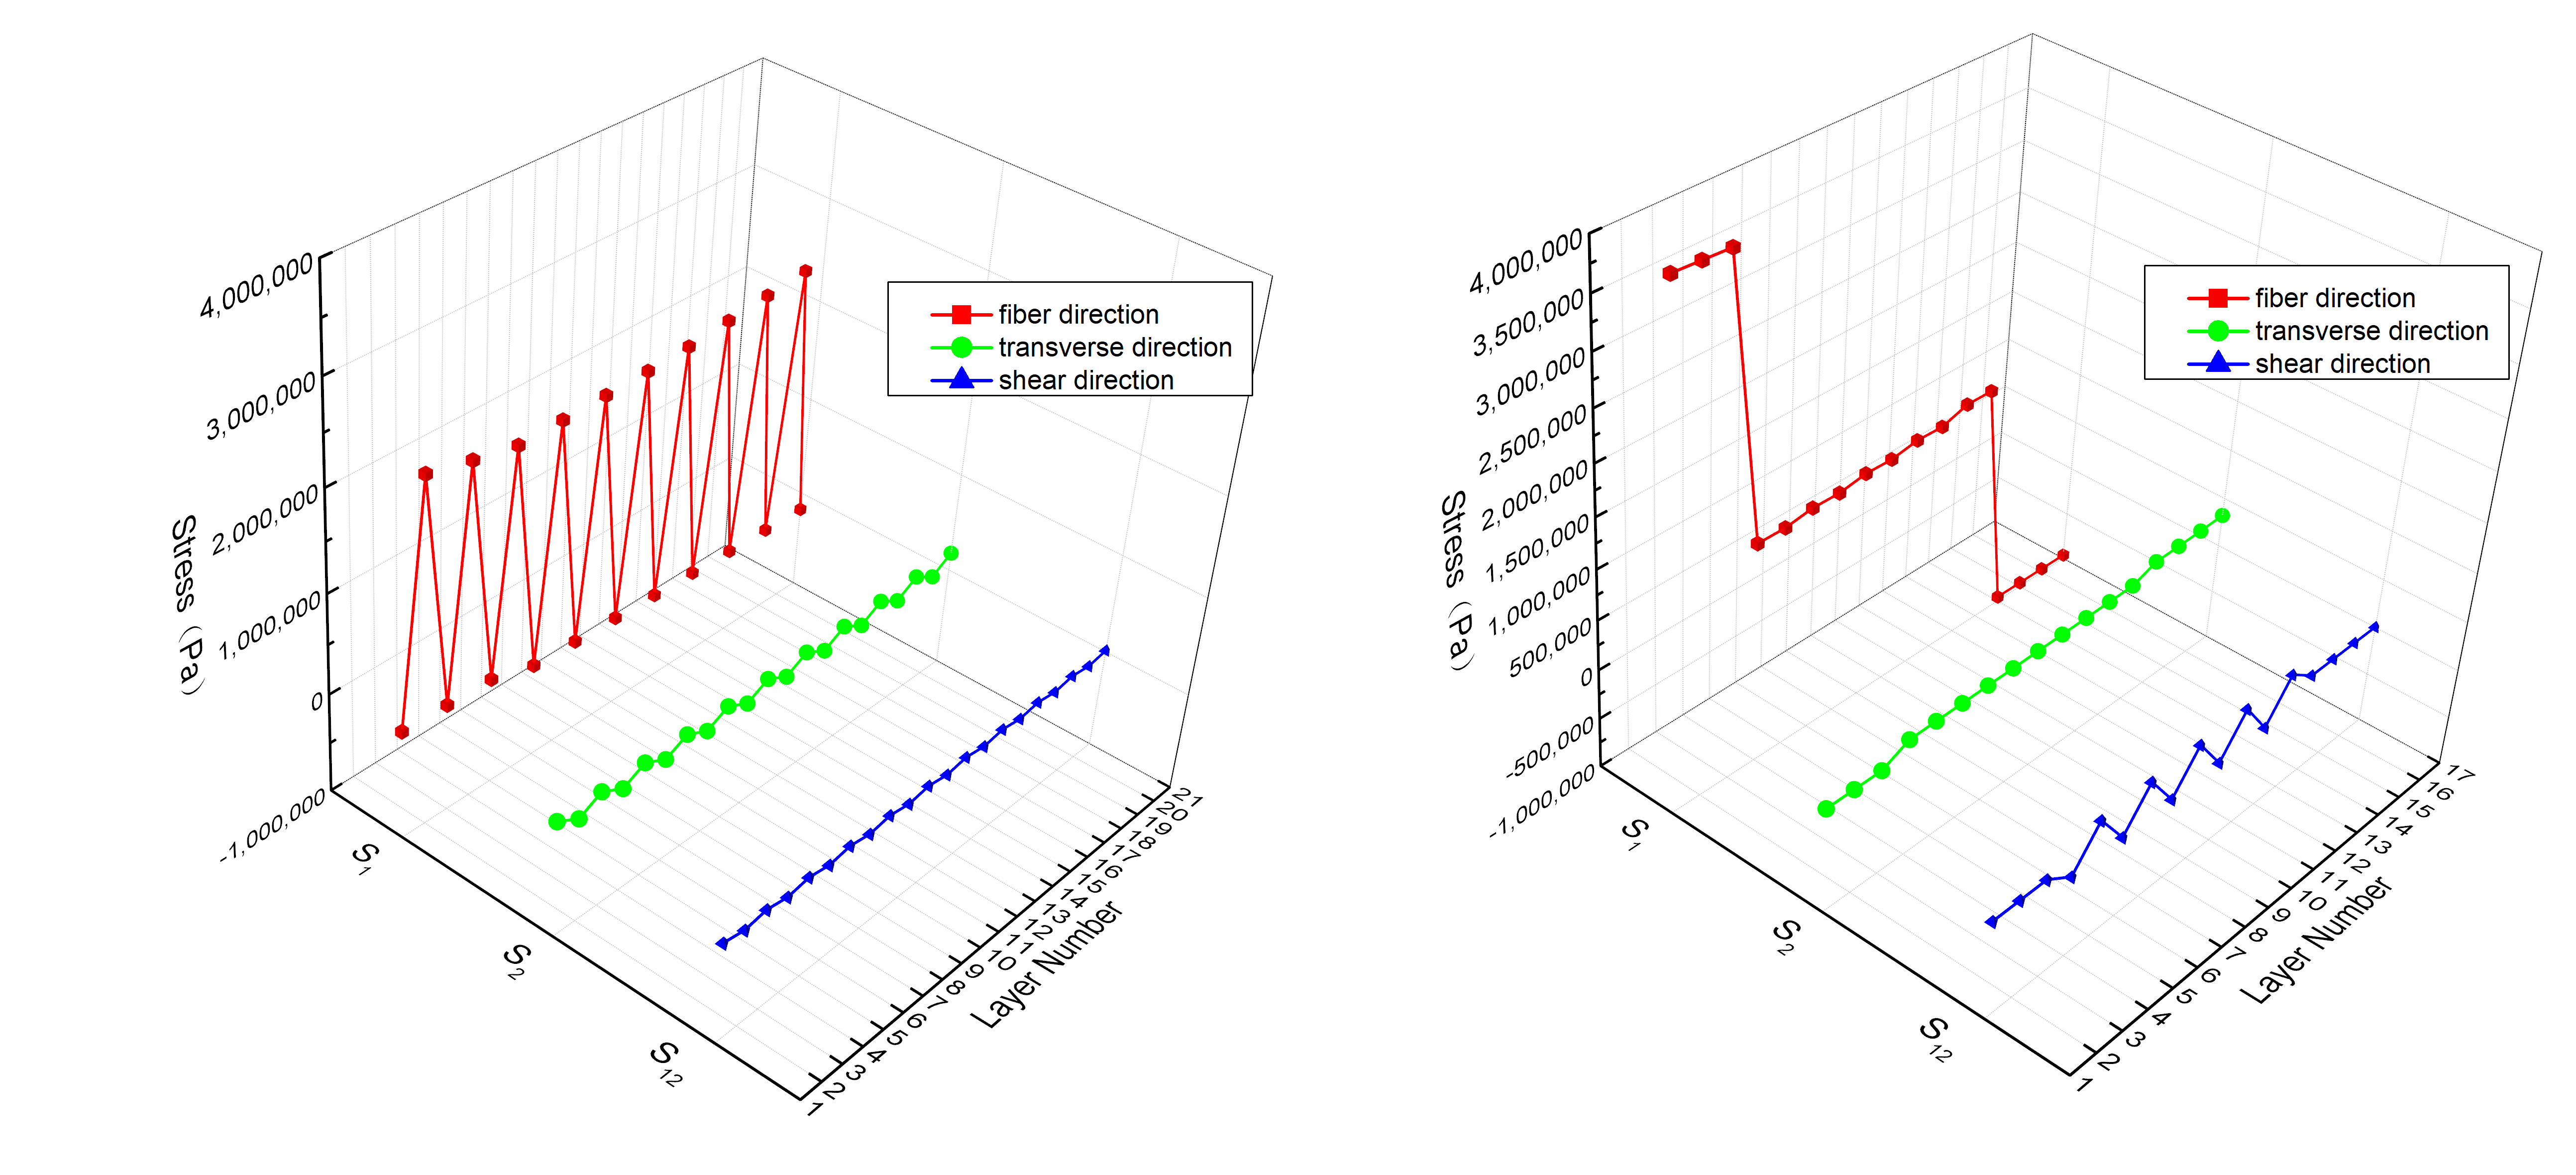
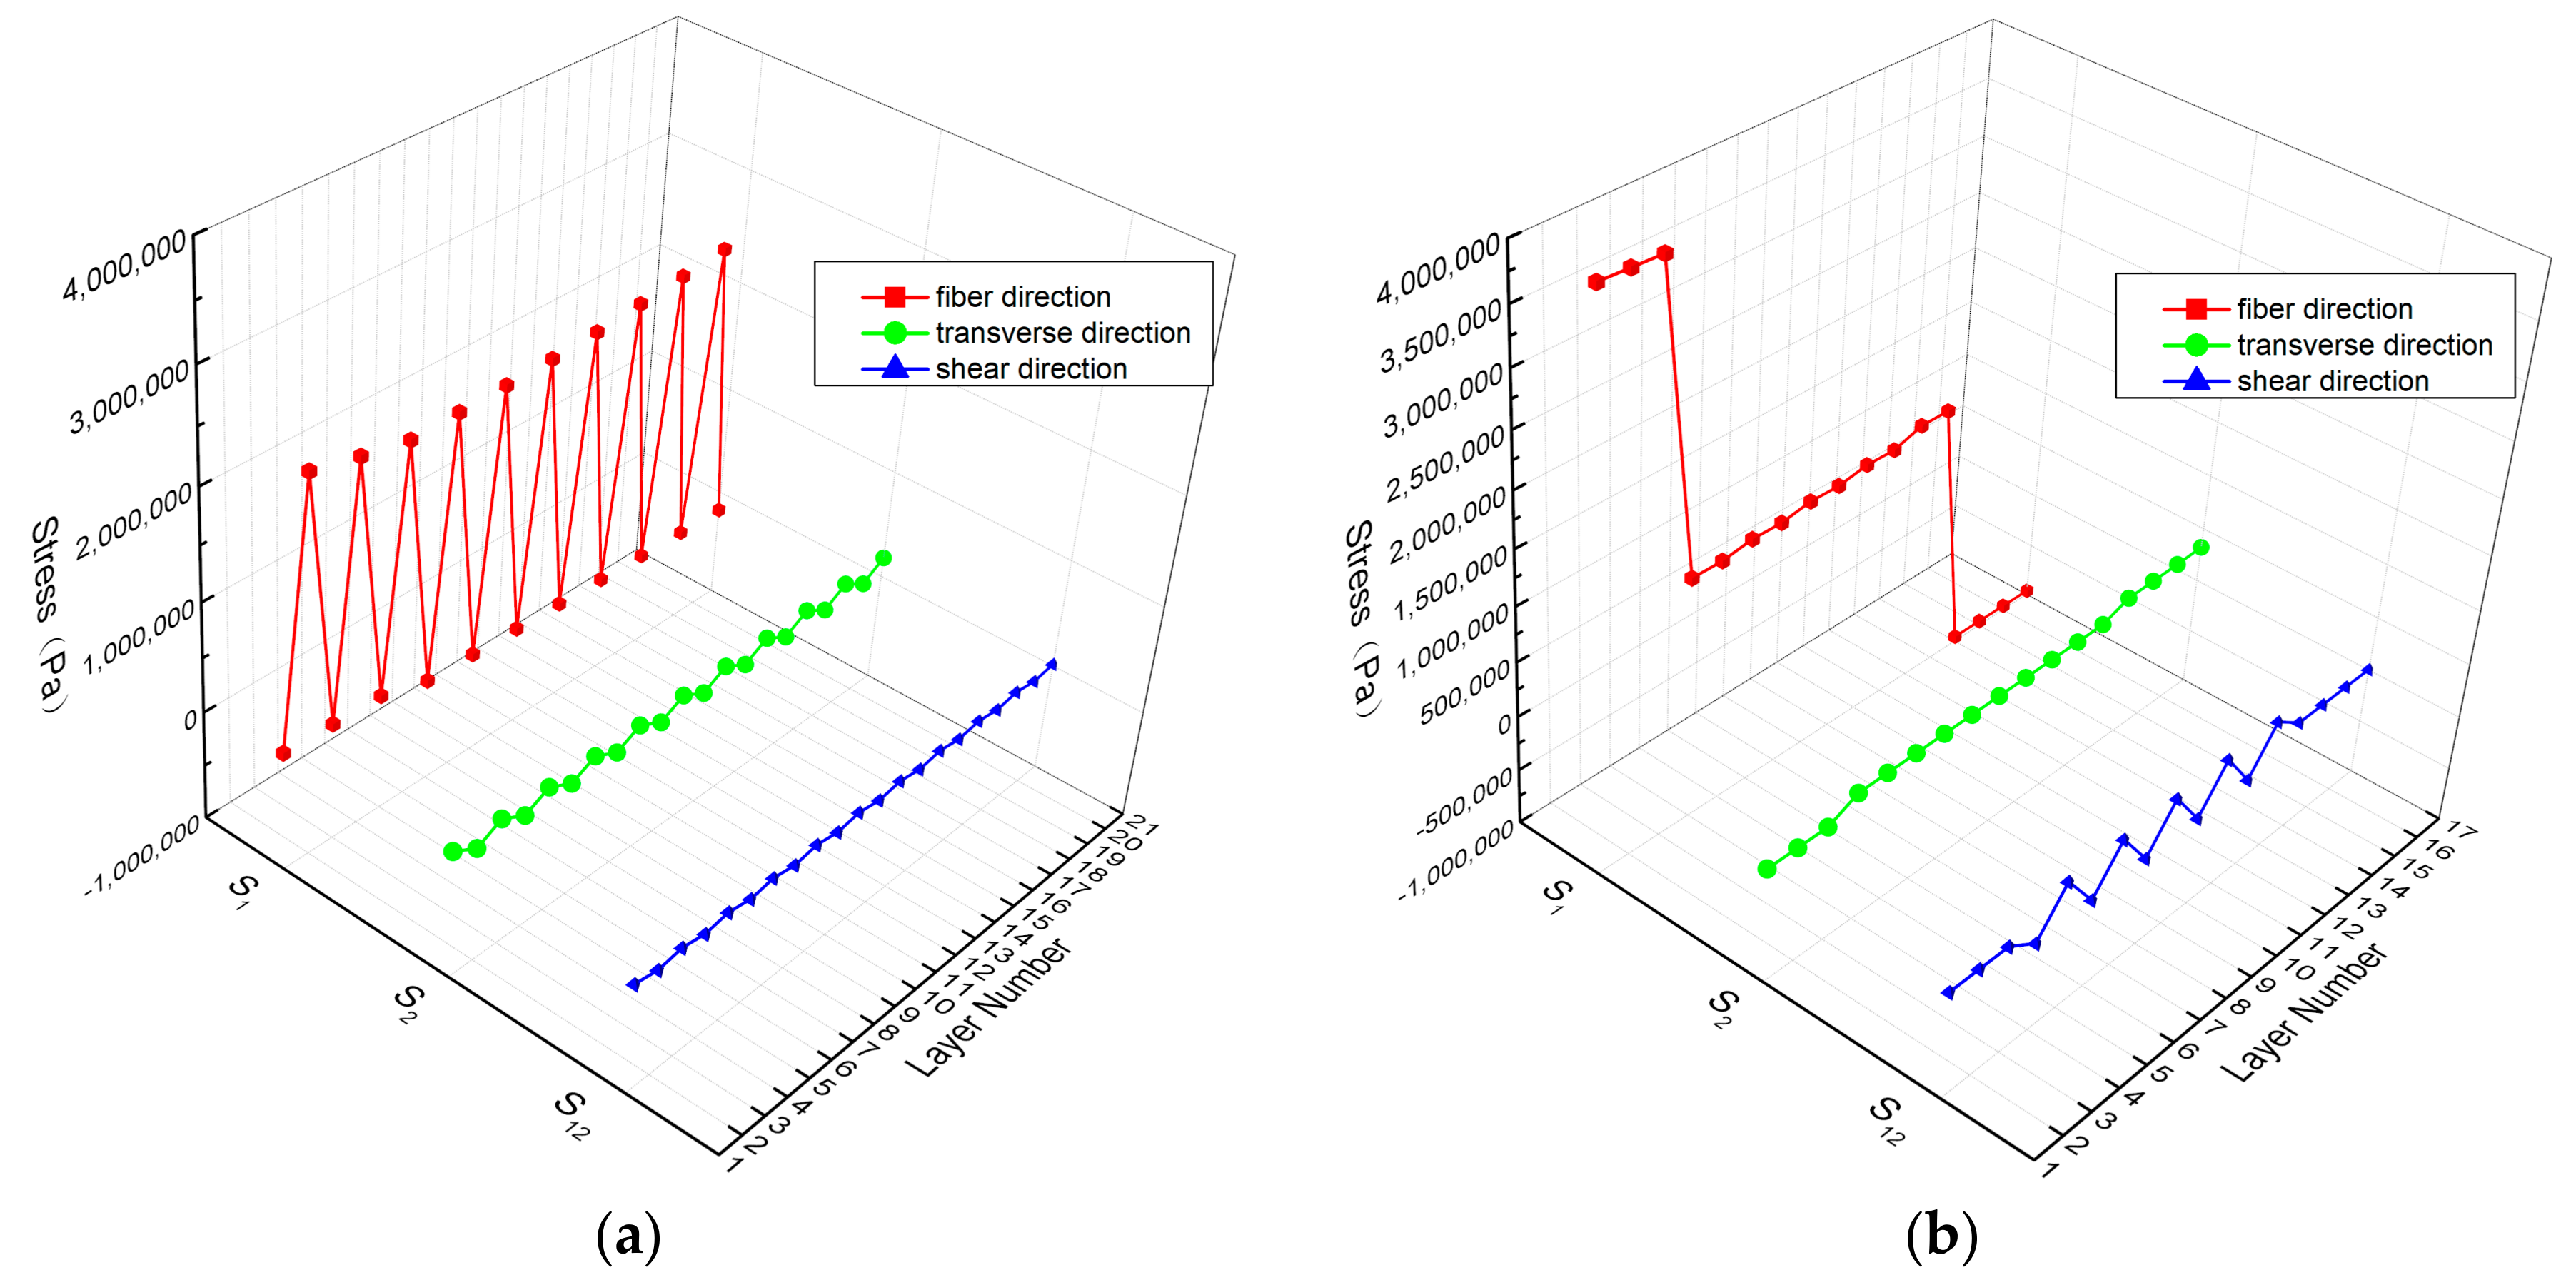
The overall performance and characteristics of composite risers can be obtained using EMM; however, it is impossible to analyze the stress distribution and failure criterion in every composite lamina by EMM. Therefore, LSM is employed to solve this problem. Figure 16 presents the maximum stress distribution including stress in fiber direction (S1), stress in transverse direction (S2) and stress in shear (S12) in every composite lamina for Risers 2 and 3.
It is shown in Figure 16 that the stress distribution in each composite lamina in composite Risers 2 and 3 are totally different, since their designed lay-ups are diverse, that is, composite Riser 2 only contains fiber reinforcements in hoop and axial directions while composite Riser 3 includes fiber reinforcements in hoop, axial and inclined directions. Both composite Risers 2 and 3 are dominated by bending deformation under the combination of VIV, buoyancy, top-tension force and gravity. Generally, the stress in each composite lamina is larger in composite Riser 3 than in composite Riser 2, which means tailor-designed composite Riser 3 can take advantage of the fiber strength more efficiently.
Comparing the stress distribution in every composite lamina for composite Risers 2 and 3, it is found that:
- (1)
- Stress in fiber direction (S1): S1 is smaller in hoop reinforced fiber layers than that in axial reinforced fiber layers for composite Riser 2 while S1 is largest in axial reinforced fiber layers, medium in inclined reinforced fiber layers and smallest in hoop reinforced fiber layers for composite Riser 3.
- (2)
- Stress in transverse direction (S2): S2 is larger in hoop reinforced fiber layers than that in axial reinforced fiber layers for composite Riser 2, while S2 is largest in hoop reinforced fiber layers, medium in inclined reinforced fiber layers and smallest in axial reinforced fiber layers for composite Riser 3.
- (3)
- Stress in shear (S12): Riser 2 only contains orthorhombic fiber reinforcements, and therefore almost no shear stress S12 is produced; contrarily, composite Riser 3 includes shear stress S12 in the inclined composite layers.
4. Conclusions
In this paper, the VIV responses of three different risers, i.e., conventional steel riser (Riser 1), composite riser with orthogonal reinforcements (Riser 2) and tailored composite riser (Riser 3) are investigated and compared considering the effects of 2D and 3D models, FSI and different modeling methods for the composite risers. The results show that:
- (1)
- Both 2D and 3D models lead to 2S vortex shedding modes for all three risers and VIV of a riser has obvious 3D characteristics and is affected by the depth of the flow field as well as the effect of FSI. As a result, a 3D model with FSI for the VIV is more accurate and realistic.
- (2)
- The amplitude of the cross-flow vibration is much larger than that of the flow-direction vibration, and the cross-flow vibration has a distinct periodicity while the flow-direction vibration tends to be at a relatively stable value. The deformation of the three risers are different due to their geometries, material properties, top-tension force, constraints, etc.
- (3)
- Different risers have different stress distributions, i.e., the stresses of composite risers are generally smaller than those of steel riser and occur in the middle and fixed end of the composite risers.
- (4)
- For the composite risers modeled by EMM and LSM: (i) EMM and LSM lead to similar VIV results for the same composite riser and both can be utilized to obtain the global performance of the composite risers; and (ii) EMM is easier and more efficient for the global calculation; however, to show the response of the each composite lamina, LSM is compulsory.
Author Contributions
Chunguang Wang designed and analyzed the experiments and collected data; Mingyu Sun and Shibo Xing performed the simulation; Krishnakumar Shankar provided the basic design parameters for the composite risers; Lu Zhang analyzed the results; and Chunguang Wang wrote the paper.
Acknowledgments
This work was supported by Shandong Provincial Natural Science Foundation (ZR2017LEE031 and ZR2016DL08), Science and Technology Development Project of Zibo (2017KJ040017), and Promotive Research Fund for Excellent Young and Middle-aged Scientists of Shandong Province (BS2014SF013).
Conflicts of Interest
The authors declare no conflict of interest.
References
- Ochoa, O.O.; Salama, M.M. Offshore composites: Transition barriers to an enabling technology. Compos. Sci. Technol. 2005, 65, 2588–2596. [Google Scholar] [CrossRef]
- Salama, M.M.; Martinussen, E.; Spencer, B.; Hanna, S.; Hsu, T.M.; Stjern, G.; Franco, E.; Storhaug, T.; Echtermeyer, A. Composite risers are ready for field applications-status of technology, field demonstration and life cycle economics. In Proceedings of the 13th Annual Deep Offshore Technology Conference, Rio de Janeiro, Brazil, 17–19 October 2001. [Google Scholar]
- Sparks, C.P.; Odru, P.; Bono, H.; Metivaud, G. Mechanical testing of high-performance composite tubes for TLP production risers. In Proceedings of the Offshore Technology Conference, Houston, TX, USA, 2–5 May 1988. [Google Scholar]
- Salama, M.M.; Johnson, D.B.; Long, J.R. Composite production riser-testing and qualification. SPE Prod. Facil. 1998, 13, 170–177. [Google Scholar] [CrossRef]
- Blevins, R.D. Flow-Induced Vibration, 2nd ed.; Krieger Publishing Company: Malabar, FL, USA, 2001. [Google Scholar]
- Wang, C.; Shankar, K.; Morozov, E.V. Tailored local design of deep sea FRP composite risers. Adv. Compos. Mater. 2015, 24, 375–397. [Google Scholar] [CrossRef]
- Wang, C.; Shankar, K.; Morozov, E.V. Global design and analysis of deep sea FRP composite risers under combined environmental loads. Adv. Compos. Mater. 2017, 26, 79–98. [Google Scholar] [CrossRef]
- Salama, M.M.; Stjern, G.; Storhaug, T.; Spencer, B.; Echtermeyer, A. The first offshore field installation for a composite riser joint. In Proceedings of the Offshore Technology Conference, Houston, TX, USA, 6–9 May 2002. [Google Scholar]
- Smith, K.L.; Leveque, M.E. Ultra-Deepwater Production Systems Technical-Progress Report; Conoco Phillips Company: Houston, TX, USA, 2003. [Google Scholar]
- Wang, C.; Shankar, K.; Morozov, E.V. Tailored design of top-tensioned composite risers for deep-water applications using three different approaches. Adv. Mech. Eng. 2017, 9. [Google Scholar] [CrossRef]
- Smith, K.L.; Leveque, M.E. Ultra-Deepwater Production Systems Technical-Final Report; Conoco Phillips Company: Houston, TX, USA, 2005. [Google Scholar]
- Picard, D.; Hudson, W.; Bouquier, L.; Dupupet, G.; Zivanovic, I. Composite carbon thermoplastic tubes for deepwater application. In Proceedings of the Offshore Technology Conference, Houston, TX, USA, 30 April–3 May 2007. [Google Scholar]
- Wang, C.; Shankar, K.; Ashraf, M.A.; Morozov, E.V.; Ray, T. Surrogate-assisted optimisation design of composite riser. Proc. Inst. Mech. Eng. Part L J. Mater. Des. Appl. 2016, 230, 18–34. [Google Scholar] [CrossRef]
- Feng, C.C. The Measurement of Vortex Induced Effects in Flow Past Stationary and Oscillating Circular and D-Section Cylinders; University of British Columbia: Vancouver, BC, Canada, 1968. [Google Scholar]
- Sarpkaya, T. Fluid forces on oscillating cylinders. J. Waterw. Port. Coast. Ocean Div. 1978, 104, 275–290. [Google Scholar]
- Gopalkrishnan, R. Vortex Induced Forces on Oscillating Bluff Cylinders; Department of Ocean Engineering, Massachusetts Institute of Technology: Cambridge, MA, USA, 1993. [Google Scholar]
- Khalak, A.; Williamson, C.H.K. Motions, forces and mode transitions in vortex-induced vibrations at low mass-damping. J. Fluids Struct. 1999, 13, 813–851. [Google Scholar] [CrossRef]
- Govardhan, R.; Williamson, C.H.K. Resonance forever: Existence of a critical mass and an infinite regime of resonance in vortex-induced vibration. J. Fluids Mech. 2002, 473, 147–166. [Google Scholar] [CrossRef]
- Hartlen, R.T.; Currie, I.G. Lift-oscillator model of vortex-induced vibration. J. Eng. Mech. Div. 1970, 96, 577–591. [Google Scholar]
- Skop, R.A.; Griffin, O.M. On a theory for the vortex-excited oscillations of flexible cylindrical structures. J. Sound Vib. 1975, 41, 263–274. [Google Scholar] [CrossRef]
- Kim, W.J.; Perkins, N.C. Two-dimensional vortex-induced vibration of cable suspensions. J. Fluids Struct. 2002, 16, 229–245. [Google Scholar] [CrossRef]
- Facchinetti, M.L.; de Langre, E.; Biolley, F. Coupling of structure and wake oscillators in vortex-induced vibrations. J. Fluids Struct. 2004, 19, 123–140. [Google Scholar] [CrossRef]
- Wu, X.; Huang, W. A new model for predicting vortex-induced vibration of a long flexible riser with large deformation. J. Vib. Shock 2013, 32, 21–25, 30. [Google Scholar]
- Guo, H.; Zhao, W.; Wang, F. Experimental investigation of the effect of internal flow on top tension of the riser. J. Ocean Univ. China 2015, 45, 102–109. [Google Scholar]
- Lou, M.; Yu, C. Dynamic responses of a riser under combined excitation of internal waves and background currents. Int. J. Naval Arch. Ocean 2014, 6, 685–699. [Google Scholar] [CrossRef]
- Tang, Y.; Shao, W.; Zhang, J.; Wang, L.Y.; Gui, L. Dynamic response analysis for coupled parametric vibration and vortex-induced vibration of top-tensioned riser in deep-sea. Eng. Mech. 2013, 30, 282–286. [Google Scholar]
- Huang, X.; Wang, J. Simulation of flow around a circular cylinder and vortex-induced vibraiont using the discrete vortex method. In Proceedings of the 11th National Symposium on Hydrodynamics, Zhejiang, China, 4–7 July 2013. [Google Scholar]
- Liu, J.; Guo, H.; Zhao, J. Numerical simulaiton of flow around two tandem circular cylinder of equal dimeter. J. Ocean Univ. China 2013, 43, 92–97. [Google Scholar]
- Ji, C.; Xiao, Z.; Wang, Y.; Wang, H. Numerical investigation on vortex-induced vibration of an elastically mounted circular cylinder at low Reynolds number using the fictitious domain method. Int. J. Comput. Fluid Dyn. 2011, 25, 207–221. [Google Scholar] [CrossRef]
- Zhang, X.; Xue, H.; Tang, W. VIV fatigue reliability and fatigue safety factor analysis of deep-water riser. Ocean Eng. 2014, 32, 17–23. [Google Scholar]
- Tan, L.B.; Chen, Y.; Jaiman, R.K.; Sun, X.; Tan, V.B.C.; Tay, T.E. Coupled fluid–structure simulations for evaluating a performance of full-scale deepwater composite riser. Ocean Eng. 2015, 94, 19–35. [Google Scholar] [CrossRef]
- Huang, K.Z. Composite TTR design for an ultradeepwater TLP. In Proceedings of the Offshore Technology Conference, Houston, TX, USA, 2–5 May 2005. [Google Scholar]
- Chen, Y.; Tan, L.B.; Jaiman, R.K.; Sun, X.; Tay, T.E.; Tan, V.B.C. Global-local analysis of a full-scale composite riser during vortex-induced vibration. In Proceedings of the 32nd International Conference on Ocean, Offshore and Arctic Engineering, Nantes, France, 9–14 June 2013. [Google Scholar]
- Bogetti, T.A.; Hoppel, C.P.R.; Drysdale, W.H. Three-Dimensional Effective Property and Strength Prediction of Thick Laminated Composite Media; Aberdeen Proving Ground, United States Army Research Laboratory: Adelphi, MD, USA, 1995. [Google Scholar]
- Sun, C.T.; Li, S. Three-dimensional effective elastic constant for thick laminates. J. Compos. Mater. 1988, 22, 629–639. [Google Scholar] [CrossRef]
- Chakrabarti, S.K. Handbook of Offshore Eengineering, 1st ed.; Elsevier: Plainfield, IL, USA, 2005. [Google Scholar]
Figure 1.
Cross-section for: (a) steel riser joint; and (b) composite riser joint.

Figure 2.
Flow chart of vortex induced vibration (VIV) simulation with two-way fluid–structure interaction for FRP composite riser.
Figure 2.
Flow chart of vortex induced vibration (VIV) simulation with two-way fluid–structure interaction for FRP composite riser.

Figure 3.
FE models of flow and riser.

Figure 4.
First three mode shapes of the riser.

Figure 5.
Vortex shedding frequencies of the risers using fast Fourier transform (FFT).

Figure 6.
Vorticities of the risers for 2D and 3D models. (a–c) Presents the vorticities for Risers 1, 2 and 3 with 2D models; (d–f) illustrates the vorticities for Risers 1, 2 and 3 with 3D models.
Figure 6.
Vorticities of the risers for 2D and 3D models. (a–c) Presents the vorticities for Risers 1, 2 and 3 with 2D models; (d–f) illustrates the vorticities for Risers 1, 2 and 3 with 3D models.

Figure 7.
CL and CD of the risers for 2D and 3D models. (a–c) Presents the CL for Risers 1, 2 and 3 with 2D and 3D models; (d–f) illustrates the CD for Risers 1, 2 and 3 with 2D and 3D models.
Figure 7.
CL and CD of the risers for 2D and 3D models. (a–c) Presents the CL for Risers 1, 2 and 3 with 2D and 3D models; (d–f) illustrates the CD for Risers 1, 2 and 3 with 2D and 3D models.


Figure 8.
Profile of vorticity in 3D models for: (a) Riser 1; (b) Riser 2; and (c) Riser 3.

Figure 9.
CL and CD of the risers with/without coupled fluid–structure interaction. (a–c) Presents the CL for Risers 1, 2 and 3 with/without FSI; (d–f) illustrates the CD for Risers 1, 2 and 3 with/without FSI.
Figure 9.
CL and CD of the risers with/without coupled fluid–structure interaction. (a–c) Presents the CL for Risers 1, 2 and 3 with/without FSI; (d–f) illustrates the CD for Risers 1, 2 and 3 with/without FSI.

Figure 10.
Vorticity for different times: (a) t = 0.4 s; (b) t = 8 s; and (c) t = 14 s.

Figure 11.
Displacement time history of the risers for the vortex-induced vibration. (a–c) shows the displacement time history at −1.2 m for Risers 1, 2 and 3, respectively; (d–f) shows the displacement time history at −6.2 m for Risers 1, 2 and 3, respectively; (g–i) shows the displacement time history at −11.2 m for Risers 1, 2 and 3, respectively.


Figure 12.
Maximum cross-flow displacement of the risers with different modeling methods.

Figure 13.
Maximum flow-direction displacement of the risers with different modeling methods. (a) Shows the maximum flow-direction displacement for Riser 1; (b,c) presents the maximum flow-direction displacement for Riser 2 with EMM and LSM, respectively; (d,e) illustrates the maximum flow-direction displacement for Riser 3 with EMM and LSM, respectively.


Figure 14.
Maximum von Mises stress of the risers for the vortex-induced vibration.

Figure 15.
Stress distribution for: (a) Riser 1; (b) Riser 2; and (c) Riser 3.

Figure 16.
Stress distribution for every lamina with LSM: Riser 2 (a); and Riser 3 (b).


Table 1.
Geometries of risers.
| Riser | I.D. (m) | O.D. (m) | Length (m) | Lay-Ups | t_liner (mm) | t_0° (mm) | t_±θ° (mm) | t_90° (mm) | ±θ (°) |
|---|---|---|---|---|---|---|---|---|---|
| Riser 1 | 0.25 | 0.3 | 12.5 | Monolithic steel | |||||
| Riser 2 | 0.25 | 0.326 | 12.5 | [liner/90/(0/90)10] | 6 | 1.165 | 1.85 | ||
| Riser 3 | 0.25 | 0.31 | 12.5 | [liner/03/(+52,−52)5/904] | 6 | 1.48 | 1.30 | 1.64 | 52 |
Table 2.
Properties of the materials for the risers.
| Material | Density (kg/m3) | E1 (GPa) | E2 = E3 (GPa) | G12 = G13 (GPa) | ν12 = ν13 | G23 (GPa) | ν23 | (MPa) | (MPa) | (MPa) | (MPa) | τ12 (MPa) |
|---|---|---|---|---|---|---|---|---|---|---|---|---|
| Steel | 7850 | 207 | 0.3 | 625 | ||||||||
| PEEK | 1300 | 3.64 | 0.4 | 120 | ||||||||
| AS4-PEEK | 1561 | 131 | 8.7 | 5 | 0.28 | 2.78 | 0.48 | 1648 | 864 | 62.4 | 156.8 | 125.6 |
Subscripts: 1, fiber direction; 2, in-plane transverse; and 3, through-thickness direction. Superscripts: T, Tension; C, Compression. Note: For steel and polyetheretherketone (PEEK) in the table, is used for their ultimate stress.
Table 3.
Effective properties of fiber reinforced polymer (FRP) composite risers (effective modulus method).
Table 3.
Effective properties of fiber reinforced polymer (FRP) composite risers (effective modulus method).
| Riser | ρeffective (kg/m3) | Ex (GPa) | Ey (GPa) | Ez (GPa) | Gxy (GPa) | Gxz (GPa) | Gyz (GPa) | νxy | νxz | νyz |
|---|---|---|---|---|---|---|---|---|---|---|
| Riser 2 | 1524.4 | 45.7 | 73.8 | 9.83 | 4.42 | 2.87 | 2.95 | 0.0316 | 0.479 | 0.453 |
| Riser 3 | 1513.3 | 30.4 | 50.28 | 9.59 | 16.44 | 2.46 | 2.75 | 0.251 | 0.378 | 0.284 |
Subscripts: x, axial direction of the risers; y, hoop direction of the risers; and z, through-thickness direction of the risers.
Table 4.
Flow parameters and Re and top tensions of the risers.
| Flow Parameters | Riser Type | Re | Tension Force (N) | |
|---|---|---|---|---|
| density (kg/m3) | 1024 | Riser 1 | 101,887 | 31,145 |
| velocity (m/s) | 0.36 | Riser 2 | 110,716 | 12,838 |
| υ | 1.06 × 10⁻⁶ | Riser 3 | 105,283 | 9776 |
Table 5.
Natural frequencies, vortex shedding frequencies and reduced velocities of the risers.
| Type | Riser 1 | Riser 2 Effective | Riser 2 Layered | Riser 3 Effective | Riser 3 Layered | |
|---|---|---|---|---|---|---|
| natural frequency /(Hz) | 7.87 | 8.64 | 8.85 | 6.98 | 6.82 | |
| vortex shedding frequency fs/(Hz) | Equation (9) | 0.25 | 0.23 | 0.23 | 0.24 | 0.24 |
| FFT of CL | 0.26 | 0.23 | 0.24 | 0.25 | 0.25 | |
| reduced velocity Ur | 0.153 | 0.13 | 0.12 | 0.17 | 0.17 | |
© 2018 by the authors. Licensee MDPI, Basel, Switzerland. This article is an open access article distributed under the terms and conditions of the Creative Commons Attribution (CC BY) license (http://creativecommons.org/licenses/by/4.0/).
Share and Cite
MDPI and ACS Style
Wang, C.; Sun, M.; Shankar, K.; Xing, S.; Zhang, L. CFD Simulation of Vortex Induced Vibration for FRP Composite Riser with Different Modeling Methods. Appl. Sci. 2018, 8, 684. https://doi.org/10.3390/app8050684
AMA Style
Wang C, Sun M, Shankar K, Xing S, Zhang L. CFD Simulation of Vortex Induced Vibration for FRP Composite Riser with Different Modeling Methods. Applied Sciences. 2018; 8(5):684. https://doi.org/10.3390/app8050684
Chicago/Turabian StyleWang, Chunguang, Mingyu Sun, Krishnakumar Shankar, Shibo Xing, and Lu Zhang. 2018. "CFD Simulation of Vortex Induced Vibration for FRP Composite Riser with Different Modeling Methods" Applied Sciences 8, no. 5: 684. https://doi.org/10.3390/app8050684
Note that from the first issue of 2016, this journal uses article numbers instead of page numbers. See further details here.