In Situ Experimental Study of the Friction of Sea Ice and Steel on Sea Ice

1
State Key Laboratory of Coastal and Offshore Engineering, Dalian University of Technology, Dalian 116024, China
2
Institute of Atmospheric and Earth Sciences, University of Helsinki, Helsinki FI-00014, Finland
*
Author to whom correspondence should be addressed.
Appl. Sci. 2018, 8(5), 675; https://doi.org/10.3390/app8050675
Submission received: 9 April 2018
/
Revised: 21 April 2018
/
Accepted: 24 April 2018
/
Published: 26 April 2018
Abstract
:The kinetic coefficient of friction μk was measured for sea ice, stainless steel, and coated steel sliding on a natural sea ice cover. The effects of normal stress (3.10–8.11 kPa), ice columnar grain orientation (vertical and parallel to the sliding direction), sliding velocity (0.02–2.97 m·s–1), and contact material were investigated. Air temperature was higher than −5.0 °C for the test duration. The results showed a decline of μk with increasing normal stress with μk independent of ice grain orientation. The μk of different materials varied, partly due to distinct surface roughnesses, but all cases showed a similar increasing trend with increasing velocity because of the viscous resistance of melt-water film. The velocity dependence of μk was quantified using the rate- and state- dependent model, and μk was found to increase logarithmically with increasing velocity. In addition, μk obtained at higher air temperatures was greater than at lower temperatures. The stick-slip phenomenon was observed at a relatively high velocity compared with previous studies, which was partly due to the low-stiffness device used in the field. Based on the experimental data, the calculation of physical models can be compared.
1. Introduction
A sustained decline in sea ice extent and thickness has taken place in the Arctic Ocean in recent years [1,2,3,4]. These changes suggest more attractive prospects for navigation as the Arctic Ocean becomes more accessible in the marginal seas [5,6,7,8,9]. Chinese container vessels have sailed through the Northeast Passage to Europe in recent summer seasons [10]. When sea ice interacts with a ship’s hull during navigation in ice-infested waters, it may fracture, collide with, or slide along the hull. During these interactions, the friction between sea ice and a ship’s hull severely affects the performance of the vessel [11,12]; approximately 70% of the power of icebreakers is consumed to overcome friction [13]. Therefore, knowledge of the engineering mechanism of ice friction is important for ice navigation in the Arctic Ocean.
Ice friction has received relatively less attention than studies on compression, bending, and other ice mechanics [14,15,16,17,18,19,20]. To understand the behavior of ice friction, laboratory experiments have been conducted on the friction of ice against ice [21,22,23,24,25], against metals [26,27], against coatings [28,29], against polymethyl methacrylate [30,31], against glass [32], and against rubber [33]. Several impact factors have been investigated, such as sliding velocity, temperature, normal load, and grain structure. Based on these laboratory experiments some physical mechanisms were proposed and proved, e.g., a water layer would be formed at contact surface by frictional heat [21,22,23,24,25,27,30,31,32]. However, in most of these above laboratory experiments, small manufactured ice samples with well-prepared smooth surfaces were performed to slide a very short distance along the substrate using modified uniaxial testing, rotational, or linear devices. Moreover, some of the laboratory experiments were performed under very low sliding velocities, which were several orders of magnitude slower than the real speed during ice navigation [34]. Therefore, although the results from these small-scale tests are helpful in understanding the physics of ice friction, they cannot be used uncritically for engineering applications.
To the authors’ knowledge, only a limited number of experiments have been performed at large scale, namely in a basin or in field. Liukkonen [11] measured the friction between ice and an icebreaker hull under authentic icebreaking circumstances. Lishman et al. [35] conducted a series of meter-scale ice friction tests in an ice basin. Pritchard et al. [36] and Sukhorukov and Løset [37] pulled sea ice blocks over a natural ice cover in field. From an engineering perspective, more field data are needed to verify the results obtained from tests in basins and in laboratories.
The ice friction occurred during ice navigation is different from the previous experiments conducted in laboratories. Because when a ship sails in the ice region, such as sailing in the marginal ice zone in Antarctic/Arctic in summer, the navigation velocity and the ambient temperature are higher than the test conditions of the previous studies. Therefore, the objective of the current work was to better model the conditions of ice friction occurred during ice navigation, including the ambient temperature, contact material, sliding velocity, through field experiment using nature ice cover. We intended to observe the ice friction phenomena at the conditions closer to the real situation and tried to explain it based on the existing theories. With the objective, this paper has been organized as follows. Section 2 gives a detailed description of the field measurements, Section 3 presents the experimental results, and Section 4 discusses the uncertainty analysis, comparisons with previous reports, quantification of velocity dependence, and an approximate comparison with model estimation. Finally, conclusions are drawn in Section 5.
2. Materials and Methods
The field experiment on sea ice friction was performed in an offshore region of Liaodong Bay, Bohai Sea (40°40.7′ N, 122°07.0′ E) near the estuary in late winter in 2015. During the test period, the sea ice surface was flat without a snow layer, and the ice thickness was 30 cm. The weather was clear without precipitation, and the air temperature ranged from −5.0 to −0.8 °C mostly, which is close to the air temperature in the summer Arctic [38]. The mean salinity of sea ice was measured as 3.2 PSU affected by the fresh water. The grain structure of congelation ice in Liaodong Bay usually shows a thin granular ice layer on top and a columnar layer on the bottom [39]. In sea ice, below the surface layer the c-axes of columnar grains are horizontal, perpendicular to the principal axes of the columns [40].
2.1. Sliding Tracks
Four types of 20 m–long sliding tracks were prepared on level ice at the site: (1) Top track, (2) Bottom track, (3) Lateral// track, and (4) Lateral⊥ track. The Top track was constructed using the top side of the ice sheet. The Bottom track used the ice bottom side as a track surface. Ice blocks were cut from the ice cover and turned over in sea water, after which these reversed ice blocks were frozen together for more than 24 h so that their original bottom sides acted as the sliding surface of the track. The Lateral// and Lateral⊥ tracks used the lateral sides of the ice. Ice blocks were extracted, turned on their lateral sides in sea water, and frozen together for more than 24 h. When rolling these ice blocks, their lateral sides were placed in two directions: with the ice columnar grain orientation parallel to the track length (Lateral//), and with the ice columnar grain orientation perpendicular to the track length (Lateral⊥). The ice surface morphology of the different sides varied significantly because of several factors, including freeze-thaw cycles, wind erosion, underlying water impact, and the artificial cutting process. Sliding on uneven surfaces could cause sliders to bump, which would lead to violent fluctuations in the measured friction force. Hence, to prepare a flat sliding surface, obvious bumps on the surface of each track were carefully cleared using a shovel.
2.2. Sliders
Several ice blocks were sawn from the ice cover and used as sea ice sliders. The dimensions of the ice blocks were 30 cm in height and 30 cm × 40 cm in the horizontal plane. The sea ice blocks were kept in field for more than 48 h until they were first pulled to reach thermal equilibrium with the air. Each block had one side selected as the fixed sliding surface. The surface roughness of the top and bottom sides of the sea ice sliders was natural, but the lateral sides were created artificially during cutting. No further preparation was conducted on the surfaces once these blocks had been extracted, and they were packed with plastic sheets to avoid sublimation. Besides sea ice, plates made of stainless steel (SS) and coated steel (CS) with a size of 30 cm × 40 cm were used to slide on the ice tracks, which were also kept in field.
2.3. Experimental Set-Up
The sliders were pulled along the ice tracks using a mechanism driven by a gear motor (Figure 1a). The motor was mounted on a piece of plywood fixed on the ice sheet. The sliding velocity was altered within a rough range using pulleys with different diameters and then adjusted accurately using a frequency converter. A grooved wooden stick was fixed into the ice sheet in front of the motor to restrict the movement of the pulling cable and reduce the swing of the sliders. Figure 1b shows an ice block sliding on its bottom side along the Top track. The pulling cable was a 20 m-long steel wire, and a stainless steel frame was used to contain the slider and ballast. Between the steel cable and slider, a load cell (2.0 × 10³ ± 1.0 N) was attached to the frame in the horizontal position to measure the pulling force. Figure 1c shows the iron blocks with a weight of approximately 10 kg each, which were used as ballast to add the normal load of the sliders. The SS plate (silver) and the CS plate (blue) were fixed to the bottom of the frame to change the contact material. Figure 1d shows the SS plate sliding on the Top track with two iron blocks inside.
2.4. Test Parameters
2.4.1. Parameter Selection Criteria
To model ice friction during navigation, the expedition of the research vessel Polarstern in the Antarctic in 2006 is referenced to analyze vessel motion against ice [41]. A typical case involving the icebreaker repeatedly ramming thick ice was extracted. During the process, the vessel moved along and vertical to the track, and the along- and vertical-track velocities were recorded using the shipboard scientific navigation platform. Assuming that the ice sheet was stable, the speed for ice–hull friction was set equal to the vessel velocity.
Figure 2a shows the frequency distribution of the along-track velocity of the icebreaker during the ramming process. The positive and negative values denote forward and backward movement respectively. During the horizontal movement, the velocity ranged between −1.60 and 1.50 m·s−1. Figure 2b shows the frequency distribution of the vertical-track velocity during the ramming process, with positive and negative values denoting upward and downward movement of the vessel respectively. The velocity ranged between −1.30 and 1.40 m·s−1, and compared with the along-track velocity, the vertical-track velocity adhered much more closely to a normal distribution.
In addition to ice–hull friction, friction also occurs between broken sea ice blocks. In particularly, because broken ice turn over, ice–hull friction and ice-ice friction occur on different sides of the ice blocks.
2.4.2. Test Parameters
The influences of normal stress, sliding velocity, contact materials, and sliding direction with respect to ice columnar grain orientation on the kinetic friction coefficient μk were studied.
The normal stress ranged from 3.10 to 6.56 kPa for steel-ice contact and from 5.34 to 8.11 kPa for ice-ice contact. Assuming that the velocity of an icebreaker would not be small during navigation, the minimum sliding velocity was set to 0.02 m·s−1, and the velocity range was extended to 0.02–2.97 m·s−1 to cover the whole range during the icebreaker ramming event shown in Figure 2. In each test, the sliding velocity was constant. The contact materials against sea ice were SS, CS, and sea ice to model the possible objects encountered during ice navigation. Because granular grains are isotropic and columnar grains are anisotropic, the effect of ice columnar grain orientation was investigated by measuring μk in sliding directions vertical and parallel to ice columnar grain orientation. The sliding configuration in which the top surface of the ice slider slid on the Lateral// track is denoted as Top-Lateral//. Especially for ice-ice cases, friction could occur between any two surfaces. Therefore, there were in total ten types of sliding configurations for ice-ice friction, as shown in Figure 3. The tests were repeated three times under each test condition. During the day, tests were usually conducted in the morning when the air temperature did not rise largely and terminated when air temperature rose above melting point. Therefore, the temperatures of ice slider and ice track surface were believed to be same as air throughout the test duration.
3. Results
3.1. Friction Regimes
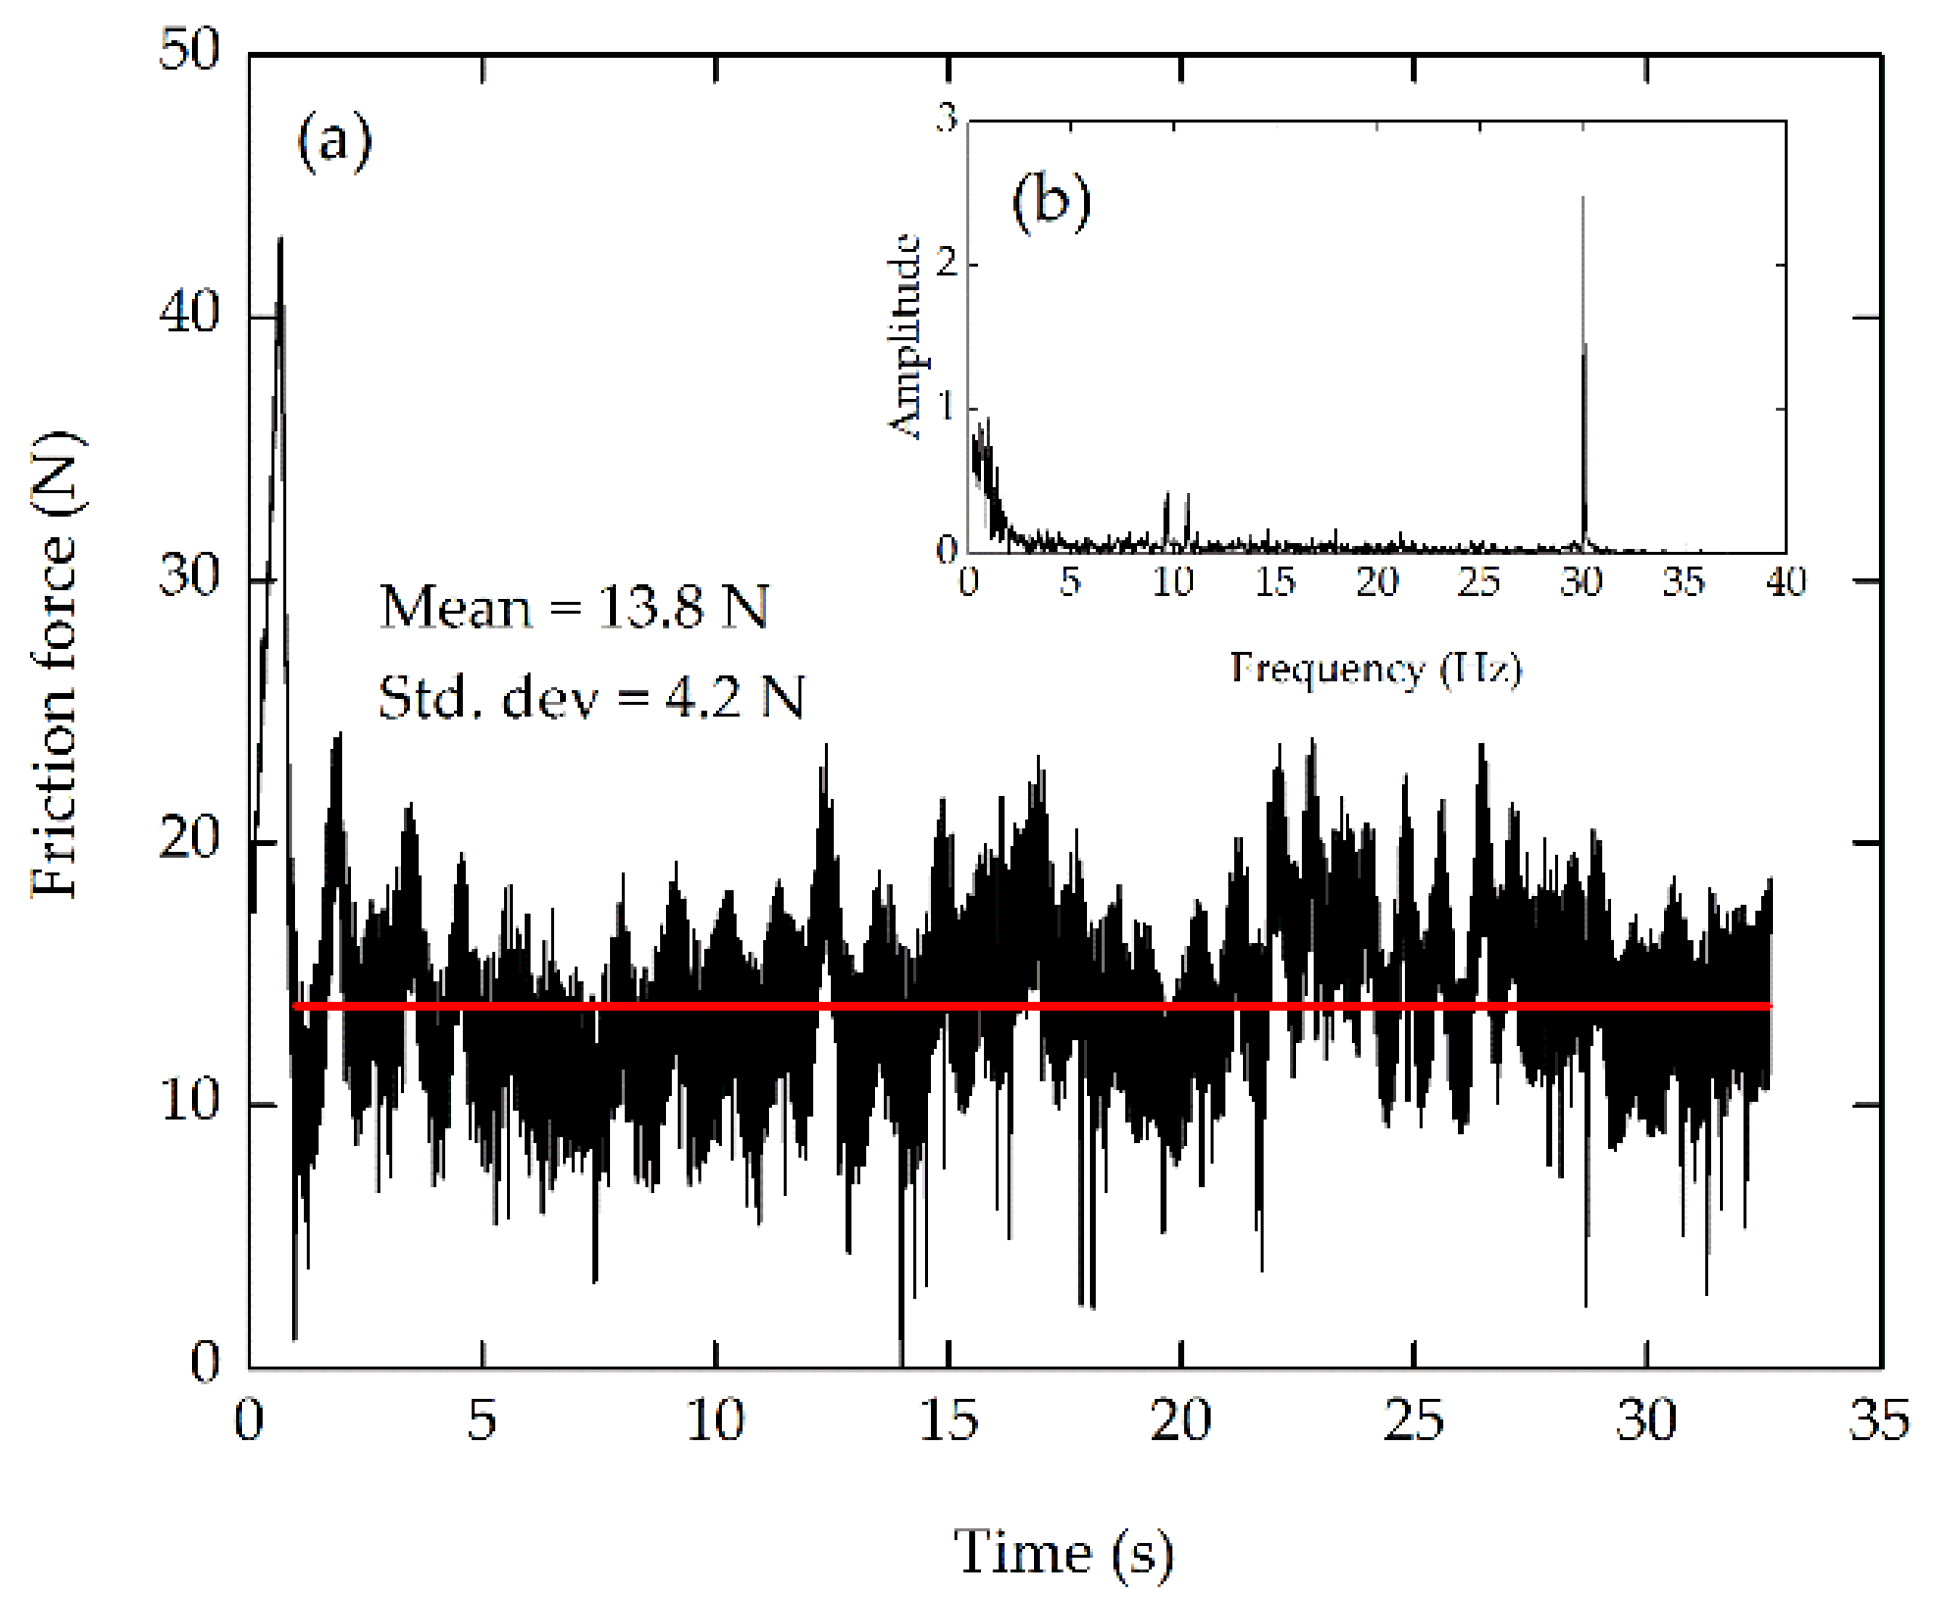
Three types of friction regimes were obtained in these tests. The first type represents steady sliding (Figure 4a), which occurs in most conditions. The first peak load was the force needed to overcome static friction to initiate sliding. Subsequently, the slider kept a stable sliding state once it initiated to move, and the force dropped to balance the kinetic friction. The fluctuations of the regime was caused by the small bumps on the track surface, and the load oscillations in the steady sliding had no obvious frequency (Figure 4b). μk was calculated as the ratio of the pulling force Ff to the normal load Fn
where Ff was taken as the mean value of the stationary portion of the regime. The final μk under a given set of conditions was the average value from repeated tests.
Figure 5a shows the second type of regime, which was related to stick-slip behavior. Stick-slip motion was observed in steel-ice friction at a velocity of 0.02 m·s−1. Compared with steady sliding, the motion of stick-slip was different. The slider adhered to the track instantaneously and moved once the pulling force exceeded a certain threshold. Thus, the regime of stick-slip motion had a saw-tooth shape, and Fourier analysis indicated that load oscillations in the stick-slip motion had a frequency of 30.10 Hz (Figure 5b). The μk of stick-slip motion was calculated in the same manner as in the steady-slide case [23,37].
The third type of motion was a regime with repeated U-shapes (Figure 6a). The regime was observed only on ice-ice contact at velocities less than 0.10 m·s−1. The ice block adhered to the ice track temporarily until it was pulled to slide again. Once the slip was initiated, the pulling cable sagged, and the slider moved because of inertia and then was stopped by friction. Hence, movement in the U-shape regime was a kind of enhanced stick-slip. However, because a stationary portion of friction force failed to be determined from this type of regime, the μk of ice-ice friction at velocities less than 0.10 m·s−1 was not considered in the analysis that followed. Fourier analysis showed that the load oscillations had frequencies between 0.28 and 0.96 Hz. Besides, ice-ice friction regimes showed large fluctuations when sliding velocities were higher than 1.00 m·s−1, making μk difficult to determine. Hence, μk at velocities greater than 1.00 m·s−1 was not analyzed.
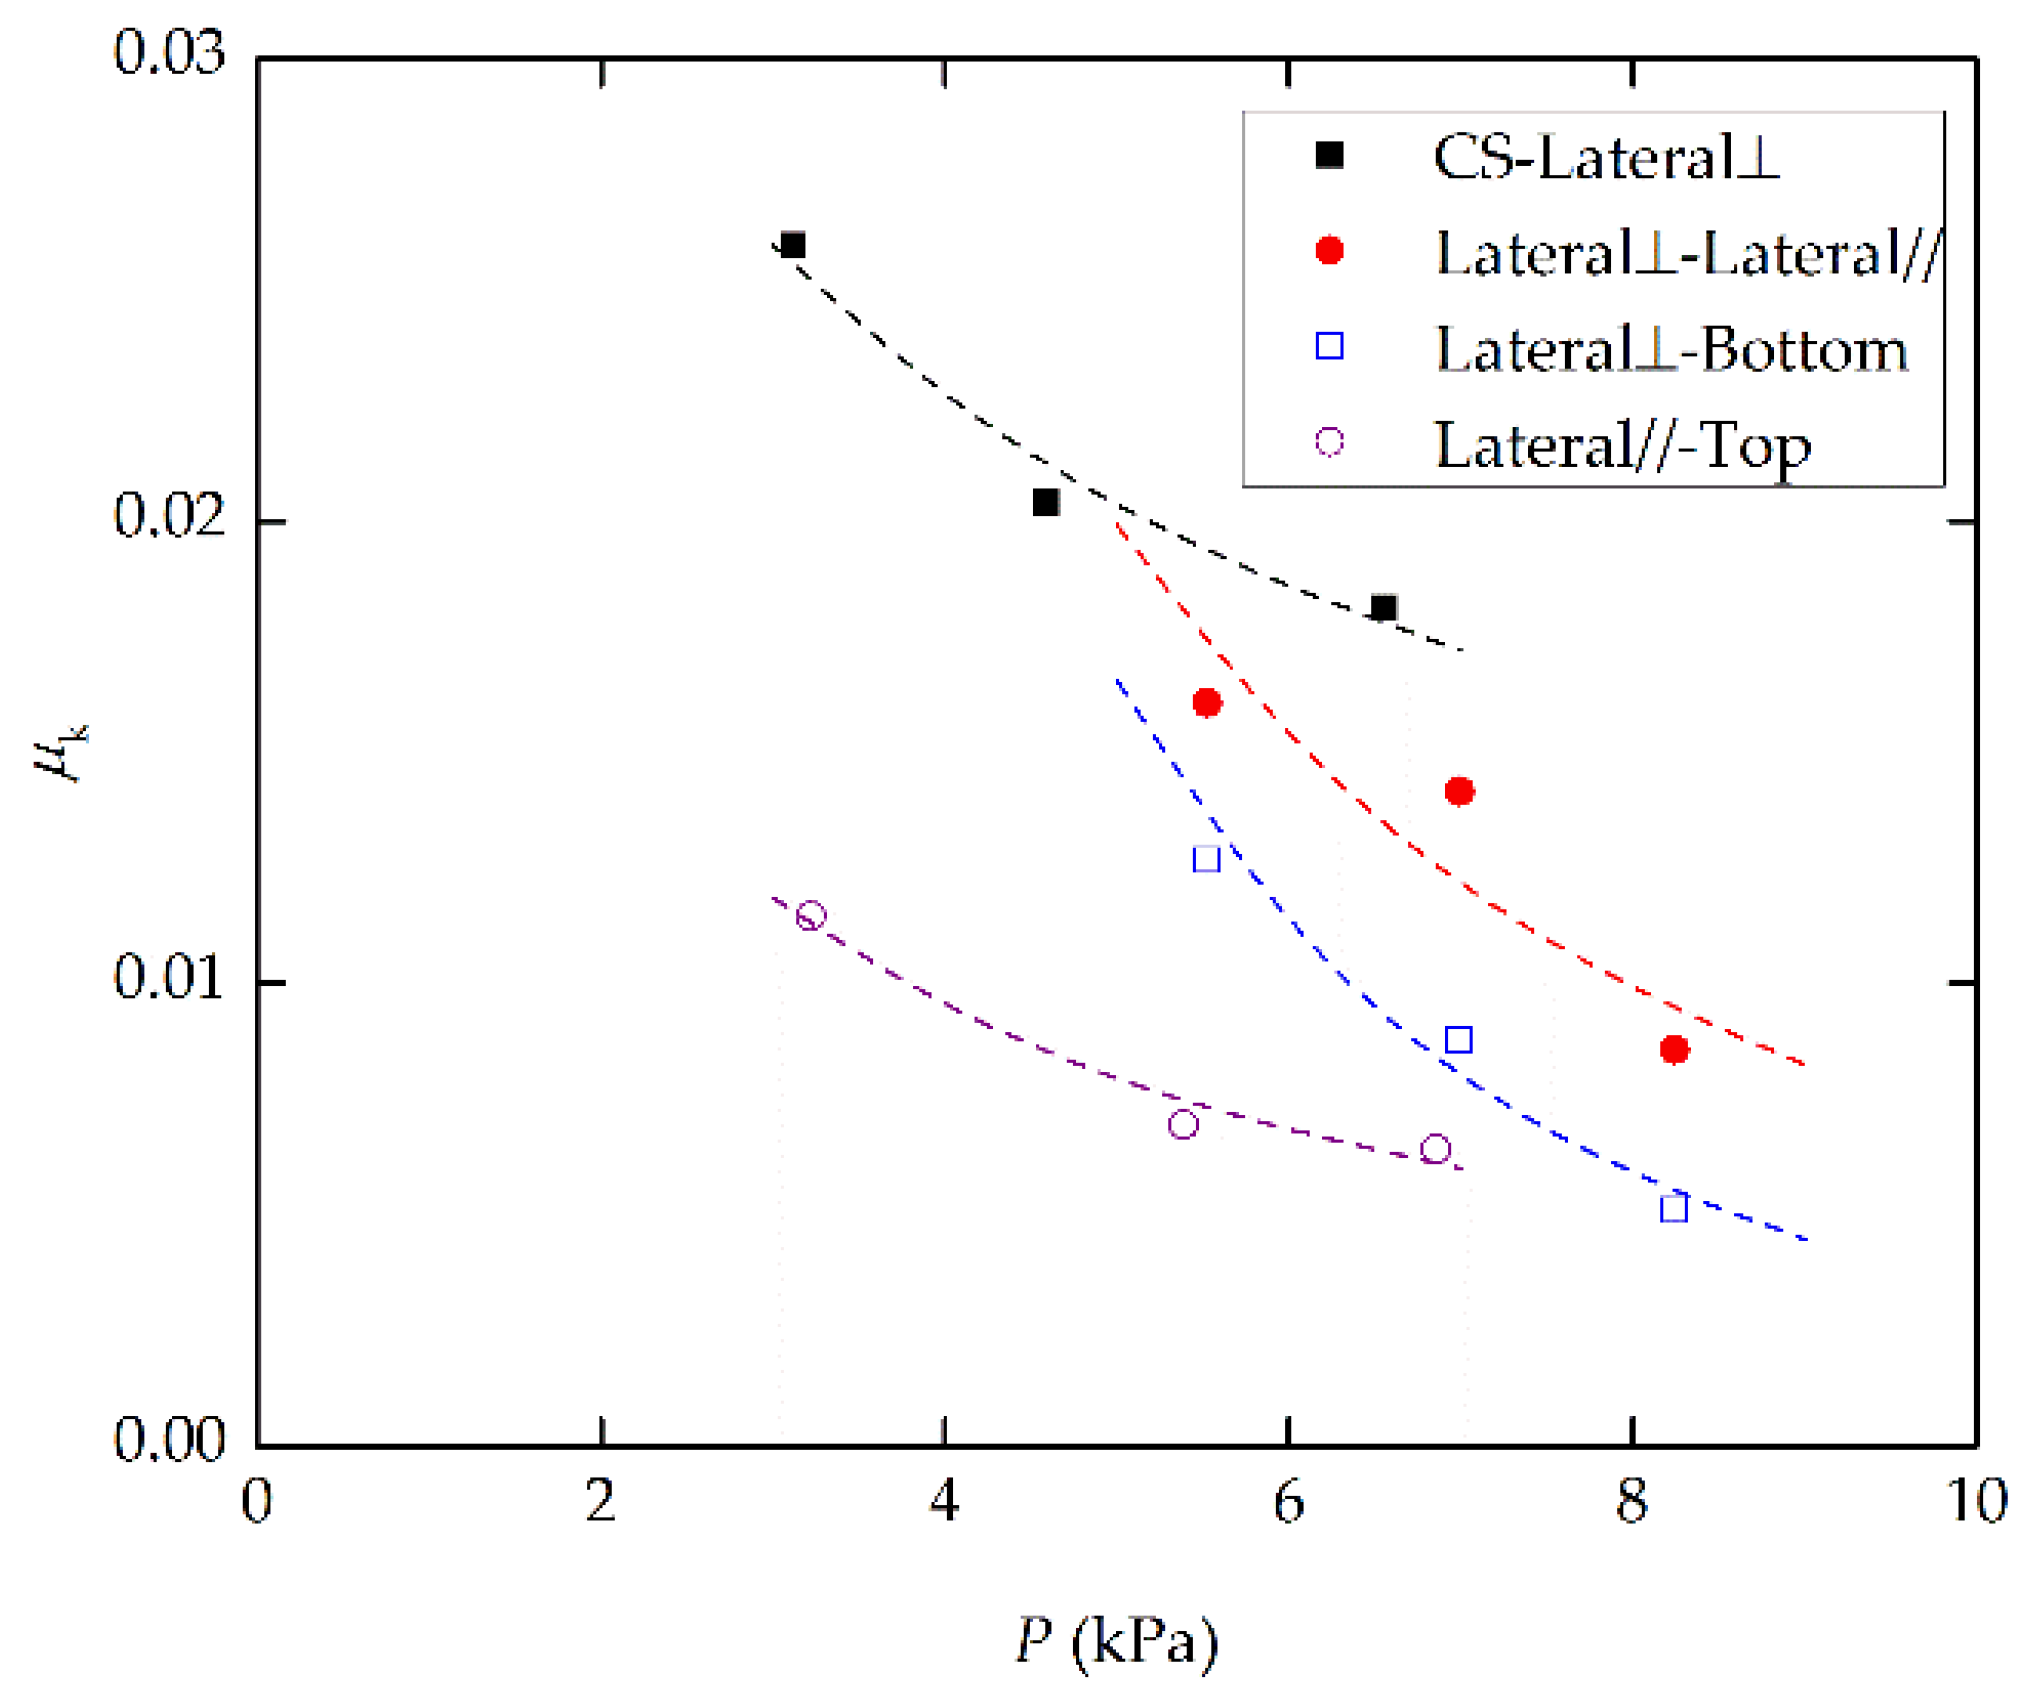
3.2. Effect of Normal Stress
The normal stress was determined by dividing the total weight of the slider, frame, and ballast by the apparent contact area. Figure 7 shows that μk varied with respect to normal stress in the cases of CS-Lateral⊥, Lateral⊥-Lateral//, Lateral⊥-Bottom, and Lateral//-Top, and a general trend was detected for μk to decrease with increasing normal stress. Similar trends were obtained by Oksanen and Keinonen [21], Maeno et al. [24], and Pritchard et al. [36]; one reason is that as normal load increases, the natural roughness of both contact surfaces or that of the softer surface is smoothed, yielding lower friction coefficients [36,37]. Mizukami and Maeno [42] and Makkonen and Tikanmäki [43] found that the decrease of μk with normal stress P could be expressed as a power law μk ∝ Pn, with the power n fitted as −0.32 and −0.25 using laboratory tests and a theoretical model respectively. To compare the current results with these previous reports, the same power law was used to fit the current test data. The results gave values of the power n ranging from −0.17 to −2.22, with a mean value of −0.73. Note that the objects in current study were sea ice while were fresh ice in studies of [42,43]. The salt in sea ice makes it softer than fresh ice, which is the possible reason for the lower n obtained in the study.
3.3. Effect of Sea Ice Columnar Grain Orientation
Figure 8 shows the variations of μk with velocity for SS, CS, and sea ice sliders sliding on ice cover in different directions in relation to the ice columnar grain orientation. The air temperature was the same in both cases shown in each subgraph, and the surface roughness of the lateral ice surface was assumed equal in the directions vertical and parallel to the ice columnar grain orientation. Figure 8 presents the mean values determined from coefficients at all normal stresses. The standard deviations in the two directions were small, indicating no obvious differences between them. To provide further justification for the diversity of μk for different grain orientations, rank sum tests were conducted as shown in each subgraph. The results gave statistical significances higher than 0.05, which confirmed that friction is independent of ice grain orientation. As for the effect of ice grain structure on friction, several previous investigations have been performed. Sukhorukov and Løset [37] also pulled ice blocks in lateral surface along an ice-top track in directions parallel and vertical to ice columnar grain orientation and found no differences in the kinetic friction coefficients between these two configurations. Kennedy et al. [23] examined the effect of grain size (2.5–6.0 mm) on the friction of granular freshwater ice sliding against itself, and no difference was observed. Schulson and Fortt [25] investigated the effect of grain type by measuring the μk of granular ice and S2 columnar ice on themselves and, no significant effect was detected.
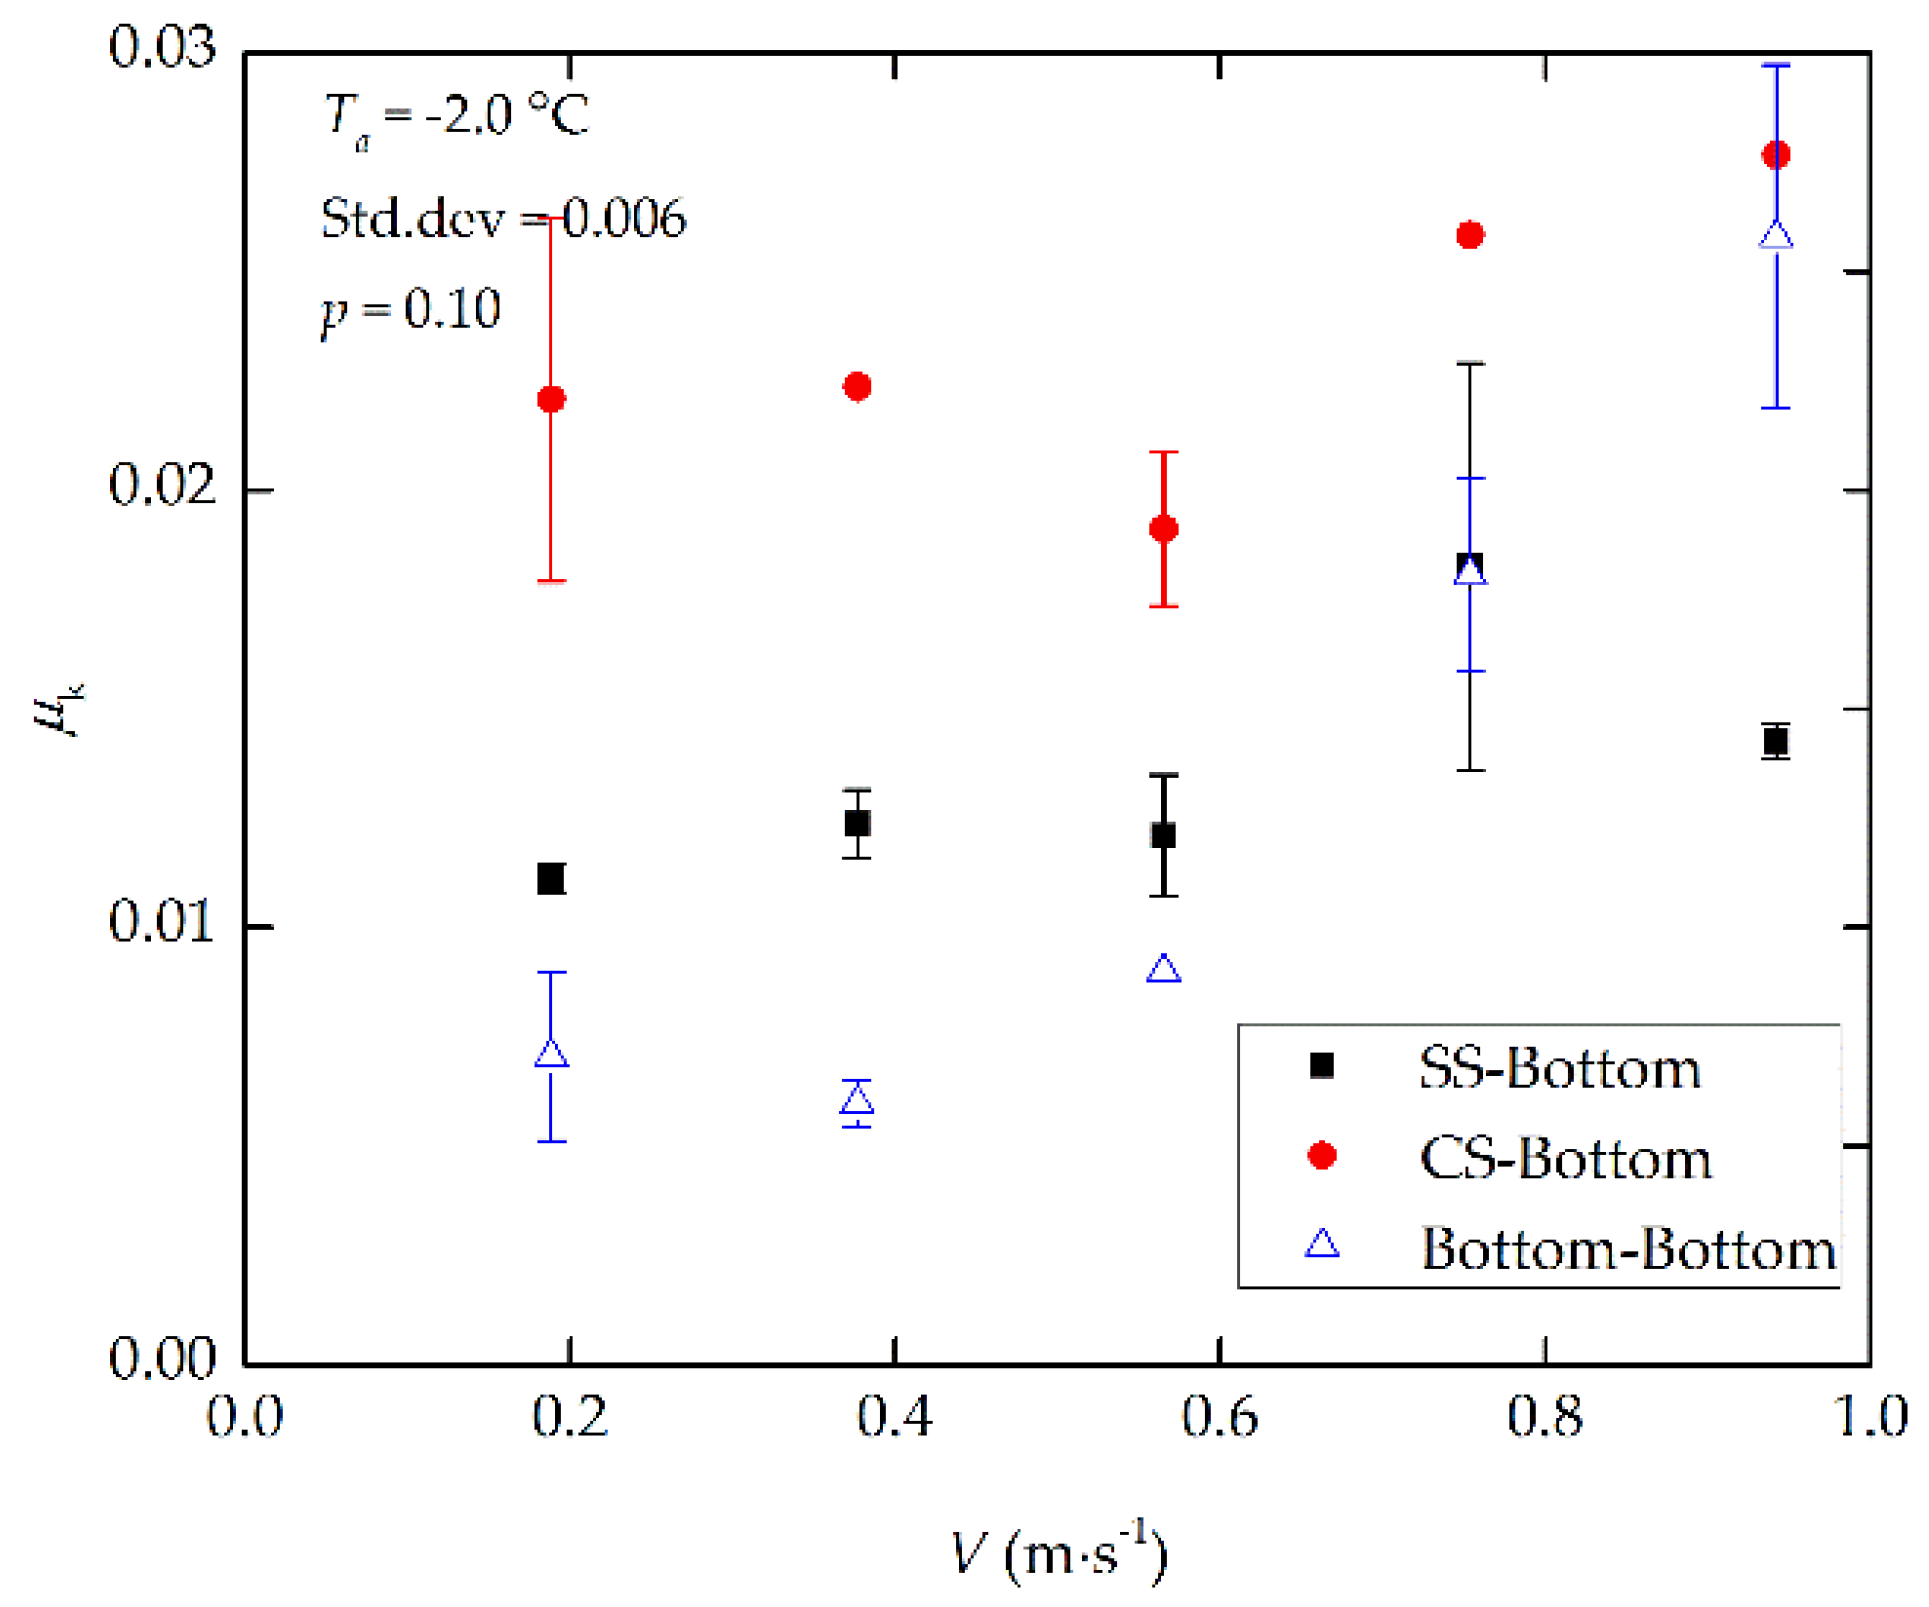
3.4. Effect of Contact Materials
Figure 9 shows the friction cases of different sliders (SS, CS, and bottom side of ice block) sliding on the same track (the Bottom track). The data were determined from coefficients at all tested normal stresses. The rank sum test gave a statistical significance higher than 0.05 (p = 0.10) for the data, showing no difference among them. However, the standard deviation of these data was high relative to the average value, showing that the datasets were scattered. One reason is that steel, coated steel, and natural ice normally have different surface roughnesses. A portion of the friction force can be attributed to the substantial surface adhesion occurring within the real contact area of the surface asperities [23], and therefore, the scatter was partly caused by the different surface roughnesses of the contact materials [29]. However, the surface of nature ice cover was not absolutely flat, and the scales of the bumps were larger than the surface roughness. The pure effect of the surface roughness might be covered by the bumps and was beyond the scope of the current study. The role of microcosmic surface characterization has been investigated in several previous laboratory studies using well-prepared samples [23,25,29].
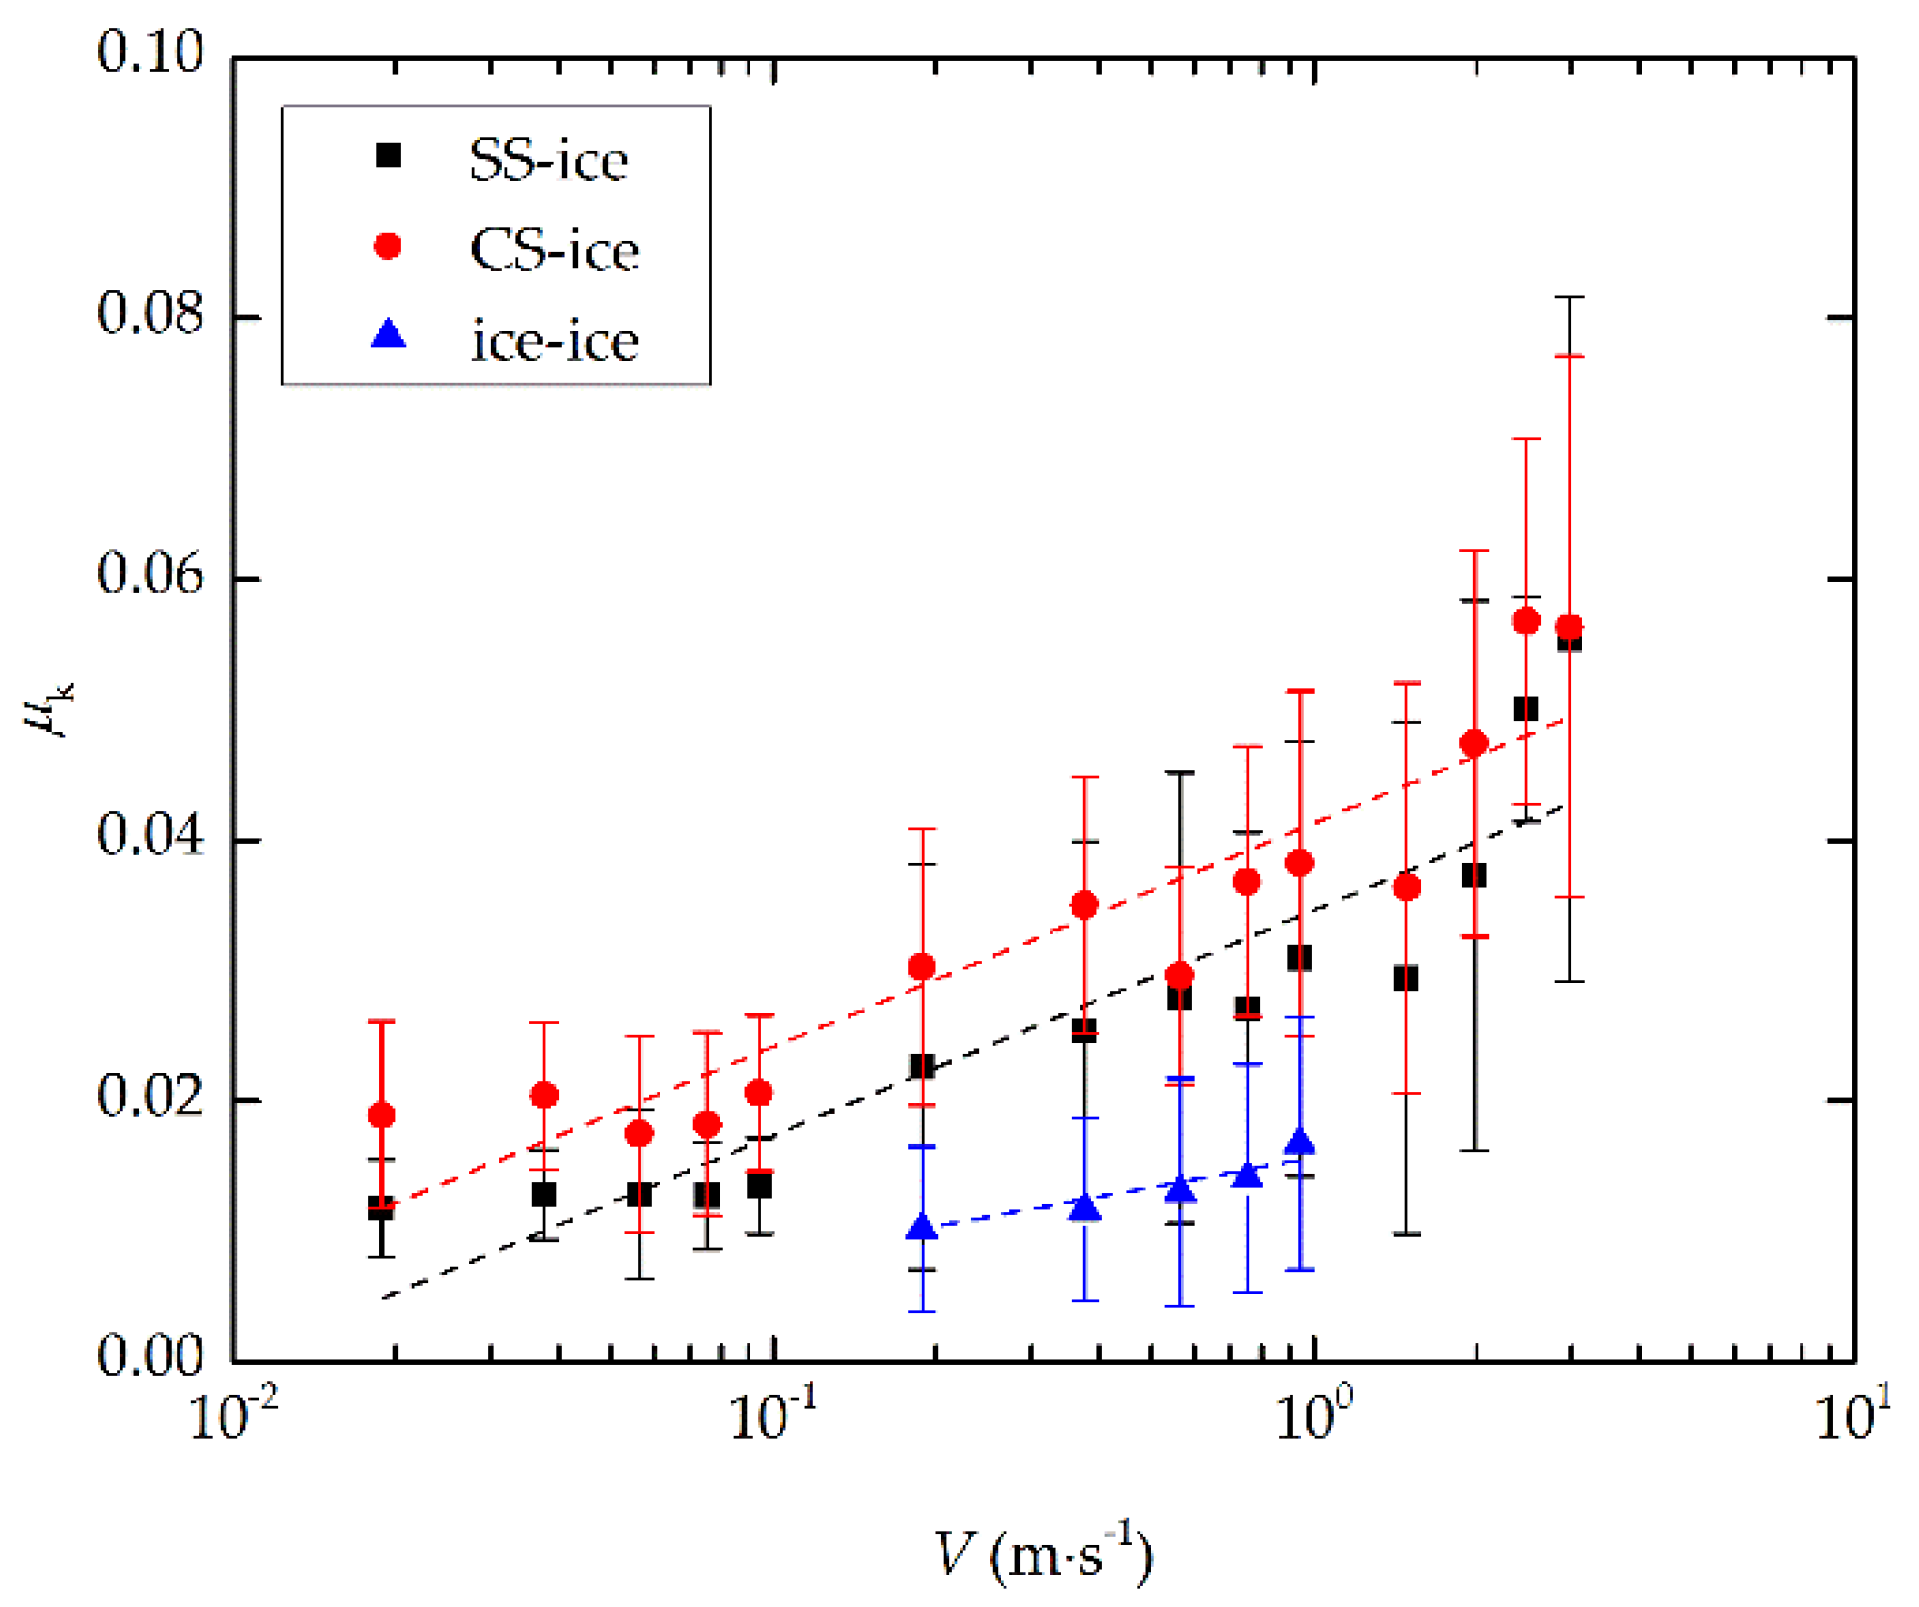
3.5. Effect of Sliding Velocity
Figure 8 and Figure 9 show the general trend that μk increases with increasing sliding velocity. With data averaged under different test conditions, Figure 10 depicts the variation of μk with sliding velocity in logarithmic coordinates. The error bars represent the standard deviation. μk exhibited an increasing trend over the whole investigated velocity range for each contact. A similar velocity strengthening of μk was also observed by Oksanen and Keinonen [21] in their ice-ice friction experiments at temperatures above −5 °C and over a velocity range of 0.5–3.0 m·s−1. Most previous experiments detected a decrease in μk with increasing sliding velocity, which was due to the low sliding velocity [22,37] and the low ambient temperatures [23,25,32] under the test conditions. Under these conditions, thin water films, which act as a lubricant, are produced at the sliding interface by frictional heat [24]. However, at high air temperatures in the present study, frictional heat is dominated by melting of ice and therefore the friction was dominated by the drag force of water and increased with increasing velocity [21,24].
4. Discussion
4.1. Uncertainty Analysis
4.1.1. Repeated Sliding
In present tests, sliders were pulled along ice tracks repeatedly. Under this condition, the softer one of the contact materials may change its surface roughness because of deformation and breakage of the contacting asperities after repeated sliding. This could influence the experimental accuracy, but no obvious trend of μk with run number was detected in the tests in this study, because of the limited number of repeats. Sukhorukov and Løset [37] repeatedly pulled the same surface of an ice block over the same ice track up to 40 times at a velocity of approximately 0.1 m·s−1. They obtained the highest μk in the first run and decreasing values in the following runs because of the surface smoothing after repeated slides.
4.1.2. System Stiffness
The stiffness of a loading system has an effect on the stick-slip of ice friction [25,27]. Low machine stiffness enhances the tendency to stick-slip at low normal stress [44]. Because the steel wire used to pull the sliders in the present experiment was compliant, the loading system was insufficiently rigid, thus increasing the occurrence of stick-slip. Similarly, Pritchard et al. [36] also used a steel cable to pull an ice block on a natural ice surface. Their original intention was to determine the sliding friction of sea ice, but the tests ended up as an observation of stick-slip motion.
4.2. Surface Roughness
The microcosmic surface characterization is a critical parameter in the contact mechanics. However, the surface of nature ice cover is always not flat and has bumps. Though the obvious bumps were cleaned in the current study, the inconspicuous bumps still had scales larger than the microcosmic surface roughness. The pure effect of the surface roughness could be covered by the bumps. From the view of ice navigation, the nature ice surface morphology is various, including bare ice, snow cover, ice ridge and melt pond, which surfaces are not even, and the scales of bumps are larger than the microscopic surface characterization. Moreover, the ice surface is known to be very reactive and its nature may change easily by contact with other materials [24]. Therefore, a detailed study on the effect of surface roughness on μk is beyond the scope of the current work, which can be investigated in laboratory using well-prepared ice samples. Saeki et al. [29] conducted the surface analysis on three kinds of concrete and four kinds of steel plates using a high-accuracy surface roughness meter and pulled them on ice samples. Their results showed that the friction coefficient had no apparent correlation with wavelength of irregularities, but increased with increasing mean wave height and mean steepness and with decreasing mean sharpness. Schulson and Fortt [25] conducted ice-ice friction tests at −10 °C and 10−4 m·s−1 using fresh ice of surface roughness Ra between 0.1 and 12 μm, and an increasing trend was detected as μk ∝ Ra0.08 (R2 = 0.98). Kennedy et al. [23] measured the Ra in directions parallel and perpendicular to sliding before and after ice-ice friction under 20 kPa at −3–−10 °C. After testing, the roughness increased by about two to four times when measured along the sliding direction, and the increased roughness was greater after tests at lower velocity than at higher velocity, which corresponds to the high friction coefficient at the lower speed.
4.3. Stick-Slip
Stick-slip motion is a manifestation of ice friction [25]. Many previous experiments have reported the stick-slip phenomenon in ice-ice friction using different types of loading system [23,24,35,37] (see Table 1). In the present tests, stick-slip was obtained in ice-ice contact at a velocity between 0.02 m·s−1 and 0.10 m·s−1, which is higher than in previous reports. When this observation is considered with the data listed in Table 1, a trend becomes apparent: the softer the loading system, the higher is the velocity at which stick-slip of ice-ice friction occurs. Because the loading systems in the present study and [37] are less rigid, while the velocity ranges of stick-slip are higher. In present tests, stick-slip was also observed in steel-ice friction at a velocity of 0.02 m·s−1, which demonstrates that stick-slip occurs not only between ice and ice. Furthermore, results revealed that the frequency of load oscillations in stick-slip motion increased with increasing sliding velocity because the frequency of stick-slip in Top-Bottom friction rose from 0.28 Hz to 0.96 Hz with velocity increasing from 0.04 m·s−1 to 0.10 m·s−1. The frequency was found to be independent of the normal stress because the frequency of load oscillations of stick-slip of SS-Top remained at approximately 30.10 Hz in spite of the increase in normal stress from 3.10 kPa to 6.56 kPa.
Because of the cyclic changes of motion state during stick-slip, the pulling force contains not only friction force but also inertial force. When calculating the μk of stick-slip in present study, the same way as calculating the μk of steady sliding was employed, which used the ratio of the average pulling force after initiation to the normal load [23,37]. Pritchard et al. [36] took into account inertial force when calculating μk of stick-slip in their field sea ice friction tests and developed a model based on the force history during stick-slip cycles. The μk of stick-slip in current study was determined using these two methods, and the value calculated using the former method was only 0.43% greater than the value calculated using the latter method.
4.4. Effect of Air Temperature
Temperature is one of the most important factors influencing ice friction [21,25,37]. In current study, Figure 11 shows that μk at higher air temperature was greater than at lower air temperature. The similar observation was also reported by Maeno et al. [24]. One reason is that the ice hardness is dependent of temperature [43] and decreased with increasing temperature, especially near the melting point [21]. Therefore, higher temperature reduces the ice hardness, thus, increases the μk [21,43]. In particular, the objects in current study were sea ice, in which case the melt water layer at the interface was brine layer. At low air temperature, some brine is expelled out of sea ice and forms on the ice surface. The effective solid-solid contact area would be reduced due to the salt at the ice-substrate interface, which weakens the ice adhesion strength [45]. Hence, the salt might be another reason for the variation of μk with air temperature.
4.5. Velocity Dependence
From the viewpoint of ice navigation, velocity is a critical parameter for ice friction. To quantify the velocity dependence of μk, the rate- and state- dependent model developed from an engineering perspective was employed [35]. The model can be expressed as
where V* is a characteristic velocity for dimensional consistency, chosen here as 10−2 m·s−1, and μ0 and A are empirically determined constants. θ is a state variable related to slip history, which can be expressed as
where t is time, L is a characteristic slip length, and B is an empirically determined constant. When sliding velocity is constant, θ is constant, = 0, and . Then, μk can be expressed as
where C = A − B. Based on Equation (4), the velocity dependence was determined experimentally in this study. Table 2 gives the estimated empirical parameters and determination coefficients obtained by substituting the data in Figure 10 into Equation (4). The high determination coefficients demonstrate that the velocity dependence is well quantified, and Figure 12 shows comparison of the results.
4.6. Approximate Comparisons between Model Estimation and Experimental Data
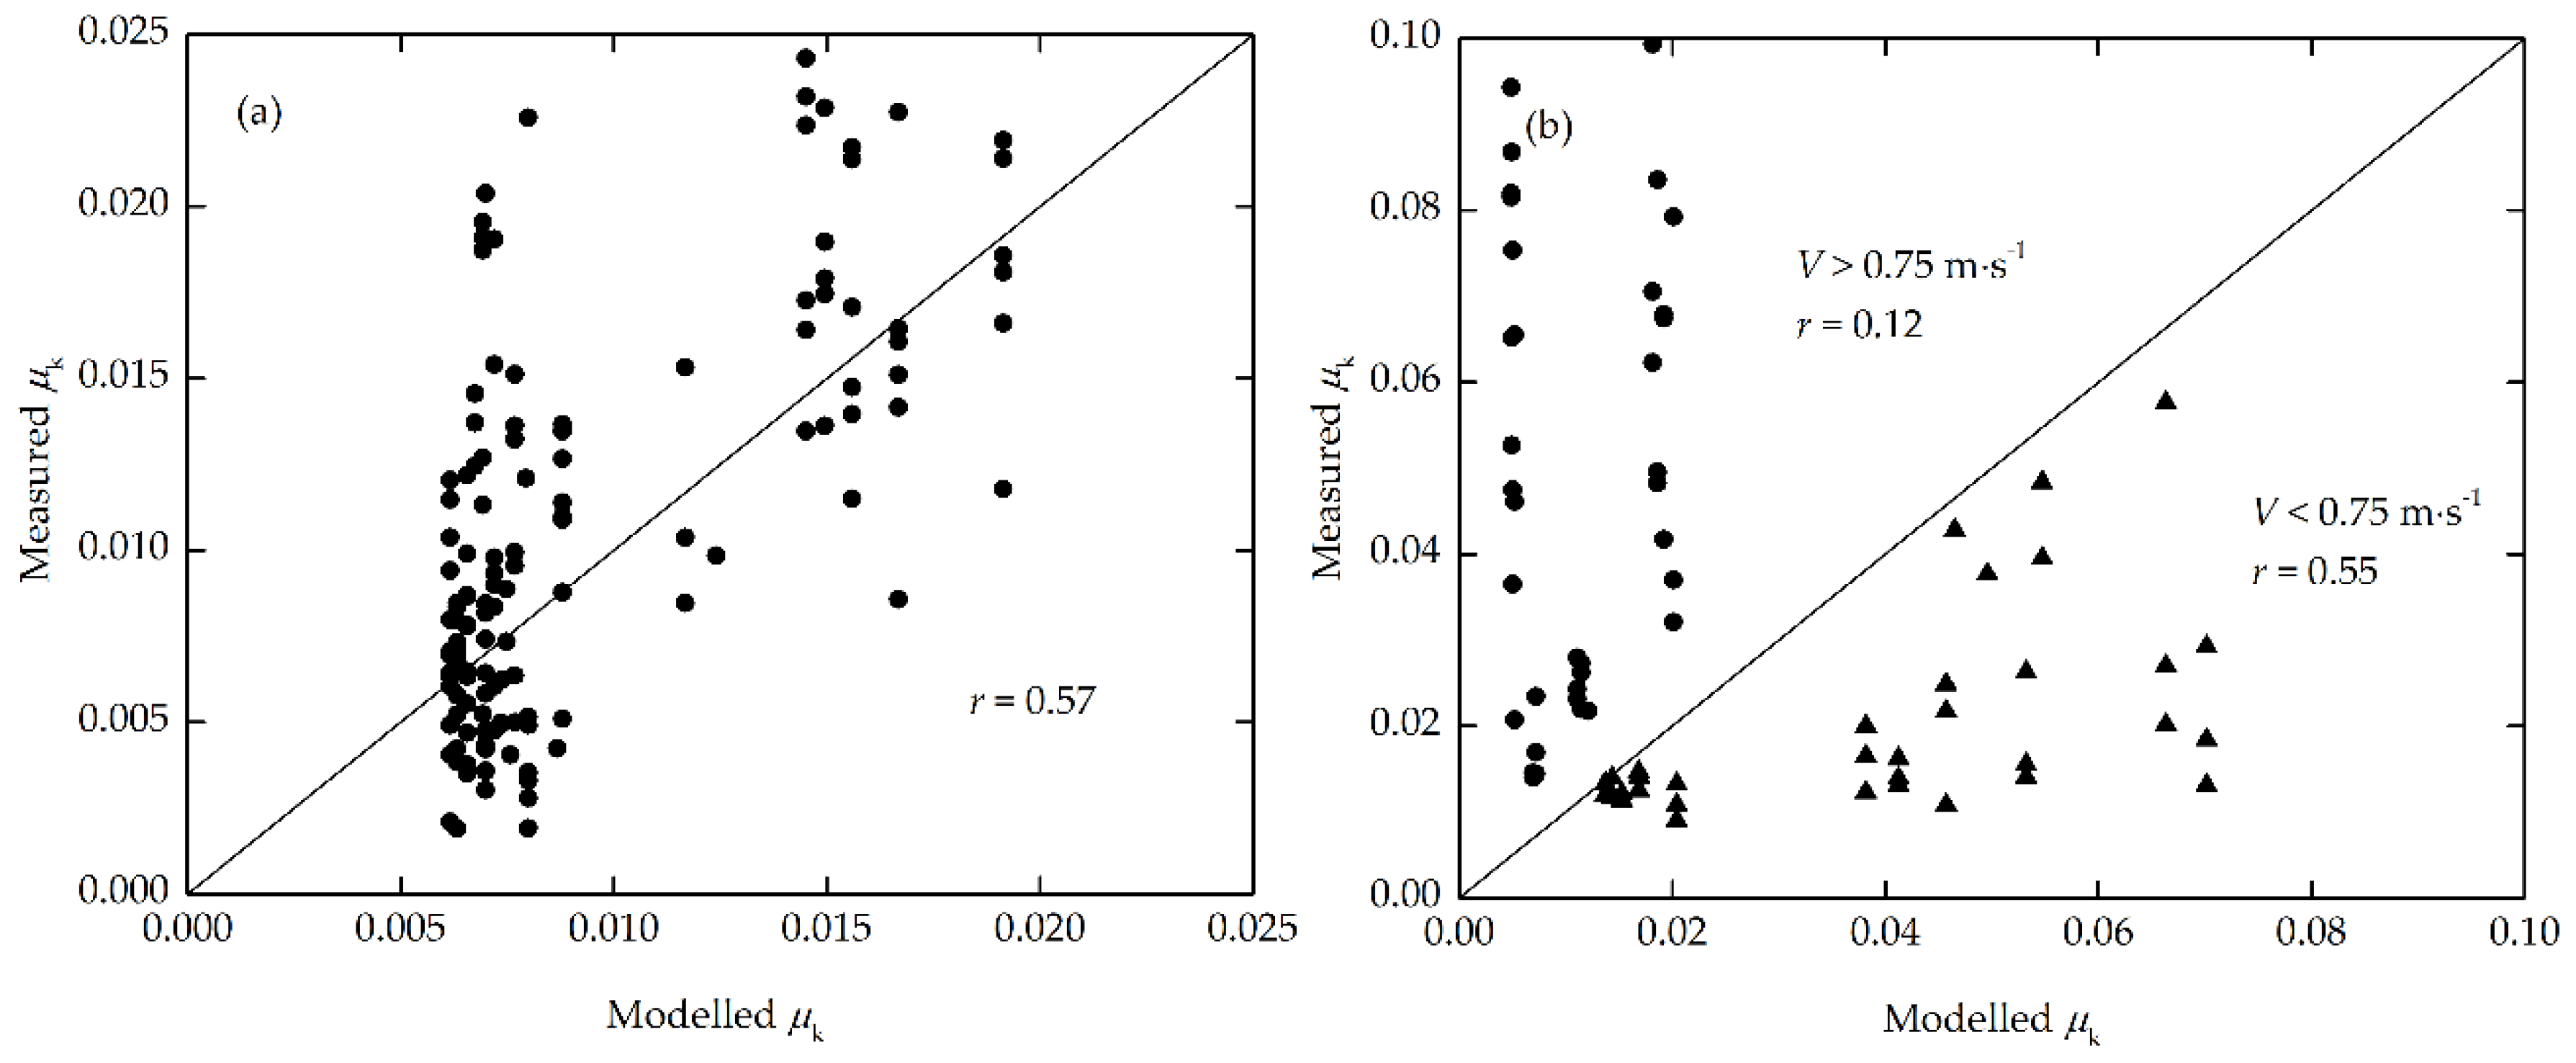
Makkonen and Tikanmäki recently proposed a theoretical model of μk based on the thermodynamic process of ice friction [43] and verified it using several laboratory experiment data. Here, the field experiment data in current work was used to compare approximately with the estimations of physical model. In the physical model, the differences between melting point and the temperatures of slider and substrate need to be input. Because of reaching thermal equilibrium with the air, the temperatures of sliders were the air temperature. The mean value of the temperatures of surface and bottom of ice cover was employed as the temperature of ice track, and they were assumed as the air temperature and melting point respectively. Because of the low salinity of sea ice in current study, the physical parameters of sea ice used in the model were chosen as those of fresh ice (see Table 1 in [43]), except that the ice density was measured as 913.2 kg·m−3. The only unknown parameter in the model is contact size, and it was employed as 1 mm here based on the assumption in [43]. The ice–ice and steel–ice experimental data were compared with the modelled estimations, and Figure 13 shows the results. The modelled values agreed well with the measured data for ice-ice friction with a correction coefficient of 0.57, and the modelled values were only 7.2% greater than the measured data. However, for steel-ice friction, the modelled values underestimated measured data by 70.0% at velocity higher than 0.75 m·s−1 and overestimated measured data by 115.3% at velocity lower than 0.75 m·s−1. While the relationship between modelled and measured values showed a relative stronger correlation coefficient at the former velocity regime (r = 0.55).
5. Conclusions
To obtain a better understanding of the ice friction during ice navigation, a series of field experiments on sea ice, stainless steel (SS), and coated steel (CS) sliding on natural sea ice cover was conducted. The effects of normal stress, contact material, ice columnar grain orientation, and sliding velocity on the kinetic friction coefficient (μk) were investigated under air temperatures higher than −5.0 °C for the test period.
The results showed that μk decreased with increasing normal stress. While μk showed no significant difference for sliding parallel or perpendicular to columnar grain orientation, indicating that μk is independent of grain orientation. Sliders of sea ice, SS, and CS sliding on the same ice track showed relatively large scatter in μk, partly because of the different surface roughnesses of the materials. An increase in μk wfith increasing velocity was found in the velocity regime investigated for ice-ice contact and steel-ice contact because of the viscous resistance of water film. The velocity dependence of μk was quantified using the rate- and state-dependent model [35], and the results showed that μk logarithmically increased with increasing velocity in the range investigated.
Stick-slip motion was observed in this experiment, not only on ice-ice contact, but also on steel-ice contact. A tendency that low machine stiffness enhances the stick-slip motion at high sliding velocity was found by comparing the velocity ranges of stick-slip in present study with previous reports. The frequency of load oscillations in stick-slip was also found to increase with increasing sliding velocity, but remained independent of normal stress.
With the anticipated future boom in Arctic navigation in summer, the data collected in this study provide insights into the friction between sea ice and a vessel’s hull, as well as other offshore structures. It must be recognized, however, that the experiments in this study were only an approximation to real-world ice navigation and that the full natural process would be more complex. Ocean waves, crushing and fracture of sea ice, and variations in temperature, salinity, and ice surface morphology may further affect friction. Restricted by the limited experimental conditions in field, some effects were not or not detailed investigated in current work such as sea ice salinity, surface morphology, and normal stress. These effects will be detected in a laboratory experiment in future.
Author Contributions
Qingkai Wang and Zhijun Li conceived and designed the experiments; Qingkai Wang and Xiaowei Cao performed the experiments; Qingkai Wang analyzed the data and wrote the paper; Zhijun Li, Peng Lu, and Matti Leppäranta contributed to discussions and to revising the manuscript.
Acknowledgments
This work was supported by the National Key Research and Development Program of China (2016YFC1402702), the Global Change Research Program of China (2015CB953901), the National Natural Science Foundation of China (51639003, 51579028), and the High Technology of Ship Research Project of the Ministry of Industry and Information Technology (350631009). We thank Zan Xiao and Jiankang Wang for their contributions to the field work. We thank Kari Kolari for the help in completing the paper and Lasse Makkonen for helpful discussions. We are grateful to anonymous reviewers of this manuscript for helpful comments.
Conflicts of Interest
The authors declare no conflict of interest. The founding sponsors had no role in the design of the study; in the collection, analyses, or interpretation of data; in the writing of the manuscript, and in the decision to publish the results.
References
- Comiso, J.C.; Parkinson, C.L.; Gersten, R.; Stock, L. Accelerated decline in the Arctic sea ice cover. J. Geophys. Res. 2008, 35, 1–6. [Google Scholar] [CrossRef]
- Stroeve, J.C.; Kattsov, V.; Barrett, A.; Serreze, M.; Pavlova, T.; Holland, M.; Meier, W.N. Trends in Arctic sea ice extent from CMIP5, CMIP3 and observations. Geophys. Res. Lett. 2012, 39, L16502. [Google Scholar] [CrossRef]
- Renner, A.H.H.; Gerland, S.; Haas, C.; Spreen, G.; Beckers, J.F.; Hansen, E.; Nicolaus, M.; Goodwin, H. Evidence of Arctic sea ice thinning from direct observations. Geophys. Res. Lett. 2014, 41, 5029–5036. [Google Scholar] [CrossRef] [Green Version]
- Lindsay, R.; Schweiger, A. Arctic sea ice thickness loss determined using subsurface, aircraft, and satellite observations. Cryosphere 2015, 9, 269–283. [Google Scholar] [CrossRef]
- Khon, V.C.; Mokhov, I.I. Arctic climate changes and possible conditions of Arctic navigation in the 21st century. Izv. Atmos. Ocean. Phys. 2010, 46, 14–20. [Google Scholar] [CrossRef]
- Liu, M.; Kronbak, J. The potential economic viability of using the Northern Sea Route (NSR) as an alternative route between Asia and Europe. J. Transp. Geogr. 2010, 18, 434–444. [Google Scholar] [CrossRef]
- Rothwell, D.R. International straits and trans-Arctic navigation. Ocean Dev. Int. Law 2012, 43, 267–282. [Google Scholar] [CrossRef]
- Shibata, H.; Izumiyama, K.; Tateyama, K.; Enomoto, H.; Takahashi, S. Sea-ice coverage variability on the Northern Sea Routes, 1980–2011. Ann. Glaciol. 2013, 54, 139–148. [Google Scholar] [CrossRef]
- Wang, Q.; Li, Z.; Lu, P.; Lei, R.; Cheng, B. 2014 summer Arctic sea ice thickness and concentration from shipborne observations. Int. J. Digit. Earth 2018, 1–17. [Google Scholar] [CrossRef]
- Zhang, M.; Zhang, D.; Fu, S.; Yan, X.; Goncharov, V. Safety distance modeling for ship escort operations in Arctic ice-covered waters. Ocean Eng. 2017, 146, 202–216. [Google Scholar] [CrossRef]
- Liukkonen, S. Friction panel measurements in full-scale and model-scale icebreaking ship tests. J. Offshore Mech. Arct. Eng. 1989, 111, 251–253. [Google Scholar] [CrossRef]
- Valanto, P. The resistance of ships in level ice. Soc. Nav. Archit. Marine Eng. 2001, 109, 53–83. [Google Scholar]
- Petrenko, V.F. The effect of static electric fields on ice friction. J. Appl. Phys. 1994, 76, 1216–1219. [Google Scholar] [CrossRef]
- Timco, G.W.; Frederking, R.M.W. Compressive strength of sea ice sheets. Cold Reg. Sci. Technol. 1990, 17, 227–240. [Google Scholar] [CrossRef]
- Kovacs, A. Estimating the full-scale flexural and compressive strength of first-year sea ice. J. Geophys. Res. 1997, 102, 8681–8689. [Google Scholar] [CrossRef]
- Han, H.; Li, Z.; Huang, W.; Lu, P.; Lei, R. The uniaxial compressive strength of Arctic summer sea ice. Acta Oceanol. Sin. 2015, 34, 129–136. [Google Scholar] [CrossRef]
- Moslet, P.O. Field testing of uniaxial compression strength of columnar sea ice. Cold Reg. Sci. Technol. 2007, 48, 1–14. [Google Scholar] [CrossRef]
- Lu, W.; Lubbad, R.; Løset, S.; Kashafutdinovet, M. Fracture of an ice floe: Local out-of-plane flexural failures versus global in-plane splitting failure. Cold Reg. Sci. Technol. 2016, 123, 1–13. [Google Scholar] [CrossRef]
- Lian, J.; Ouyang, Q.; Zhao, X.; Liu, F.; Qi, C. Uniaxial compressive strength and fracture mode of lake ice at moderate strain rates based on a digital speckle correlation method for deformation measurement. Appl. Sci. 2017, 7, 495. [Google Scholar] [CrossRef]
- Wang, Q.; Li, Z.; Lei, R.; Lu, P.; Han, H. Estimation of the uniaxial compressive strength of Arctic sea ice during melt season. Cold Reg. Sci. Technol. 2018, 151, 9–18. [Google Scholar] [CrossRef]
- Oksanen, P.; Keinonen, J. The mechanism of friction of ice. Wear 1982, 78, 315–324. [Google Scholar] [CrossRef]
- Yasutome, A.; Arakawa, M.; Maeno, N. Measurements of ice-ice friction coefficients. J. Jpn. Soc. Snow Ice 1999, 61, 437–443. [Google Scholar] [CrossRef]
- Kennedy, F.E.; Schulson, E.M.; Jones, D.E. The friction of ice on ice at low sliding velocities. Philos. Mag. A 2000, 80, 1093–1110. [Google Scholar] [CrossRef]
- Maeno, N.; Arakawa, M.; Yasutome, A.; Mizukami, N.; Kanazawa, S. Ice-ice friction measurements and water lubrication and adhesion-shear mechanisms. Can. J. Phys. 2003, 81, 241–249. [Google Scholar] [CrossRef]
- Schulson, E.M.; Fortt, A.L. Friction of ice on ice. J. Geophys. Res. B Solid Earth 2012, 117, 1–18. [Google Scholar] [CrossRef]
- Frederking, R.; Barker, A. Friction of sea ice on steel for condition of varying speeds. In Proceedings of the 12th International Offshore and Polar Engineering Conference, Kitakyushu, Japan, 26–31 May 2002. [Google Scholar]
- Wallen-Russell, C.; Lishman, B. The friction of saline ice on aluminium. Adv. Tribol. 2016, 2016, 1–7. [Google Scholar] [CrossRef] [Green Version]
- Tusima, K.; Tabata, T. Friction measurements of sea ice on flat plates of metals, plastics and coatings. In Proceedings of the 5th International Conference on Port and Ocean Engineering under Arctic Conditions, Trondheim, Norway, 23–30 August 1979. [Google Scholar]
- Saeki, H.; Ono, T.; Nakazawa, N.; Sakai, M.; Tanaka, S. The coefficient of friction between sea ice and various materials used in offshore structures. J. Energy Resour. Technol. 1986, 108, 65–71. [Google Scholar] [CrossRef]
- Evans, D.C.B.; Nye, J.F.; Cheeseman, K.J. The kinetic friction of ice. Proc. R. Soc. A Math. Phys. Eng. Sci. 1976, 347, 493–512. [Google Scholar] [CrossRef]
- Blackford, J.R.; Skouvaklis, G.; Purser, M.; Koutsos, V. Friction on ice: stick and slip. Faraday Discuss. 2012, 156, 243–254. [Google Scholar] [CrossRef] [PubMed]
- Akkok, M.; Ettles, C.M.M.; Calabrese, S.J. Parameters affecting the kinetic friction of ice. J. Tribol. 1987, 109, 552–559. [Google Scholar] [CrossRef]
- Higgins, D.D.; Marmo, B.A.; Jeffree, C.E.; Koutsos, V.; Blackford, J.R. Morphology of ice wear from rubber-ice friction tests and its dependence on temperature and sliding velocity. Wear 2008, 265, 634–644. [Google Scholar] [CrossRef]
- Löptien, U.; Axell, L. Ice and AIS: Ship speed data and sea ice forecasts in the Baltic Sea. Cryosphere 2014, 8, 2409–2418. [Google Scholar] [CrossRef] [Green Version]
- Lishman, B.; Sammonds, P.; Feltham, D. A rate and state friction law for saline ice. J. Geophys. Res. Ocean. 2011, 116, 1–13. [Google Scholar] [CrossRef]
- Pritchard, R.S.; Knoke, G.S.; Echert, D.C.S. Sliding friction of sea ice blocks. Cold Reg. Sci. Technol. 2012, 76–77, 8–16. [Google Scholar] [CrossRef]
- Sukhorukov, S.; Løset, S. Friction of sea ice on sea ice. Cold Reg. Sci. Technol. 2013, 94, 1–12. [Google Scholar] [CrossRef]
- Huang, W.; Lei, R.; Han, H.; Li, Z. Physical structures and interior melt of the central Arctic sea ice/snow in summer 2012. Cold Reg. Sci. Technol. 2016, 124, 127–137. [Google Scholar] [CrossRef]
- Li, Z.; Kang, J.; Pu, Y. Characteristics of the Bohai Sea and Arctic sea ice fabrics and crystals. Acta Oceanol. Sin. 2003, 25, 48–53. (In Chinese) [Google Scholar]
- Weeks, W.F.; Ackley, S.F. The growth, structure and properties of sea ice. In The Geophysics of Sea Ice; Unterstiener, N., Ed.; Plenum: New York, NY, USA, 1986; Volume 146, pp. 9–164. [Google Scholar]
- Lemke, P. The Expedition of the Research Vessel “Polarstern” to the Antarctic in 2006 (ANT-XXIII/7); Alfred Wegener Institute for Polar and Marine Research: Bremerhaven, Germany, 2009; pp. 1866–3192. [Google Scholar]
- Mizukami, N.; Maeno, N. Normal stress dependence of ice-ice friction coefficients. J. Jpn. Soc. Snow Ice 2000, 62, 515–521. [Google Scholar] [CrossRef]
- Makkonen, L.; Tikanmäki, M. Modeling the friction of ice. Cold Reg. Sci. Technol. 2014, 102, 84–93. [Google Scholar] [CrossRef]
- Dieterich, J.H. Time-dependent friction and the mechanics of stick-slip. Pure Appl. Geophys. 1978, 116, 790–806. [Google Scholar] [CrossRef]
- Makkonen, L. Ice adhesion—Theory, measurements and countermeasures. J. Adhes. Sci. Technol. 2012, 26, 413–445. [Google Scholar] [CrossRef]
Figure 1.
Field ice friction experiment: (a) gear motor; (b) ice block sliding on its bottom along the Top track; (c) iron blocks, coated steel (CS) plate (blue), and stainless steel (SS) plate (silver); (d) SS plate sliding along the Top track with two iron blocks inside.
Figure 1.
Field ice friction experiment: (a) gear motor; (b) ice block sliding on its bottom along the Top track; (c) iron blocks, coated steel (CS) plate (blue), and stainless steel (SS) plate (silver); (d) SS plate sliding along the Top track with two iron blocks inside.
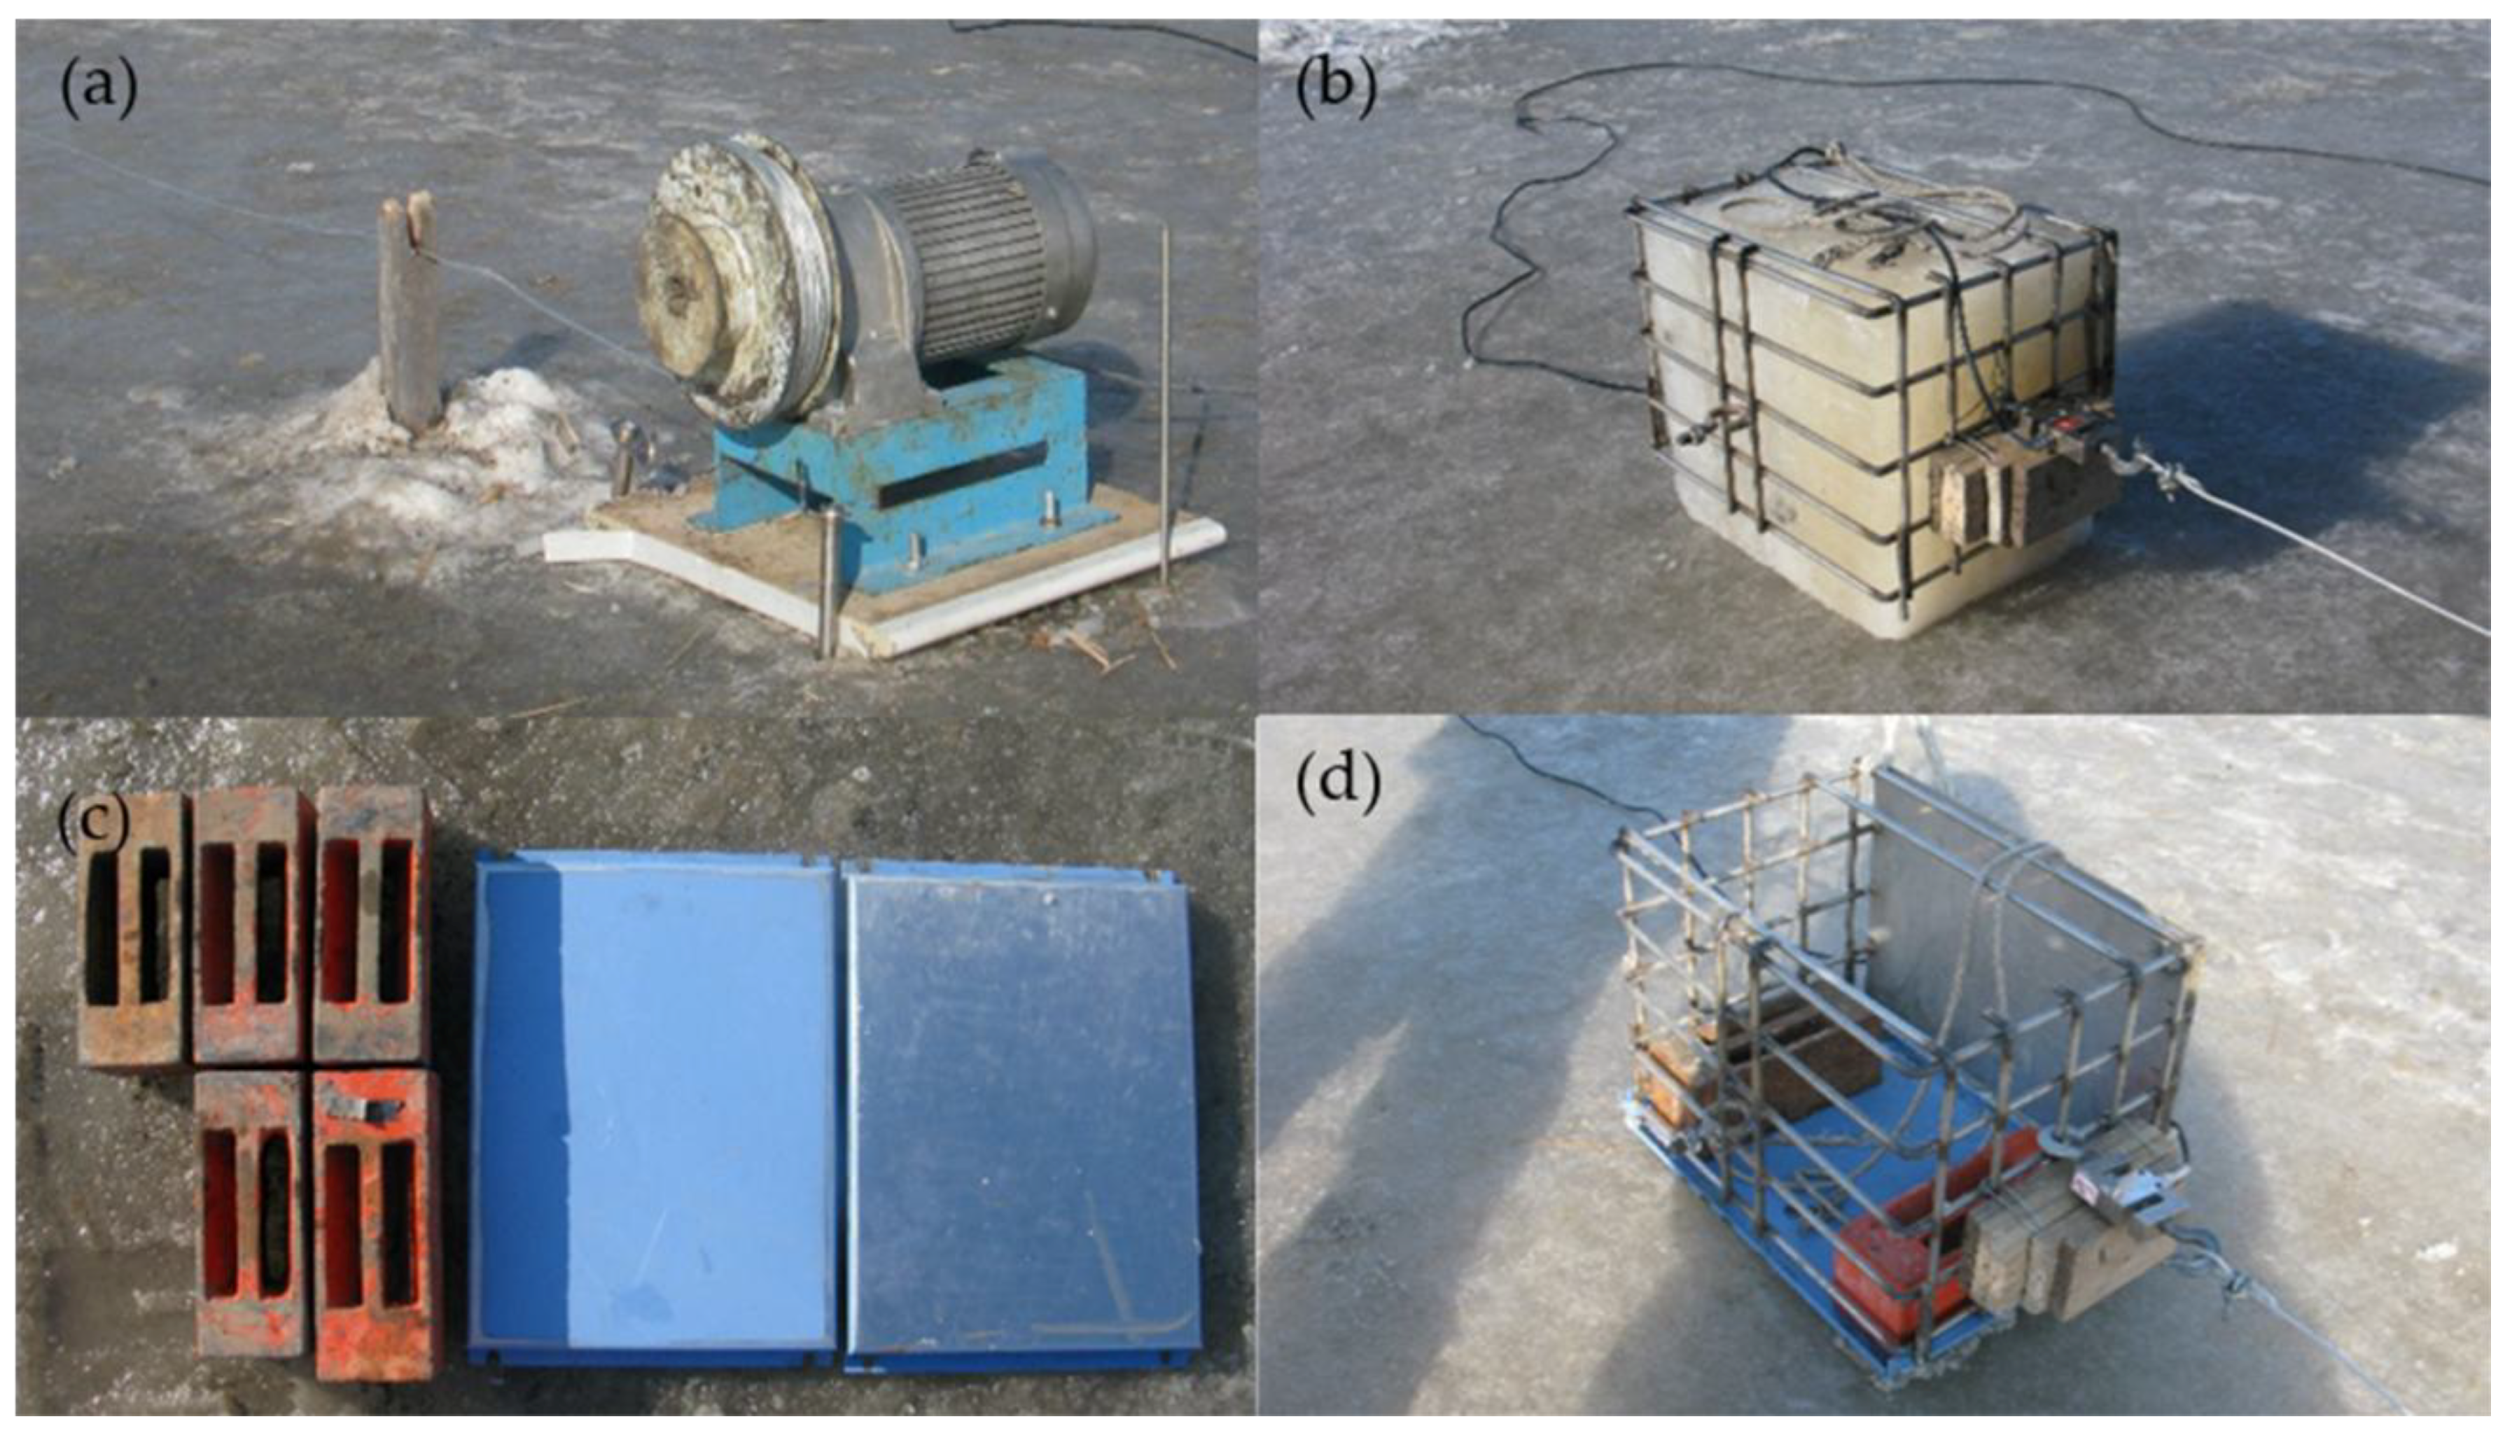
Figure 2.
Distributions of (a) along-track velocity and (b) vertical-track velocity of the icebreaker during the ramming process compared to normal distributions (solid lines). Data are from the shipboard recorded velocity during the Antarctic expedition of the research vessel Polarstern in 2006.
Figure 2.
Distributions of (a) along-track velocity and (b) vertical-track velocity of the icebreaker during the ramming process compared to normal distributions (solid lines). Data are from the shipboard recorded velocity during the Antarctic expedition of the research vessel Polarstern in 2006.
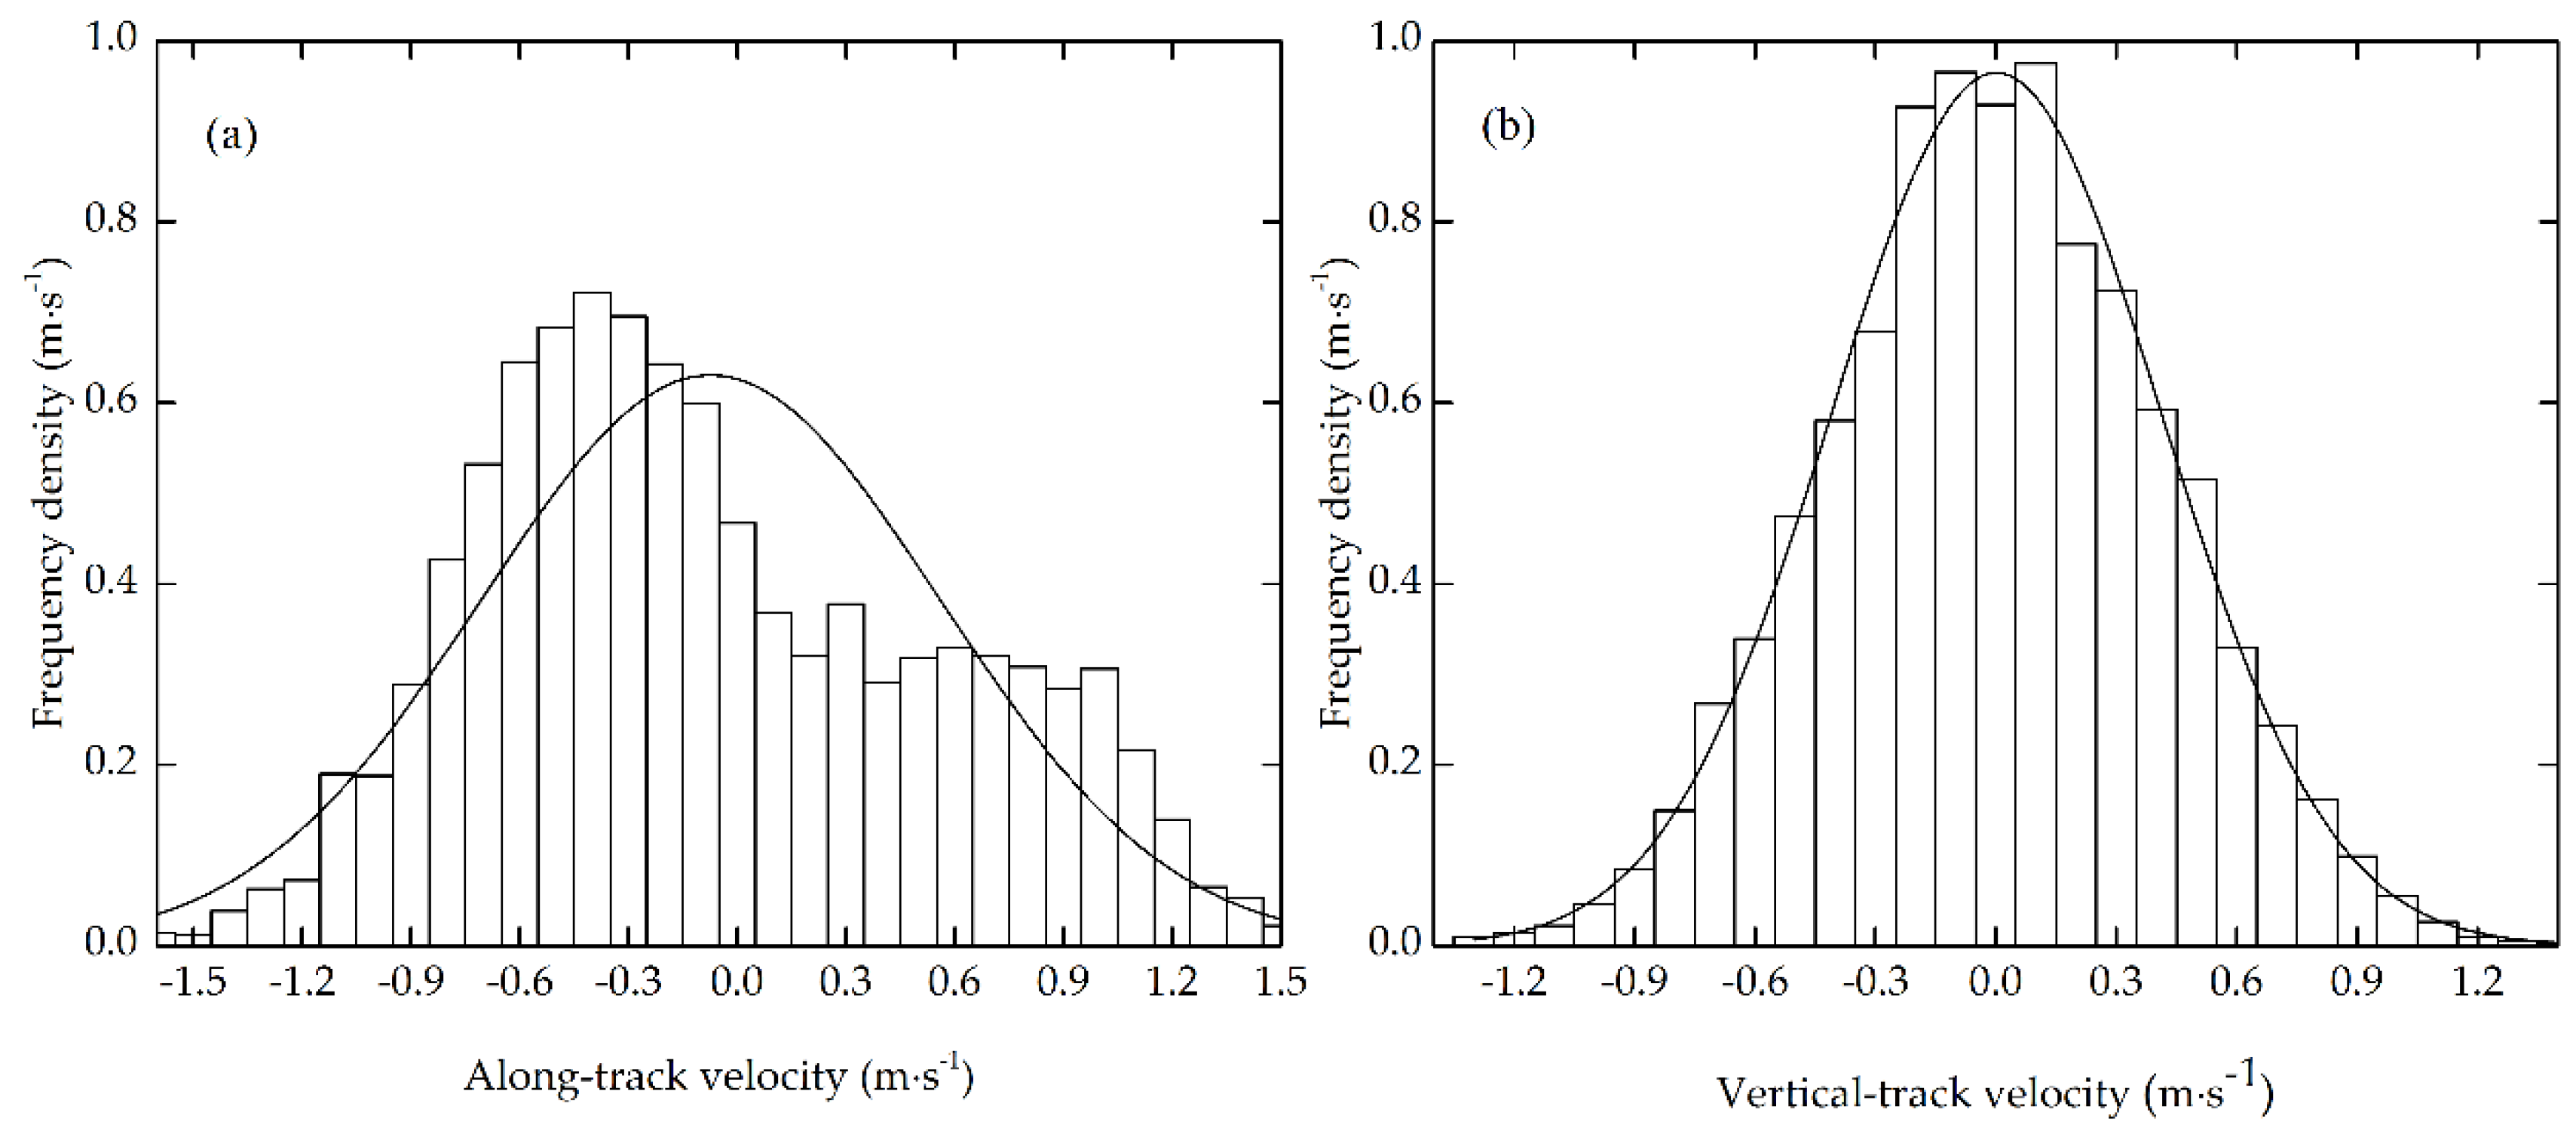
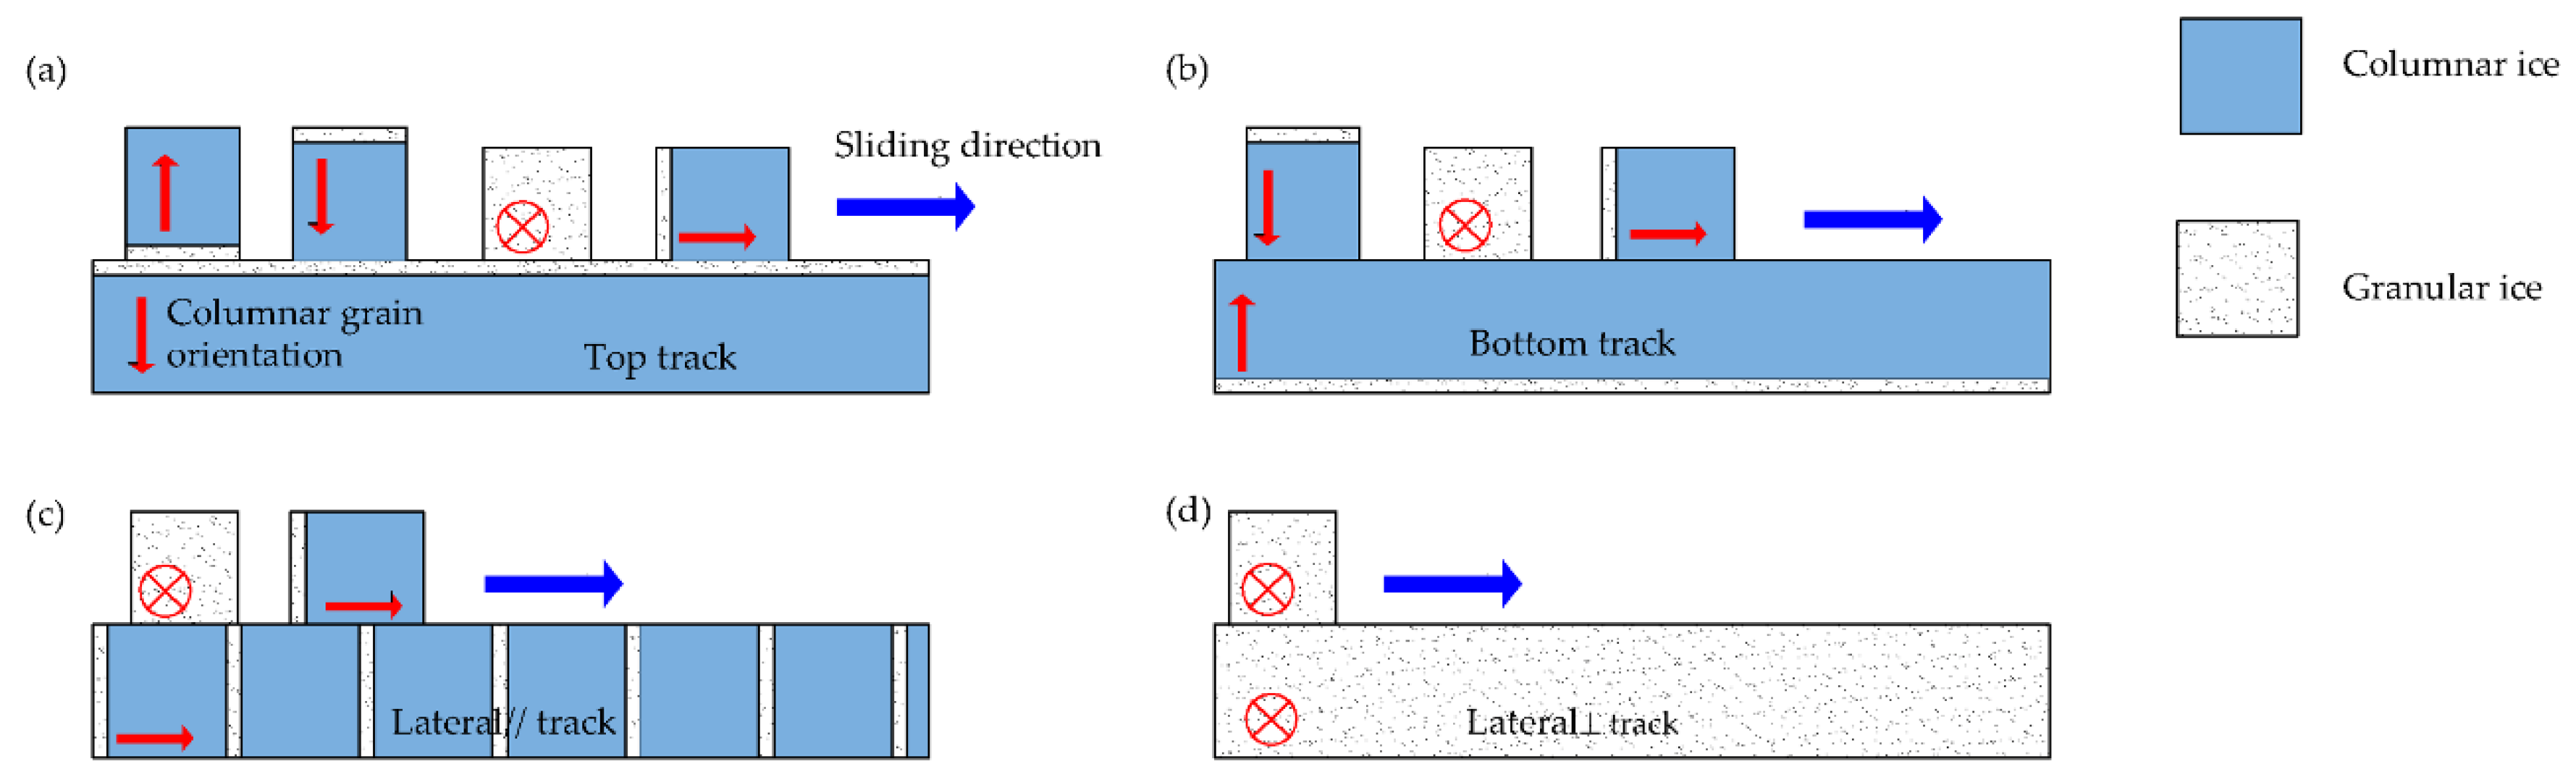
Figure 3.
Sliding configurations for ice-ice friction tests: (a) Top-Top, Bottom-Top, Lateral⊥-Top, and Lateral//-Top; (b) Bottom-Bottom, Lateral⊥-Bottom, and Lateral//-Bottom; (c) Lateral⊥-Lateral // and Lateral//-Lateral//; (d) Lateral⊥-Lateral⊥.
Figure 3.
Sliding configurations for ice-ice friction tests: (a) Top-Top, Bottom-Top, Lateral⊥-Top, and Lateral//-Top; (b) Bottom-Bottom, Lateral⊥-Bottom, and Lateral//-Bottom; (c) Lateral⊥-Lateral // and Lateral//-Lateral//; (d) Lateral⊥-Lateral⊥.

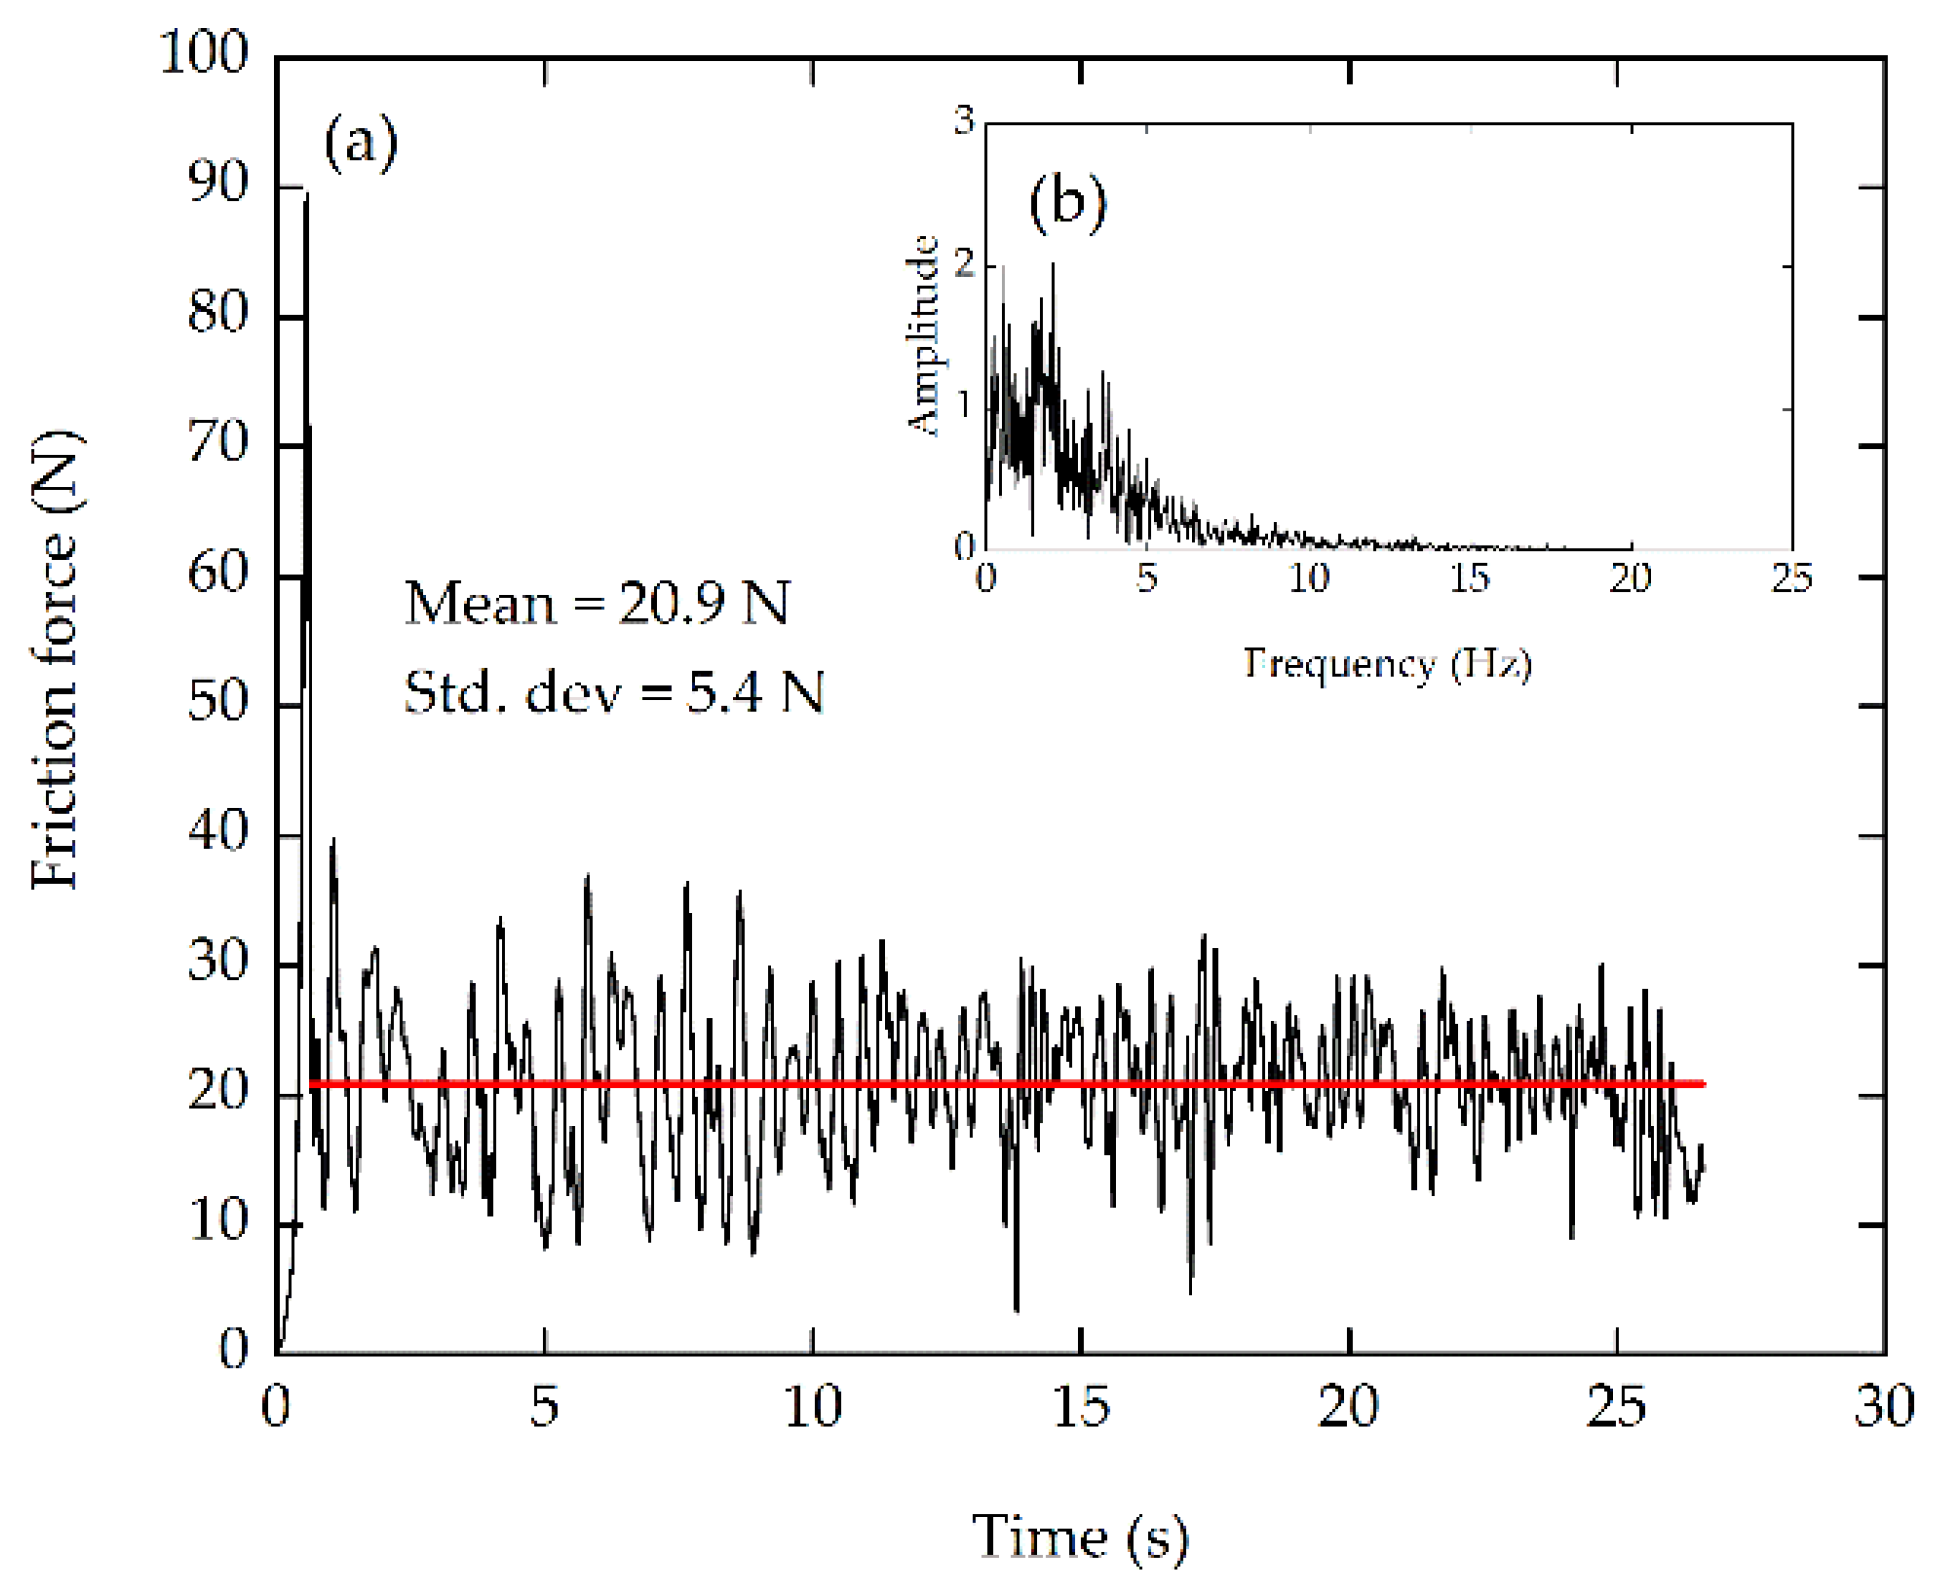
Figure 4.
(a) Steady-sliding friction for SS-Top at a velocity of 0.19 m·s−1 and a normal stress of 3.10 kPa. The mean friction force of the stationary portion used in calculation was 20.9 N (red line) and the standard deviation was 5.4 N; (b) Frequency of load oscillations in steady sliding.
Figure 4.
(a) Steady-sliding friction for SS-Top at a velocity of 0.19 m·s−1 and a normal stress of 3.10 kPa. The mean friction force of the stationary portion used in calculation was 20.9 N (red line) and the standard deviation was 5.4 N; (b) Frequency of load oscillations in steady sliding.

Figure 5.
(a) Stick-slip friction regime on SS-Top at a velocity of 0.02 m·s−1 and a normal stress of 4.56 kPa. The mean value of the portion used in the calculation was 10.4 N (red line), and the standard deviation was 3.6 N; (b) Frequency of load oscillations in stick-slip motion.
Figure 5.
(a) Stick-slip friction regime on SS-Top at a velocity of 0.02 m·s−1 and a normal stress of 4.56 kPa. The mean value of the portion used in the calculation was 10.4 N (red line), and the standard deviation was 3.6 N; (b) Frequency of load oscillations in stick-slip motion.

Figure 6.
(a) U-shape friction regime on Top-Lateral// at a velocity of 0.04 m·s−1 and a normal stress of 4.56 kPa; (b) Fourier analysis showing that the frequency of load oscillations was 0.28 Hz in (a).
Figure 6.
(a) U-shape friction regime on Top-Lateral// at a velocity of 0.04 m·s−1 and a normal stress of 4.56 kPa; (b) Fourier analysis showing that the frequency of load oscillations was 0.28 Hz in (a).
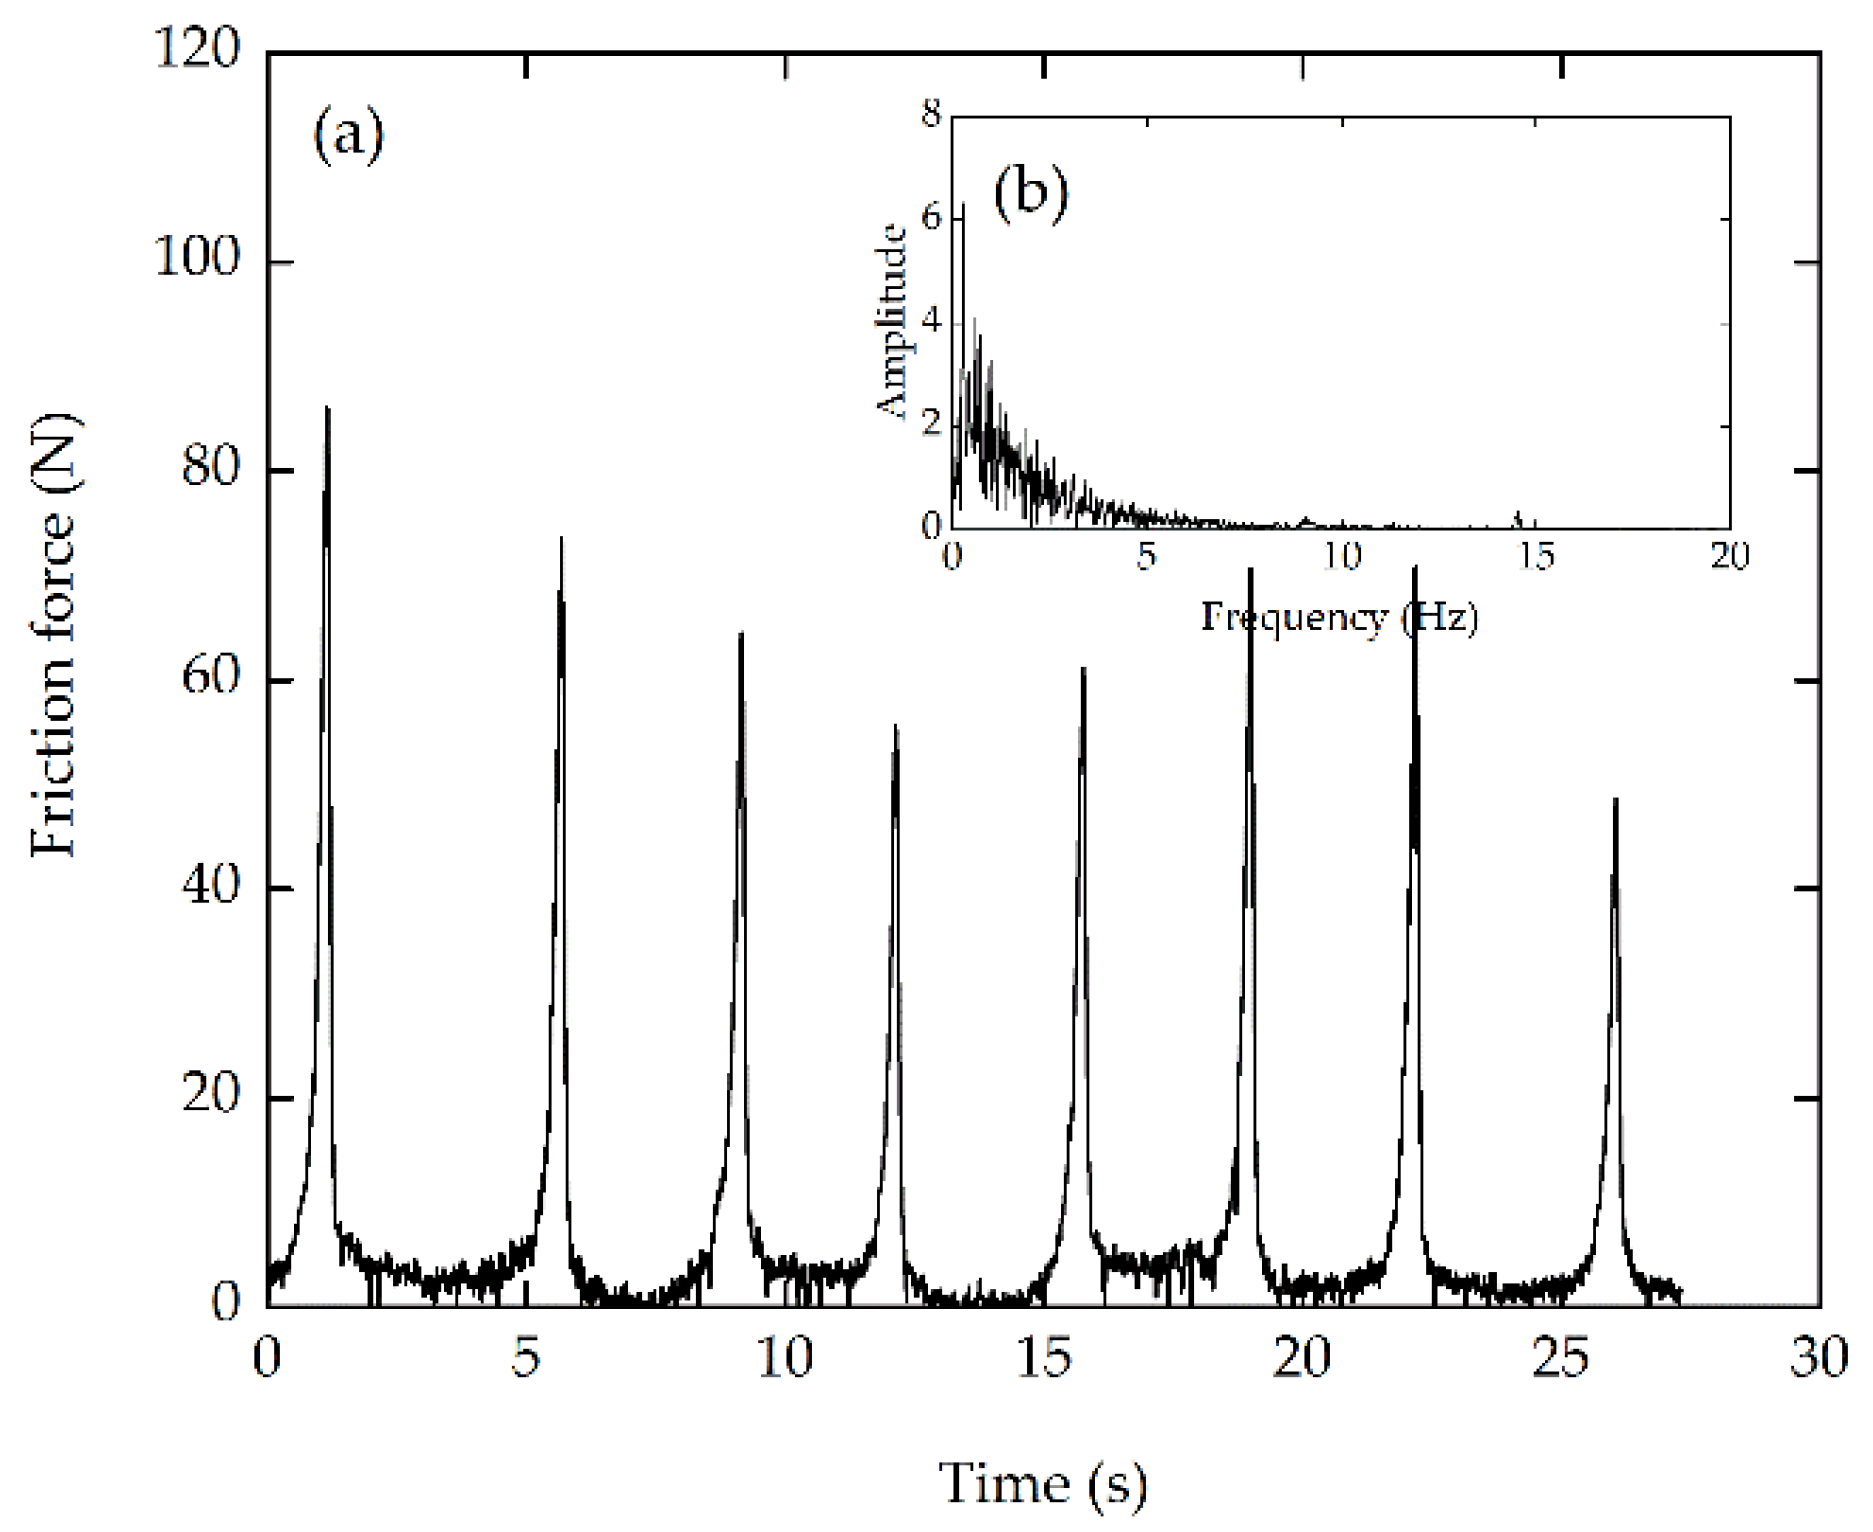
Figure 7.
Variations of μk with normal stress P for CS-Lateral⊥, Lateral⊥-Lateral//, Lateral⊥-Bottom, and Lateral//-Top. Also shown are the power-law regression lines (dashed lines).
Figure 7.
Variations of μk with normal stress P for CS-Lateral⊥, Lateral⊥-Lateral//, Lateral⊥-Bottom, and Lateral//-Top. Also shown are the power-law regression lines (dashed lines).

Figure 8.
Variations of μk with velocity V of friction for (a) SS, (b) CS, and (c) sea ice sliders in directions parallel and vertical to ice columnar grain orientation. The data were averaged over the normal stresses, and the error bars represent the standard deviation. Also shown are the test air temperature, the standard deviations of both datasets, and the significance coefficients of the rank sum tests.
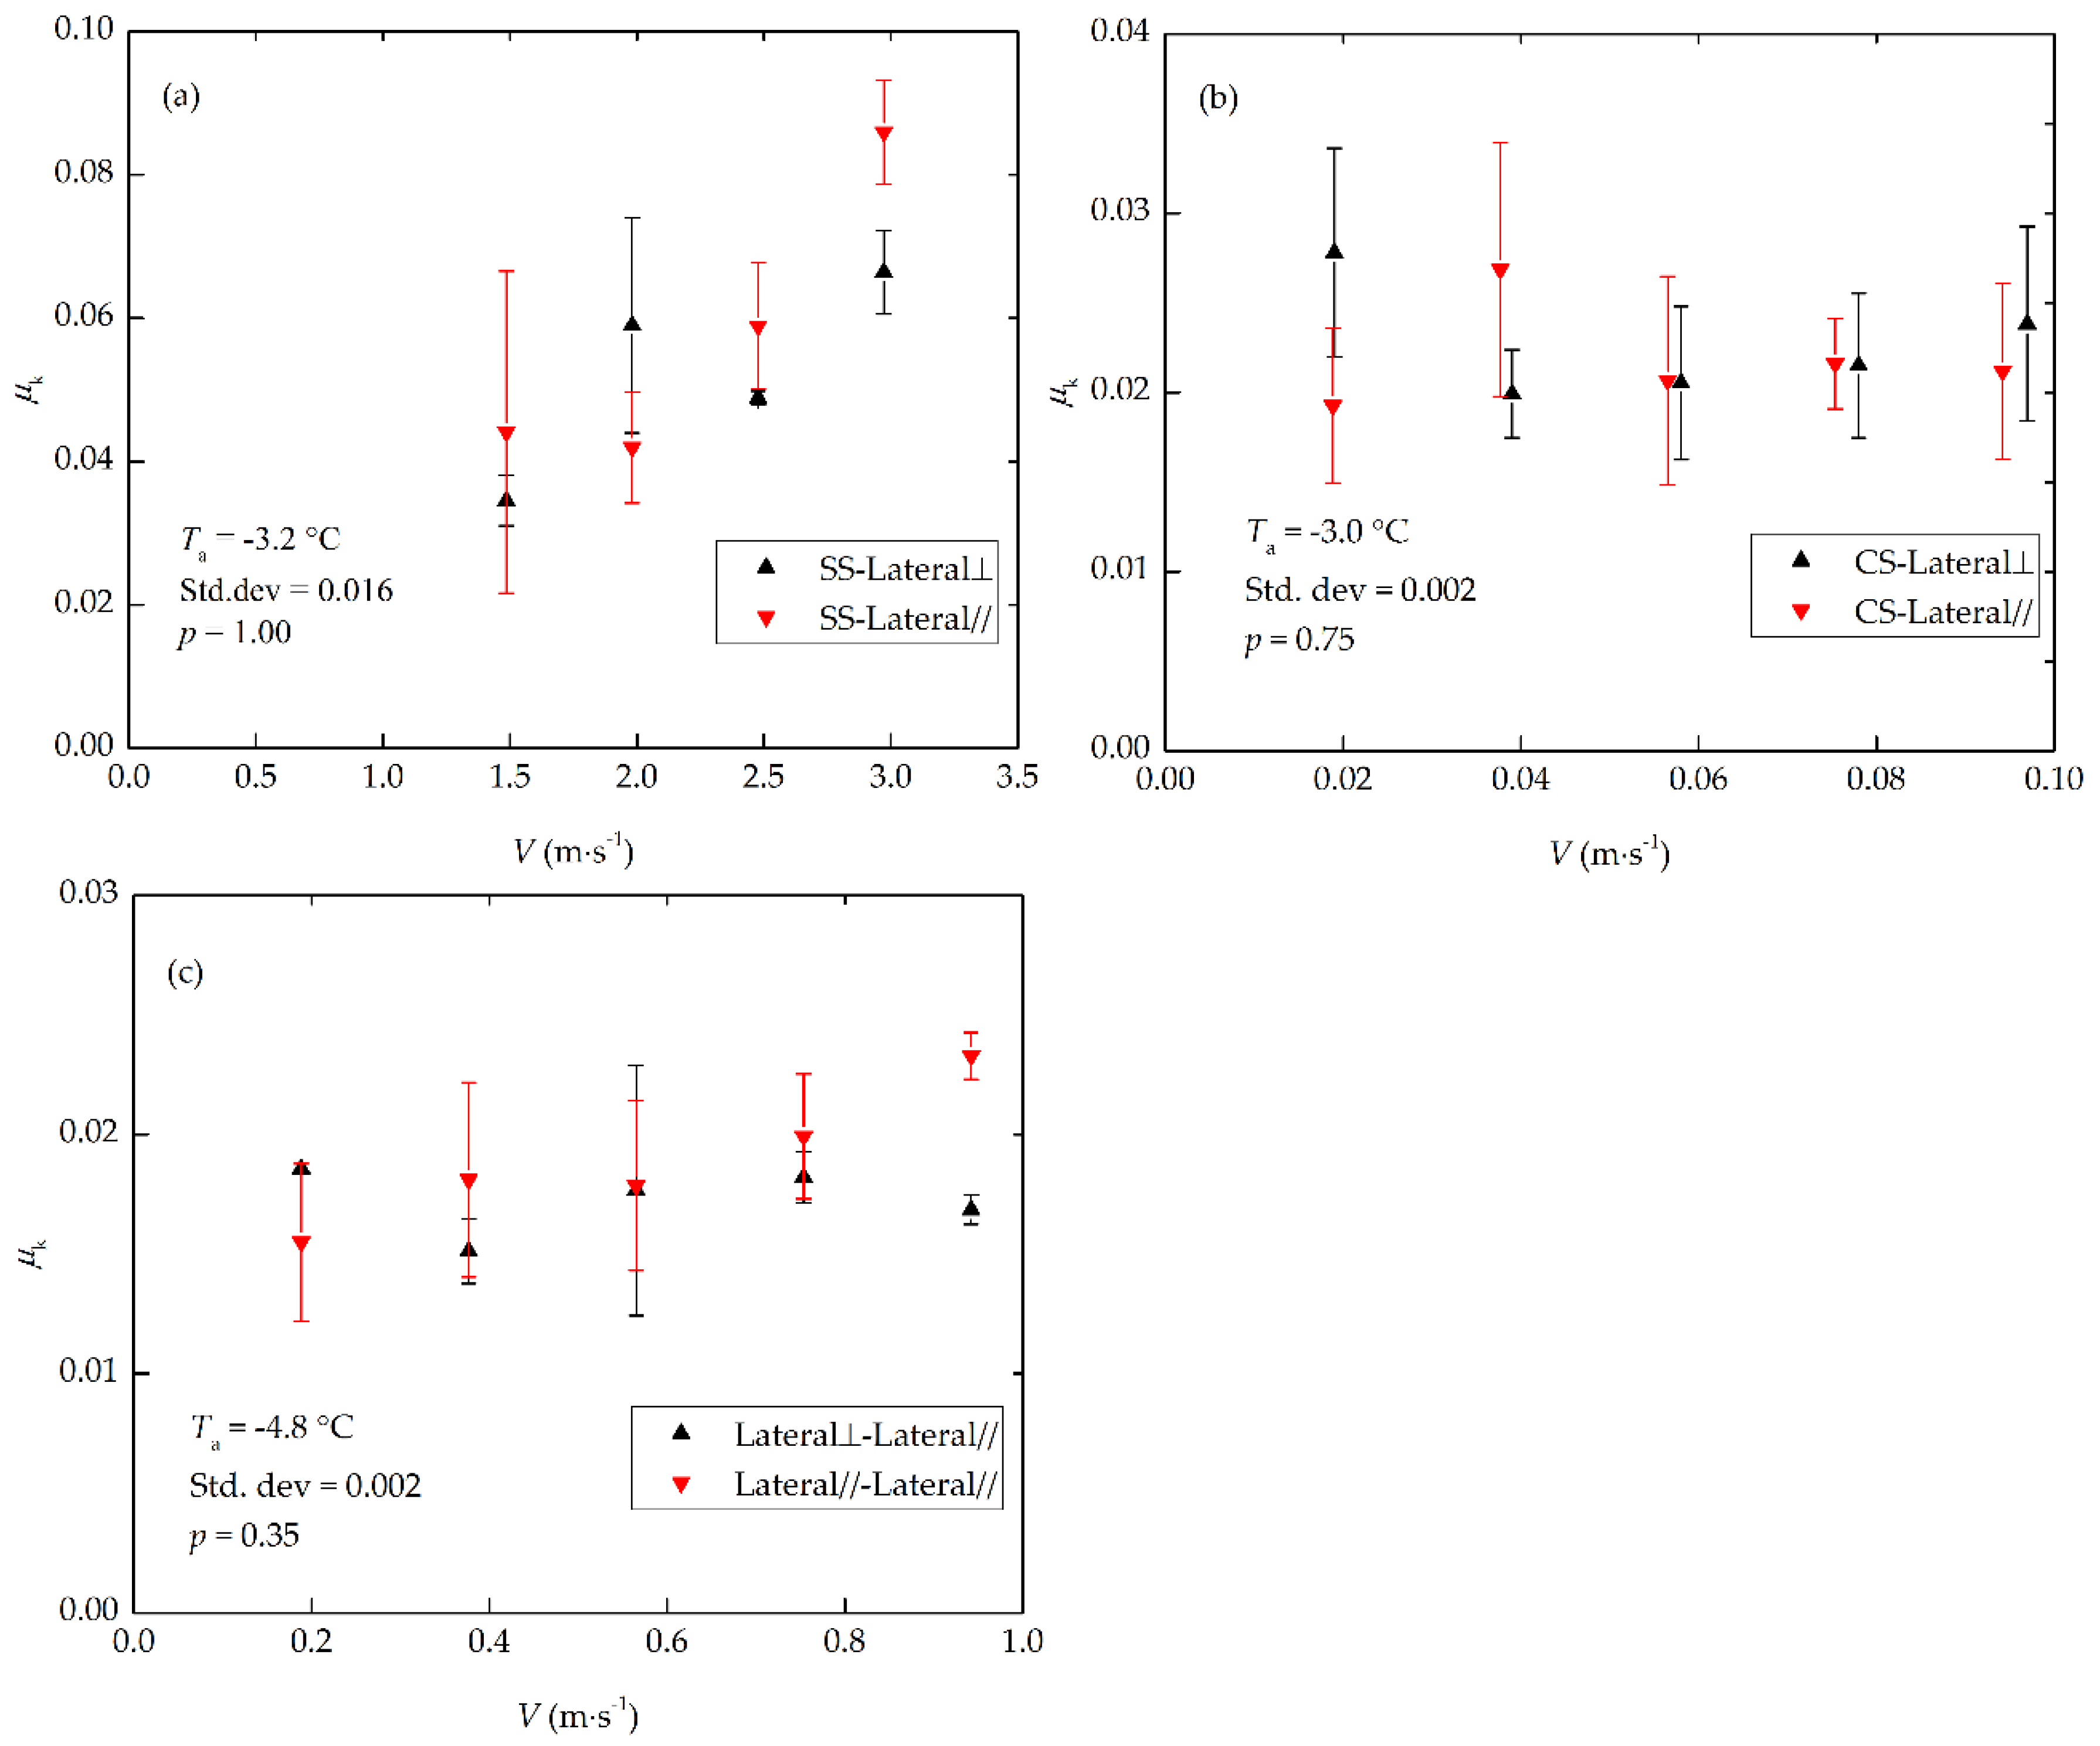
Figure 9.
Variations of μk with velocity V of friction cases of SS, CS, and ice bottom sliding on the Bottom track. The data were averaged over all normal stresses, and the error bars represent the standard deviation. Also shown are the test air temperature, standard deviations of all datasets, and the significance of the rank sum test.

Figure 10.
Variations of μk with velocity V for SS-ice, CS-ice, and ice-ice contacts. The data at a given velocity were the mean values over different test conditions, and the error bars represent the standard deviation.
Figure 10.
Variations of μk with velocity V for SS-ice, CS-ice, and ice-ice contacts. The data at a given velocity were the mean values over different test conditions, and the error bars represent the standard deviation.
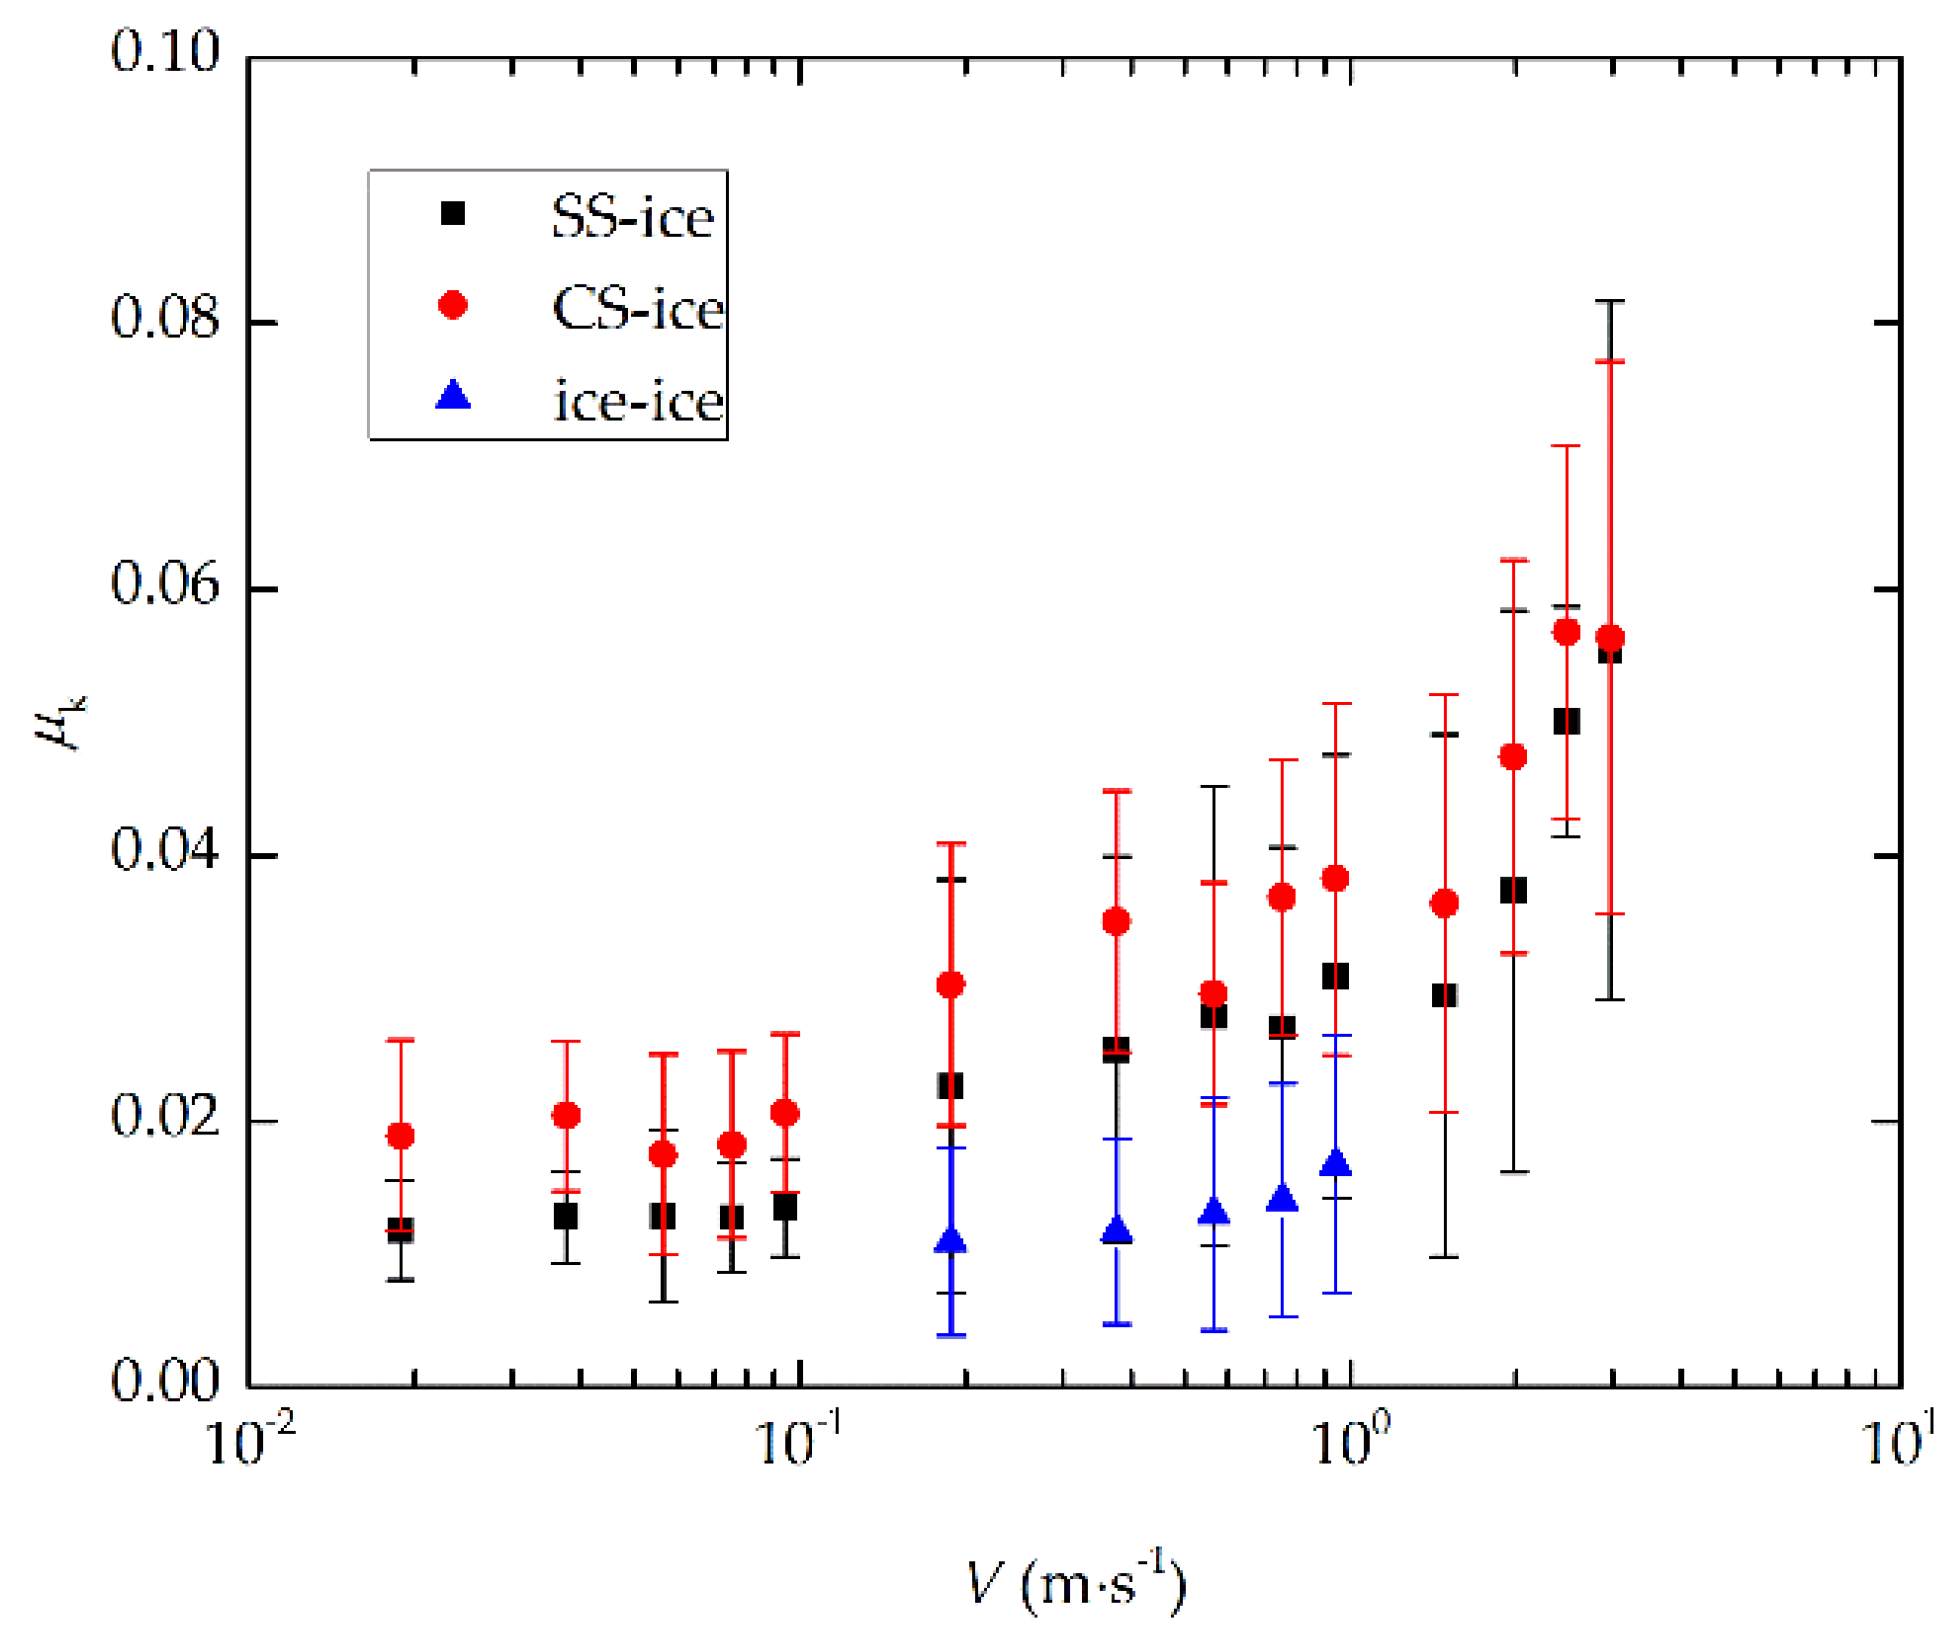
Figure 11.
Variations of μk with velocity under different air temperatures for: (a) CS-Lateral⊥ and CS-Lateral//; (b) Bottom-Bottom. The data were averaged over all normal stresses, and the error bars represent the standard deviation.
Figure 11.
Variations of μk with velocity under different air temperatures for: (a) CS-Lateral⊥ and CS-Lateral//; (b) Bottom-Bottom. The data were averaged over all normal stresses, and the error bars represent the standard deviation.
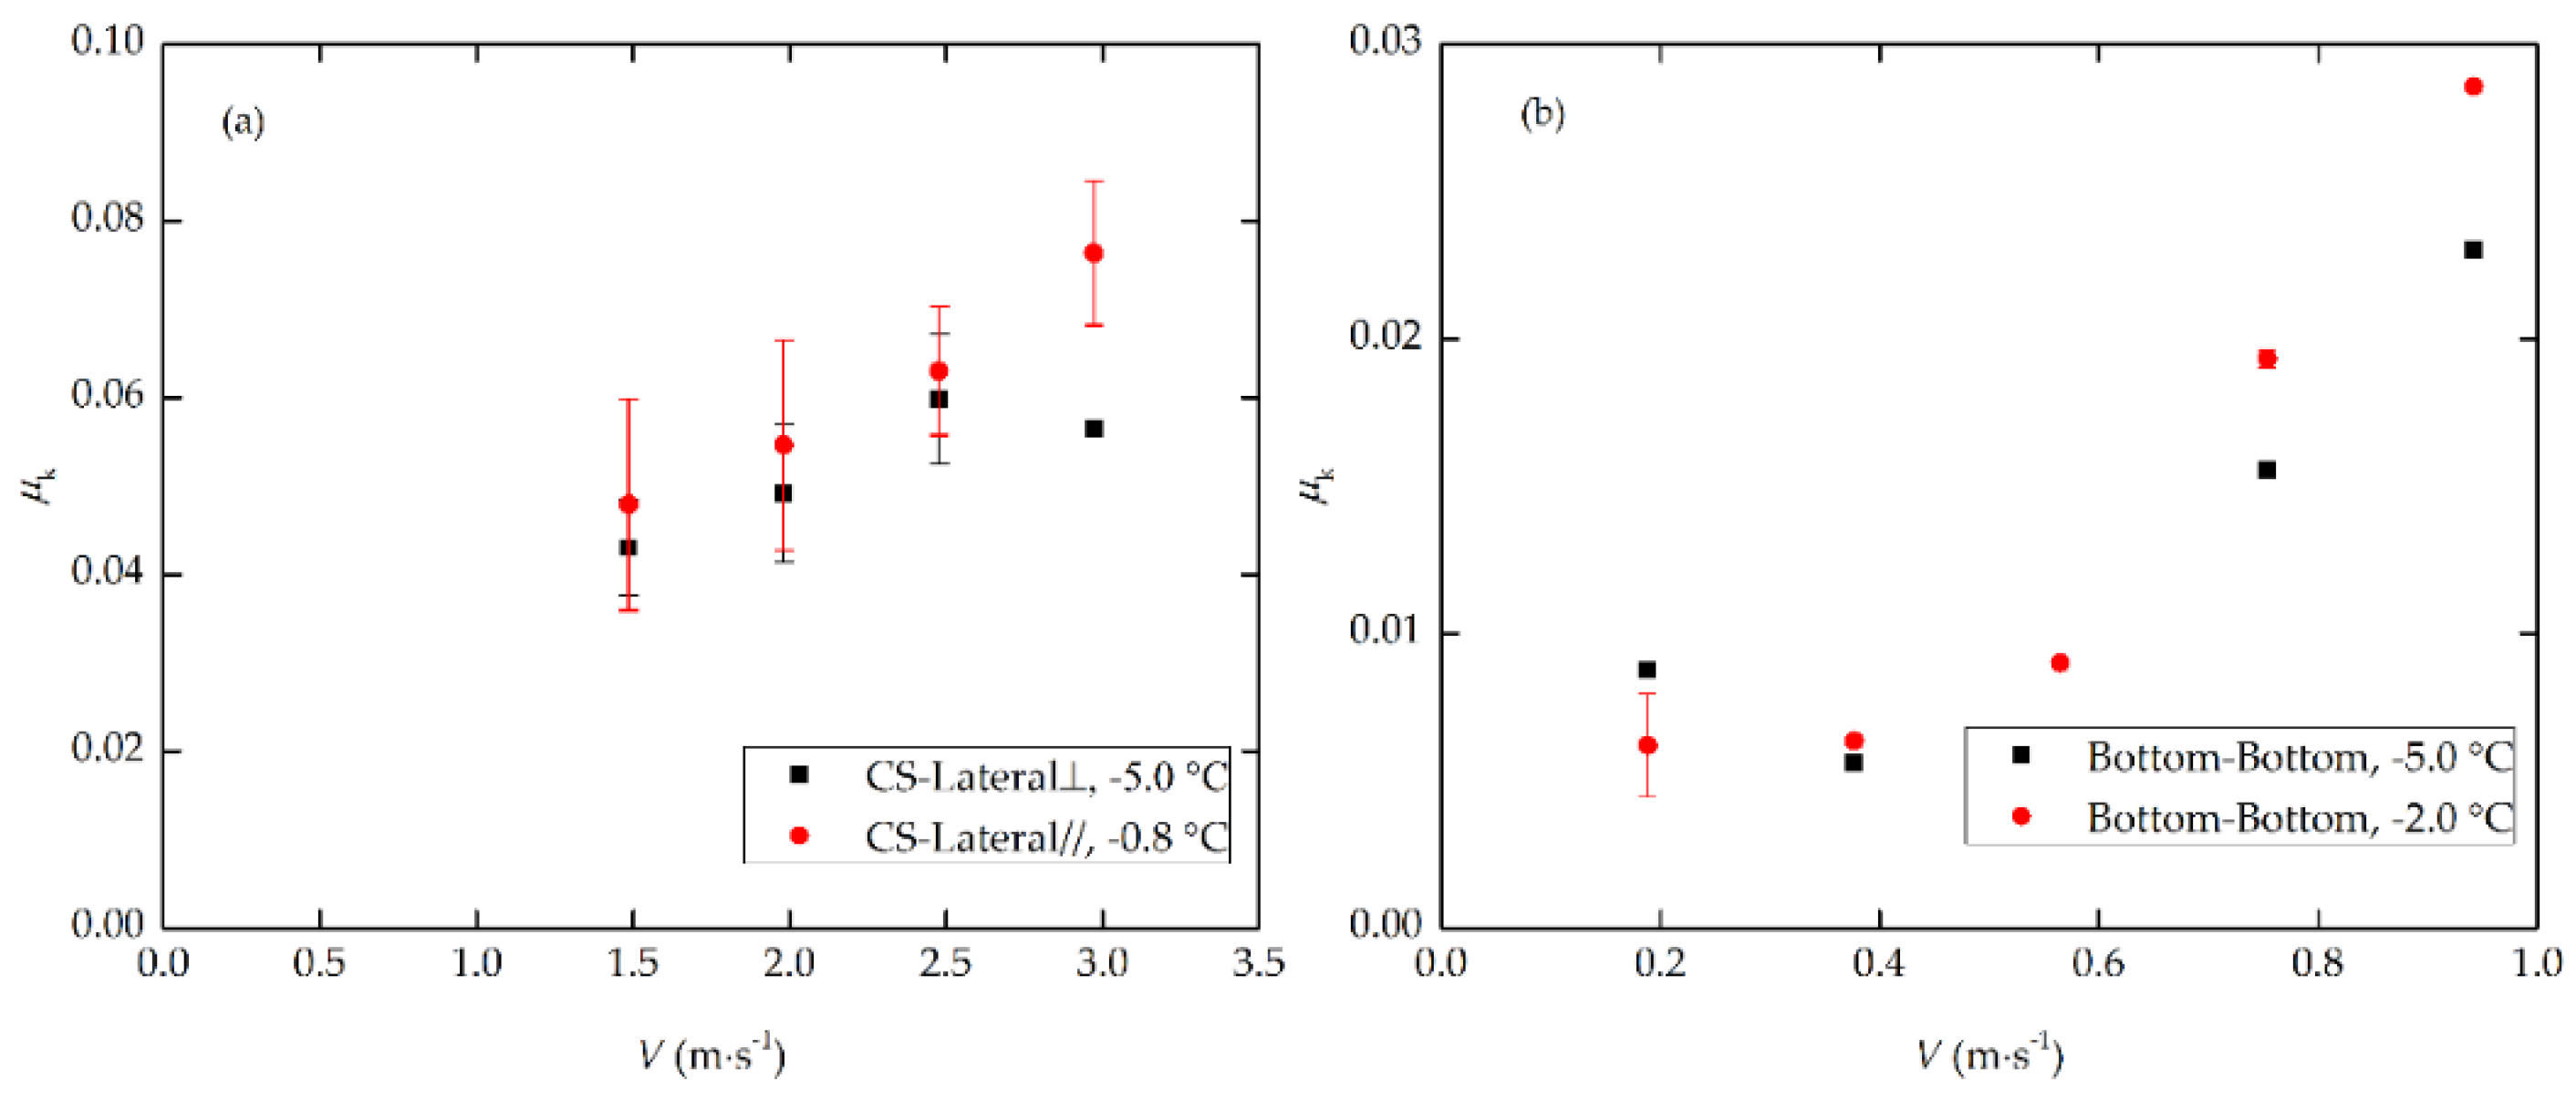
Figure 12.
The velocity dependence of μk. The colored points are the experimental data, and the colored dashed lines are trends fitted based on Equation (4).
Figure 12.
The velocity dependence of μk. The colored points are the experimental data, and the colored dashed lines are trends fitted based on Equation (4).

Figure 13.
The approximate comparisons between experimental data and estimation of model [43] for (a) ice-ice friction and (b) steel-ice friction. The correlation coefficient between measured and modelled values was 0.84 for ice–ice friction. For steel–ice friction, the model underestimated and overestimated the experimental data at velocity greater and lower than 0.75 m·s−1 respectively, and the correlation coefficients were 0.12 and 0.55 respectively.


Table 1.
Information on stick-slip from previous experiments.
| Reference | Loading System | Test Temperature (°C) | P (kPa) | V (m·s−1) |
|---|---|---|---|---|
| [23] | Uniaxial testing system | −3 | 7–1000 | 10−5–5 × 10⁻² |
| −40–−10 | 5 × 10⁻⁵–5 × 10⁻² | |||
| [24] | Rotation device and uniaxial testing system | −30–0 | 1.2–370 | 10−5–10−3 |
| [35] | Pusher in a basin | −10 | 10 | 3 × 10⁻³ |
| [37] | Linear actuator in field | −20–−2 | 4–36 | 6 × 10⁻³–3 × 10⁻² |
Table 2.
Empirical constants μ0 and C and coefficient of determination R2 of each contact fitted by the Equation (4) with significance less than 0.05.
Table 2.
Empirical constants μ0 and C and coefficient of determination R2 of each contact fitted by the Equation (4) with significance less than 0.05.
| Friction | μ0 | C | R2 |
|---|---|---|---|
| SS-ice | 6.6 × 10⁻⁵ | 7.5 × 10⁻³ | 0.83 |
| CS-ice | 7.0 × 10⁻³ | 7.4 × 10⁻³ | 0.85 |
| ice-ice | 6.2 × 10⁻⁴ | 3.3 × 10⁻³ | 0.79 |
© 2018 by the authors. Licensee MDPI, Basel, Switzerland. This article is an open access article distributed under the terms and conditions of the Creative Commons Attribution (CC BY) license (http://creativecommons.org/licenses/by/4.0/).
Share and Cite
MDPI and ACS Style
Wang, Q.; Li, Z.; Lu, P.; Cao, X.; Leppäranta, M. In Situ Experimental Study of the Friction of Sea Ice and Steel on Sea Ice. Appl. Sci. 2018, 8, 675. https://doi.org/10.3390/app8050675
AMA Style
Wang Q, Li Z, Lu P, Cao X, Leppäranta M. In Situ Experimental Study of the Friction of Sea Ice and Steel on Sea Ice. Applied Sciences. 2018; 8(5):675. https://doi.org/10.3390/app8050675
Chicago/Turabian StyleWang, Qingkai, Zhijun Li, Peng Lu, Xiaowei Cao, and Matti Leppäranta. 2018. "In Situ Experimental Study of the Friction of Sea Ice and Steel on Sea Ice" Applied Sciences 8, no. 5: 675. https://doi.org/10.3390/app8050675
Note that from the first issue of 2016, this journal uses article numbers instead of page numbers. See further details here.