Experimental Study on Dynamic Effects of a Long-span Railway Continuous Beam Bridge


1
Department of Bridge Engineering, School of Civil Engineering, Southwest Jiaotong University, Chengdu 610031, China
2
Key Laboratory of High-Speed Railway Engineering, Ministry of Education, Chengdu 610031, China
3
Department of Civil, Architectural and Environmental Engineering, Missouri University of Science and Technology, Rolla, MO 65401, USA
*
Author to whom correspondence should be addressed.
Appl. Sci. 2018, 8(5), 669; https://doi.org/10.3390/app8050669
Submission received: 7 March 2018
/
Revised: 4 April 2018
/
Accepted: 14 April 2018
/
Published: 26 April 2018
Abstract
:Studies on impact effects of trains on the railway bridge are important for ensuring the reliability of bridge and the safety of train operation. This paper presents an experimental study on the dynamic effects of moving trains on a long-span railway continuous beam bridge. The dynamic responses of the bridge under the moving trains were measured through in-situ testing and finite element analysis. The influences of the moving trains and track irregularity are considered. The investigated influencing factors include the weight and speed of the train and the irregularity of the track on the bridge. The results indicate that the train’s speed does not have obvious influence on the impact factor, while train’s weight and track irregularity have notable effects on the impact factor. But from the overall development law, with the increase of train speed, the impact factor increases. The impact factors obtained in this study are larger than the values provided by the China bridge design codes, which indicates that the bridge code underestimates the impact effect of the train on the bridge. The design value of the impact factor should be properly improved in the bridge design.
1. Introduction
When a train passes a bridge at a certain speed, there are interactions between the train and the bridge. The dynamic behaviors of the train and bridge are coupled because of their contacts. The coupling effect of the vehicle-bridge system may magnify the dynamic responses of the individual train and bridge [1]. An impact factor (IM), defined as the ratio of the dynamic increment to the corresponding static response, has been used to describe the dynamic effect of moving trains [2]. The dynamic effect of trains on the bridge is not only related to the dynamic characteristics of the bridge, but also dependent on the trains, such as their vibration characteristics and speed, as well as the track’s condition [3]. The IM is an indicator of the combination effect of these factors.
In the existing studies, numerical methods were widely used to investigate the dynamic performance of the structures [4,5] and verify the accuracy of the experimental data [6]. Most researches using numerical simulations have been conducted to study the vehicle-bridge interaction and estimate the IM. For example, Gao et al. [7] studied the dynamic performance of the multi-span girder bridge by establishing a program for vehicle-bridge coupled vibration analysis. The dynamic load allowance (DLA = IM) of the bridge with different span numbers was compared, and the DLA of the three-span bridge was found to be the biggest. Gu et al. [8] calculated the IMs for five railway bridges using a direct integration method and investigated the correlation between vehicle speed, axle load, and impact factor. Gou et al. [9] established a coupled vehicle–bridge vibration model to analyze the dynamic behavior of the bridge and they found that the dynamic response of the bridge increases with the train speed. Majka and Hartnett [10] studied the influence of the train speed, train-to-bridge frequency, mass and span ratios, as well as bridge damping on the dynamic amplification factor (DAF = IM + 1) of railway bridges using the finite element method. Yin and Wei [11] investigated the dynamic effects between the vehicle and bridge-subgrade transition zone using a three dimensional model. They found that track irregularity can amplify the dynamic responses significantly. Lee et al. [12] studied the fatigue IM of steel plate girder railway bridges by a dynamic analysis, and they found that the existing Korean codes overestimated the fatigue IM. Hamidi and Danshjoo [13] conducted numerical analysis to determine the IM for four steel railway bridges with 10, 15, 20 and 25 m span lengths. The results showed that in most cases the calculated IM values are higher than that recommended by the relevant codes.
However, due to the complexity of the vehicle-bridge systems, some assumptions were introduced for simplification in either the finite element analyses or the analytical studies. For this reason, in-situ testing, whenever available, is the most reliable approach to investigate the real response of the vehicle-bridge system and estimate the IM. For example, Gou et al. [14,15,16] carried out field tests to study the dynamic effects of moving trains on various kinds of railway arch bridge, including the long-span continuous rigid frame arch bridge, asymmetrical arch bridge and hybrid framed arch bridge. The IM was found to be insensitive to the speed of the train, but the IM curve produced an obvious peak at some specific speed due to resonance. Ding and Wang [17] evaluated the dynamic load factor (DLF = IM + 1) in different members of a high-speed railway truss arch bridges using the field monitoring data and numerical simulation data. The effects of lane position, carriage number, and train speed on DLF were also analyzed in their study. Kaloop et al. [18] reported the bridge performance under train speeds of 290, 360, 400 and 406 km/h by a nondestructive monitoring system. Gou et al. [19] analyzed the dynamic response of the world’s longest steel box tied-arch bridge under moving trains by field measurement. They found that the poor road surface roughness can greatly increase the IM, and the train braking can also produce a larger IM. Flener and Karoumi [20] studied the actual dynamic response of a long-span corrugated steel culvert railway bridge by measuring the strain and displacement under moving trains. In their study, the dynamic displacement were found to be as much as 20% larger than the corresponding static response, and the dynamic amplification factor (DAF) obtained from the moments reached a high value of 1.45. Khan et al. [21] conducted field tests of a prestressed concrete simply supported beam bridge subjected to two electric-multiple-unit rail cars to determine the IMs, and the IMs were found to be insensitive to train speed and smaller than investigated code provisions. So far, much experimental research has been conducted to study the dynamic impact of railway arch bridges or simply supported bridges. However, fewer experimental studies have focused on the dynamic impact effect of moving trains on railway continuous beam bridges, especially for large-span railway continuous beam bridges with a main span of more than 100 m.
In this study, the static and dynamic load tests of the Yexihe Bridge, which is the longest continuous-girder, high-speed railway bridge in China, were carried out to investigate the dynamic responses of the bridge under design moving loads. In the field test, one or two freight trains passed through the bridge at constant speeds. The impact factors for the deflections and strains of the bridge were measured in different loading scenarios and compared. A finite element model was established to analyze the influence of the train’s speed and type, and track irregularity.
2. Description of the Bridge
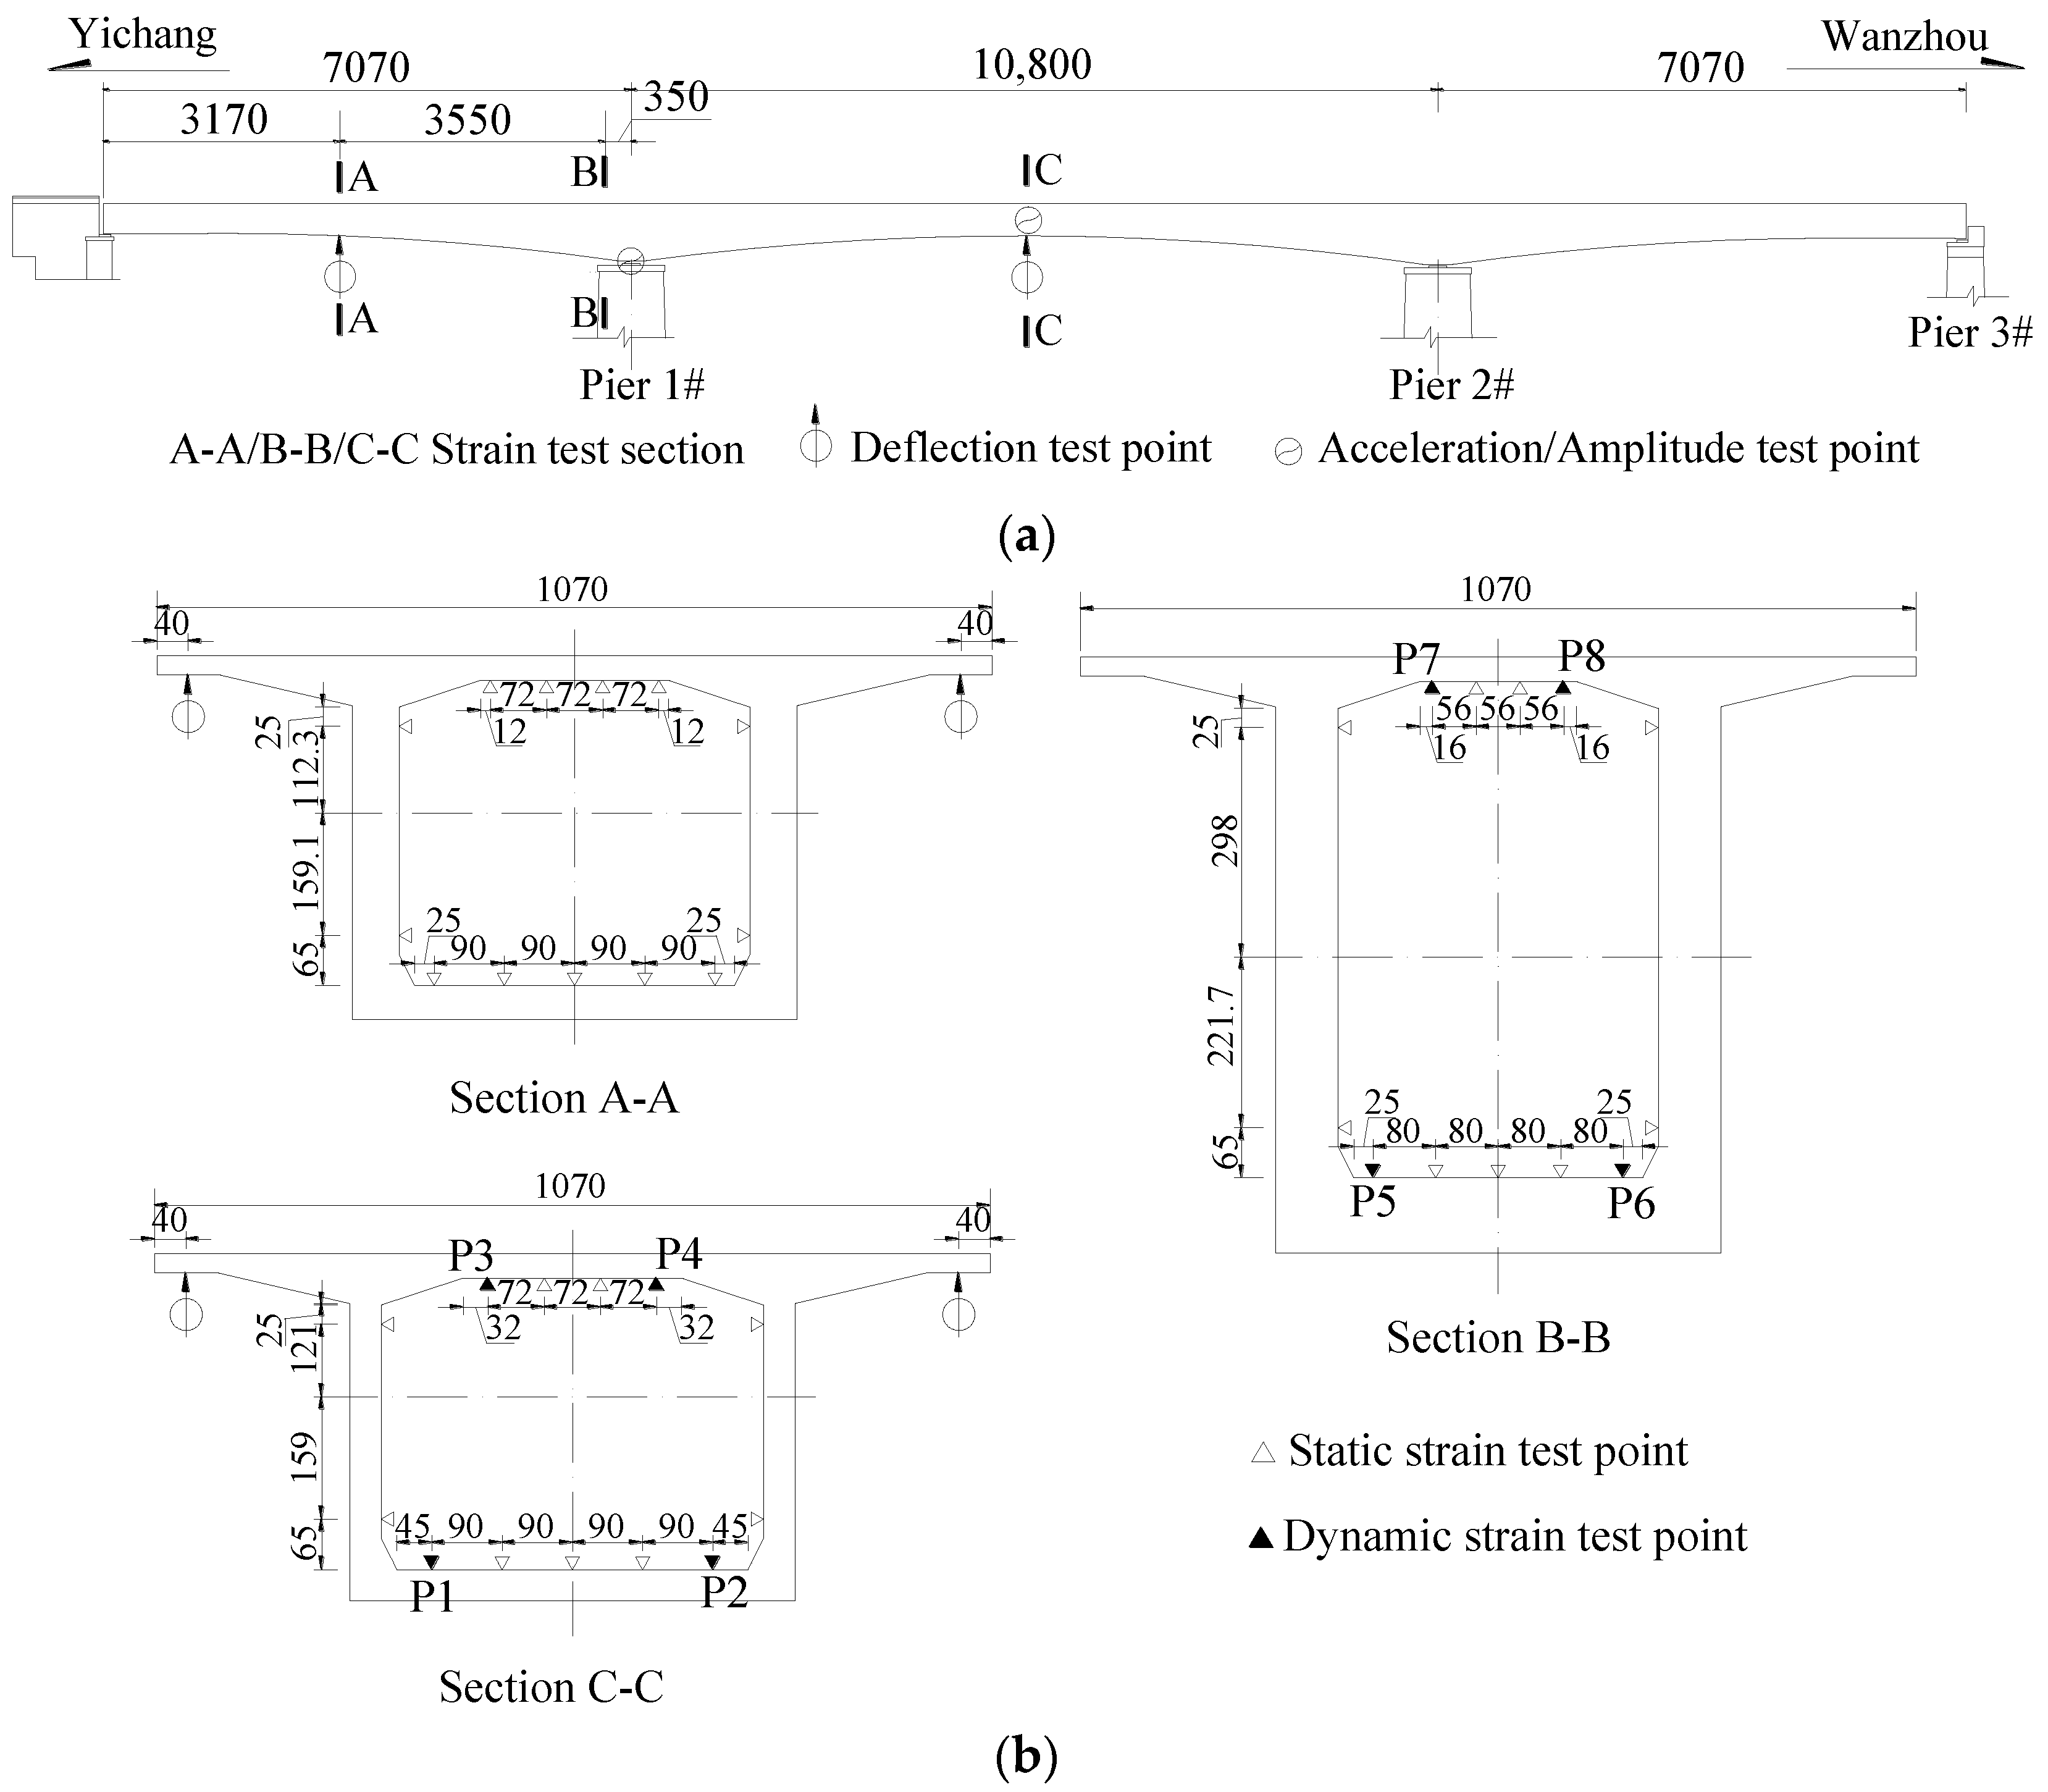
The Yexihe Bridge is a three-span prestressed concrete continuous bridge with a layout of 70 + 108 + 70 m, as shown in Figure 1a. The heights of the three piers are 93.5 m, 93.5 m, and 54 m, respectively. In the longitudinal direction of the bridge, the girder has non-uniform cross sections, as illustrated in Figure 1b. The height of the girder is 8 m on top of the Piers 1 and 2, and 4.5 m at the mid-span of the central span. The bridge deck measures 10.7 m in width and is composed of an 8.4 m ballast groove and two 1.15 m walkway on each side. The bottom flange of the box girder measures 5.7 m in width. The bridge has two parallel train lines. The design speed is 160 km/h for passenger trains and 90 km/h for freight trains.
3. Experiment Setup
3.1. Loading Configurations
The parameters of the train loads are determined from the prototype of trains on the Yichang-Wanzhou railway line. The test train was composed of 2 locomotives and 14 carriages. The type of locomotives included the HXD3 and HXD3C. The type of carriages included the C62AT, C62BK, C64T, C64K, and C70. The weight of HXD3/HXD3C is 138 t, and the deadweight/carrying capacity of C62, C64, and C70 are, 22.3 t/64 t, 22.7 t/64 t, and 23.8 t/70 t, respectively. The total weight and length of a freight train is 1544.6 t and 234.1 m. The schematic diagrams of the axle load of the trains are shown in Figure 2.
According to the symmetry of the bridge, the left half span of the structure was selected to install the measuring instrument. The static test was carried out to determine the load efficiency factors which is a ratio of measured load effect to calculated load effect under design loads and can be used to evaluate the elastic working performance and load carrying capacity of the bridge. Two loading methods were used in the static tests, which are the single-line partial loading and double-line symmetrical loading. The longitudinal train position was determined to yield the maximum moment at the test sections. Three loading cases were investigated: (1) maximum positive moment at Section A-A; (2) maximum negative moment at Section B-B, and (3) maximum positive moment at Section C-C. The loading position of each case is shown in Figure 3.
Two types of dynamic tests were conducted, which are the pulsation test and driving test. The objectives of the pulsation tests were to investigate the natural frequencies, mode shapes, and damping ratio of the bridge. The objectives of the driving tests were to investigate the dynamic responses of the train-bridge system. Either one train or two trains moving in the opposite directions passed through the bridge at constant speeds of 5, 20, 40, 60, and 80 km/h, respectively. The dynamic strain, displacement and acceleration of selected sections were measured under Case 1 (Single line) and Case 2 (Double line), respectively. The dynamic loading cases are shown in Figure 4.
3.2. Instrumentation
Three critical sections of the bridge were selected, which were the Sections A-A, B-B, and C-C, as shown in Figure 1a. In each section, nine electrical resistance strain gauges were deployed at the lower edge of top plate and the upper edge of bottom plate, respectively; four strain gauges were deployed at the web plate of each test section. In total, 39 strain gauges were deployed on the girder.
In addition to the strain gauges, four linear variable differential transformers (LVDTs) were installed at both sides of the Sections A-A and C-C, as shown in Figure 1. Two triaxial accelerometers were installed at Sections B-B and C-C, as shown in Figure 1a. The sensors data were collected using a UCAM-70A (Kyoto Yuqi Corporation, Osaka, Japan) data recording system. The dynamic data were collected using a DEWE-BOOK (Dewetron Co. Ltd., Graz, Austria) data acquisition system, IotechDaqBook/216 (National Instruments Corporation, Austin, TX, USA) data acquisition system, and DDS-64 (Cheung Kong Union, Beijing, China) data acquisition system. The data acquisition frequency was 100 Hz.
4. Field Test Results
4.1. Static Test Results
For each loading case, the specific weight and marshalling of the train were calculated according to the most unfavorable loading case [22]:
where η denotes the load efficiency factor; Sst is the calculated value of internal force or deformation under test load; S is the calculated value under design load; δ is the design dynamic impact factor [23].
Figure 5a,b respectively show the results of the maximum moments of the Sections A-A, B-B, and C-C under the most unfavorable loading case and the load efficiency factor. The test result of the moment was calculated by the measured stress and the cross sectional moment of inertia, and the calculated result of the moment was obtained by the finite element method. Figure 5a shows that the absolute values of the calculated moment are larger than the test results. The mean load efficiency factors in Figure 5b are smaller than 0.8, which indicates that the stiffness of the bridge is smaller than that of the original design. Figure 5b shows that the stiffness reduction of the girder section of the side span is the most significant, while the girder section located in the central span and near the pier has a stiffness comparable with that of the design.
The load efficiency factors of Sections A-A and C-C calculated from deflections under different loading cases are compared in Figure 6. The load efficiency factors of Section A-A are larger than that of Section C-C in all the three loading cases, which shows that the elastic working performance of Section A-A is better than that of Section C-C. The same section under different loading cases has different load efficiency factors, indicating that the loading position affects the dynamic responses. The largest load efficiency factor appears in the most unfavorable loading case of each section, which shows that the loading effect of loading vehicle on the section near the loading position is greater. The load efficiency factors of the Sections A-A and C-C are less than 0.8. The reason can be that the bridge structure has a permanent deflection under the long-term load, which reduces the elastic deformation capacity of the bridge. Thus the measured deflection is less than the calculated deflection, resulting in the low load efficiency factor.
4.2. Dynamic Test Results
Digital filtering, average processing and discrete Fourier transform of time domain signals were carried out to get the amplitude spectrum (or power spectrum) and phase spectrum of each pick-up point. Then, the multiple natural frequencies can be obtained in each direction of the structure. As shown in Figure 7, the experimental results of the transverse and vertical frequency peaks are 0.769 Hz and 1.567 Hz, respectively. The calculated first transverse and vertical frequencies are 0.735 Hz and 1.489 Hz, respectively. The maximum discrepancy between the calculated and experimental results of the fundamental frequencies is less than 5%, suggesting that the finite element model provide reasonable prediction of the frequencies.
The first five mode shapes are shown in Figure 8. The first order vibration mode is the longitudinal bending vibration of the fixed pier, and the first natural frequency is 0.433 Hz, which indicates that the bending stiffness of the main pier is low. The second and third order modes are the transverse bending vibration of the main girder, while the vertical bending vibration lag appears in the fourth order mode, which indicates that the transverse stiffness of the bridge is weaker than the vertical stiffness. Based on the vibration attenuation curve measured by driving test, the damping ratio of the bridge structure can be calculated according to the following formula:
where Dr denotes the damping ratio; m denotes the number of cycles; Ai denotes the amplitude of the ith waveform of the vibration attenuation curve. The damping ratios for the first transverse and vertical modes are 0.0015 and 0.0036, respectively.
5. Analysis of Impact Factors
5.1. Definition of Impact Factor
The impact factor (IM) is calculated based on dynamic and static responses (strain or deflection) of the bridge structure, which is defined as following:
where Rdyn is the maximum dynamic response; Rst is the maximum static response.
The dynamic responses of different bridge sections were used for studying the IMs, including the deflection control section of the side span (A-A), the middle pivot Section (B-B), and the mid-section in the central span (C-C). A total of 8 strain measuring points on the cross sections B-B and C-C, marked from P1 to P8 in Figure 1b, were selected as the reference points for the IMs. These four pairs of points (P1 and P2, P3 and P4, P5 and P6, P7 and P8) are symmetrically arranged to the longitudinal axis of the bridge. To calculate the IM, the maximum dynamic response was obtained by taking the maximum value of the measured dynamic response; the static response was obtained by carrying out a static test where trains move across the bridge at a crawl speed. As shown in Figure 9, the Rdyn is the maximum dynamic deflection response when two freight train run on the bridge at a speed of 80 km/h, and the Rst is the maximum value of deflection response when two freight trains run on the bridge at a speed below 5 km/h.
5.2. Impact Factor Calcalated from Experrimental Deta
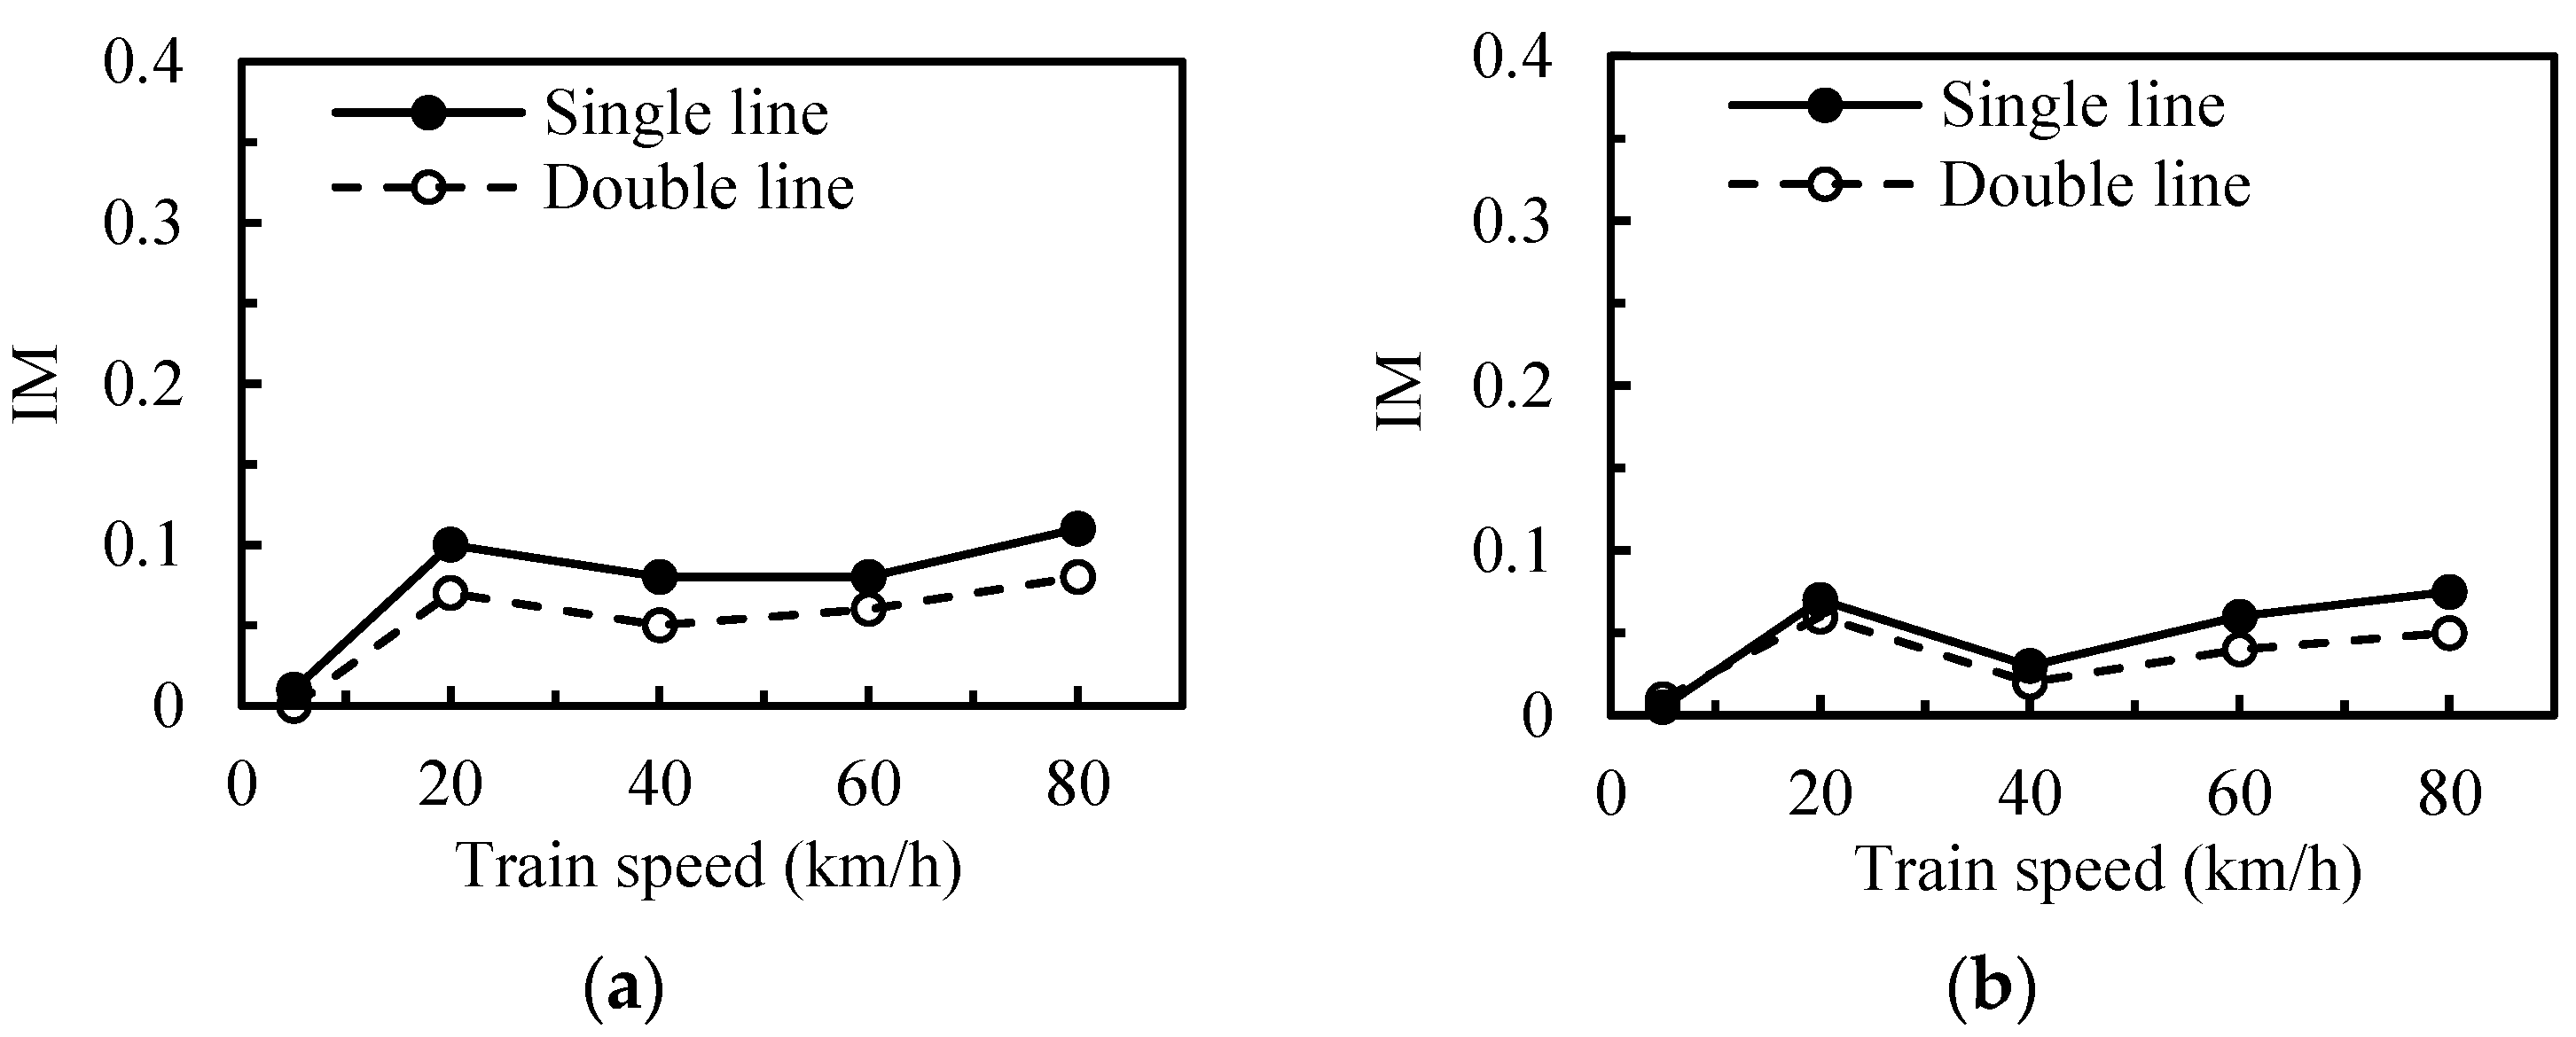
The IMs calculated from deflections are given in Figure 10. The IMs of the Section A-A are greater than that of Section C-C. The reason is that the static and dynamic deflections of the deflection control section of the side span is smaller than those of the mid-section in the central span. Because the IM is the ratio of a dynamic increment to the static response and it can also be large when the increment is not large but the denominator (the static response) is small. By comparing the results of Figure 10b and Figure 11a, it can be concluded that the IM calculated from deflections is smaller than the IM calculated from strains. This finding is consistent with the conclusions of some existing studies [24,25]. However, some researchers presented different opinions that the IM calculated from deflections is greater than that calculated from strains [26,27]. Therefore, it is not reasonable to assign the same IM for different load effects.
As shown in Figure 10 and Figure 11, the IMs obtained from the Case 1 (Single line) are larger than those from the Case 2 (Double line). Many studies have reported the same findings [28,29]. Furthermore, some studies [30] pointed out that the IMs of the bridge part subjected to smaller vehicle loads are usually greater than those of the bridge part subjected to larger vehicle loads. The same conclusion that the IMs of the loading side are smaller than those of the other side with one lane loaded, can be obtained by comparing the IMs of the two pairs of points symmetrically arranged about the longitudinal axis of the bridge in Figure 11a,b. As shown in Figure 11c,d, the IMs of Section C-C are greater than that of Section B-B, which suggests that the impact effect of moving trains on the section in central span is greater than the impact effect of moving trains on the section near support point. The dynamic test results at different speeds show that the IM is not sensitive to the train speed. Unexpectedly, the maximum IM is obtained at the speed of 20 km/h, which is even greater than the IM obtained at the speed of 80 km/h. One possibility is that the loading frequency approaches the natural frequency of the bridge and the quasi-resonance of the train-bridge system occurs when the train passes the bridge at a speed of 20 km/h.
The time history curves of the left strain test point at the lower edge of the mid-section in the central span (P1) with one train running on the bridge at different speeds are given in Figure 12. A train running at 20 km/h causes the greatest dynamic strain of point P1 among all test speeds, which suggests that the quasi-resonance is likely to occur at a speed of 20 km/h compared with other speeds. When one lane is loaded, the mean and maximum IMs of Section B-B are 0.13 and 0.17, respectively, and the mean and maximum IMs of Section C-C are 0.15 and 0.19, respectively. When two lanes are loaded, the mean and maximum IMs of Section B-B are 0.10 and 0.15, respectively, and the mean and maximum IMs of Section C-C are 0.11 and 0.14, respectively. The ultimate IM obtained from the dynamic tests is 0.19, which appears at the lower edge of the mid-section in the central span with a train speed of 20 km/h.
5.3. Comparison with the Bridge Design Code in China
According to the fundamental code for design on railway bridge and culvert in China [23], the design impact factor of the continuous beam bridge can be calculated by the Equation (4):
where h is the filling thickness, L is the bridge span. The IM obtained by the above formula is 0.087. The comparison between the maximum IM from experimental data and the IM from bridge code is shown in Table 1. It can be seen that the IMs obtained from the experimental data are greater than that obtained from the specification, which shows the bridge code underestimates the dynamic effect of the train. The reason may be that bridge specifications only consider the influence of bridge span on the impact factor, and in fact, the impact factor is also affected by factors such as the train speed and the track condition.
6. Finite Element Model
6.1. Brideg Model
Finite element analysis is performed to help understand the experimental results, and study the impact effect of trains running at high speeds on the bridge, as will as the impact effect of different types of vehicles on the bridge. The FE model for the dynamic impact analysis of the high-speed train-bridge system was formed and embedded in the popular finite element software ANSYS (ANSYS Inc., Pittsburgh, PA, USA) [31]. A finite element model of the Yexihe Bridge is established by the software MIDAS (POSCO E&C, Pohang-si, Korea), as shown in Figure 13. The main girder, pier and pile foundation are simulated by beam element. According to the actual geological conditions, the length of the pile foundation takes the actual length. For all piers, the lateral and vertical relative displacement between the pier top and main beam is restrained. Pier 1 is a fixed bearing, and the longitudinal relative displacements between Pair 1 and main beam is restrained. The main girder is meshed by 268 (finest mesh) elements can give us optimal combination of accuracy and efficiency. The piers and the pile caps are divided into 47 (coarsest mesh) elements, and the pile foundation is divided into 48 elements. The materials of the main girder, the pier and the pile foundation are the C55, C25, and C30 concrete, respectively. The elastic modulus of the C55, C25, and C30 concrete are 36, 30, and 32 GPa, respectively. The Poisson ratio and unit weight of the concrete are 0.2 and 25 kN/m3, respectively.
The vibration equation of the bridge can be expressed as:
where , and are the mass, damping, and stiffness matrices of the bridge, respectively; , and are the nodal acceleration, velocity, and displacement vectors of the bridge, respectively; is the external force vector acting on a bridge. Rayleigh damping was adopted in the finite element model.
6.2. Vehicle Model
In order to compare the impact effect of different train types on bridges, the finite element analysis of freight train-bridge system and passenger train-bridge system was carried out. The parameters of freight trains are the same as the parameters of the test train. Passenger trains consist of 2 locomotive (SS8) and 19 carriages (25B semi-cushioned coach). The weight of SS8 is 88 t and the weight of each carriage is 44.7 t. Each carriage has a capacity of 128 people, and the average weight per person is assumed to be 80 kg, which is defined from China’s Ministry of Railways in 2001. The total weight and length of a passenger train is 1220 t and 517 m. The axle spacing of the carriage is 25.5 m. In the analysis, it is assumed that the carbody, bogie and wheelset are symmetrical rigid bodies, and all of them are micro vibration, regardless of the nonlinear characteristics of suspension components (spring and damping). The body and each bogie are simplified to have 5 DOFs (Degree of Freedoms), which are the yawing, vertical settlement, rolling, shaking and nodding. For each wheel-set, yawing, vertical settlement, rolling, and shaking motions are considered. In total, each 4-axis vehicle has 31 DOFs as shown in Figure 14.
Based on the theory of multi-body dynamic system, the dynamic equation of the vehicle can be expressed as:
where , and are the mass, damping, and stiffness matrices of the vehicle, respectively; , and are the acceleration, velocity, and displacement vectors of the vehicle, respectively; denotes the exciting force vector.
6.3. Track Irregularity
The vibration of the bridge will cause the vibration of the track on the bridge. In order to simplify the calculation, the elastic vibration of the track relative to the bridge is ignored. The track and bridge are considered as a whole and the dynamic characteristics of the track are not considered. The following four cases are considered to calculate the track irregularity: (1) the vertical elevation deviation of the central line; (2) the transverse position deviation of the center line; (3) the gauge deviation between the left and right rail; (4) the vertical elevation deviation of the left and right rail. Referring to the sixth grade track irregularity power-spectral-density of US railways, the samples of level track irregularity and direction track irregularity are simulated by the trigonometric series approach, as shown in Figure 15.
6.4. Train-Bridge Interation
The vehicle subsystem and the bridge subsystem are coupled through the wheel rail contact relationship. Hertz’s nonlinear theory [32] is employed for wheel-rail contact in the model. The normal contact force between wheel and rail is determined by the Hertz nonlinear elastic contact theory and the tangential contact force between wheel and rail is determined by the Kalker linear creep theory [33]. According to the consistency between the force (displacement) of the wheel rail contact point and the force (displacement) of the bridge node, and considering the track irregularity, the coupling relationship between the vehicle and the bridge can be obtained as follows:
where , , , , and are related to the vibration state of the bridge and vehicles. The force vector is . Subscripts b and v denote the bridge and vehicle.
6.5. Model Validation
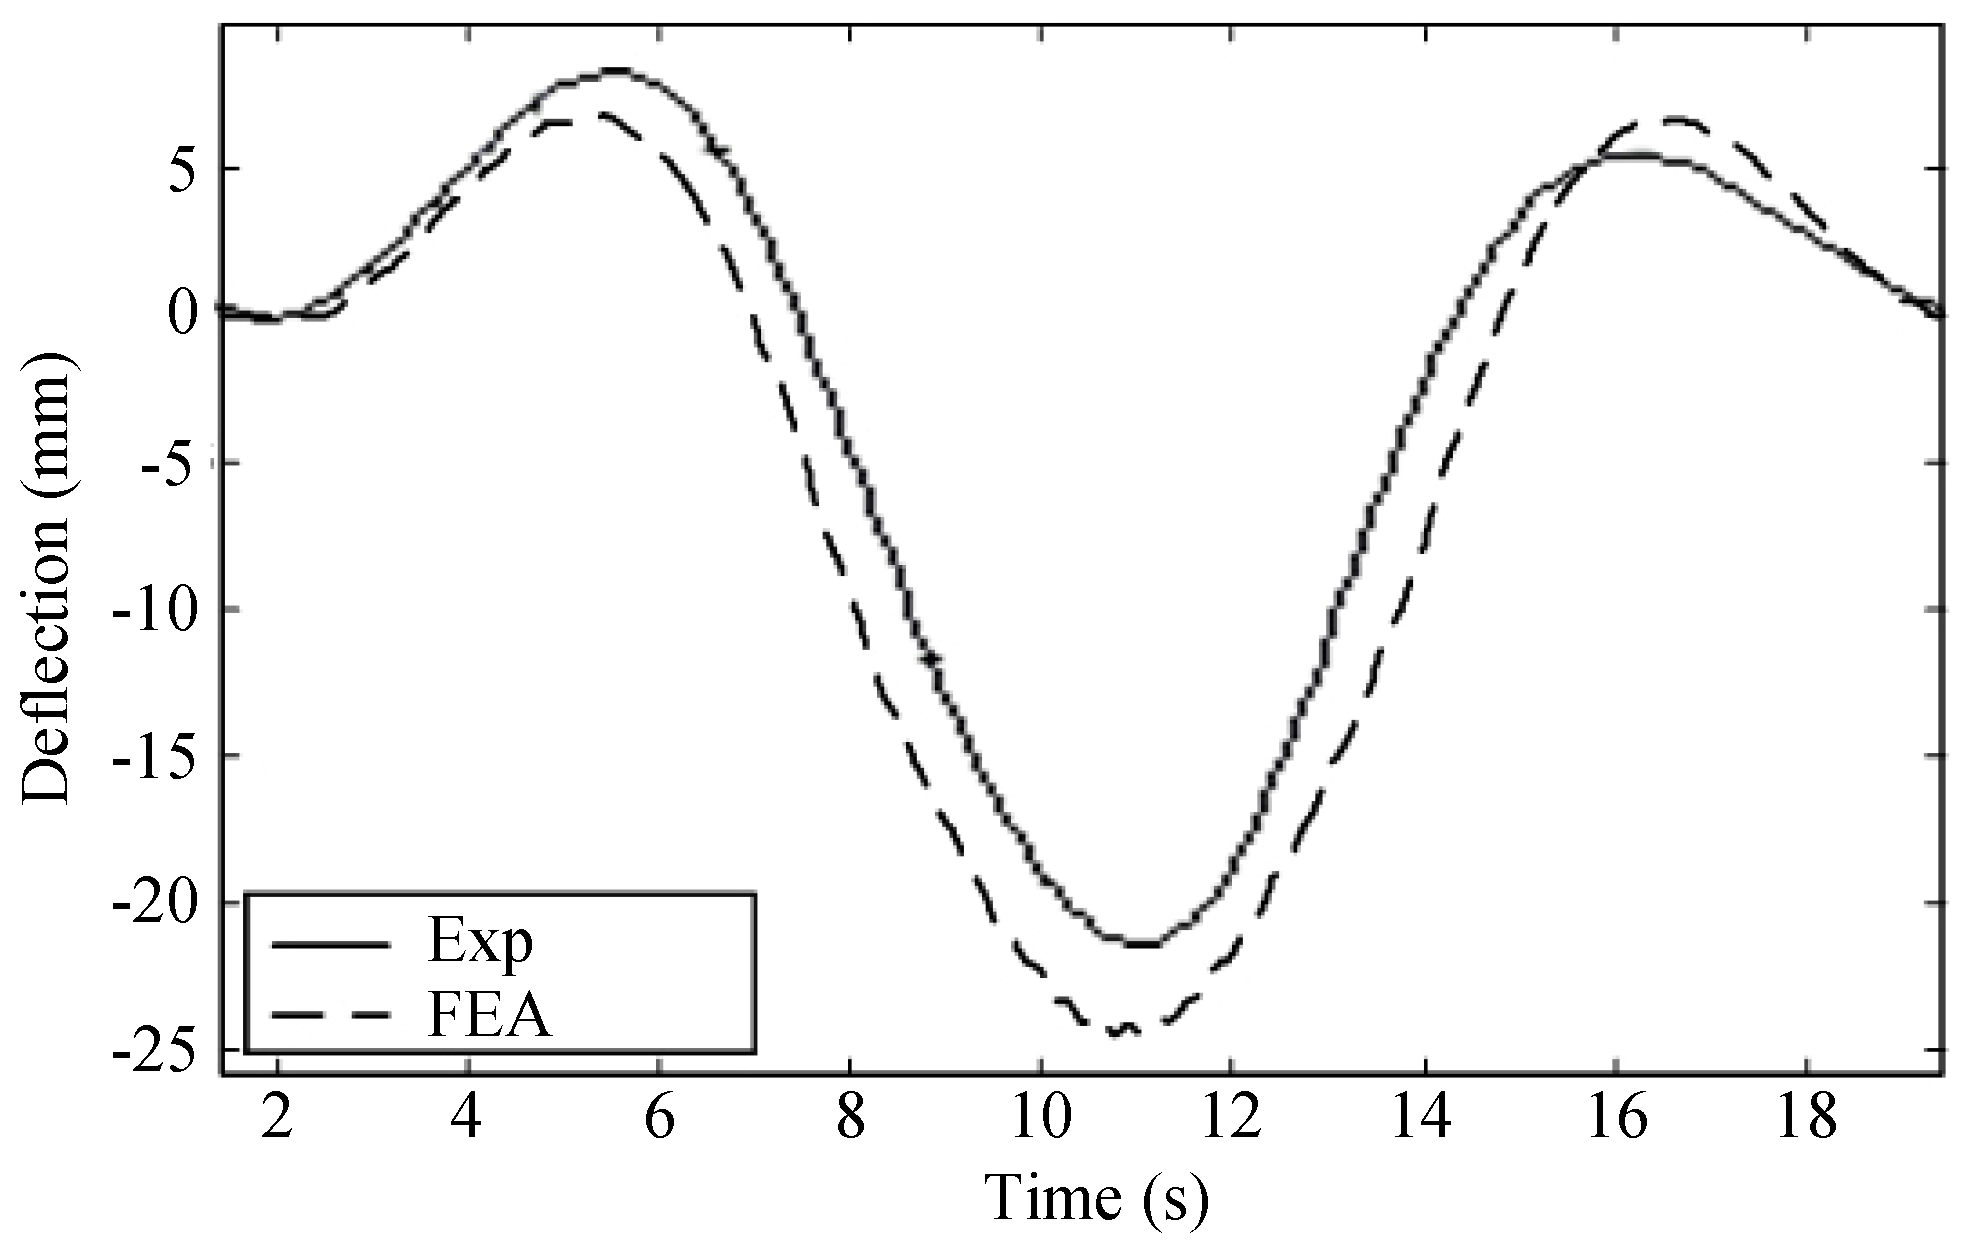
As an example of verifying the model, Figure 16 gives the comparison of numerical and measured deflection histories at the mid-span of the central span subjected to one freight train traveling on the bridge at 80 km/h. The trends and values of the two curves are very consistent, which shows that the model is better for simulating the field test conditions. The reason for the error of the experimental results and the numerical results may be that the residual deformation caused by the long-term work of the actual bridge weakens its elastic working performance. Moreover, the two curves are all smooth, which indicates that the impact effect of moving train on bridge deflections is small.
7. Analysis of Dynamic Effects of Train–Bridge System
The variation law of bridge vertical vibration with train speeds and the resonance speed of the train-bridge system can be obtained by vibration analysis of the bridge under moving load. The calculated speed range is 5–150 km/h for the freight train and 10–200 km/h for the passenger train.
Figure 17 shows the IMs calculated from deflections (without considering the track irregularity) with one freight train (or passenger train) traveling on the bridge. There are several peaks in the IM curves, and the peaks of the side span and central span appear at different positions, which shows that the resonance may occur at multiple speeds when the train is traveling on the bridge and the resonance of each span of the continuous beam bridge occur at different loading condition. The impact factor curves of the two side spans are consistent, while the impact factor curves of the side span and the central span are different. This phenomenon shows that the long-span continuous bridge cannot maintain the continuity of its deformation, especially under instantaneous impact load. Each span of the continuous bridge acts as a simply supported beam. The subtle difference between the IMs of two side spans indicates that the impact effects of the train entering the bridge from different directions on the bridge are different. Moreover, the maximum IMs of the side span are slightly higher than those of the central span. Thus, for three-span continuous bridge, the impact effects of moving trains on the central span are less than the impact effects of moving trains on the side spans. Furthermore, the IMs of the bridge under the moving passenger train is larger than those under the moving freight train. The reason is that, although the total weight of the freight train is less than that of the passenger train, the axle load of the freight train is greater than that of the passenger train. Meanwhile, the freight train has a shorter axle spacing, so that the maximum weight of the passenger train loaded on the bridge is less than the maximum weight of the freight train loaded on the bridge. Therefore, the freight train causes greater load effects and the passenger train causes greater impact effects, which is consistent with the experimental results. Another interesting finding is that although the IM does not increase obviously with the increase of the train speed, the peak values of the IM at high speeds are significantly greater than those at low speeds. Figure 17 shows a weak correlation between the IM and the train speed. But, there exists a linear increasing trend from the overall development trend of the IM with the increase of train speed [17,28]. When a freight train crosses the bridge at a speed of 145 km/h, the bridge has a maximum IM of 0.05. When a passenger train crosses the bridge at a speed of 185 km/h, the bridge has a maximum IM of 0.12. The maximum value appear in the mid-span of the right span.
Figure 18 shows the IMs calculated from deflections with considering the track irregularity. It can be seen that the track irregularity has significant influence on the calculated value of the IMs by comparing Figure 16 and Figure 18. The calculated values of the IMs with consideration of the track irregularity are larger than that without consideration of the track irregularity, especially when the train is running at high speeds. Moreover, after considering the track irregularity, the location of the peak of the IM curve has changed, which indicates that the track irregularity will influence the occurrence of train-bridge resonance. As Wang and Jiang [3] reported, the resonance of the vehicle-bridge system is determined by the vehicle speed, the road roughness, and the bridge frequency. Therefore, multiple factors should be taken into account when analyzing the impact effect of moving trains on the bridge.
8. Conclusions
In this study, an evaluation of dynamic effects for a long span high-speed railway continuous beam bridge was carried out using the deflection and strain data from field tests and finite element analysis. The following conclusions are drawn:
- The IMs from one train running on one track is greater than that from two trains running on two tracks. The average value of IMs of the central span is 0.15 under one running train condition and 0.11 under two running trains condition. A peak IM (0.19) occurred when one train travelled on the bridge at 20 km/h, which suggests that a resonance occurred. The IM is insensitive to the train speed. But from the overall development law, with the increase of train speed, the IM increases. The weight of vehicles has a significant influence on the IMs. The IM decreases with the increase of the weight of vehicles. Meanwhile, the IMs were found to depend strongly on the track irregularity, the track irregularity will greatly increase the IMs. Resonance may occur at multiple speeds, and will be affected by the track surface conditions. The IM calculated from deflections is smaller than the IM calculated from strains. So it is not reasonable to assign the same IM for different load effects. The IM calculated from strains reflects the local dynamic performance of the structure, and the IM calculated from deflections reflects the overall dynamic performance of the structure.
- The IMs obtained by experimental and numerical analysis are greater than the design value specified in the bridge code, which indicates that the bridge code underestimates the impact effect of the train on the bridge. Therefore, the authors recommend the design value of the IM should be properly improved in the bridge design. Because the long-term operation of the bridge will lead to the deterioration of the track surface conditions, and the train-bridge interaction will be more intense, which may seriously aggravate the impact of train on bridges. Thus maintaining good track surface conditions is very important for ensuring the safe operation of bridges. Moreover, when a component of bridge structures needs to be independently designed, the strain IM should be adopted.
Author Contributions
The authors have contributed equally to this work. Hongye Gou and Xiaobin Li conceived and designed the experiments; Wen Zhou performed the experiments; Wen Zhou and Yi Bao analyzed the data; Qianhui Pu contributed reagents/materials/analysis tools; Hongye Gou wrote the paper.
Acknowledgments
The research described in this paper was financially supported by the National Natural Science Foundation of China (Grant Nos. 51508474 and 51108382), the Sichuan Science and Technology Program (Grant No. 2018JY0294), and the Science and Technology Research and Development Plan of China Railway Construction (Grant No. 2014-C34).
Conflicts of Interest
The authors declare no conflict of interest.
References
- Xia, C.Y.; Lei, J.Q.; Zhang, N.; Xia, H.; Roeck, G.D. Dynamic analysis of a coupled high-speed train and bridge system subjected to collision load. J. Sound Vib. 2012, 331, 2334–2347. [Google Scholar] [CrossRef]
- Jung, H.; Kim, G.; Park, C. Impact factors of bridges based on natural frequency for various superstructure types. KSCE J. Civ. Eng. 2013, 17, 458–464. [Google Scholar] [CrossRef]
- Wang, L.B.; Jiang, P.W. Research on the computational method of vibration impact coefficient for the long-span bridge and its application in engineering. J. Vibroeng. 2016, 18, 394–407. [Google Scholar]
- Xu, T.; Castel, A. Modeling the dynamic stiffness of cracked reinforced concrete beams under low-amplitude vibration loads. J. Sound Vib. 2016, 368, 135–147. [Google Scholar] [CrossRef]
- Wei, K.; Myers, A.T.; Arwade, S.R. Dynamic effects in the response of offshore wind turbines supported by jackets under wave loading. Eng. Struct. 2017, 142, 36–45. [Google Scholar] [CrossRef]
- Gou, H.Y.; Wang, W.; Shi, X.Y.; Pu, Q.H.; Kang, R. Behavior of steel-concrete composite cable anchorage system. Steel Compos. Struct. 2018, 26, 115–123. [Google Scholar]
- Gao, Q.F.; Wang, Z.L.; Li, J.; Chen, C.; Jia, H.Y. Dynamic load allowance in different positions of the multi-span girder bridge with variable cross-section. J. Vibroeng. 2015, 17, 2025–2039. [Google Scholar]
- Gu, G.; Kapoor, A.; Lilley, D.M. Calculation of dynamic impact loads for railway bridges using a direct integration method. Proc. Inst. Mech. Eng. F -J. 2008, 222, 385–398. [Google Scholar] [CrossRef]
- Gou, H.Y.; Shi, X.Y.; Zhou, W.; Cui, K.; Pu, Q.H. Dynamic performance of continuous railway bridges: Numerical analyses and field tests. Proc. Inst. Mech. Eng. F -J. 2018, 232, 936–955. [Google Scholar] [CrossRef]
- Majka, M.; Hartnett, M. Effects of speed, load and damping on the dynamic response of railway bridges and vehicles. Comput. Struct. 2008, 86, 556–572. [Google Scholar] [CrossRef]
- Yin, C.; Wei, B. Numerical simulation of a bridge-subgrade transition zone due to moving vehicle in Shuohuang heavy haul railway. J. Vibroeng. 2013, 15, 1041–1047. [Google Scholar]
- Lee, H.H.; Jeon, J.C.; Kyung, K.S. Determination of a reasonable impact factor for fatigue investigation of simple steel plate girder railway bridges. Eng. Struct. 2012, 36, 316–324. [Google Scholar] [CrossRef]
- Hamidi, S.A.; Danshjoo, F. Determination of impact factor for steel railway bridges considering simultaneous effects of vehicle speed and axle distance to span length ratio. Eng. Struct. 2010, 32, 1369–1376. [Google Scholar] [CrossRef]
- Gou, H.Y.; Long, H.; Bao, Y.; Chen, G.D.; Pu, Q.H.; Kang, R. Experimental and numerical studies on stress distributions in girder-arch-pier connections of long-span continuous rigid frame arch railway bridge. J. Bridge Eng. 2018, in press. [Google Scholar] [CrossRef]
- Gou, H.Y.; He, Y.N.; Zhou, W.; Bao, Y.; Chen, G.D. Experimental and numerical investigations of the dynamic responses of an asymmetrical arch railway bridge. Proc. Inst. Mech. Eng. F -J. 2018. [Google Scholar] [CrossRef]
- Gou, H.Y.; Long, H.; Bao, Y.; Chen, G.D.; Pu, Q.H. Dynamic behavior of hybrid framed arch railway bridge under moving trains. Steel Compos. Struct. 2018, in press. [Google Scholar]
- Ding, Y.; Wang, G. Evaluation of dynamic load factors for a high-speed railway truss arch bridge. Shock Vib. 2016, 2016, 5310769. [Google Scholar]
- Kaloop, M.R.; Hu, J.W.; Elbeltagi, E. Evaluation of High-speed Railway Bridge based on Nondestructive Monitoring System. Appl. Sci. 2016, 6, 24. [Google Scholar] [CrossRef]
- Gou, H.Y.; Zhou, W.; Chen, G.D.; Bao, Y.; Pu, Q.H. In-situ test and dynamic analysis of a double-deck tied-arch bridge. Steel Compos. Struct. 2018, 27, 161–175. [Google Scholar]
- Flener, E.B.; Karoumi, R. Dynamic testing of a soil–steel composite railway bridge. Eng. Struct. 2009, 31, 2803–2811. [Google Scholar] [CrossRef]
- Khan, E.; Linzell, D.G.; Frankl, B.A.; Lobo, J.A.; Lozano, S. Field Measured Dynamic Effects and Load Distribution in a Prestressed Concrete Light Rail Bridge. In Proceedings of the Joint Rail Conference, Columbia, SC, USA, 12–15 April 2016. [Google Scholar]
- Research Institute of Highway Ministry. Test Method of Long Span Concrete Bridge; Research Institute of Highway Ministry: Beijing, China, 1982. (In Chinese) [Google Scholar]
- Chinese Railway Ministry. Fundamental Code for Design on Railway Bridge and Culvert; Chinese Railway Ministry: Beijing, China, 2005. (In Chinese)
- Senthilvasan, J.; Thambiratnam, D.P.; Brameld, G.H. Dynamic response of a curved bridge under moving truck load. Eng. Struct. 2002, 24, 1283–1293. [Google Scholar] [CrossRef]
- Aluri, S.; Jinka, C.; GangaRao, H.V. Dynamic response of three fiber reinforced polymer composite bridges. J. Bridge Eng. 2005, 10, 722–730. [Google Scholar] [CrossRef]
- Li, H.; Wekezer, J.; Kwasniewski, L. Dynamic response of a highway bridge subjected to moving vehicles. J. Bridge Eng. 2008, 13, 439–448. [Google Scholar] [CrossRef]
- Szurgott, P.; Wekezer, J.; Kwasniewski, L.; Siervogel, J.; Ansley, M. Experimental assessment of dynamic responses induced in concrete bridges by permit vehicles. J. Bridge Eng. 2011, 16, 108–116. [Google Scholar] [CrossRef]
- Ashebo, D.B.; Chan, T.H.T.; Yu, L. Evaluation of dynamic loads on a skew box girder continuous bridge Part II: Parametric study and dynamic load factor. Eng. Struct. 2007, 29, 1064–1073. [Google Scholar] [CrossRef]
- Huang, D. Dynamic and impact behavior of half-through arch bridges. J. Bridge Eng. 2005, 10, 133–141. [Google Scholar] [CrossRef]
- Moghimi, H.; Ronagh, H.R. Impact factors for a composite steel bridge using non-linear dynamic simulation. Int. J. Impact Eng. 2008, 35, 1228–1243. [Google Scholar] [CrossRef]
- Liu, C.L.; Yin, X.Q.; Lin, G.; Hu, Z.Q. Seismic response analysis of a time-varying high speed train-rail-bridge system based on ANSYS. J. Vib. Shock 2013, 32, 58–64. [Google Scholar]
- Johnson, K.L. Contact mechanics. J. Tribol. 1986, 108, 464. [Google Scholar] [CrossRef]
- Kaker, J.J. Three-Dimensional Elastic Bodies in Rolling Contact; Kluwer Academic Publishers: Dordrecht, The Netherlands, 1990; Volume 2, p. 255. [Google Scholar]
Figure 1.
The Yexihe Bridge (unit: cm): (a) elevation view; (b) cross sections of A-A to C-C.

Figure 2.
Axle load distribution of trains (unit: m).

Figure 3.
Loading cases of static tests (unit: cm).

Figure 4.
Loading cases of dynamic tests (unit: mm).

Figure 5.
(a) Maximum moment of each section under the most unfavorable loading case; (b) Experimental results of the load efficiency factor.
Figure 5.
(a) Maximum moment of each section under the most unfavorable loading case; (b) Experimental results of the load efficiency factor.

Figure 6.
Load efficiency factors of Sections A-A and C-C in different loading cases.

Figure 7.
Frequency spectrum of the bridge structure: (a) transverse vibration; (b) vertical vibration.
Figure 7.
Frequency spectrum of the bridge structure: (a) transverse vibration; (b) vertical vibration.

Figure 8.
Natural frequencies and corresponding vibration modes: (a) Longitudinal bending of fixed pier (f = 0.433 Hz); (b) 1st transverse bending (f = 0.769 Hz); (c) 2nd transverse bending (f = 1.026 Hz); (d) Longitudinal bending of pier 2# (f = 1.191 Hz); (e) 1st vertical bending (f =1.567 Hz).
Figure 8.
Natural frequencies and corresponding vibration modes: (a) Longitudinal bending of fixed pier (f = 0.433 Hz); (b) 1st transverse bending (f = 0.769 Hz); (c) 2nd transverse bending (f = 1.026 Hz); (d) Longitudinal bending of pier 2# (f = 1.191 Hz); (e) 1st vertical bending (f =1.567 Hz).

Figure 9.
Comparison of time history curves of the static and dynamic deflection when two freight trains run on the bridge.
Figure 9.
Comparison of time history curves of the static and dynamic deflection when two freight trains run on the bridge.

Figure 10.
Impact factors calculated from deflections: (a) Section A-A; (b) Section C-C.

Figure 11.
Impact factors calculated from strains of test points: (a) P1/P2; (b) P5/P6; (c) P3/P7; (d) P4/P8.
Figure 11.
Impact factors calculated from strains of test points: (a) P1/P2; (b) P5/P6; (c) P3/P7; (d) P4/P8.

Figure 12.
Strain time histories of point P1 with one train running on the bridge.

Figure 13.
Three-dimensional FE model of Yexihe Bridge.

Figure 14.
The 31-DOF model of a carriage.

Figure 15.
Simulation sample of track irregularity: (a) transverse; (b) vertical.

Figure 16.
Comparison of numerical and measured deflection histories at the mid-span of the central span with one freight train passing through the bridge at 80 km/h.
Figure 16.
Comparison of numerical and measured deflection histories at the mid-span of the central span with one freight train passing through the bridge at 80 km/h.

Figure 17.
Impact factors calculated from deflections (track irregularity is not considered) under: (a) one freight train; (b) one passenger train.
Figure 17.
Impact factors calculated from deflections (track irregularity is not considered) under: (a) one freight train; (b) one passenger train.

Figure 18.
Impact factors calculated from deflections (track irregularity is considered) under: (a) one freight train; (b) one passenger train.
Figure 18.
Impact factors calculated from deflections (track irregularity is considered) under: (a) one freight train; (b) one passenger train.


Table 1.
Comparison between the IM from experimental data and the IM from bridge code.
| Location | IM from Experimental Data | IM from Bridge Code | |
|---|---|---|---|
| Deflection IM | Strain IM | ||
| Section A-A | 0.110 | — | 0.087 |
| Section B-B | — | 0.17 | 0.087 |
| Section C-C | 0.070 | 0.19 | 0.087 |
© 2018 by the authors. Licensee MDPI, Basel, Switzerland. This article is an open access article distributed under the terms and conditions of the Creative Commons Attribution (CC BY) license (http://creativecommons.org/licenses/by/4.0/).
Share and Cite
MDPI and ACS Style
Gou, H.; Zhou, W.; Bao, Y.; Li, X.; Pu, Q. Experimental Study on Dynamic Effects of a Long-span Railway Continuous Beam Bridge. Appl. Sci. 2018, 8, 669. https://doi.org/10.3390/app8050669
AMA Style
Gou H, Zhou W, Bao Y, Li X, Pu Q. Experimental Study on Dynamic Effects of a Long-span Railway Continuous Beam Bridge. Applied Sciences. 2018; 8(5):669. https://doi.org/10.3390/app8050669
Chicago/Turabian StyleGou, Hongye, Wen Zhou, Yi Bao, Xiaobin Li, and Qianhui Pu. 2018. "Experimental Study on Dynamic Effects of a Long-span Railway Continuous Beam Bridge" Applied Sciences 8, no. 5: 669. https://doi.org/10.3390/app8050669
Note that from the first issue of 2016, this journal uses article numbers instead of page numbers. See further details here.