Article

Peak Load Regulation and Cost Optimization for Microgrids by Installing a Heat Storage Tank and a Portable Energy System

1
Department of Electrical Engineering, Northeast Electric Power University, Jilin 132012, China
2
China Electric Power Research Institute, Beijing 100192, China
3
Yingkou Electric Power Supply Company of State Grid, Yingkou 115000, China
*
Author to whom correspondence should be addressed.
Appl. Sci. 2018, 8(4), 567; https://doi.org/10.3390/app8040567
Submission received: 2 March 2018 / Revised: 25 March 2018 / Accepted: 25 March 2018 / Published: 5 April 2018
(This article belongs to the Section Energy Science and Technology)

Abstract

:
With the rapid growth of electricity demands, many traditional distributed networks cannot cover their peak demands, especially in the evening. Additionally, with the interconnection of distributed electrical and thermal grids, system operational flexibility and energy efficiency can be affected as well. Therefore, by adding a portable energy system and a heat storage tank to the traditional distributed system, this paper proposes a newly defined distributed network to deal with the aforementioned problems. Simulation results show that by adding a portable energy system, fossil fuel energy consumption and daily operation cost can be reduced by 8% and 28.29%, respectively. Moreover, system peak load regulating capacity can be significantly improved. However, by introducing the portable energy system to the grid, system uncertainty can be increased to some extent. Therefore, chance constrained programming is proposed to control the system while considering system uncertainty. By applying Particle Swarm Optimization—Monte Carlo to solve the chance constrained programming, results show that power system economy and uncertainty can be compromised by selecting appropriate confidence levels α and β. It is also reported that by installing an extra heat storage tank, combined heat and power energy efficiency can be significantly improved and the installation capacity of the battery can be reduced.

1. Introduction

In order to fully develop the benefits of renewable energy generation systems, the integration and optimization of microgrids have become hotspots of recent research [1]. The microgrid is a new type of network supply and management technology, which can provide convenient access to renewable energy systems. Today, it plays an increasingly important role as the supplementary of the main grid [2,3]. However, with the rapid development of the industry, the electrical demands of a distributed network are increased sharply, which makes it difficult to meet network peak demand, especially in the evening.
To cope with the rapid growth of network electrical demands, it was the first time that a portable energy resource system was introduced in [4] to regulate peak demand and to participate in system demand response program. By adding an extra portable energy system, this can increase system peak load regulating capacity; however, this method can result in the increase of system uncertainty and this method also neglects system thermal demand.
As for the increase of system uncertainty, it is mainly caused by the added renewable energy generators. As reported in [5,6,7], it is very difficult to predict wind output because of the high randomness of the wind speed, which makes it troublesome to accurately control the small-scaled wind turbine system. Moreover, scattered solar radiation increases the difficulty in predicting photovoltaic (PV) panel output, which is clearly demonstrated in [8,9,10]. Therefore, after adding a small-scaled portable wind turbine and a set of PV panels to the distributed microgrid, system uncertainty can be increased to some extent.
Additionally, by simply adding an extra portable energy system to the distributed network, Tabar V. S. et al. neglect the influence of the newly introduced portable energy system on heat loads [4]. Considering that sizing and controlling combined heat and power (CHP) units are mainly dependent on the heat loads [11], simply introducing a portable energy system can lead to the CHP generating redundant heat or power [12]. In [13], an economic operation model of the CHP is established, and it demonstrates that the output power of the CHP is constrained by the thermal demand, which can affect the peak load regulating capacity of the CHP. In [14], it is reported that the coupling effect of heat and power can cause the wind turbine power curtailment condition, which reduces energy efficiency. Therefore, it is quite uneconomic if the portable energy resource system is directly connected to the distributed network without decoupling heat and power.
To solve system uncertainty, many existing mathematical models have been developed in previous literature; for example, the expected value model, fuzzy programming and chance constrained programming, and so forth [15,16,17]. Compared with other models, chance constrained programming is more flexible, and it can coherently consider the uncertainty variables in the objective function and the constraints. Therefore, in this paper, chance constrained programming is applied to model the economy and safety operation of the distributed network. In previous literature, many optimization algorithms have been raised to solve chance constrained programming; for example, the genetic algorithm, the ant colony algorithm, and the particle swarm optimization [18,19,20]. Compared with other algorithms, the particle swarm optimization (PSO) algorithm has the obvious advantages of easy implementation, fewer parameters, and better optimization ability. However, the PSO algorithm needs fixed parameters and it cannot be used to deal with the stochastic variables in an efficient way. Therefore, the stochastic variables need to be converted to the fixed variables before implementing the PSO. It is stated in [21] that the Monte Carlo simulation is an efficient tool to model electrical characteristics of power systems, which makes it possible to covert the stochastic variables (e.g., outputs of wind turbines, PVs, and electric loads) to the fixed variables. Therefore, this paper develops a combined Particle Swarm Optimization—Monte Carlo (PSO–MC) algorithm to optimize the chance constrained programming, which eliminates stochastic variables and reduces operation parameters.
To deal with the coupling effects of heat and power in energy system optimization, an extra thermal energy storage system is added to the microgrid to increase the system operation efficiency and the peak load regulating capacity in [22]; and in [23], a boiler and a thermal energy storage tank are installed in the microgrid to decouple heat and power, which increases the flexibility of CHP operation. Therefore, based on the existing research, to improve network efficiency, an extra heat storage tank is installed to the distributed network to decouple heat and power.
Therefore, the main contributions of this paper can be summarized as follows: (1) it is the first time that a portable energy storage system is installed in the microgrid to increase power system peak load regulating capacity, taking thermal demand into consideration; (2) the combined PSO–MC algorithm is proposed to optimize power system operation, which reduces the stochastic variables and accelerates computation speed; (3) a heat storage tank is introduced to the distributed microgrid to decouple heat and power, and by doing that fossil energy efficiency is significantly improved and battery installation capacity is reduced as well.

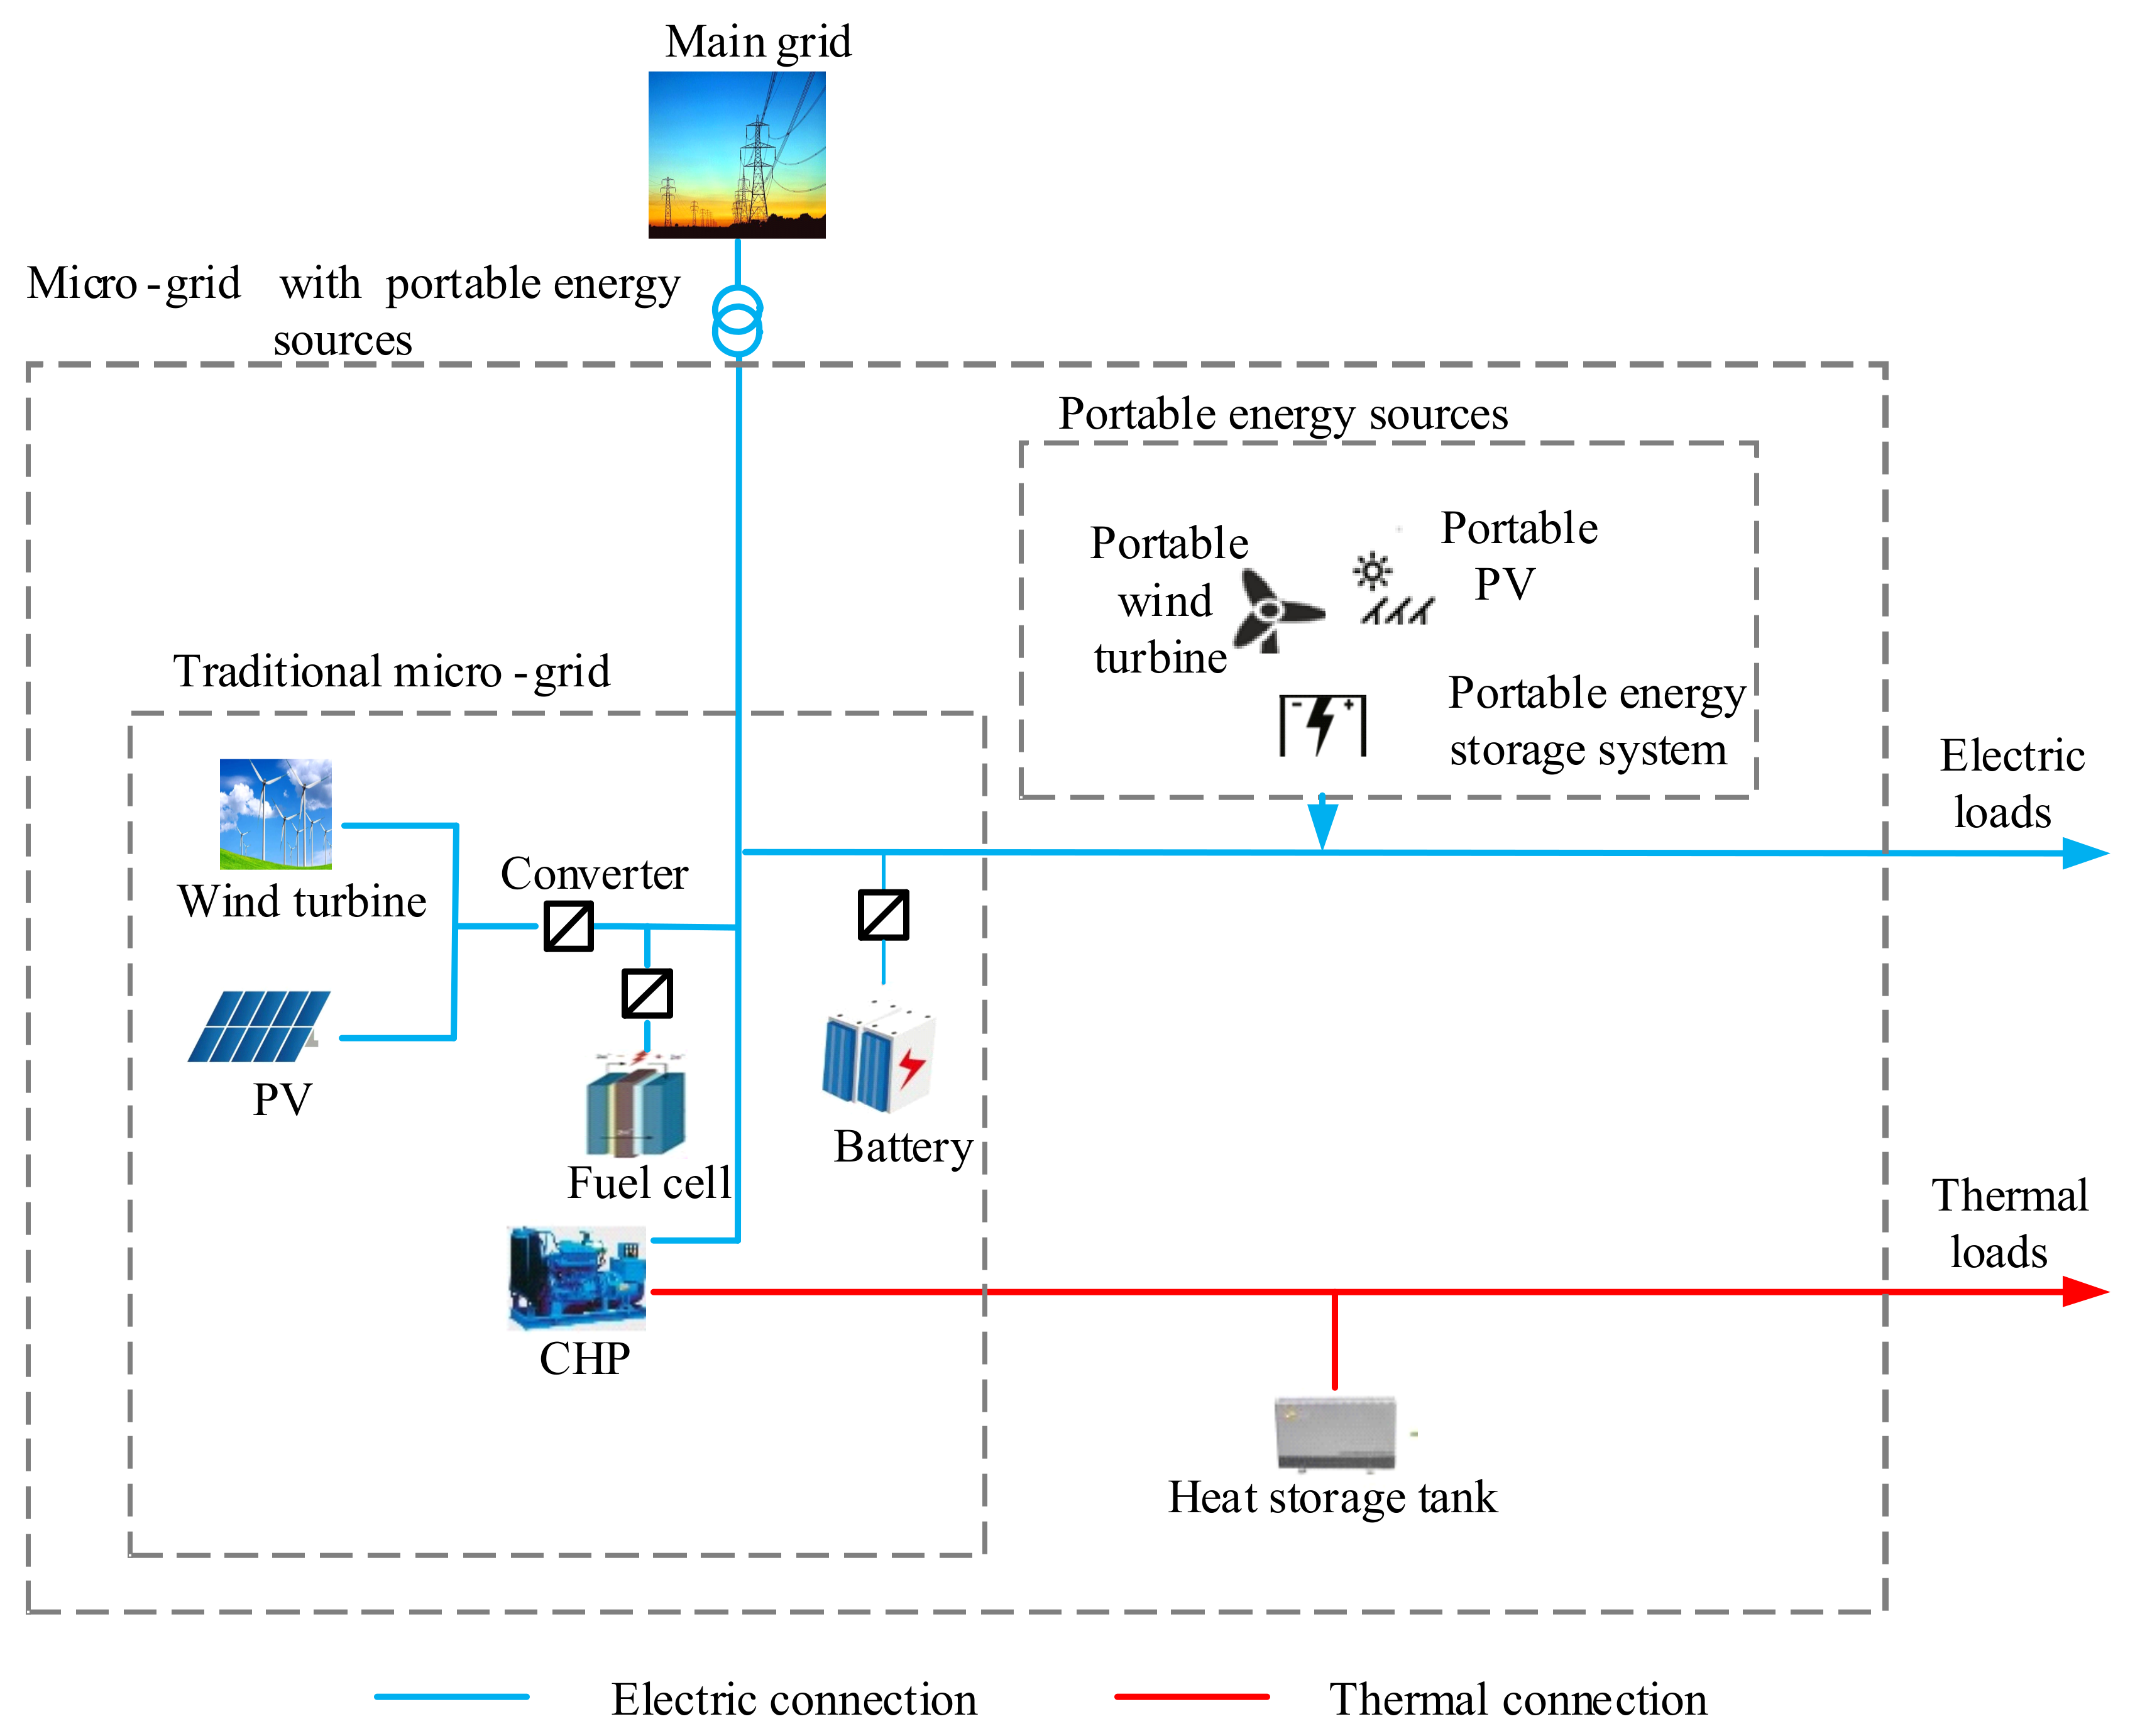
2. Modelling of Microgrids

In this section, the structure of a newly defined microgrid will be introduced at the beginning. In the following part of this section, the mathematical power flow models and economic evaluation models of all energy carriers are reviewed, to prepare for optimizing the power flow within the distributed network in the following sections.

2.1. The Structure of Microgrids

As shown in Figure 1, a traditional microgrid normally equips a distributed wind turbine system and a PV system to supply electrical power. However, renewable generators have great uncertainties compared with fossil fuel generators. To cope with the uncertainties caused by renewable energy systems, there are two key solutions. First, connect the renewable energy system to the grid and equip local fossil fuel generators (for example, fuel cells). By introducing fossil fuel generators to the distributed network, the uncertainties caused by the renewable system can be improved to some extent. Alternatively, batteries are one of the best choices to deal with the uncertainties caused by the renewable energy system. They can be charged by the redundant electrical power generated by the renewable energy system, and they can also be discharged immediately when needed.
For a traditional microgrid system, it needs some thermal generators to generate and store thermal energy. CHP is one of the most widely used infrastructures in traditional distributed networks due to its high output efficiency. However, CHP couples electrical and heat outputs together, and in this context, redundant heat may be generated by CHP when it is used to supply electrical demand. Therefore, a heat storage tank is installed together with CHP to decouple heat and power in this paper.
With the increasing number of electrical loads, traditional microgrids cannot cover all electrical demands, especially in the peak demand time [24]. In this paper, it is the first time that the portable energy system is connected to the distributed network to supply power at the peak demand time while considering the coupling effects between heat output and electrical output.

2.2. Modeling of Different Energy Carriers

In this section, the mathematical power flow models of all energy infrastructures shown in Figure 1 are proposed to illustrate the work conditions of different energy carriers. Additionally, the economic evaluation models of all energy carriers are analyzed in this section.

2.2.1. Portable Resources Modeling

A portable renewable energy generation system includes three parts: a small-scaled portable wind turbine, a set of PV panels, and an energy storage system.

Portable Wind Turbine Modeling

The output power of a portable wind turbine system can be greatly influenced by the wind speed, blade area, and air density, and the mathematical expression of the wind turbine system can be expressed as:
P W T , P O R T = { 0 v < v i   or   v > v 0 0.5 ρ A η w min ( v , v nom ) 3 v i v v 0

Portable PV System Modeling

The output power of a PV system can be directly affected by the ambient temperature and light intensity [25]; therefore, the output power of a portable PV system can be approximately equal to Equation (2):
P P V , P O R T ( t ) = P P V , S T C G T ( t ) G T S T C ( 1 γ ( T b ( t ) T r ) )
where:
T b ( t ) = T a m p ( t ) + G T ( t ) G T S T C ( T N O C 20 )

Portable Energy Storage System Modeling

By participating in demand–response activities, local consumers can achieve the financial incentives granted by the government. Moreover, the operational cost of a portable energy storage system is relatively low compared with importing energy from the main grid; therefore, local users’ total energy cost can be reduced significantly by installing a portable energy storage system. Equation (4) is the mathematical expression of the profit that consumers can obtain by participating in demand–response activities.
B B , P O R T = t = 1 T P B , P O R T ( t ) R P O R T θ
where:
P B , P O R T ( t ) = ( P W T , P O R T ( t ) + P P V , P O R T ( t ) ) η B , P O R T

2.2.2. CHP System Modeling

CHP has many potential advantages, for example, high energy efficiency, easy maintenance, and environmental friendliness. However, with the increasing number of CHP units, redundant electricity would be generated at a low-demand time, which can decrease the penetration rate of renewable energy. Therefore, state-of-the-art CHP units are installed together with heat storage tanks to decouple heat and power.

CHP Unit Modeling

For a gas engine CHP unit, the electrical output is constant if it works at the rated condition. The thermal output is related to the electrical output and the heat-to-power ratio of the CHP. Therefore, the mathematical expression of the CHP thermal output can be formulated as:
Q C H P ( t ) = P C H P ( t ) R H P
where:
R H P = ( 1 η C H P η C H P , l o s s ) η C H P
Even though gas engine CHP units are relatively environmentally friendly, they need to consume fossil fuel to generate heat and power. The cost of spending on the fuel cell is [13]:
C C H P , f = c L θ C H P P C H P η C H P

Heat Storage Tank Modeling

The total thermal energy stored in the heat storage tank at time t (EHST (t)) is directly related to the thermal energy stored in the heat storage tank at the previous time interval (EHST (t − 1)) and the heat storage charge efficiency (ηHST,ch)/discharge efficiency (ηHST,dis), and it can be expressed as [26]:
E H S T ( t ) = { E H S T ( t 1 ) + η H S T , c h Q H S T ( t ) θ H S T ,   Q H S T ( t ) 0 E H S T ( t 1 ) + η H S T , d i s Q H S T ( t ) θ H S T ,   Q H S T ( t ) < 0

2.2.3. Fuel Cell System Modeling

The output power of fuel cells is directly related to its power generation efficiency and its installation capacity. Taking 40 kW IFC PC-29 fuel cell as an example, the mathematical expression of the fuel cell system output and system fuel cost can be expressed as [27,28]:
P F C ( t ) = 434.78 η F C + 292.83
C F C , f = c L θ F C P F C η F C

2.2.4. Battery System Modeling

There are three main states of a battery storage system, which are discharging, standby, and charging states. It is worth noting that battery storage systems can be charged or discharged at any time to collect or supply redundant power for distributed power systems, and they are not necessarily discharged at the peak price/demand time, compared with a portable energy storage system. As a core parameter to represent the amount of electrical energy left in a battery, the state of charge (SOC) is defined as [29]:
S O C B ( t ) = { S O C B ( t 1 ) P B ( t ) θ B η B , d i s E B P B ( t ) > 0 S O C B ( t 1 ) P B ( t ) = 0 S O C B ( t 1 ) P B ( t ) θ B η B , c h E B P B ( t ) < 0
Considering that the operational cost of a battery system is relatively low [30,31], the operational cost of implementing the battery storage system is neglected.

2.2.5. Renewable Energy Generator Modeling

The mathematical expressions of their outputs are similar to that of the portable wind turbine and portable PV systems, which are clearly demonstrated in Equations (1) and (2). Therefore, it will not be introduced in this part. Because renewable energy generators do not need to consume any fuel to generate power, the fuel costs are negligible for the wind turbine and PV systems.
In this section, the structure of the newly introduced microgrid system is introduced, and the mathematical power flow models and economic evaluation models of all energy carriers have been demonstrated. To optimize the distributed power system in a more feasible way, chance constrained programming is introduced to deal with power system constraints in the next section.

3. Constraints of Power System Operation

The economic energy dispatching of distributed networks is a complex constrained optimization problem, which contains multiple random variables. However, the classical method—the determined planning method—has difficulty in dealing with random variables accurately and efficiently. Therefore, chance constrained programming is proposed in the recent literature [17], to solve the uncertainties caused by the random variables.

3.1. The Objective Function

This paper tries to minimize the operational cost of the microgrid while taking carbon emissions into consideration. In addition, by setting the confidence level to restrain the objective function and the constraints, the stability of the distributed system can be guaranteed. Therefore, an objective function of the economic energy dispatch problem, which coherently considers system carbon emissions and operational cost, can be expressed as follows:
min   F m = t = 1 T ( i = 1 N C i , c + m ( t ) + C G ( t ) + C C H P , f ( t ) + C F C , f ( t ) +   C C H P , e ( t ) + C F C , e ( t ) B H ( t ) B B , P O R T ( t ) )
As demonstrated in the aforementioned sections, renewable power generation and electrical demands have great uncertainties. In other words, the distributed power system cannot be controlled as planned. Therefore, in realistic cases, the objective function needs to be transformed into the into the chance constrained form, which tolerates random events. The specific mathematical expression of the objective functions can be expressed as:
{ min F m P r {   F = t = 1 T ( i = 1 N C i , c + m ( t ) + C G ( t ) + C C H P , f ( t ) + C F C , f ( t ) + C C H P , e ( t ) + C F C , e ( t ) B H ( t ) B B , P O R T ( t ) F m } α

3.2. Power System Operation Constraints

3.2.1. Constraints of Power Balance

To keep the power system working in a stable condition, it is necessary to meet the requirement of the power balance between supply and demand for a distributed microgrid. Equation (15) shows the constraint of balance power in a distributed microgrid.
P L ( t ) = P B , P O R T ( t ) + P W T ( t ) + P P V ( t ) + P C H P ( t ) + P B ( t ) + P F C ( t ) + P G ( t )

3.2.2. Constraints of Heat Balance

To keep the power balance in distributed power systems, CHP units may generate redundant heat at the peak demand time to guarantee power supply. Therefore, differently from the electrical connection, heat generation should be greater or equal than the thermal demands when scheduling. Equation (16) is the constraint of heat balance, and (17) and (18) are the constraints of input/output power and the SOC of the heat storage tank, respectively.
{ Q C H P ( t ) + η H S T , c h Q H S T ( t ) Q L ( t ) , Q H S T ( t ) 0 Q C H P ( t ) + η H S T , d i s Q H S T ( t ) Q L ( t ) , Q H S T ( t ) < 0
Q H S T , min Q H S T ( t ) Q H S T , max
E H S T , min E H S T ( t ) E H S T , max

3.2.3. Constraints of Fossil Fuel Energy Generators

There are two components of fossil fuel energy generators in the predefined distributed system, which are the CHP unit and the fuel cell. Their outputs are restrained by their rated capacity and ramp-up constraints:
P i , min P i ( t ) P i , max
R i , min θ P i ( t ) P i ( t 1 ) R i , max θ

3.2.4. Constraints of the Battery System

Similar to the heat storage tank, the battery system should meet the constraint of the input/output power of the battery system and the constraint of the battery SOC. In addition, for economical and robust operation of the battery system, the battery should be charged/discharged to its initial value by the end of the day [28].
P B , min P B ( t ) P B , max
S O C B , min S O C B ( t ) S O C B , max
S O C B ( t 0 ) = S O C B ( t E )

3.2.5. Constraints of Spinning Reserve

With the access of the renewable energy system to the microgrid, the uncertainties of the grid will increase to some extent. In this paper, the spinning reserve of the system is designed to meet the system reliability requirements at a certain confidence level, which can be expressed as:
P r { P B , P O R T ( t ) + P W T ( t ) + P P V ( t ) + P C H P ( t ) + P F C ( t ) + P G ( t ) + P B , max ( t ) + P S R ( t ) P L ( t ) } β
P S R ( t ) = i = 1 2 min ( R i θ R , P i , max P i ( t ) )
In this section, the chance constrained programming has been clearly demonstrated, and the objective function and system constraints of the chance constrained programming have been analyzed as well. In the next section, an optimization algorithm will be introduced to solve the proposed chance constrained programming.

4. Optimization Algorithm

The particle swarm optimization algorithm has the obvious advantages of easy implementation, fewer parameters, and better optimization ability compared with the genetic algorithm, the ant colony algorithm, and so forth. [20]. Therefore, in this paper, the particle swarm optimization algorithm is selected to solve the chance constrained programming.

4.1. The PSO–MC Algorithm

The PSO algorithm has many potential advantages compared with other intelligent optimization algorithms; however, it suffers difficulty in dealing with stochastic variables. Therefore, the particle swarm optimization algorithm cannot be used to deal with the wind turbine, PV, and electrical demand uncertainty problems in an efficient way. To improve this situation, the stochastic variables—for example, the output of wind turbines, PVs, and network demands—should be converted to the determined variables. MC is an efficient simulation tool that is widely used to model power system operation parameters by predicting the probability distribution of demands of renewable generators in advance. In this paper, a combined PSO–MC method is proposed to optimize the chance constrained programming, which relates to the distributed system optimization.

4.2. Specific Steps of the PSO–MC Algorithm
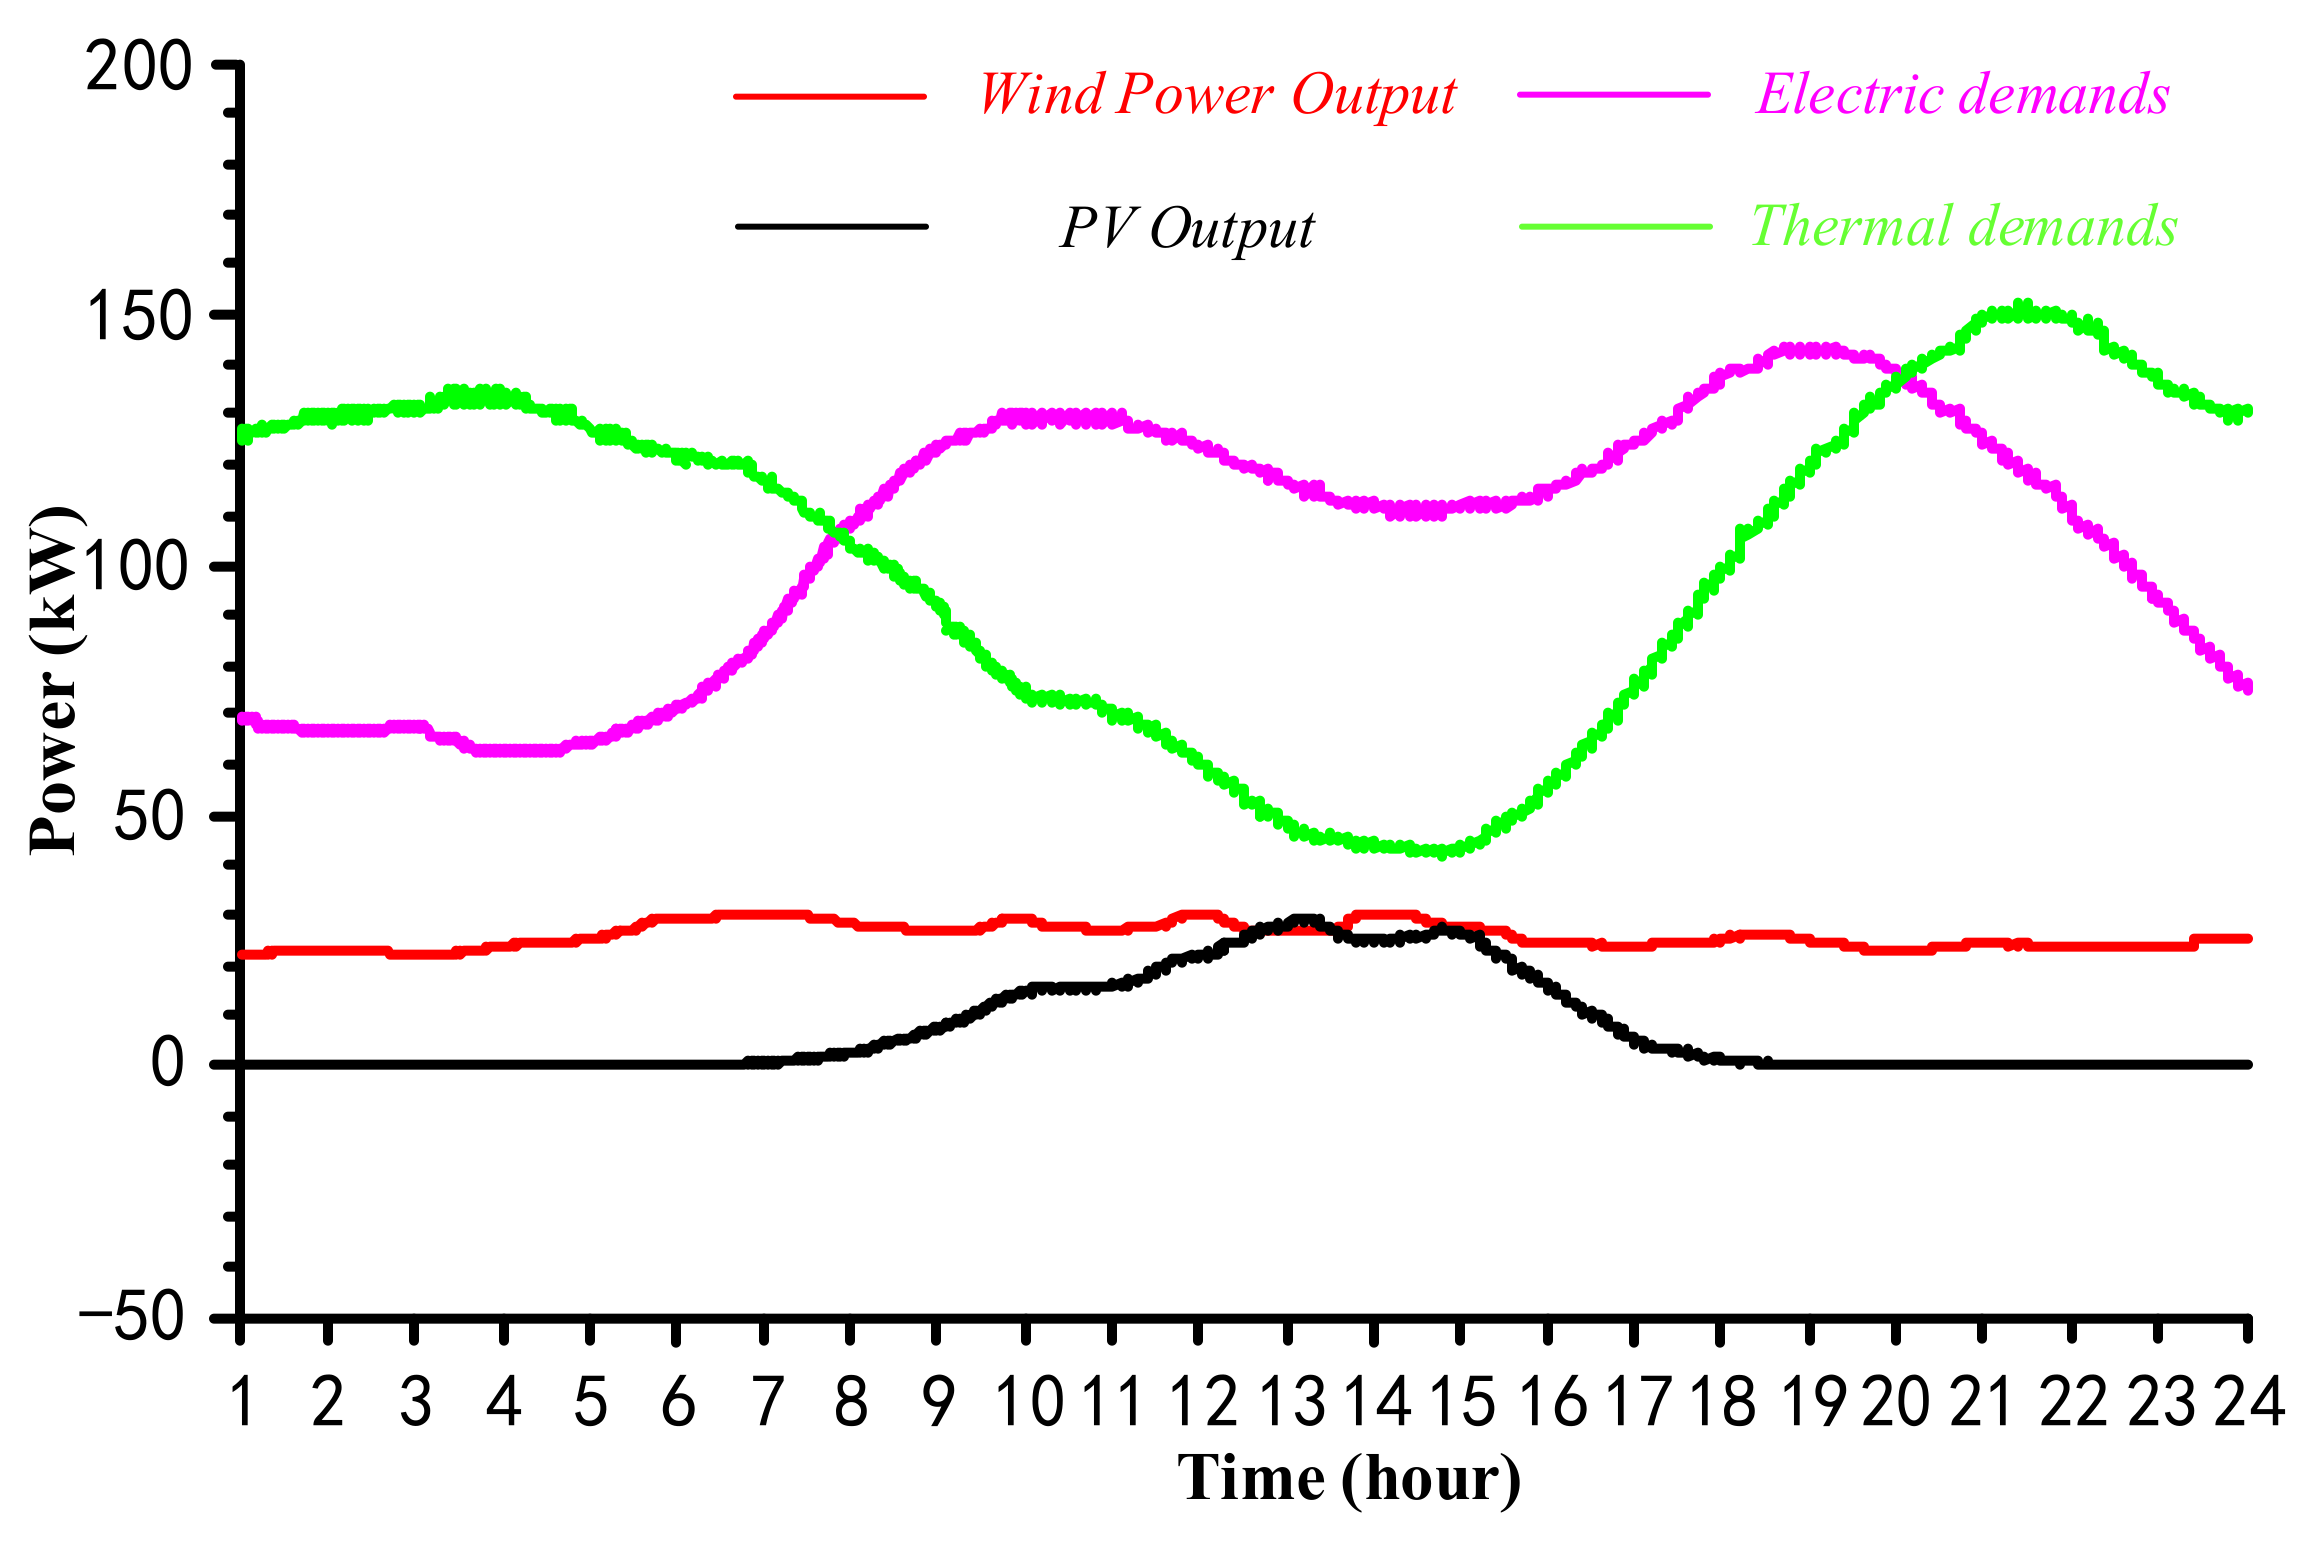
The specific steps of the PSO–MC algorithm can be summarized as:
Step 1: Input the operation parameters of all distributed generators, including power flow parameters and economic parameters related to distributed system operation, and set the confidence level of the objective function and the chance constraints.
Step 2: Initialize the optimization parameters of the particle swarm algorithm, including the number of particles, the maximum number of iterations, the learning factor, the learning rate, the initial inertia weight, and the final inertia weight.
Step 3: Based on the probability distribution of wind turbine power, solar power, and electrical demands, generate daily wind output, PV output, and load curves of the proposed system with the MC simulation.
Step 4: Generate daily output curves of CHP, fuel cells, and battery systems randomly to form a particle.
Step 5: Test the feasibility of the randomly generated particle under the condition of the daily wind output, PV output, and loads generated by the MC simulation in Step 3, according to Equations (15)—(25). If the particle is not feasible, regenerate another particle until the number of feasible particles is equal to the number of particles defined in Step 2.
Step 6: Calculate the fitness value of each particle, and then compare the fitness value with the local extreme. If the fitness value of the particle is superior to the local extremum, then the current local extremum will be replaced by this particle. In addition, compare the fitness value of the local extrema with the global optimum, and if the local extremum value is superior to the global optimum, update the current global optimum with the local extremum.
Step 7: After calculating the fitness value of each particle, it is necessary to update the current speed and positions of all particles based on Equations (15)–(25). It is worth noting that the speed and location of each particle may not be feasible; therefore, the speed and location of the unsuitable particle needs to be regenerated.
Step 8: Check the number of the iteration. If it reaches the maximum number of iterations, calculate the power flow of the system and implementing cost of the system. Otherwise, return to Step 6.

5. Case Study

The structure of the newly introduced distributed network is shown in Figure 1, and the rated parameters of the traditional microgrid are shown in Table 1. In addition, the nominal parameters of the portable energy system are shown in Table 2. Moreover, the daily thermal demands, electrical demands, wind turbine output, and PV output, which are generated by the Monte Carlo simulation, are displayed in Figure 2. Finally, the emissions generated by different generators and the standard grade of pollutant values are based on previous work [32].
To optimize the PSO model, the related parameters are defined as follows: the number of particles is 250; the largest number of iterations is 300; the maximum and the minimum speed and positions are ±1 and ±5, respectively; and the inertia weight c1 and c2 used in this paper are 1.3 and 2.8, respectively. Considering the randomness of the PSO, the results shown in next section are the average values of 20 group simulations.

6. Results and Discussions

In this section, the simulation results will be demonstrated in three aspects: (1) the influence of introducing confidence levels; (2) network performance with installation of an extra portable energy system; and (3) the influence of decoupling heat and power by installing a heat storage tank.

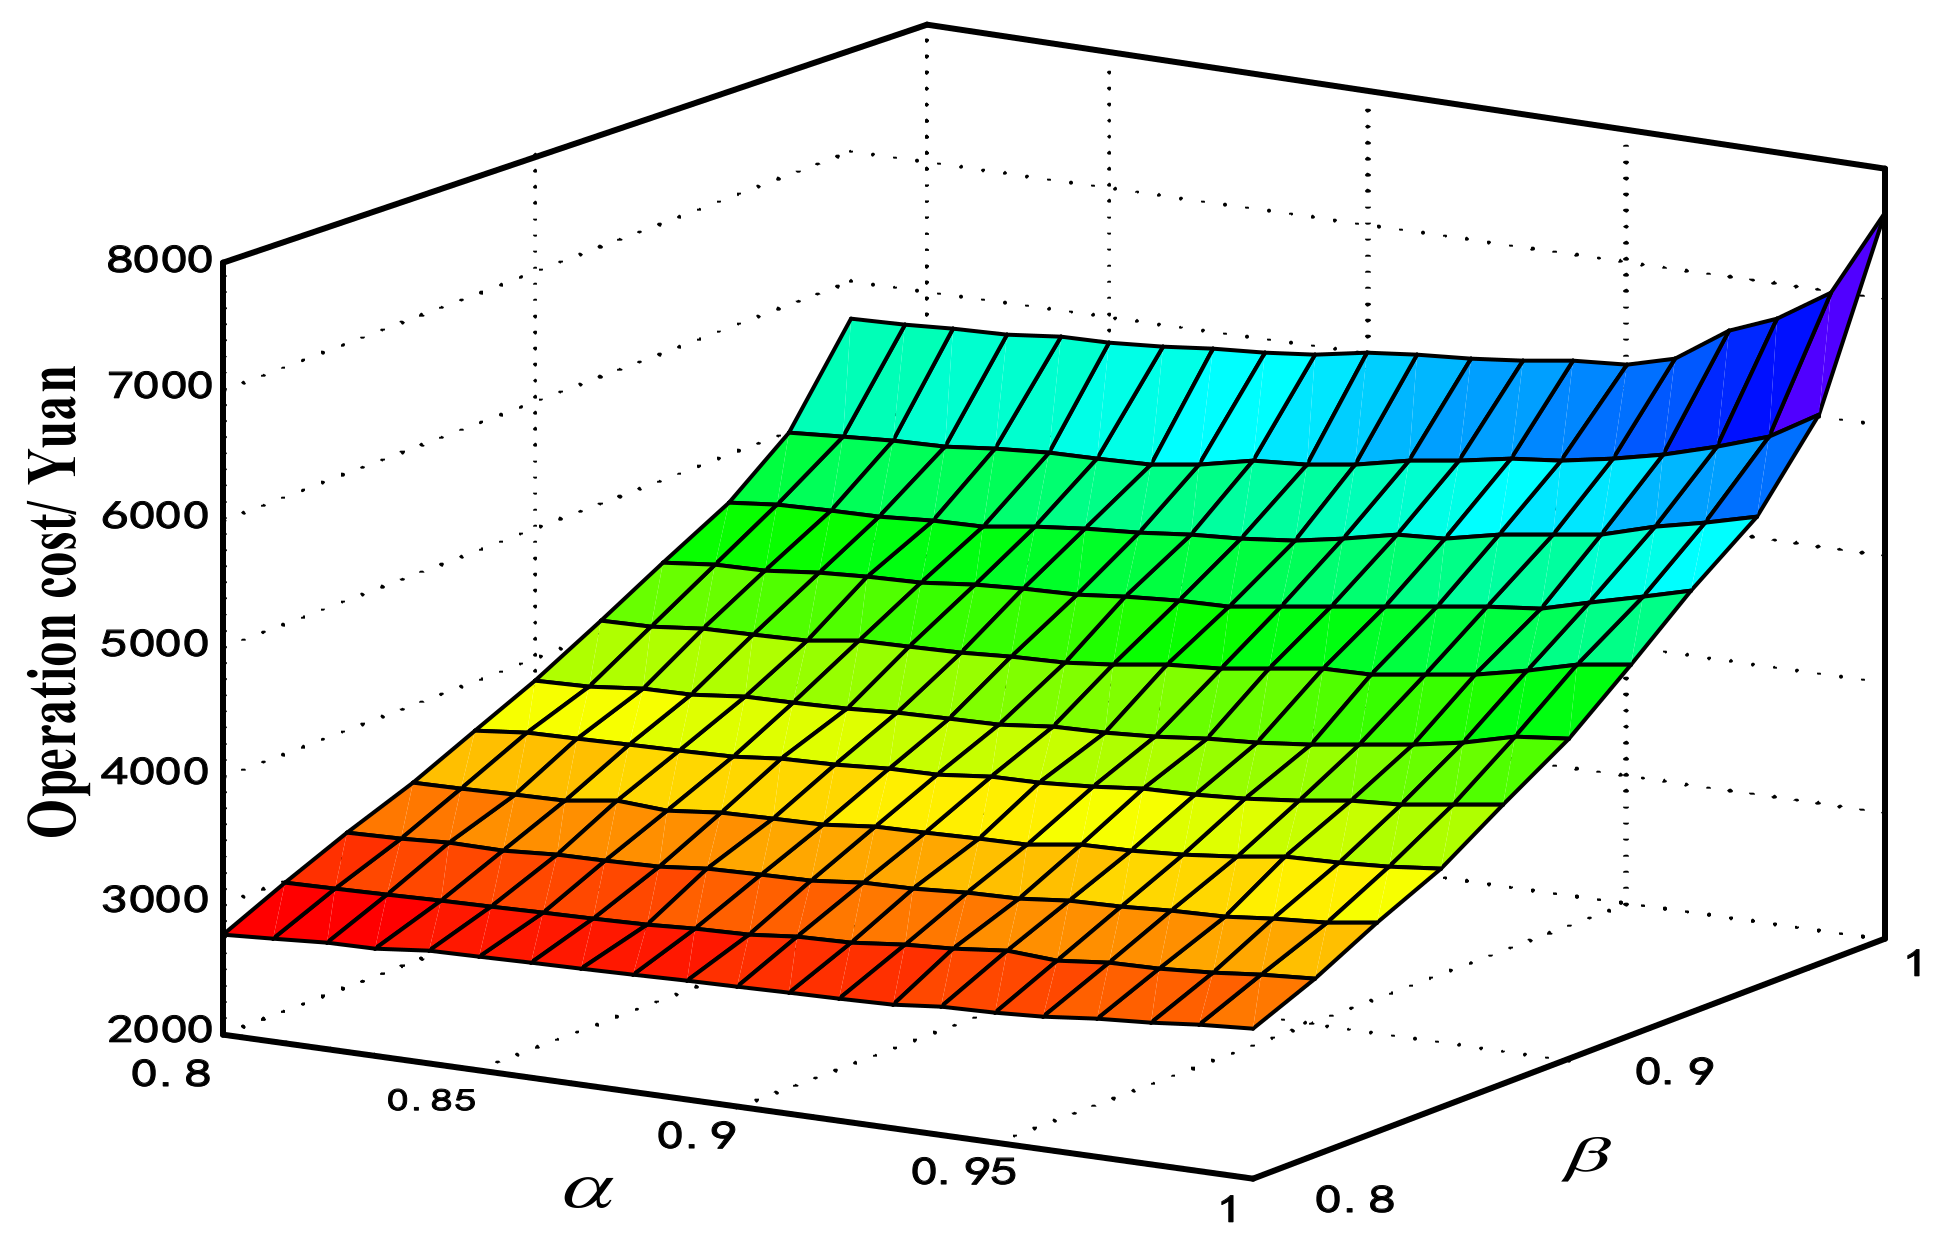
6.1. Results of Introducing Confidence Levels

The system operational cost increases sharply with the increase of the confidence level. Table 3 shows the operational costs of the proposed microgrid in different confidence levels, and Figure 3 is a three-dimensional graph revealing the relationship between operational costs and confidence levels.

6.1.1. Confidence Level β

Table 3 reveals that with the rise of the confidence level β, the system operational cost increases sharply, especially when β is closer to 1. Figure 4 and Figure 5 show the optimal output power of different energy generators at β = 0.8 and β = 0.9, respectively.
The value of the confidence level β represents the chance of achieving the spinning reserve constraints in the uncertain environment. With the decrease of β, the spinning reserve for the system will be reduced and the gap of power exchange between the main grid and the microgrid will be increased. Figure 4 and Figure 5 show that the chance constrained programming focuses on the operational cost optimization when electrical demands are light and the reserve demands are small. On the contrary, when electrical demands are heavy, the objective of the optimization changes to improve system reliability.
For example, when β = 0.8, the probability that total power generation of the microgrid is greater than the electrical demands is low. In this situation, the proposed distributed network takes the higher risk of reducing system stability and loss of loads. Meanwhile, the gap of power exchange between the main grid and the microgrid is relatively high. However, But on the other hand, the distributed system purchases power from the main grid at a lower price time and sells back at the peak price time, which improves the system’s economy.
When β = 0.9, the probability that the total power generation of the microgrid is greater than the electrical demand becomes slightly higher. In this case, the proposed distributed network takes the lower risk of loss of loads and increases system reliability. Additionally, compared with β = 0.8, the gap of power exchange between the main grid and the microgrid is reduced to some extent. Because of the large amount of spinning reserve prepared for the peak demand time and the conservation of selling electricity to the main grid, the system’s economy can be affected.
In summary, a lower confidence level β can lead to good system economy, while it can also result in higher risk of reducing system stability.

6.1.2. Confidence Level α

As shown in Table 3 and Figure 3, with the increase of confidence level α, the system operational cost shows a similar tendency to that of β.
Differently from the confidence level β, the confidence level α reflects the possibility of accomplishing the objective function in an uncertain environment. Moreover, because the objective function contains uncertain variables, the confidence level α also can be used to represent the activity of the uncertain variables in the model. The smaller value of α represents the lower requirement of achieving the constraints of the function and the greater flexibility of the uncertain variables, which can lead to a lower operational cost. On the contrary, the potential risk is increased because of the uncertain factors, namely the control of the renewable generators. Therefore, according to the varied-curve surface diagram of the system operational costs shown in Figure 3, the power system’s economical operation and stable operation can be compromised by selecting appropriate confidence levels α and β.

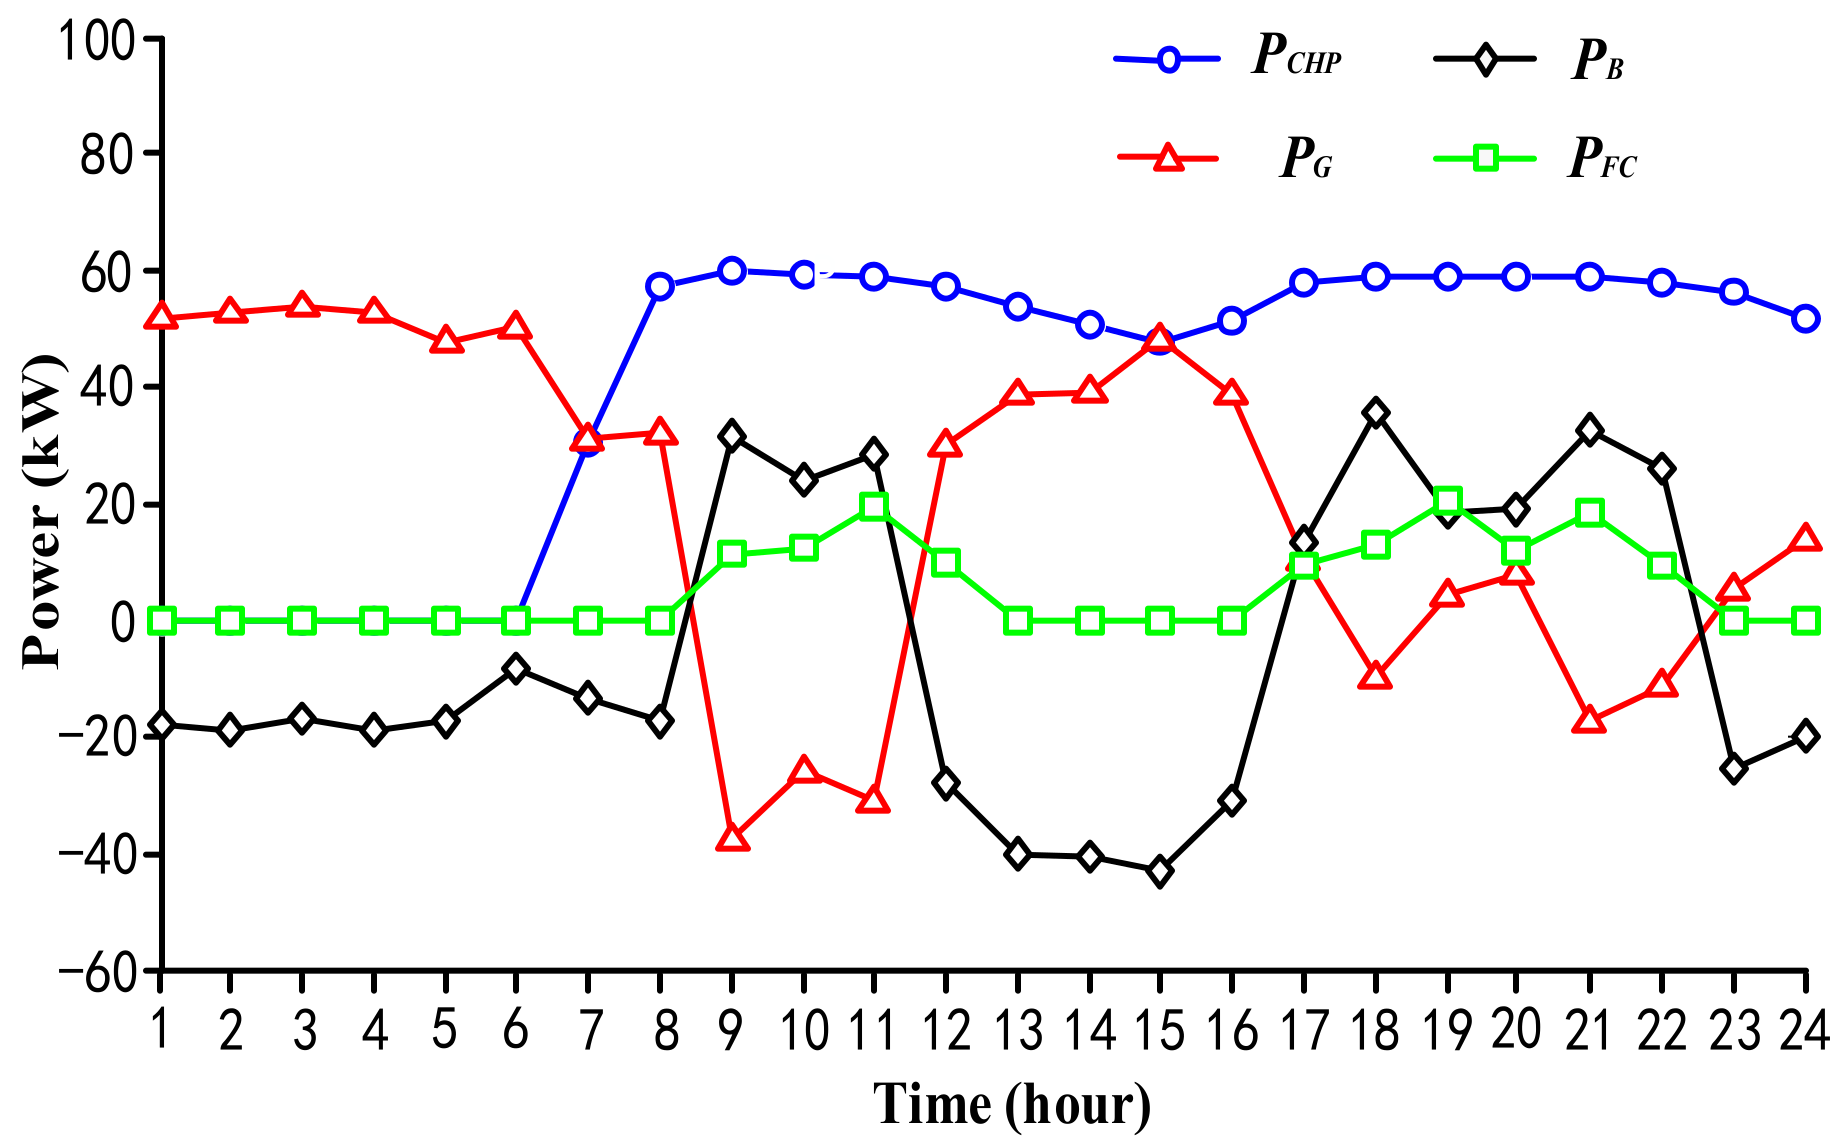
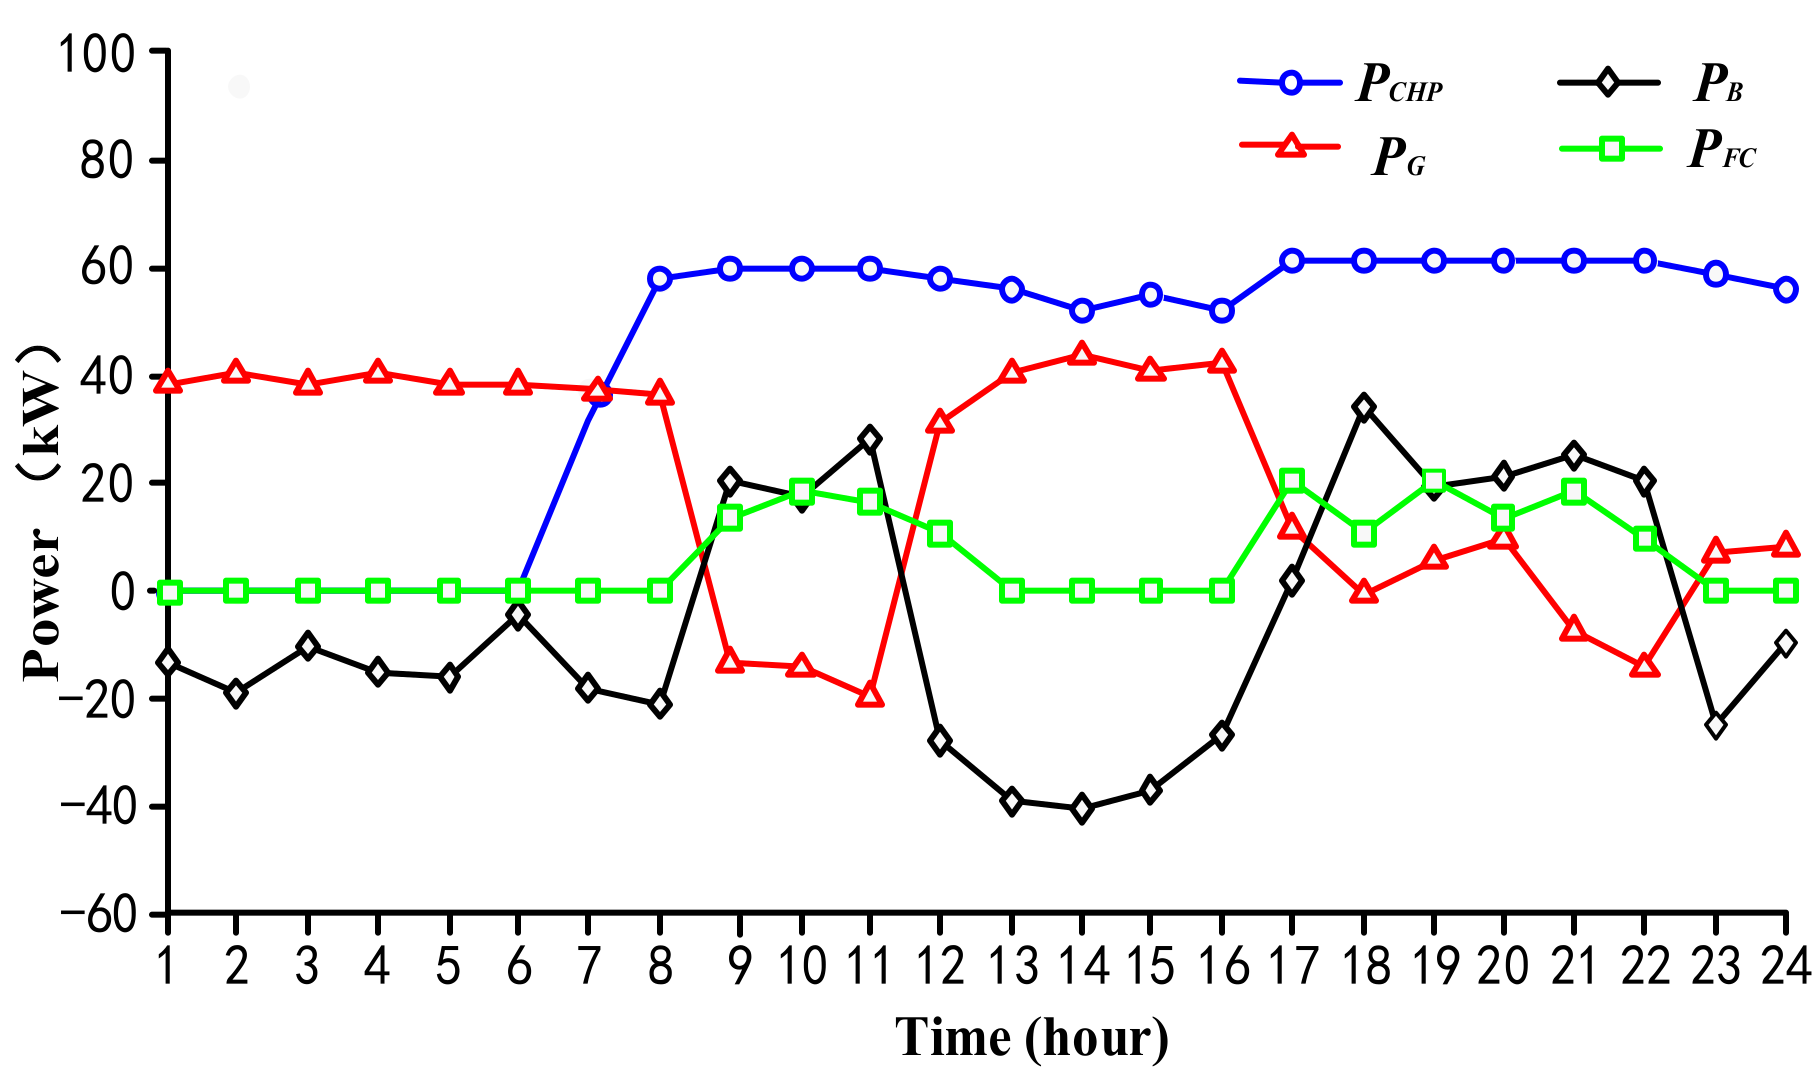
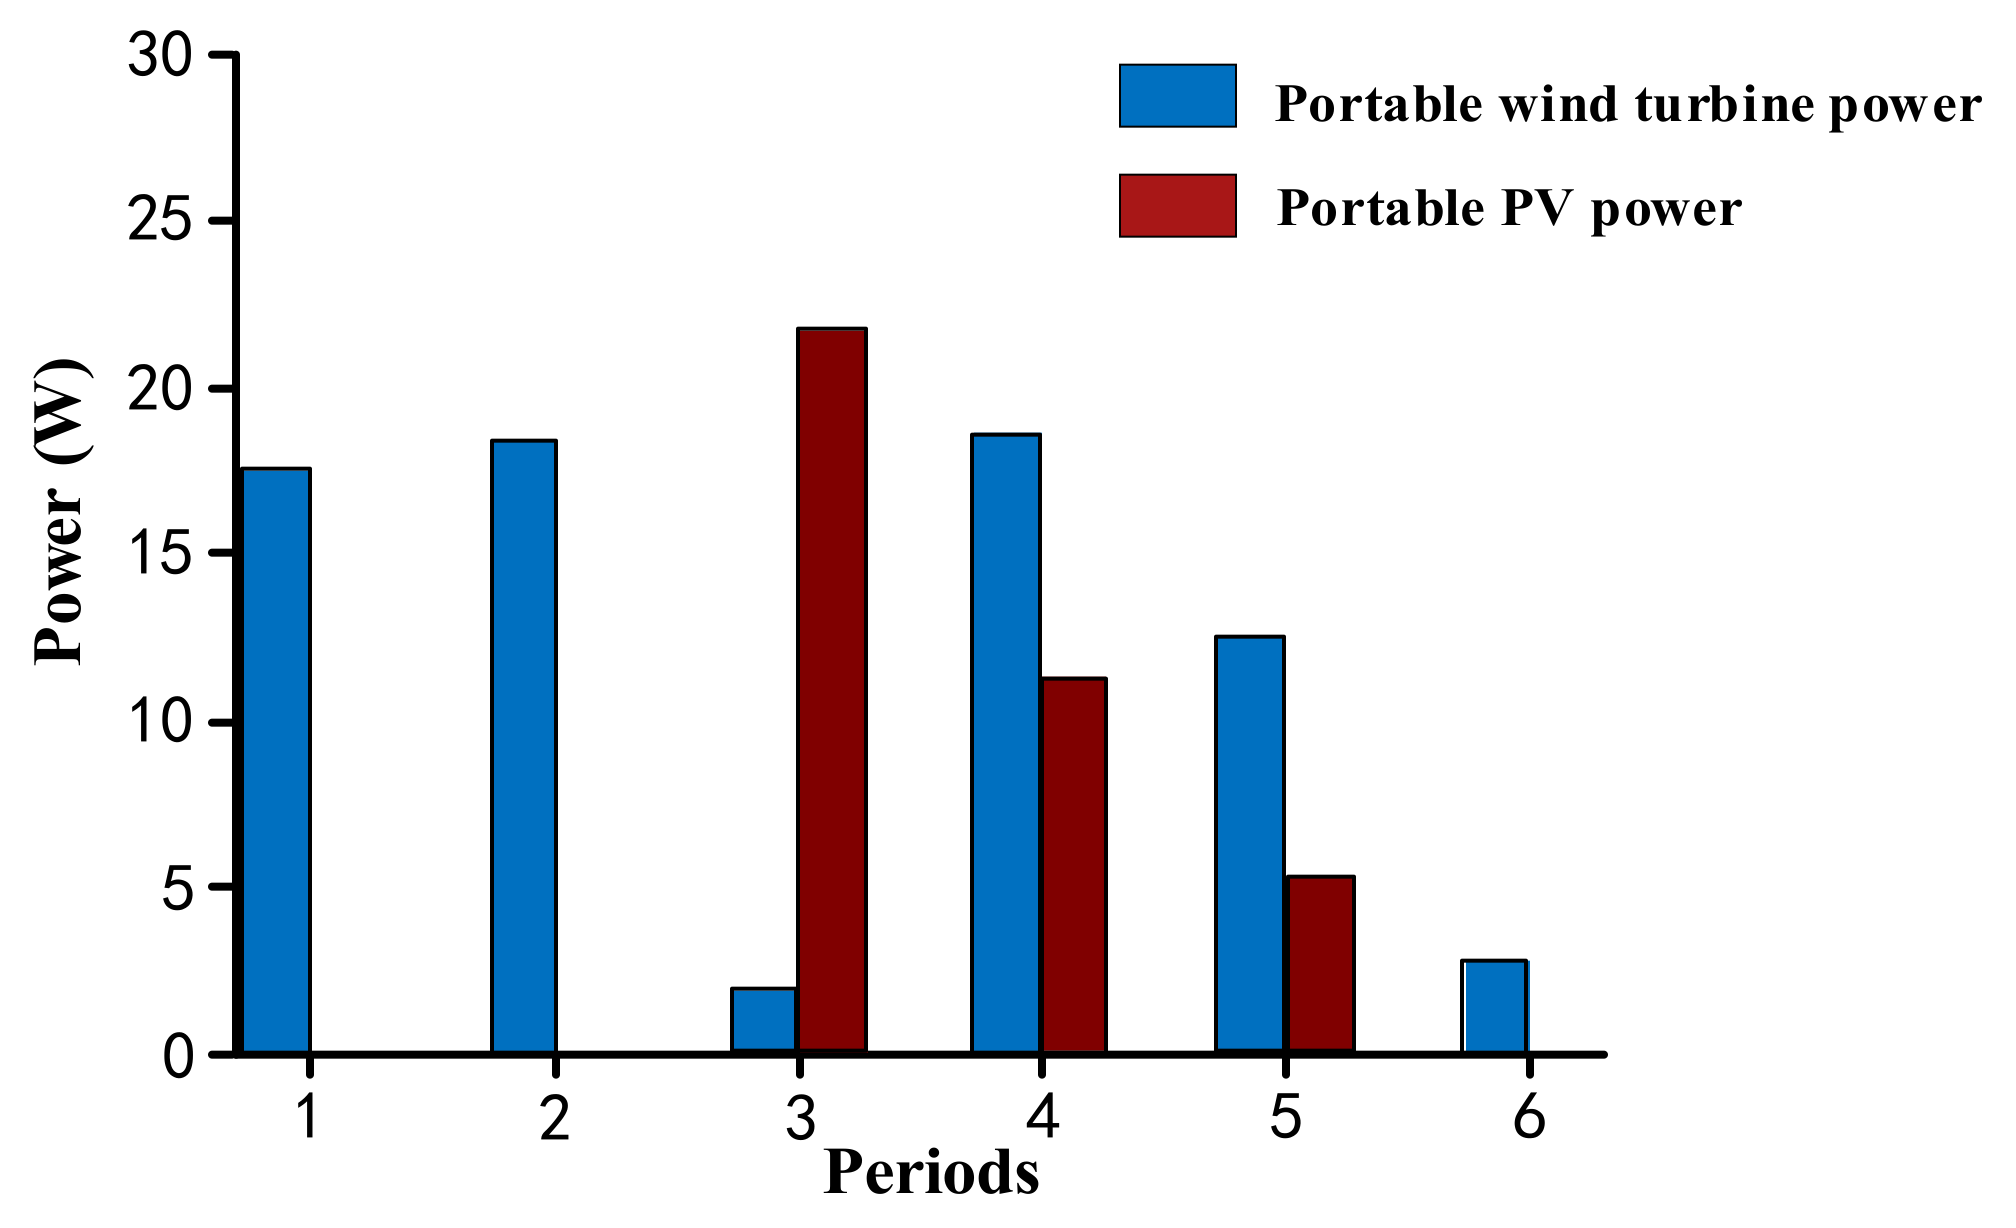
6.2. Results of Installing a Portable Energy System

An extra portable energy system installed in the demand side is normally used as the backup generators to improve system security. However, in this part, simulation results are mainly focused on demonstrating that the added portable energy system has great potential in participating in a demand–response program, which can enhance network peak load regulating capacity and improve system economy.
Table 4 shows the optimal output power of different energy carriers in the traditional microgrid which does not have any portable energy system installed. To prove the added portable energy system has a great potential in participating in demand–response and enhancing network peak load regulating capacity, Table 5 shows the optimal output power of different energy carriers in the traditional microgrid in which an added portable energy system is installed. Meanwhile, the output power of the portable energy system is shown in Figure 6. It is worth noting that to clearly show the variation tendency of different generators’ output power, Table 4 and Table 5 and Figure 6 divide the optimization results into six periods, and each period has four samples. The optimization results shown in Table 4 and Table 5 and Figure 6 are the average value of four samples in each period, and the third and fifth periods represent the peak demand time.
By comparing Table 5 with Table 4, it is easy to find the changes in the local generators’ outputs and the changes in power exchange between the distributed network and the main grid. During the first period, the electrical demands are relatively low, and the wind turbine power is selected to supply the microgrid. To increase system benefits, the microgrid system imports electricity directly from the main grid for a cheaper price. At this time, all local fossil fuel generators are switched off. In the second period, with the rapid growth of electrical loads, the CHP unit is switched on to supply power for the microgrid, and renewable energy generators increase their outputs at this time. Moreover, less power can be collected to charge the battery. For the third period, the output power of each local generator increases significantly to cover the peak demand compared to the second period. Meanwhile, the microgrid starts to sell electrical power to the main grid. It is worth noting that by adding a portable renewable energy system to participate in a demand–response program, the output of CHP can be reduced at this time, and this allows reduction of fossil fuel cost. In the fourth period, with the slight decrease of network electrical loads, the fuel cell decreases its output, and meanwhile, the battery is charged in this period. Next, in the fifth period—the second peak demand time of day—with installation of a portable energy system, the output of the CHP system can be reduced about 14%, which reduces fossil fuel cost. Additionally, by installing the portable energy system, instead of importing high-price power from the main grid, the microgrid can sell electrical power back to the main grid at a relatively high price. In this way, system economy can be improved. Finally, for the last period, the demands are relatively low, and therefore the outputs of all units are reduced.
In conclusions, the output power of CHP is significantly reduced by installing portable renewable energy resources. Moreover, the added renewable energy resources can cooperate with other local generators to supply power at peak times and deliver redundant power back to the main grid at a higher price. By installing the portable energy system, network peak load regulating capacity has been significantly improved and system daily operational cost is reduced by 28.29%.

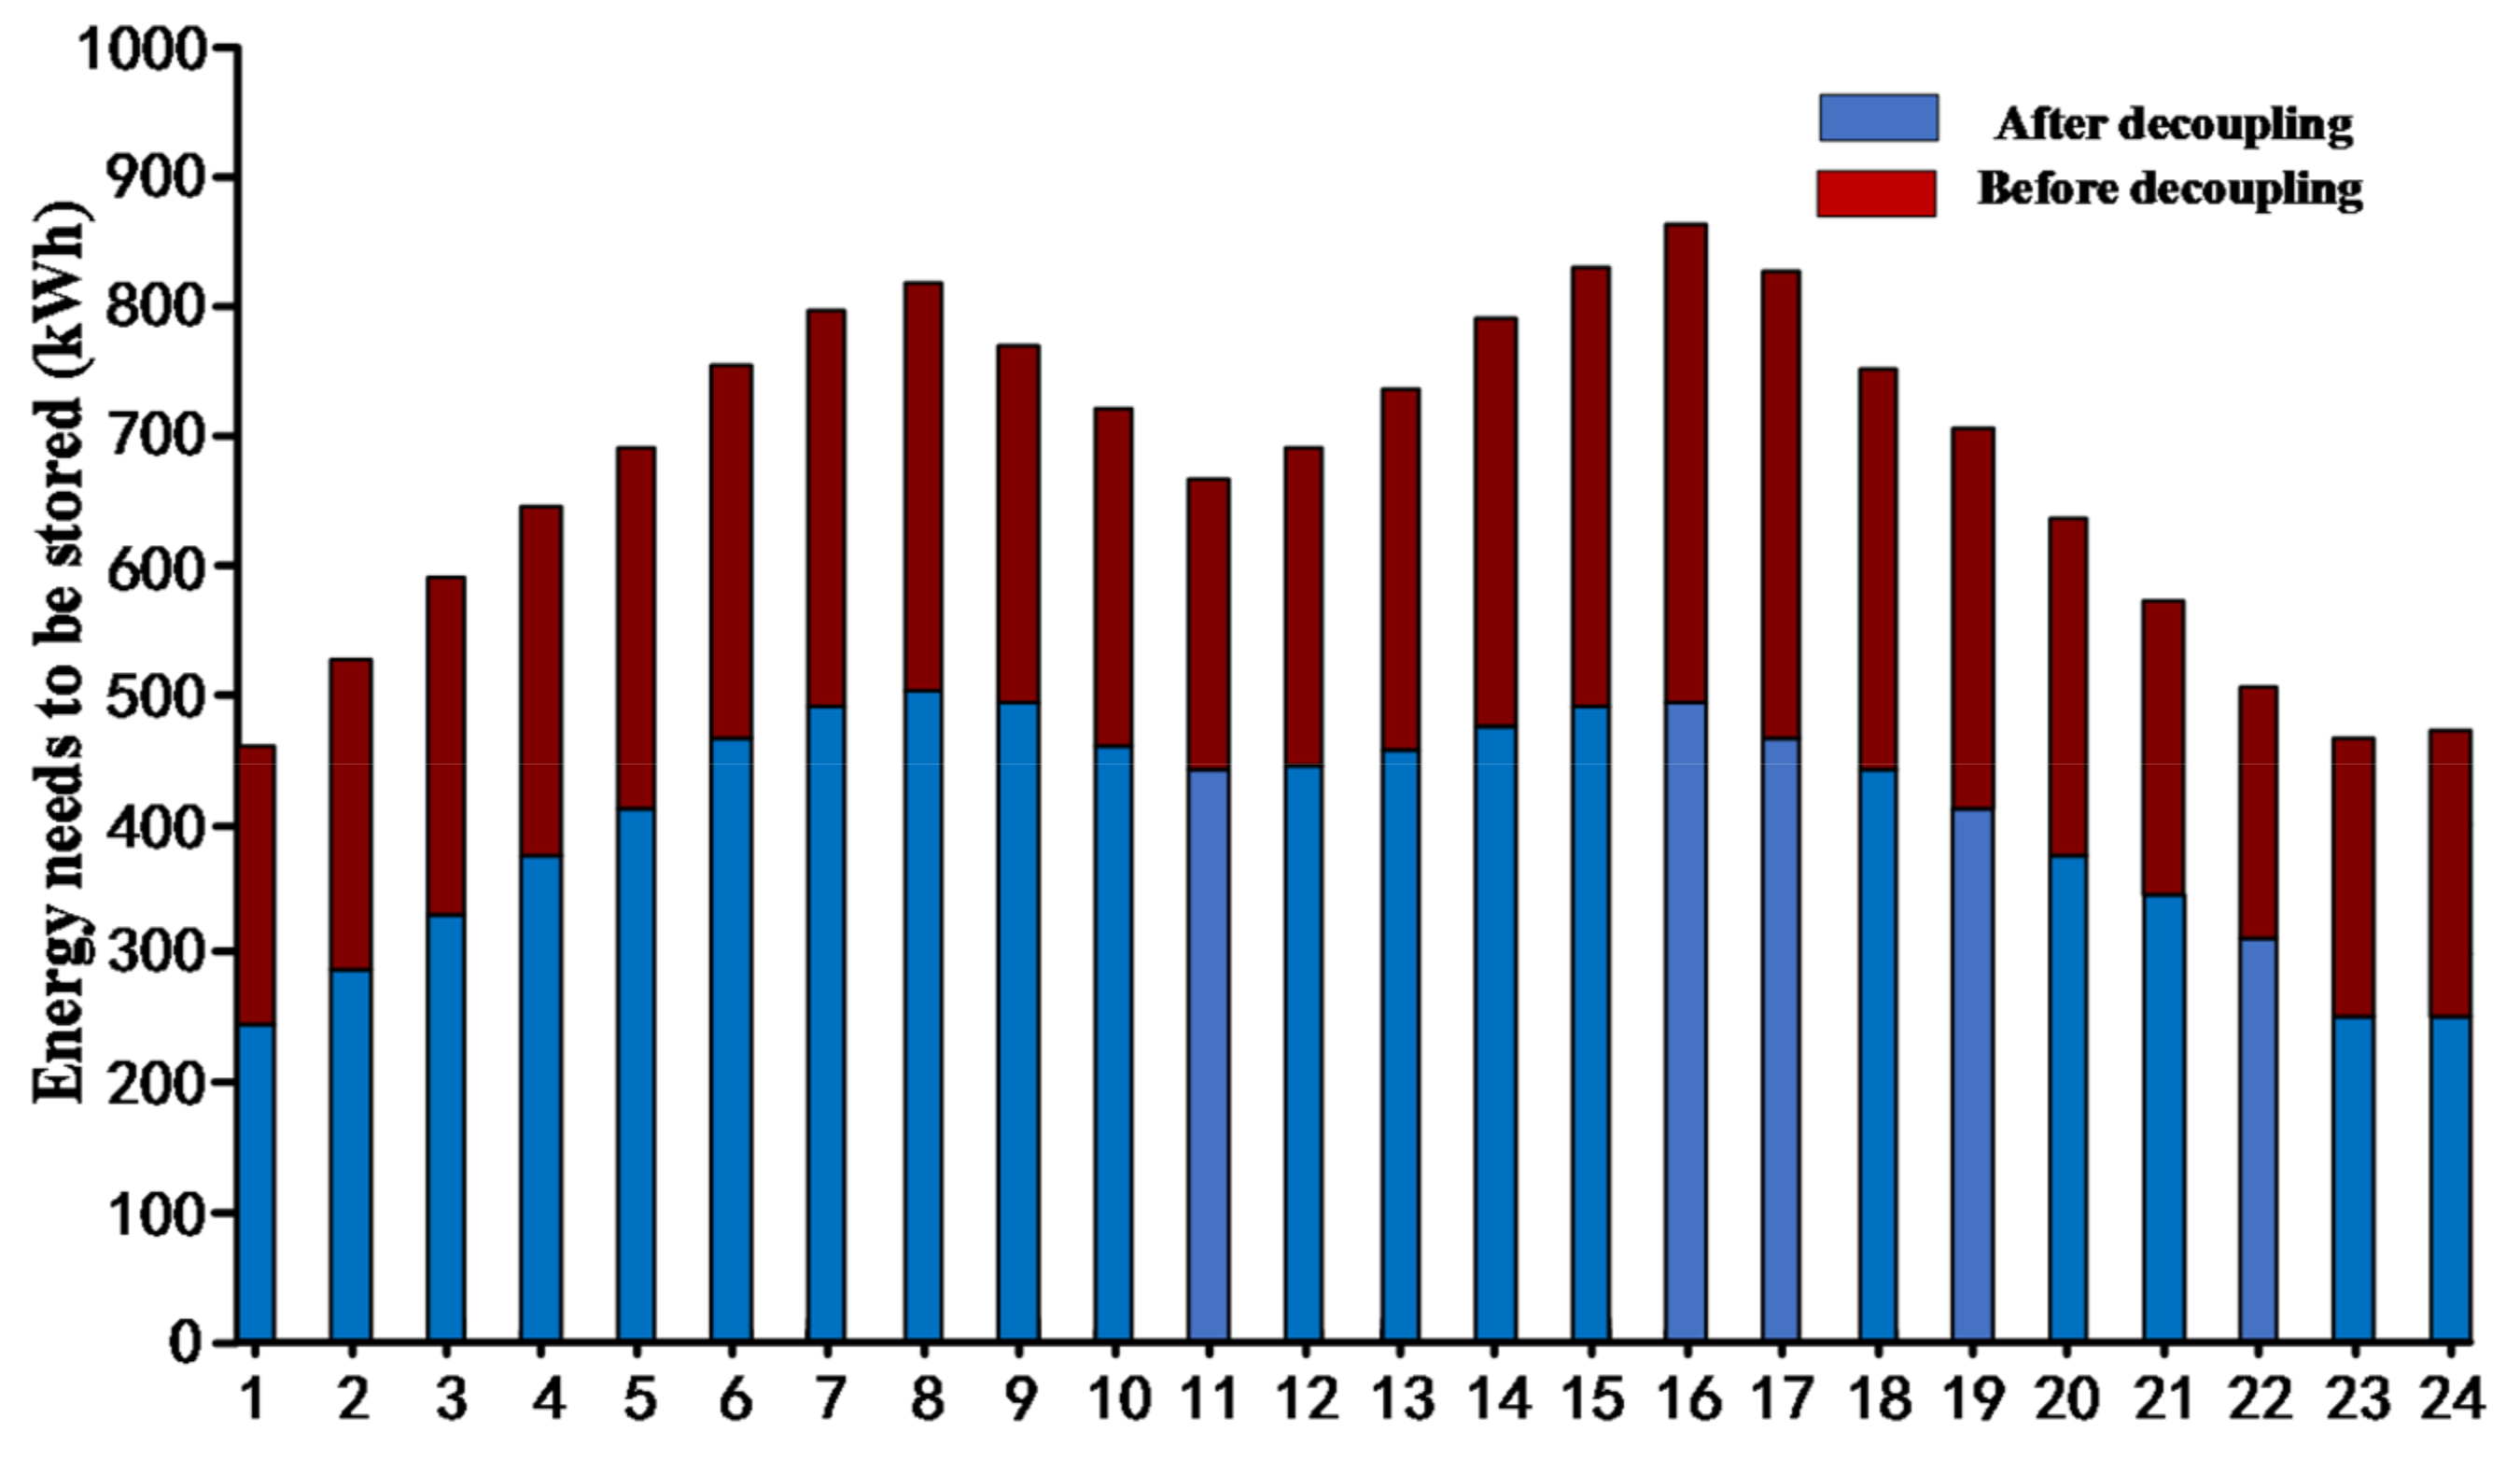
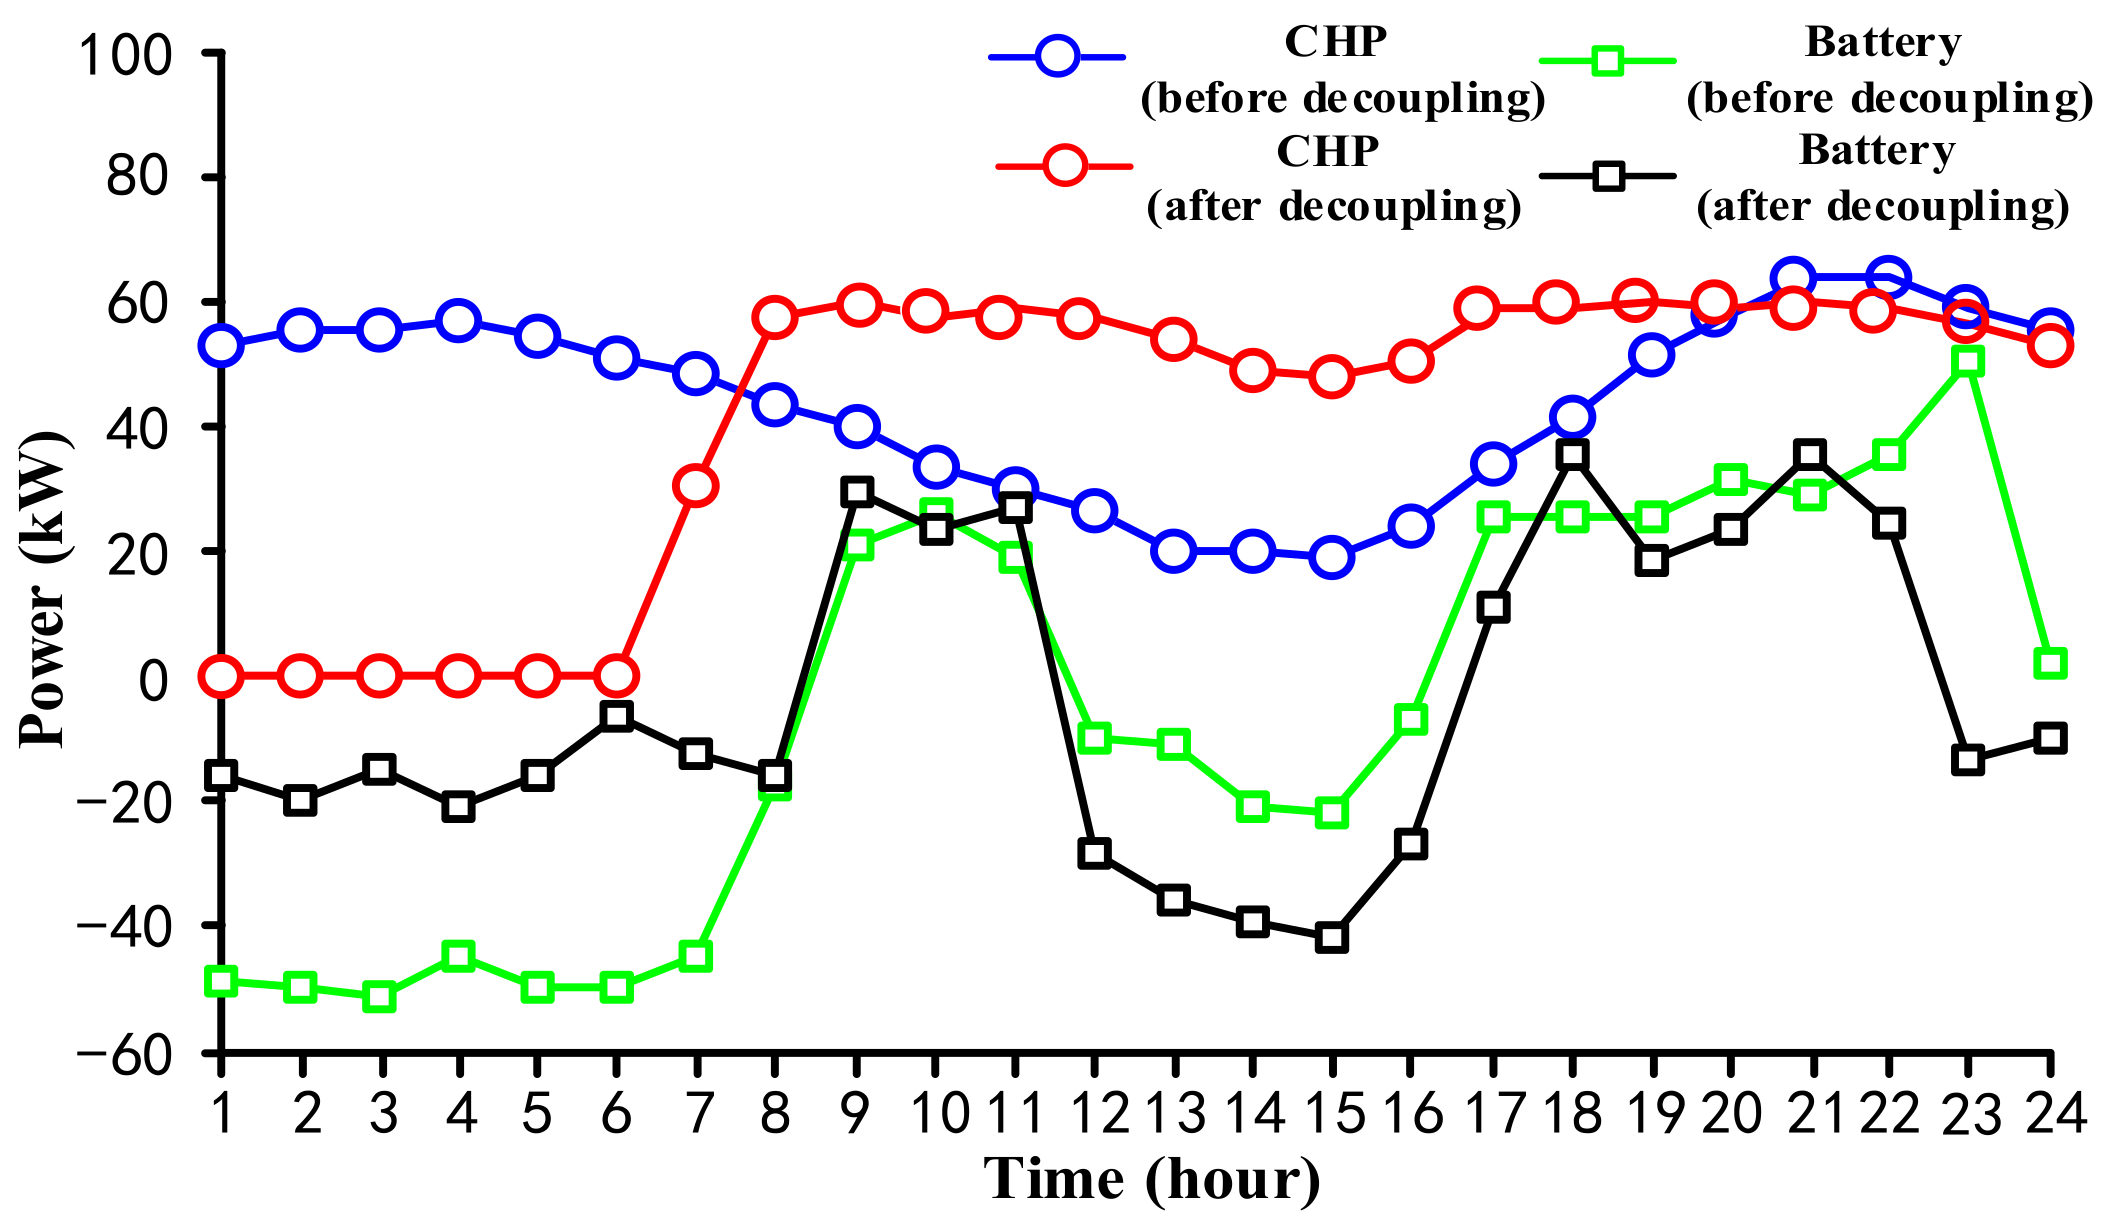
6.3. Results of Decoupling Heat and Power

As mentioned in the previous part, system peak load regulating capacity and system economy can be improved to some extent by installing an extra portable energy system in the demand side. To improve CHP energy efficiency, reduce battery installation capacity, and improve system reliability, adding an extra thermal storage tank to work with the CHP unit is necessary, because this can help to decouple heat and power. Figure 7 shows the simulation results of the output power of the battery and CHP in the proposed system before and after decoupling. In Figure 8, the optimization results of the total electrical energy that needs to be stored in the battery is shown to reveal the minimum capacity of the battery with which it needs to be equipped.
Comparing Figure 8 with Figure 7, it is easy to find that before decoupling heat and power, the output of CHP shows an opposite trend to the daily electrical loads. At the off-peak time, power generated by the CHP unit exceeds the electrical demands, and therefore the battery needs to be charged at higher power to collect the redundant power generated by CHP. However, at peak demand time, CHP output power is reduced to a relatively low value because of lower thermal demand, and thus the battery needs to be discharged at higher power to supply the electrical demand. In this situation, the system needs to equip a higher-capacity battery to meet the electrical demands, which is clearly shown in Figure 8.
After decoupling heat and power, thermal demand can be supplied by the heat storage tank independently when CHP is switched off. Alternatively, when CHP is switched on, CHP always works at its rated maximum output, which can significantly promote power generation efficiency. Additionally, for a full operation cycle, CHP only needs to be switched off once, which simplifies the operation and gives some maintenance time for the CHP.
In summary, decoupling heat and power by installing an extra heat storage tank is helpful for improving CHP energy generation efficiency, reducing battery installation capacity, and improving system reliability.

7. Conclusions

This paper tries to enhance network peak load regulating capacity and to increase system efficiency by adding an extra portable energy resource system and an extra heat storage tank to the distributed network.
After installing an extra portable energy resource system to the distributed microgrid, the amount of fossil fuel energy consumption is reduced by about 8%. Additionally, by installing an extra portable energy system, the distributed network can obtain additional benefits by exporting electricity to the main grid at the peak demand time, which leads to a 28.29% reduction of system daily operational cost. More importantly, with the installation of the portable energy system, the peak load regulating capacity has been significantly improved, which can be reflected by the fact that much more electrical energy can be sold back to the main grid at the peak demand time, and the portable energy system has greater potential to supply electrical power for the distributed grid.
However, after introducing an extra portable energy resource system to the distributed system, the system’s uncertainty can be increased to some extent. In this paper, chance constrained programming is proposed to deal with system uncertainty caused by the added extra portable energy system. By applying the PSO–MC algorithm to optimize the chance constrained programming problem in the proposed network, simulation results show that power system economy and system uncertainty can be compromised by selecting appropriate confidence levels α and β. In addition, compared with existing optimization algorithms, the proposed PSO–MC has the obvious advantages of higher computational efficiency, fewer stochastic variables, and higher accuracy.
When introducing an extra heat storage tank to the distributed microgrid, system thermal outputs and electrical outputs can be decoupled. After decoupling heat and power, thermal demand can be supplied by the heat storage tank independently if necessary. Alternatively, the CHP unit can work at its rated power to simultaneously generate heat and power at the peak demand time, and the redundant heat can be stored in the heat storage tank, which promotes CHP output efficiency and reduces fossil fuel energy consumption as well. Moreover, simulation results show that battery installation capacity can be reduced by about 40% and system reliability can be improved if an extra heat storage tank is installed.

Acknowledgments

The authors gratefully acknowledge the financial support from the project of “Research on the operation simulation and effectiveness evaluation technology of power market (YDB17201600102)”.

Author Contributions

Hong Zhang and Qian Zhang conceived and designed the experiments; Taorong Gong analyzed the data; Xin Su revised the paper; Hao Sun wrote the paper.

Conflicts of Interest

The authors declare no conflict of interest.

Appendix A. List of Symbols and Abbreviations

NomenclatureMeaningNomenclatureMeaning
PWT,PORTOutput power of a portable wind turbine systemρAir density of a portable wind turbine system
ABlade area of a portable wind turbine systemηwPower coefficient of a portable wind turbine system
vActual wind speed of a portable wind turbine systemvnomRated wind speed of a portable wind turbine system
viCut-in speed of a portable wind turbine systemvoCut-out speed of a portable wind turbine system
PPV,PORTOutput power of a portable PV systemPPV,STCMaximum power under the standard test condition
GT (t)Solar radiation of a portable PV system at time tGTSTCSolar radiation under the standard test condition
γA coefficientTrReference battery temperature of a portable PV system
Tb (t)Battery temperature of a portable PV system at time tTamp (t)Ambient temperature at time t
TNOCBattery temperature under the normal operating conditionBB,PORTProfit that consumers can obtain by participating in demand–response activities
PB,PORT (t)Output power of a portable energy system at time tRPORTUnit revenue of a portable energy storage system
θTime intervalηB,PORTOverall efficiency of a portable energy storage system
PCHP (t)Electrical output of gas engine CHPQCHPThermal output of gas engine CHP
RHPHeat-to-power ratio of gas engine CHPηCHPElectrical power generation efficiency of gas engine CHP
ηCHP,lossSystem loss coefficient of gas engine CHPCCHP,fFossil fuel cost of gas engine CHP
cUnit natural gas priceLLow calorific value of natural gas
θCHPTime interval of CHPEHST (t)Total thermal energy stored in a heat storage tank at time t
EHST (t − 1)Total thermal energy stored in a heat storage tank at time t − 1ηHST,chHeat storage charge efficiency
ηHST,disHeat storage discharge efficiencyQHST (t)Net heat power flow into/out of the heat storage tank at time t
θHSTTime interval of a heat storage tankCFC,fFossil fuel cost of a fuel cell
PFC (t)Output power of a fuel cell systemηFCPower generation efficiency of a fuel cell system
θFCTime interval of a fuel cell systemSOCB (t)State of charge of a battery system at time t
SOCB (t − 1)State of charge of a battery system at time t − 1PB (t)Power exchange of a battery system at time t
ηB,chBattery charging efficiencyηB,disBattery discharging efficiency
θBTime interval of charging/discharging the batteryEBInstallation capacity of a battery system
TScheduling time periodNNumber of distributed power generators
Ci,c+mSum of the capital cost and the maintenance cost of the ith distributed power generatorsCGCost of importing/exporting electricity from/to grid
CCHP,eCarbon emission cost of CHPCFC,eCarbon emission cost of a fuel cell
PL (t)Electrical demands at time tPWT (t)Output power of a wind turbine system at time t
PPV (t)Output power of a PV system PG (t)Total electrical power imported from/exported to the main grid
QL (t)Thermal demands at time tQHST,minMinimum power flow out of and into the heat storage tank
QHST,maxMaximum power flow out of and into heat storage tankEHST,minMinimum of thermal energy that needs to be stored in the heat storage tank
EHST,maxMaximum thermal energy that needs to be stored in the heat storage tankPi,minMinimum outputs power of the ith fossil fuel energy generator
Pi,maxMaximum outputs power of the ith fossil fuel energy generatorRi,minMinimum ramp-up rates of the ith fossil fuel energy generator
Ri,maxMaximum ramp-up rates of the ith fossil fuel energy generatorPB,minMinimum power exchange of a battery system
PB,maxMaximum power exchange of a battery systemSOCB,minLower limit of battery SOC
SOCB,maxUpper limit of battery SOCSOCB (t0)Initial SOC before scheduling
SOCB (tE)Final SOC after schedulingPrProbability function of an event
βConfidence level of spinning reserve constraintsαConfidence level of the objective function
PSR(t)Spinning reserve capacity provided by the fossil fuel generators at time tθRResponse time
AbbreviationMeaningAbbreviationMeaning
PSO–MCParticle swarm optimization—Monte CarloSOCState of charge
MCMonte CarloPVPhotovoltaic

References

  1. Rezvani, A.; Gandomkar, M.; Izadbakhsh, M. Environmental economic scheduling of a microgrid with renewable energy resources. J. Clean. Prod. 2015, 87, 216–226. [Google Scholar] [CrossRef]
  2. Majidi, M.; Nojavan, S.; Zare, K. Optimal stochastic short-term thermal and electricalal operation of fuel cell photovoltaic battery grid hybrid energy system in the presence of demand response program. Energy Convers. Manag. 2017, 144, 132–142. [Google Scholar] [CrossRef]
  3. Nwulu, N.I.; Xia, X. Optimal dispatch for a microgrid incorporating renewables and demand response. Renew. Energy 2017, 101, 16–28. [Google Scholar] [CrossRef]
  4. Tabar, V.S.; Jirdehi, M.A.; Hemmati, R. Energy management in microgrid based on the multi objective stochastic programming incorporating portable renewable energy resource as demand response option. Energy 2017, 118, 827–839. [Google Scholar] [CrossRef]
  5. Liu, Z.; Chen, Y.; Zhuo, R. Energy storage capacity optimization for autonomy microgrid considering CHP and EV scheduling. Appl. Energy 2017, 210, 1113–1125. [Google Scholar] [CrossRef]
  6. Rokni, S.G.M.; Radmehr, M.; Zakariazadeh, A. Optimum energy resource scheduling in a microgrid using a distributed algorithm framework. Sustain. Cities Soc. 2018, 37, 222–231. [Google Scholar] [CrossRef]
  7. Silvente, J.; Papageorgiou, L.G. An MILP formulation for the optimal management of microgrids with task interruptions. Appl. Energy 2017, 206, 1131–1146. [Google Scholar] [CrossRef]
  8. Zhang, J.; Wu, Y.; Guo, Y. A hybrid harmony search algorithm with differential evolution for day-ahead scheduling problem of a microgrid with consideration of power flow constraints. Appl. Energy 2016, 183, 791–804. [Google Scholar] [CrossRef]
  9. Craparo, E.; Karatas, M.; Singham, D.I. A robust optimization approach to hybrid microgrid operation using ensemble weather forecasts. Appl. Energy 2017, 201, 135–147. [Google Scholar] [CrossRef]
  10. Mazidi, M.; Zakariazadeh, A.; Jadid, S. Integrated scheduling of renewable generation and demand response programs in a microgrid. Energy Convers. Manag. 2014, 86, 1118–1127. [Google Scholar] [CrossRef]
  11. Yu, D.; Meng, Y.; Yan, G. Sizing Combined Heat and Power Units and Domestic Building Energy Cost Optimisation. Energies 2017, 10, 771. [Google Scholar] [CrossRef]
  12. Ma, X.; Wang, Y.; Qin, J. Generic model of a community-based microgrid integrating wind turbines, photovoltaics and CHP generations. Appl. Energy 2013, 112, 1475–1482. [Google Scholar] [CrossRef]
  13. Zidan, A.; Gabbar, H.A.; Eldessouky, A. Optimal planning of combined heat and power systems within microgrids. Energy 2015, 93, 235–244. [Google Scholar] [CrossRef]
  14. Olamaei, J.; Hasheminasab, S.M.; Haghifam, M. Optimal operation of microgrid with renewable and combined heat and power resources. Eur. J. Sci. Res. 2012, 67, 543–550. [Google Scholar]
  15. Sakawa, M.; Kato, K.; Nishizaki, I. An interactive fuzzy satisficing method for multiobjective stochastic linear programming problems through an expectation model. Eur. J. Oper. Res. 2003, 145, 665–672. [Google Scholar] [CrossRef]
  16. Aien, M.; Hajebrahimi, A.; Fotuhi-Firuzabad, M. A comprehensive review on uncertainty modeling techniques in power system studies. Renew. Sustain. Energy Rev. 2016, 57, 1077–1089. [Google Scholar] [CrossRef]
  17. Jiang, Y.; Xing, F.; Pang, Z. Optimization configuration of operating reserve in microgrid based on chance-constrained programming. Power Syst. Prot. Control 2016. [Google Scholar] [CrossRef]
  18. Udhayakumar, A.; Charles, V.; Kumar, M. Stochastic simulation based genetic algorithm for chance constrained data envelopment analysis problems. Omega 2011, 39, 387–397. [Google Scholar] [CrossRef]
  19. Li, H.; Zhang, H. Ant colony optimization-based multi-mode scheduling under renewable and nonrenewable resource constraints. Autom. Constr. 2013, 35, 431–438. [Google Scholar] [CrossRef]
  20. Al-Saedi, W.; Lachowicz, S.W.; Habibi, D. Power quality enhancement in autonomous microgrid operation using Particle Swarm Optimization. Int. J. Electr. Power Energy Syst. 2012, 42, 139–149. [Google Scholar] [CrossRef]
  21. Zhao, Y.; Che, Y.; Wang, D.; Liu, H. An Optimal Domestic Electrical Vehicle Charging Strategy for Reducing Network Transmission Loss While Taking Seasonal Factors into Consideration. Appl. Sci. 2018, 8, 191. [Google Scholar] [CrossRef]
  22. Conti, S.; Rizzo, S.A. Modelling of Microgrid-Renewable Generators Accounting for Power-Output Correlation. IEEE Trans. Power Deliv. 2013, 28, 2124–2133. [Google Scholar] [CrossRef]
  23. Chen, X.; Kang, C.; O’Malley, M. Increasing the Flexibility of Combined Heat and Power for Wind Power Integration in China: Modeling and Implications. IEEE Trans. Power Syst. 2015, 30, 1848–1857. [Google Scholar] [CrossRef]
  24. Jin, M.; Feng, W.; Liu, P. MOD-DR: Microgrid optimal dispatch with demand response. Appl. Energy 2017, 187, 758–776. [Google Scholar] [CrossRef]
  25. Riffonneau, Y.; Bacha, S.; Barruel, F. Optimal Power Flow Management for Grid Connected PV Systems with Batteries. IEEE Trans. Sustain. Energy 2011, 2, 309–320. [Google Scholar] [CrossRef]
  26. Yuan, R.; Ye, J.; Lei, J.; Li, T. Integrated combined heat and system dispatch considering electricalal and thermal energy storage. Energies 2016, 9, 474. [Google Scholar] [CrossRef]
  27. Han, Y.; Chen, W.; Li, Q. Energy Management Strategy Based on Multiple Operating States for a Photovoltaic/Fuel Cell/Energy Storage DC Microgrid. Energies 2017, 10, 136. [Google Scholar] [CrossRef]
  28. Wu, H.; Liu, X.; Ding, M. Dynamic economic dispatch of a microgrid: Mathematical models and solution algorithm. Int. J. Electr. Power Energy Syst. 2014, 63, 336–346. [Google Scholar] [CrossRef]
  29. Liu, G.; Starke, M.; Xiao, B.; Tomsovic, K. Robust optimisation-based microgrid scheduling with islanding constraints. IET Gener. Transm. Distrib. 2017, 11, 1820–1828. [Google Scholar] [CrossRef]
  30. Adefarati, T.; Bansal, R.C. Reliability and economic assessment of a microgrid power system with the integration of renewable energy resources. Appl. Energy 2017, 206, 911–933. [Google Scholar] [CrossRef]
  31. Yu, D.; Liu, H.; Yan, G. Optimization of Hybrid Energy Storage Systems at the Building Level with Combined Heat and Power Generation. Energies 2017, 10, 606. [Google Scholar] [CrossRef]
  32. Nazari-Heris, M.; Abapour, S.; Mohammadi-Ivatloo, B. Optimal Economic Dispatch of FC-CHP based Heat and Power Microgrids. Appl. Therm. Eng. 2016, 114, 756–769. [Google Scholar] [CrossRef]
Figure 1. The structure diagram of a newly defined microgrid.
Applsci 08 00567 g001
Figure 2. The Monte Carlo simulation results of the renewable system outputs, thermal demands, and electrical demands.
Applsci 08 00567 g002
Figure 3. The varied-curve surface diagram of operational cost.
Applsci 08 00567 g003
Figure 4. The optimal output power of different energy generators at β = 0.8.
Applsci 08 00567 g004
Figure 5. The optimal output power of different energy generators at β = 0.9.
Applsci 08 00567 g005
Figure 6. The output power of the portable energy system.
Applsci 08 00567 g006
Figure 7. Simulation results of the output power of the battery and CHP.
Applsci 08 00567 g007
Figure 8. Total electrical energy needs to be stored in the battery.
Applsci 08 00567 g008
Table 1. The rated parameters of the traditional microgrid.
Energy CarrierCHPWind TurbinePVFuel CellBattery System
Capital cost (10,000 Ұ/kW)1.01.22.02.80.0667
Life (Year)1010201010
Min power (kW)15007−60
Max power (kW)7530304060
Table 2. Portable energy system data sheet.
ParametersRated ValueParametersRated Value
ρ (kg/m3)0.8Tamp (°C)20
A (m2)10GTSTC (kW/m2)1
ηw0.59TNOC (°C)45.5
vnom (m/s)12PPV,STC (kW)0.165
vi (m/s)5γ0.043%
vo (m/s)22Tr (°C)25
Table 3. System operational costs in different confidence levels.
βOperational Costs (Ұ)
α = 0.8α = 0.9α = 1.0
0.82776.472926.023152.34
0.93866.334016.044502.28
1.05747.366038.097605.58
Table 4. Output power of different generators in a traditional distributed network, which does not have any portable energy system installed.
PeriodsPCHP (kW)PFC (kW)PWT (kW)PPV (kW)PB (kW)PSell (kW)PBuy (kW)
10022.430−18.18052.97
225.12027.482.50−13.98042.75
372.9013.3328.5814.9815.2016.200
452.03025.3524.25−31.03041.50
567.8213.7424.281.6221.5502.98
655.607.2125.4802.6101.88
Total cost (Ұ): 1919.98
Table 5. Output power of different generators in a traditional distributed network, in which a portable energy system is installed.
PeriodsPCHP (kW)PFC (kW)PWT (kW)PPV (kW)PB (kW)PSell (kW)PBuy (kW)
10022.430−18.18052.97
224.05027.482.50−12.98042.75
358.9511.2928.5814.9814.0321.20
453.98025.3524.25−32.63041.50
558.6512.6024.281.6221.551.20
656.307.0125.4803.2301.88
Total cost (Ұ): 1376.71

