Three-Dimensional Electromagnetic Mixing Models for Dual-Phase Steel Microstructures
by
 , ,
, ,
Weibin Zhou
1,2, 
Mingyang Lu
2,*,
Ziqi Chen
2,
Lei Zhou
3,
Liyuan Yin
4,
Qian Zhao
5,
Anthony Peyton
2,
Yu Li
6 and
Wuliang Yin
1,2,* 1
School of Electronic Information and Automation, Tianjin University of Science and Technology, Tianjin 300384, China
2
School of Electrical and Electronic Engineering, University of Manchester, Manchester M13 9PL, UK
3
Warwick Manufacturing Group (WMG), University of Warwick, Coventry CV4 7AL, UK
4
School of Information Engineering and Automation, Kunming University of Science and Technology, Kunming 650221, China
5
College of Engineering, Qufu Normal University, Qufu 273165, China
6
School of Information Science and Engineering, Lanzhou University, Lanzhou 730000, China
*
Authors to whom correspondence should be addressed.
Appl. Sci. 2018, 8(4), 529; https://doi.org/10.3390/app8040529
Submission received: 28 February 2018
/
Revised: 15 March 2018
/
Accepted: 29 March 2018
/
Published: 30 March 2018
Abstract
:Linking the ferrite fraction in a dual-phase (DP) steel microstructure and its electromagnetic properties is critical in the effort to develop on-line measurement techniques for phase transformation using electromagnetic (EM) sensors. This paper developed a seamlessly integrated method for generating 3D microstructures and evaluating their equivalent permeability values. Both the generation of 3D microstructures and evaluation of equivalent permeability have been achieved through custom modelling packages developed by the authors. Voronoi modelling based on the random close packing of spheres (RCPS-VM) was used to precisely control the ferrite fraction in DP steel microstructure, and an equivalent uniform field method for 3D finite element simulation was developed for efficient analysis.
1. Introduction
Strip steels with a dual-phase (DP) microstructure are widely used in the automotive industry. The microstructure of DP steels consists of ferrite with 20%–80% dispersion of second phase (e.g., martensite, tempered martensite, and/or bainite) islands. The microstructure is produced either by controlling the transformation of austenite after hot rolling or by heat treatment after cold rolling. The amount and type of any second phase plays an important role in determining its mechanical properties. In order to achieve accurate control of the steel quality, in particular of the mechanical properties, during manufacturing, it is important to be able to monitor non-destructively the volume fraction and spatial distribution of the phases, as there is a direct link between microstructure and mechanical properties. Previously, multi-frequency electromagnetic (EM) sensors have been shown to be able to measure austenite-ferrite fraction from 0 to 100% in model (HIPped austenitic-ferritic stainless steel powder) alloys [1,2] and ferrite-pearlite steels with uniform second phase distribution in C-Mn steels with different carbon concentrations [3].
When considering the effective electrical or magnetic property of a material, which has two components with contrasting properties, a finite element microstructure model can be used to predict the relative permeability [4,5,6] based on actual microstructures. The microstructural phases were considered as constituents with different relative permeability values. To date, FE microstructure modelling to predict magnetic relative permeability has only been carried out in two dimensions (2D), whereas the electromagnetic field generated by the EM sensor [7,8,9,10,11,12] interacts with the microstructure in three dimensions, so it is important to study how the permeability–ferrite-fraction relationship changes when modelling is carried out in 3D.
Previously, we have proposed a strategy that can directly link the microstructure with the sensor’s output [2,13,14]. The EM sensor output has been verified to be an important response symbol of the microstructure. However, the sensor’s geometry can also affect the output. Therefore, results obtained from one EM sensor setup cannot be applied to another. In addition, different measurement instrument constructions (ferrite-cored or air-cored probe) and complicated microstructures would make it very challenging to directly link the sensor output with the microstructure. Fortunately, an alternative technique—the full transduction chain—has been proposed, which can be split into in two procedures [15]. The first is consists in linking microstructures to a magnetic property, i.e., permeability, and the second consists in linking the permeability to the sensor output signal. This technique enables us to build general models without considering sensor geometry.
In this paper, the modelling of the effect of the 2nd phase on the effective magnetic relative permeability has been extended to 3D microstructures, which are generated using a Voronoi modelling method based on the random close packing of spheres (RCPS-VM). This also allows for the precise control of phase fraction.
2. The Generation of 3D Microstructure Models
S. Yadegari et al. developed a Voronoi-based algorithm (multi-level Voronoi) [16,17,18] to generate 3D microstructure models with two different phases for strip steels. However, the grid sizes (total number of elements) were small (less than 800) and the ferrite fraction in their model could not be accurately controlled. As we know, the macroscopic mechanical and electrical properties of DP steel depend on both phase fractions and morphology, and a small grid is not conducive to quantitative analysis in statistics. So far, little has been carried out to simulate strip steel microstructures [19] with randomly distributed, precisely controlled phase fractions and large number DP grains.
Previously, a Voronoi diagram in Laguerre geometry based on RCPS was used to model DP composites [20]. In this paper, we use Voronoi modelling based on RCPS (RCPS-VM) to simulate DP steel microstructures, and 3D electromagnetic finite element analysis was performed to obtain their equivalent conductivity and permeability. The number of grains is significant for drawing statistically sound conclusions, and a seamless interfacing between the RCPS-VM and 3D simulations has been achieved through the custom developed solvers. A series of models with different volume fractions are generated, and 3D EM finite element analysis was carried out.
2.1. The Generation of Random Close Packing of Spheres
RCPS has been used for the study of many physical and engineering systems. Up to now, there have been a number of approaches to generate RCPS, and they can be classified as sequential generation methods [21,22] and collective rearrangement algorithms [23,24]. In this work, a modified rearrangement algorithm is adopted for the generation of RCPS [24].
A random close packing of 10,000 spheres was generated for each RCPS-VM model. These 10,000 spheres contained two groups, corresponding to the two phases in our RCPS-VM microstructure. Each sphere in these two groups was randomly distributed in space, and finally a close packing state was reached for all spheres. The volume of each sphere in two groups was set to 1. The volume fractions of the first group (corresponding to ferrite in the RCPS-VM microstructure) varied from 10% to 50% at an interval of 10% to form a series of models.
2.2. The Generation of RCPS-VM
In general, a 3D Voronoi diagram is generated by a set of n random distribution points in 3D space R3, Q = {p1, p2, …, pn}. If the distance between pi and any other point pj is denoted as d(pi, pj), a Voronoi cell (V-Cell) corresponding to pi is defined as
where the set of points in 3D space, R3, is composed of points that are closer to the nucleus points pi than to any other nucleus points in Q. The space is separated by the V-Cells, V (p1), V (p2), …, V (pn), and their boundaries. All V-Cells form a Voronoi diagram, which divides 3D space into an array of convex, space-filling, and non-overlapping polyhedrons.
In this paper, Voronoi modelling based on random close packing of spheres (RCPS-VM) is used to simulate the microstructure of DP steel. Firstly, RCPS with two groups (corresponding to the two phases in our model) are generated, shown in Figure 1a. Each sphere in RCPS is close-packing with its neighbor sphere, and the distance between each sphere and its every neighbor sphere is basically 2 times the radius of a sphere. Accordingly, RCPS can provide the discreet positional information of every sphere and the point set Q consisting of all the centers of the spheres for the construction of Voronoi diagram. Secondly, the point set Q in RCPS is utilised to compute the Voronoi diagram. The expansion frame of every sphere in RCPS serves as a template in the generation of Voronoi diagram, which is mostly filled by RCPS, shown in Figure 1b. A 3D Voronoi diagram is drawn through a 4D convex hull constructed via the Qhull software package [25,26]. Each V-Cell in the constructed Voronoi diagram represents a grain in the DP steel microstructure. V-Cells originating from the same group of spheres belong to the same phase in the DP steel microstructure, shown in Figure 1c. The Voronoi diagram as a whole is a model of DP steel with equiaxis grains. To facilitate EM finite element simulation and eliminate possible boundary effects caused by the RCPS algorithm, V-cells within the outermost shell (four times the sphere radius in this algorithm) were trimmed off to obtain a regular boundary [15]. As a result, each model consists ~6400 effective grains.
2.3. Volume Fraction Analysis
Five groups of DP steel microstructure models were obtained by the method above (Table 1). Figure 2 shows the simulated DP steel microstructures and the initial RCPS, with an increasing volume fraction of ferrite phase, i.e., 10%, 30%, and 50%. In the top of Figure 2, three initial RCPS with different volume fractions of ferrite phase, i.e., 10%, 30%, and 50% are given. In the bottom of Figure 2, three generated DP steel microstructures with a corresponding volume fraction of ferrite phase, i.e., 10%, 30%, and 50% are shown.
In Table 1, we can see that the mean volume of grains is about 1.2, which is slightly larger than that of its initial sphere (i.e., 1). This is due to the space gap between the spheres in RCPS (Figure 1a), which is filled when the Voronoi diagram in Figure 1b is formed. Nevertheless, because the volumes of both phases increase, the volume fraction does not significantly change, as shown in Figure 3, which means that our approach can precisely control the volume fractions of individual phases.
3. Tetrahedron Meshing for FEM
There are a number of 3D tetrahedron finite elements meshing softwares, including Cog, Geom Pack90, Grid Gen, Qhull, Tmg, Mesh Maker, and Tet Gen. Tet Gen is easy to compile and has a fast and stable algorithm [27] written in the standard C++ program with good portability.
The input of the Tet Gen software requires only one form of file “.Poly”. A “.Poly” file contains four pieces of information: first, the point information; second, the face information; third, information about the holes in the model; and fourth, information about the model of regional characteristics. The data structure from Section 1 can be easily converted to satisfy the requirements of this Tet Gen software (version 1.5.0).
Figure 4 shows the 3D graphs of the tetrahedral finite element mesh for a DP steel model with the volume fraction of ferrite phase being 10%. The green part represents the generated mesh of the ferrite phase, while the red part represents the generated mesh of the second phase. The complete mesh of the model consists of about 196,000 tetrahedron elements.
4. Methods of the Edge-Element FEM Solver
The austenite–ferrite in the RCPS-VM microstructure element profiles, including the coordinates of the nodes, the sequence of the nodes in each element, and the material properties of each element, can be regarded as the input of the solver, which is based on the FEM. Here, the original Galerkin’s equations are transformed into matrix form [28,29,30]:
Since the austenite–ferrite alloy is an insulating material, the electrical conductivity terms in Equations (2) and (3) can be ignored. Equations (2) and (3) become Equations (4) and (5):
where is the vector interpolation of the ith edge corresponding to its nth edge element, is the elemental interpolation of the ith node corresponding to its nth element, is the original edge vector potential of the nth element, is the produced edge vector potential of the nth element, is the electrical potential on the receiver (pick-up) coil contributed by the nth element, υ is the reluctivity (the reciprocal of the permeability) of the target, is the reluctivity (the reciprocal of the permeability) of the air, σ is the conductivity of the target.
Assuming, for an arbitrary element n, there is a matrix Q that can represent the stiffness matrix form of the left-hand side of Equations (2) and (3) for an arbitrary element,
After combining Equation (6) for the whole system element, the matrix forms of Equations (2) and (3) can be obtained as follows.
Here, the K matrix is divided into the K1 and K2 matrices. K1 denotes the matrix form of the first vector-potential-related term in Equation (2), which acts as a fundamental formation of the vector potential. K2 denotes the matrix form of the second vector-potential-related term in Equation (2), which exhibits the eddy current diffusion effect under high frequency. L is the matrix form of the first electric-potential-related term in Equation (2), which controls the eddy current by the Maxwell–Wagner effect, restricting the current by the shape of the target. M and N are the matrix forms of the first and second terms in Equation (3), which collectively control the magnetostatic field part. B is the matrix form of the right side terms of Equations (2) and (3), which denote the Dirichlet boundary condition. e and o represent the edge and vertex number of the whole mesh, respectively. For the austenite–ferrite alloy case, as shown in Equations (6) and (7), the L and N should be empty matrices.
The magnetic flux density can also be derived from the vector potential in Equation (8):
where A(i) denotes the vector sum of the vector potential on all edges of each tetrahedral element. υ(i) is the reluctivity (the reciprocal of the permeability) of each tetrahedral element.
Since the normal component of the B-field relative to the surface of the target is continuous throughout the whole target, then
where Hs(i) denotes the background H-field (the H-field when the injected background field is applied to the free space without the microstructure specimens) of each tetrahedral element; is the normal unit vector relative to the surface of the target; µ is the equivalent magnetic permeability of the target.
Assuming the magnetic background field is vertical to the surface of the target, the equivalent magnetic permeability of the target can be deduced from Equation (9):
5. The Effect of Ferrite Fraction on Relative Permeability
Figure 5 shows the modelling results for the effective relative permeability variation with the ferrite fraction in the ferrite–austenite steel samples when the background field is a unit-uniform magnetic H-field (equally distributed) vertically penetrating the steel sample from top to bottom. It can be derived that the equivalent permeability of austenite–ferrite in the RCPS-VM microstructure will rise as the volume fraction of the ferrite grains increases (and the permeability value of ferrite is much larger than that of the austenite).
Figure 6, Figure 7 and Figure 8 show the magnetic H-field transects when the volume fraction of ferrite grains equals 30%, 50%, and 70%, respectively. In addition, it can be easily seen that the magnetic H-field becomes weaker as the volume fraction of ferrite grains increase, which can be deduced from Equation (9) and (10).
6. The Effect of Mesh Element Density
Figure 9a shows the experimental data and equivalent permeability of austenite–ferrite in the RCPS-VM microstructure when the model is meshed into 0.19 M, 0.46 M, 0.82 M and 1.23 M elements when the background field is a unit-uniform magnetic H-field vertically penetrating the steel sample from top to bottom.
It can be concluded from Figure 9a that the equivalent permeability of austenite–ferrite in the RCPS-VM microstructure calculated by the refined mesh (1.23 M elements) is much smaller and more accurate than that calculated by the coarse mesh (0.19 M elements) when compared with the measured data. In addition, further refining the mesh would barely affect the equivalent permeability curve.
Figure 9b illustrates the 2D (40 k elements) and 3D (8 M elements) modelling results using COMSOL Multiphysics for the effective relative permeability variation with ferrite fraction in the ferrite–austenite steel sample. The ferrite and austenite phases are randomly distributed in 2D and 3D models. Since the magnetic flux have one more degree of freedom to penetrate the microstructures, it is obvious that the 3D FE modelling predictions present higher relative permeability values than that for the 2D FE modelling. Previous experimental data for EM sensor measurements of DP and CP steels have displayed an almost linear relationship between inductance (which is correlated to permeability) and ferrite fraction (specimens with a 24%–86% second phase) [9], which are more similar to the 3D model predictions. Moreover, the 3D modelling predictions demonstrate better agreement with the measured magnetic permeability values over a full range of 0–100% second phase in ferrite–austenite microstructures reported in [2]. Therefore, it can be concluded that, the 3D modelling results shows a closer fit with the experimental data for the ferrite–austenite microstructure. In addition, when the relative permeability variation with the ferrite fraction results in Figure 9a,b are compared, the equivalent permeability-ferrite-fraction curve trend of the 1.23 M element austenite–ferrite RCPS-VM microstructure shows a closer fit to that of the 3D EM model using COMSOL Multiphysics (version 5.2).
7. The Effect of the Background Field Tensor
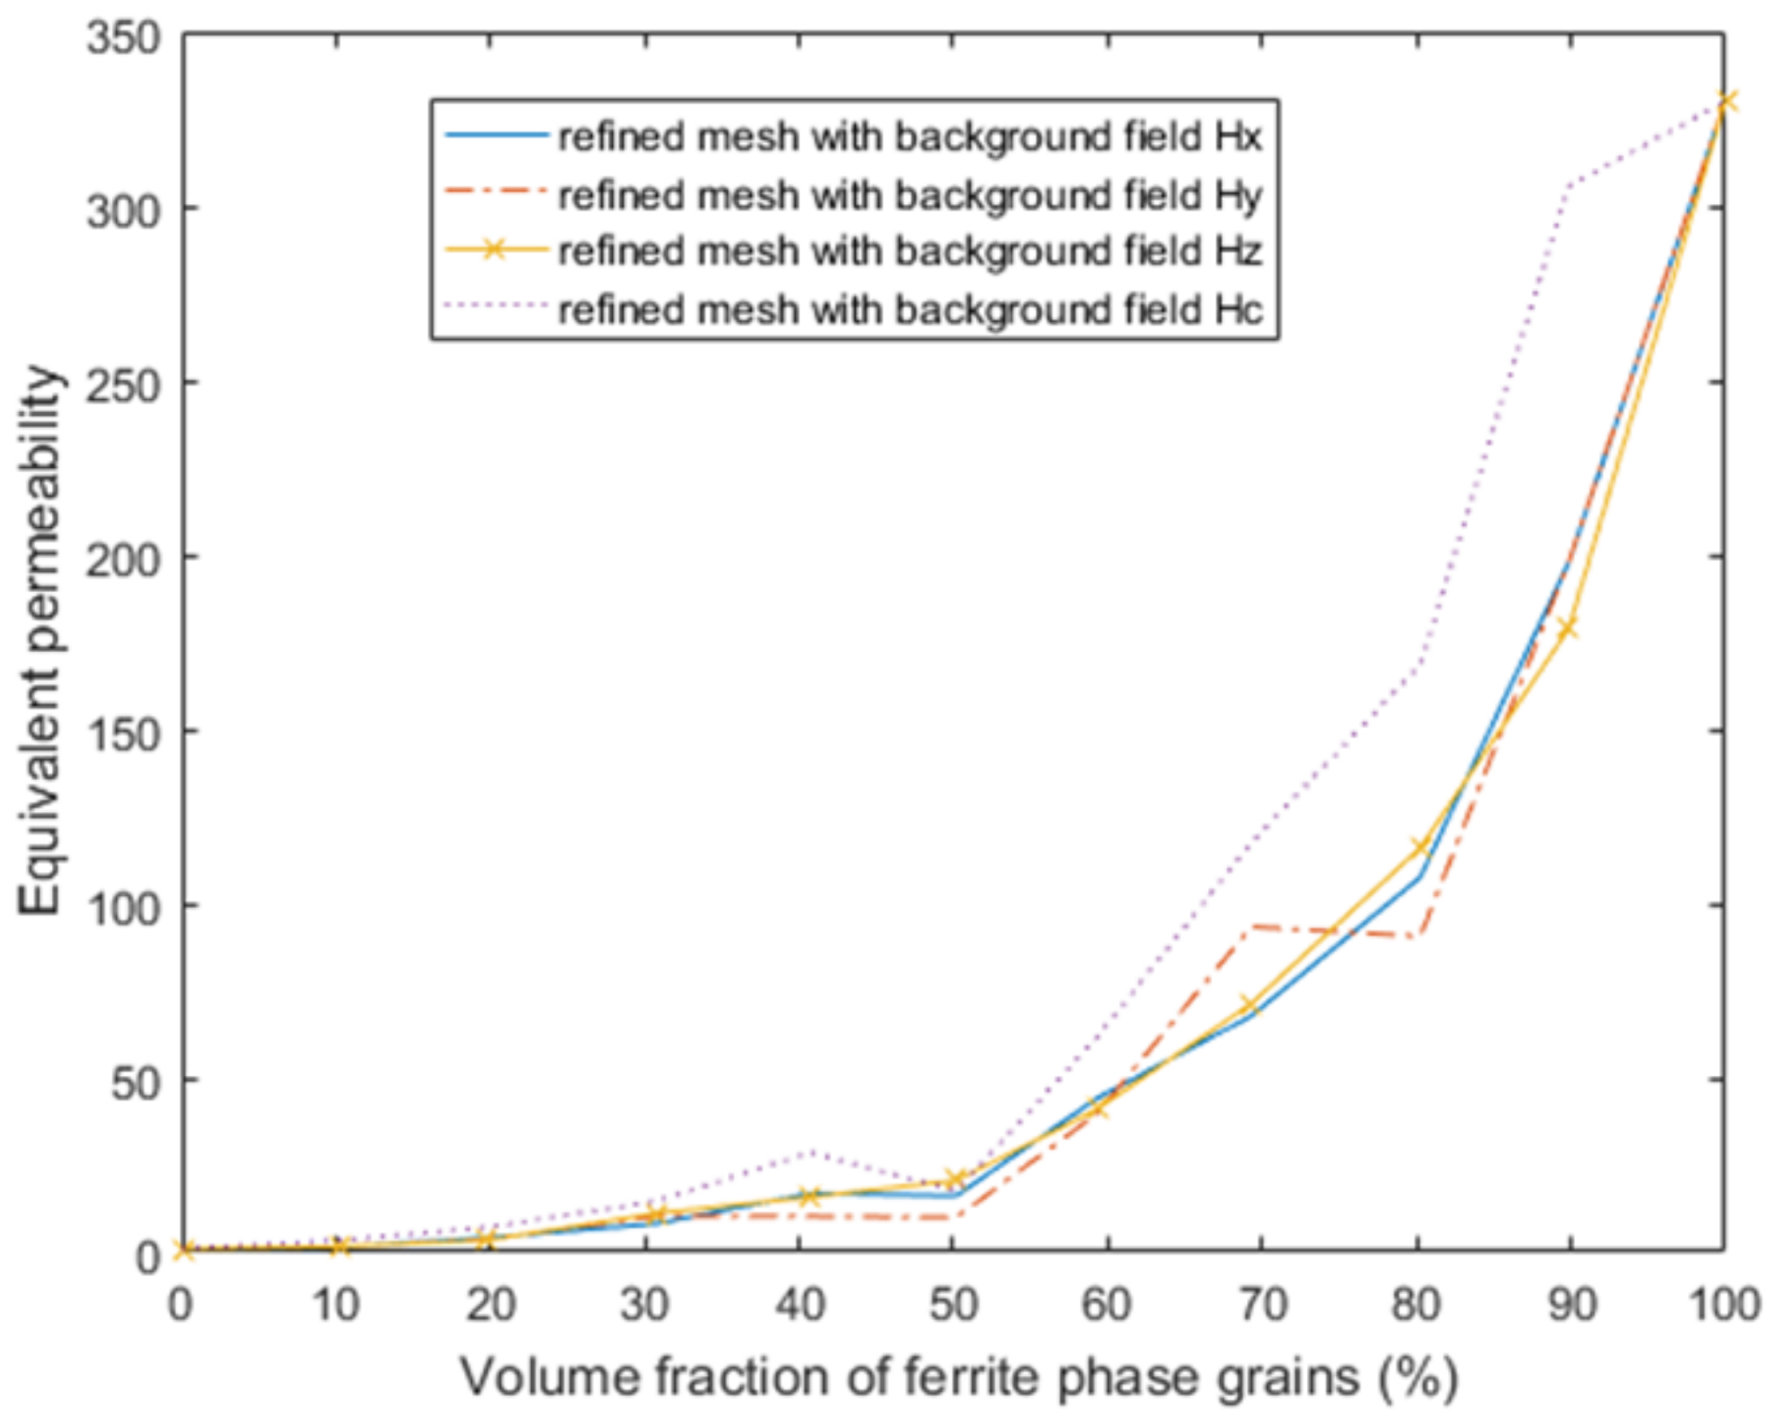
We also modelled the austenite–ferrite in the RCPS-VM microstructure steel sample under different background field tensors. Figure 10 presents the modelling results for the effective relative permeability variations with ferrite fraction in the ferrite–austenite steel samples when the background fields are unit-uniform magnetic H-fields vertically penetrating the steel sample from top to bottom, from left to right, and from front to back and when the background filed is excited by a transmitter coil with a unit-alternating current (here expressed as Hz, Hx, Hy, and Hc, respectively). It can be seen that the modelling results of background fields Hx and Hz are smoother than those of Hy and Hc, which is probably caused by the different distribution tensors of austenite–ferrite in the RCPS-VM steel phase gains.
8. Conclusions
In this paper, a seamlessly integrated method for generating 3D microstructures and a custom FE solver for evaluating their equivalent permeability values have been developed, which can link the ferrite fraction in a DP steel microstructure with its electromagnetic properties in the process of on-line phase measurement using EM sensors. The effect of austenite–ferrite phase distribution was studied in the proposed 3D FE microstructure. It was shown that a significant difference in permeability values results from the direction of the field with respect to the orientation of the microstructure steel model. Therefore, the phase distribution must be considered in order to correctly estimate the relative permeability values for phase balance characterisation.
Acknowledgments
The authors would like to thank the UK Engineering and Physical Sciences Research Council (EPSRC). This work was supported by [UK Engineering and Physical Sciences Research Council (EPSRC)] [grant number:EP/M020835/1] [title:Electromagnetic tensor imaging for in-process welding inspection]].
Author Contributions
W.B.Z. and M.L. designed and provided the steel microstructures; M.L. proposed the custom FEM solver to predict the permeability; W.B.Z., M.L., L.Z., Q.Z., L.Y.Y., P.A., Z.C., Y.L., and W.Y. wrote the paper.
Conflicts of Interest
The authors declare no conflict of interest.
References
- Yin, W.; Hao, X.J.; Peyton, A.J.; Strangwood, M.; Davis, C.L. Measurement of permeability and ferrite/austenite phase fraction using a multi-frequency electromagnetic sensor. NDT E Int. 2009, 42, 64–68. [Google Scholar] [CrossRef]
- Hao, X.J.; Yin, W.; Strangwood, M.; Peyton, A.J.; Morris, P.F.; Davis, C.L. Modelling the electromagnetic response of two-phase steel microstructures. NDT E Int. 2010, 43, 305–315. [Google Scholar] [CrossRef]
- Zhou, L.; Liu, J.; Hao, X.J.; Strangwood, M.; Peyton, A.J.; Davis, C.L. Quantification of the phase fraction in steel using an electromagnetic sensor. NDT E Int. 2014, 67, 31–35. [Google Scholar] [CrossRef]
- Lu, M.; Zhu, W.; Yin, L.; Peyton, A.J.; Yin, W.; Qu, Z. Reducing the Lift-Off Effect on Permeability Measurement for Magnetic Plates from Multifrequency Induction Data. IEEE Trans. Instrum. Meas. 2018, 67, 167–174. [Google Scholar] [CrossRef]
- Lu, M.; Xu, H.; Zhu, W.; Yin, L.; Zhao, Q.; Peyton, A.J.; Yin, W. Conductivity Lift-off Invariance and measurement of permeability for ferrite metallic plates. NDT E Int. 2018, 95, 36–44. [Google Scholar] [CrossRef]
- Avila, J.R.; How, K.Y.; Lu, M.; Yin, W. A Novel Dual Modality Sensor with Sensitivities to Permittivity, Conductivity, and Permeability. IEEE Sens. J. 2018, 18, 356–362. [Google Scholar] [CrossRef]
- Lu, M.; Yin, L.; Peyton, A.J.; Yin, W. A novel compensation algorithm for thickness measurement immune to lift-off variations using eddy current method. IEEE Trans. Instrum. Meas. 2016, 65, 2773–2779. [Google Scholar] [CrossRef]
- Lu, M.; Zhao, Q.; Hu, P.; Yin, W.; Peyton, A.J. Prediction of the asymptotical magnetic polarization tensors for cylindrical samples using the boundary element method. In Proceedings of the 2015 IEEE Sensors Applications Symposium (SAS), Zadar, Croatia, 13–15 April 2015. [Google Scholar]
- Yang, T.; Zhao, Q.; How, K.Y.; Xu, K.; Lu, M.; Xie, Y.; Yin, W. Level measurement for saline with a small surface area using high frequency electromagnetic sensing technique. Measurement 2017, 101, 118–125. [Google Scholar] [CrossRef]
- Peyton, A.J.; Yin, W.; Dickinson, S.J.; Davis, C.L.; Strangwood, M.; Hao, X.; Douglas, A.J.; Morris, P.F. Monitoring microstructure changes in rod online by using induction spectroscopy. Ironmak. Steelmak. 2010, 37, 135–139. [Google Scholar] [CrossRef]
- Hao, X.J.; Yin, W.; Strangwood, M.; Peyton, A.J.; Dickinson, S.J.; Morris, P.F.; Davis, C.L. Monitoring of Steel Microstructures using Electromagnetic Sensors. In Proceedings of the International Conference on Non Destructive Evaluation for Steel and Allied Industries—NDESAI 2011, Jamshedpur, India, 2–3 December 2011. [Google Scholar]
- Zhu, W.; Yin, W.; Peyton, A.J.; Ploegaert, H. Modelling and experimental study of an electromagnetic sensor with an H-shaped ferrite core used for monitoring the hot transformation of steel in an industrial environment. NDT E Int. 2011, 44, 547–552. [Google Scholar] [CrossRef]
- Barber, C.B.; Dobkin, D.P.; Huhdanpaa, H. The quickhull algorithm for convex hulls. ACM Trans. Math. Softw. (TOMS) 1996, 22, 469–483. [Google Scholar] [CrossRef]
- Sugihara, K. Three-dimensional convex hull as a fruitful source of diagrams. Theor. Comput. Sci. 2000, 235, 325–337. [Google Scholar] [CrossRef]
- Yin, W.; Peyton, A.J.; Strangwood, M.; Davis, C.L. Exploring the relationship between ferrite fraction and morphology and the electromagnetic properties of steel. J. Mater. Sci. 2007, 42, 6854–6861. [Google Scholar] [CrossRef]
- Yadegari, S.; Turteltaub, S.; Suiker, A.S.; Kok, P.J. Analysis of banded microstructures in multiphase steels assisted by transformation-induced plasticity. Comput. Mater. Sci. 2014, 84, 339–349. [Google Scholar] [CrossRef]
- Van-Den-Berg, F.; Kok, P.; Yang, H.; Aarnts, M.; Vink, J.J.; Beugeling, W.; Meilland, P.; Kebe, T.; Stolzemberg, M.; Krix, D.; et al. In-line characterisation of microstructure and mechanical properties in the manufacturing of steel strip for the purpose of product uniformity control. In Proceedings of the 19th World Conference on Non-Destructive Testing, Munich, Germany, 13–17 June 2016. [Google Scholar]
- Zhou, L.; Davis, C.L.; Kok, P.; Van-Den-Berg, F. Magnetic NDT for Steel Microstructure Characterisation–Modelling the Effect of Second Phase Distribution on Magnetic Relative Permeabilty. In Proceedings of the 19th World Conference on Non-Destructive Testing, Munich, Germany, 13–17 June 2016. [Google Scholar]
- Wang, K.; Chang, B.; Chen, J.; Fu, H.; Lin, Y.; Lei, Y. Effect of molybdenum on the microstructures and properties of stainless steel coatings by laser cladding. Appl. Sci. 2017, 7, 1065. [Google Scholar] [CrossRef]
- Wu, Y.; Zhou, W.; Wang, B.; Yang, F. Modeling and characterization of two-phase composites by Voronoi diagram in the Laguerre geometry based on random close packing of spheres. Comput. Mater. Sci. 2010, 47, 951–961. [Google Scholar] [CrossRef]
- Han, K.; Feng, Y.T.; Owen, D.R. Sphere packing with a geometric based compression algorithm. Powder Technol. 2005, 155, 33–41. [Google Scholar] [CrossRef]
- Al-Raoush, R.; Alsaleh, M. Simulation of random packing of polydisperse particles. Powder Technol. 2007, 176, 47–55. [Google Scholar] [CrossRef]
- He, D.; Ekere, N.N. Computer simulation of powder compaction of spherical particles. J. Mater. Sci. Lett. 1998, 17, 1723–1725. [Google Scholar] [CrossRef]
- Wu, Y.; Fan, Z.; Lu, Y. Bulk and interior packing densities of random close packing of hard spheres. J. Mater. Sci. 2003, 38, 2019–2025. [Google Scholar] [CrossRef]
- Tetgen Software Package. Available online: http://wias-berlin.de/ (accessed on 28 February 2018).
- Bíró, O. Edge element formulations of eddy current problems. Comput. Methods Appl. Mech. Eng. 1999, 169, 391–405. [Google Scholar] [CrossRef]
- Lu, M.; Peyton, A.J.; Yin, W. Acceleration of Frequency Sweeping in Eddy-Current Computation. IEEE Trans. Magn. 2017, 53, 1–8. [Google Scholar] [CrossRef]
- Ryzhakov, P.; Marti, J. A Semi-Explicit Multi-Step Method for Solving Incompressible Navier-Stokes Equations. Appl. Sci. 2018, 8, 119. [Google Scholar] [CrossRef]
- Papaelias, M.P.; Strangwood, M.; Peyton, A.J.; Davis, C.L. Measurement and modeling of the electromagnetic response to phase transformation in steels. Metall. Mater. Tran. A 2004, 2004 35, 965–972. [Google Scholar] [CrossRef]
- Haldane, R.J.; Yin, W.; Strangwood, M.; Peyton, A.J.; Davis, C.L. Multi-frequency electromagnetic sensor measurement of ferrite/austenite phase fraction—Experiment and theory. Scr. Mater. 2006, 54, 1761–1765. [Google Scholar] [CrossRef]
Figure 1.
Two-dimensional illustration for constructing dual-phase (DP) steel microstructure with the Voronoi modelling method based on the random close packing of spheres (RCPS-VM): (a) DP RCPS; (b) computing the Voronoi diagram; (c) DP steel microstructure.
Figure 1.
Two-dimensional illustration for constructing dual-phase (DP) steel microstructure with the Voronoi modelling method based on the random close packing of spheres (RCPS-VM): (a) DP RCPS; (b) computing the Voronoi diagram; (c) DP steel microstructure.
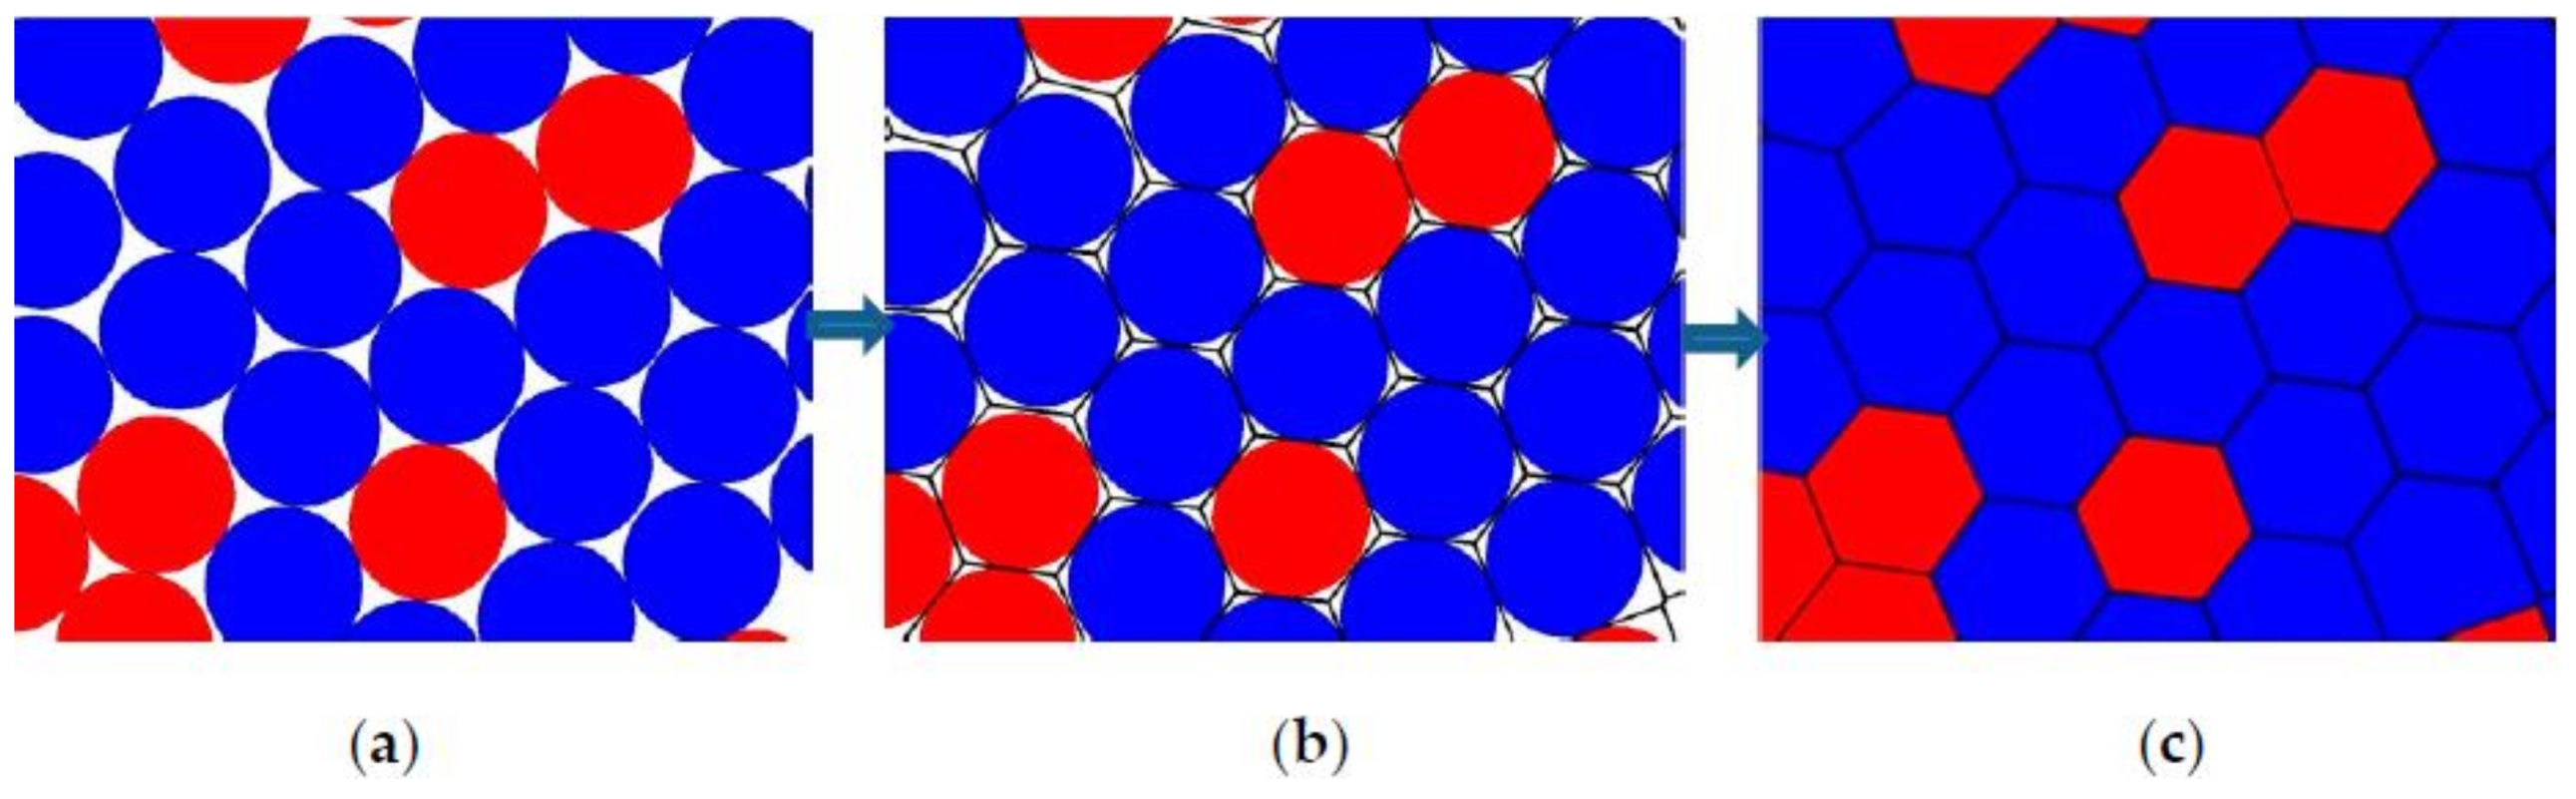
Figure 2.
Simulated DP steel microstructure (d–f) and initial RCPS (a–c), with an increasing volume fraction of ferrite phase, i.e., 10%, 30%, and 50%.
Figure 2.
Simulated DP steel microstructure (d–f) and initial RCPS (a–c), with an increasing volume fraction of ferrite phase, i.e., 10%, 30%, and 50%.
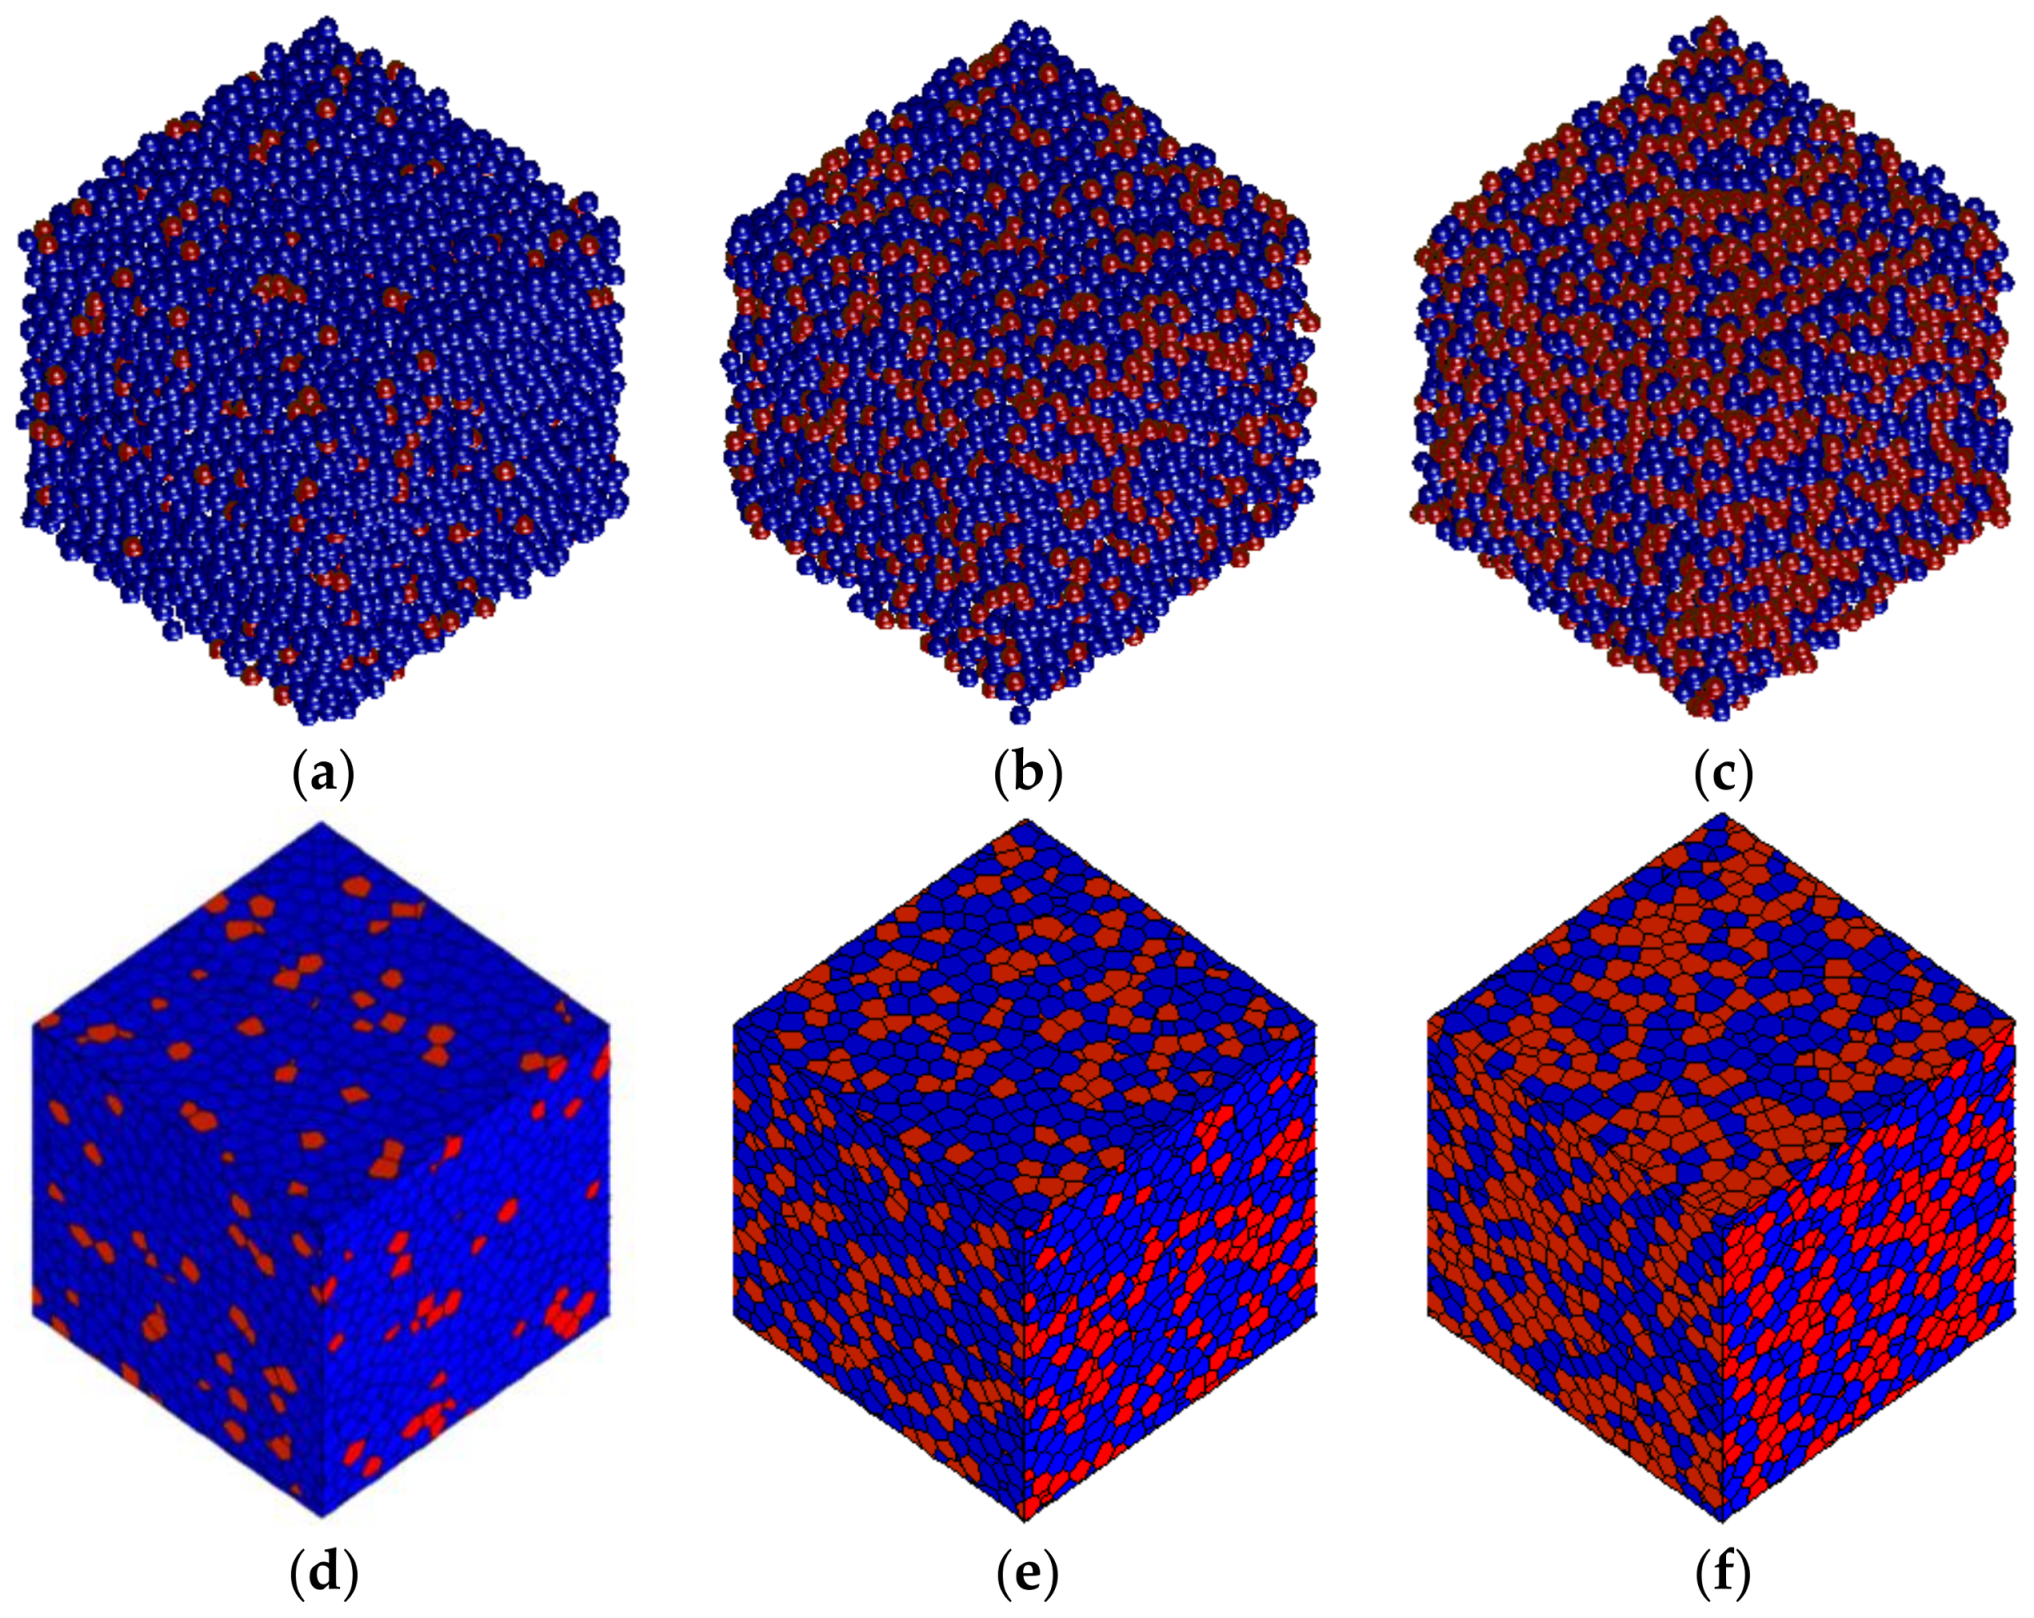
Figure 3.
The relations of volume fraction between ferrite phase grains and corresponding spheres (the reference line represents the relations when these two volume fractions are equal).
Figure 3.
The relations of volume fraction between ferrite phase grains and corresponding spheres (the reference line represents the relations when these two volume fractions are equal).
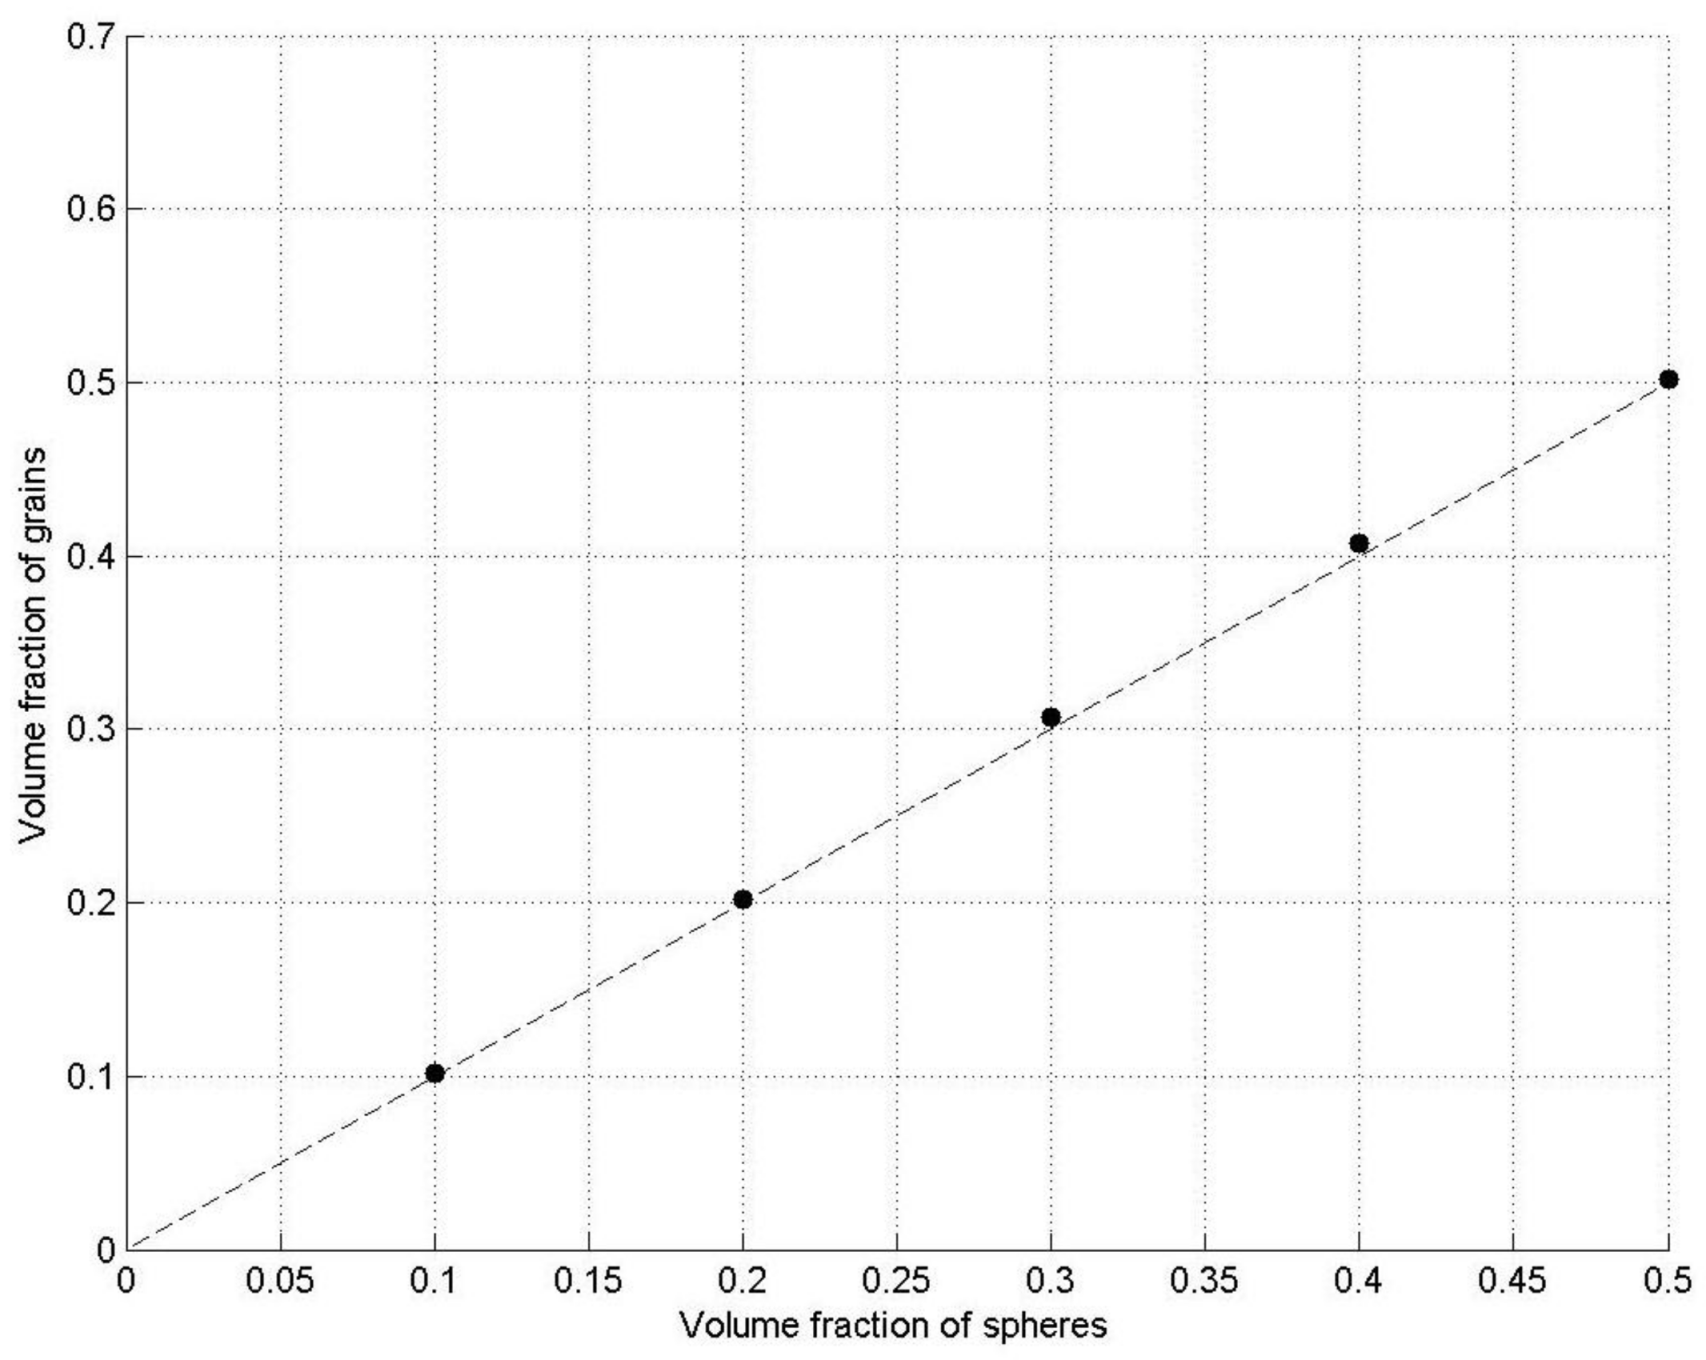
Figure 4.
3D graphs of tetrahedral finite element mesh for a DP steel model: (a) the whole tetrahedral finite element mesh; (b) a cross-section of the tetrahedral finite element mesh.
Figure 4.
3D graphs of tetrahedral finite element mesh for a DP steel model: (a) the whole tetrahedral finite element mesh; (b) a cross-section of the tetrahedral finite element mesh.
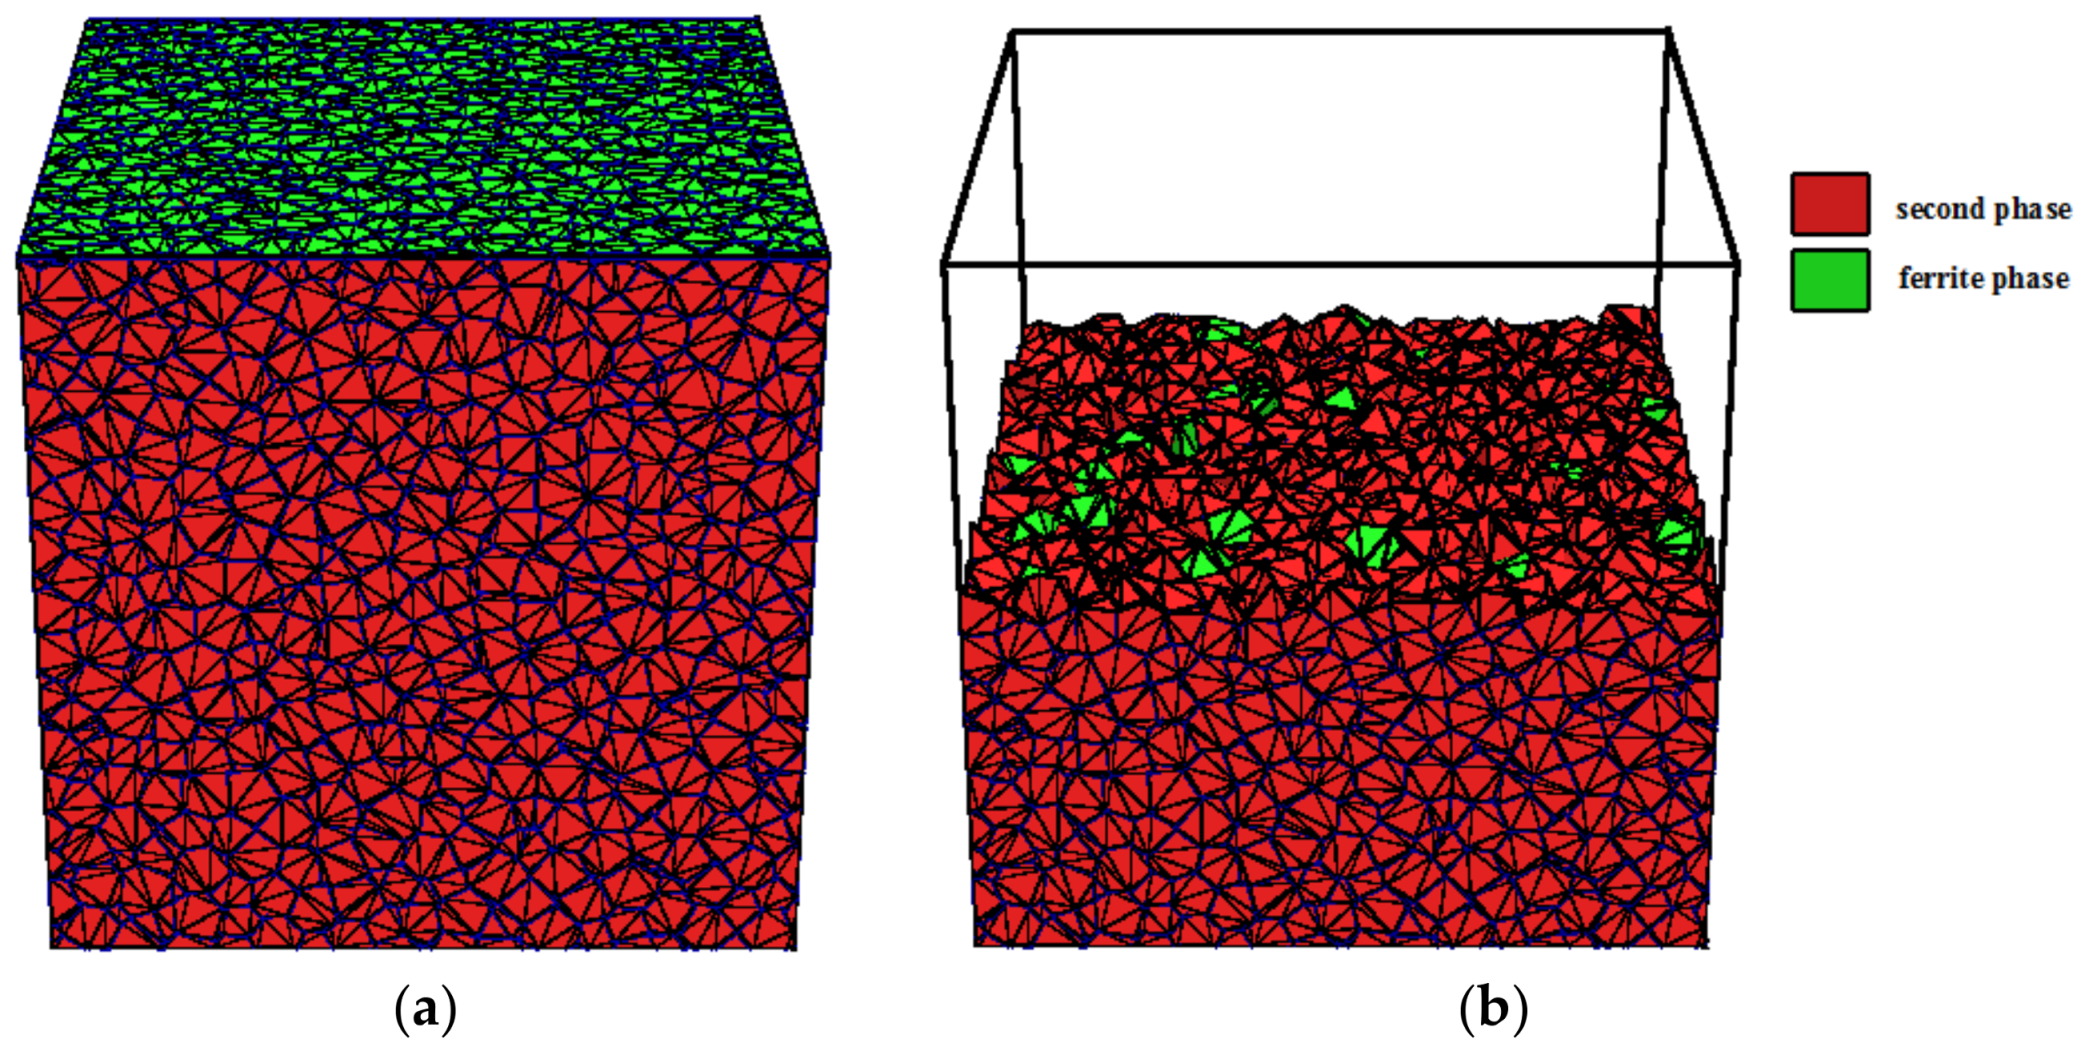
Figure 5.
Equivalent relative permeability of austenite–ferrite in the RCPS-VM microstructure with varying phase fractions.
Figure 5.
Equivalent relative permeability of austenite–ferrite in the RCPS-VM microstructure with varying phase fractions.
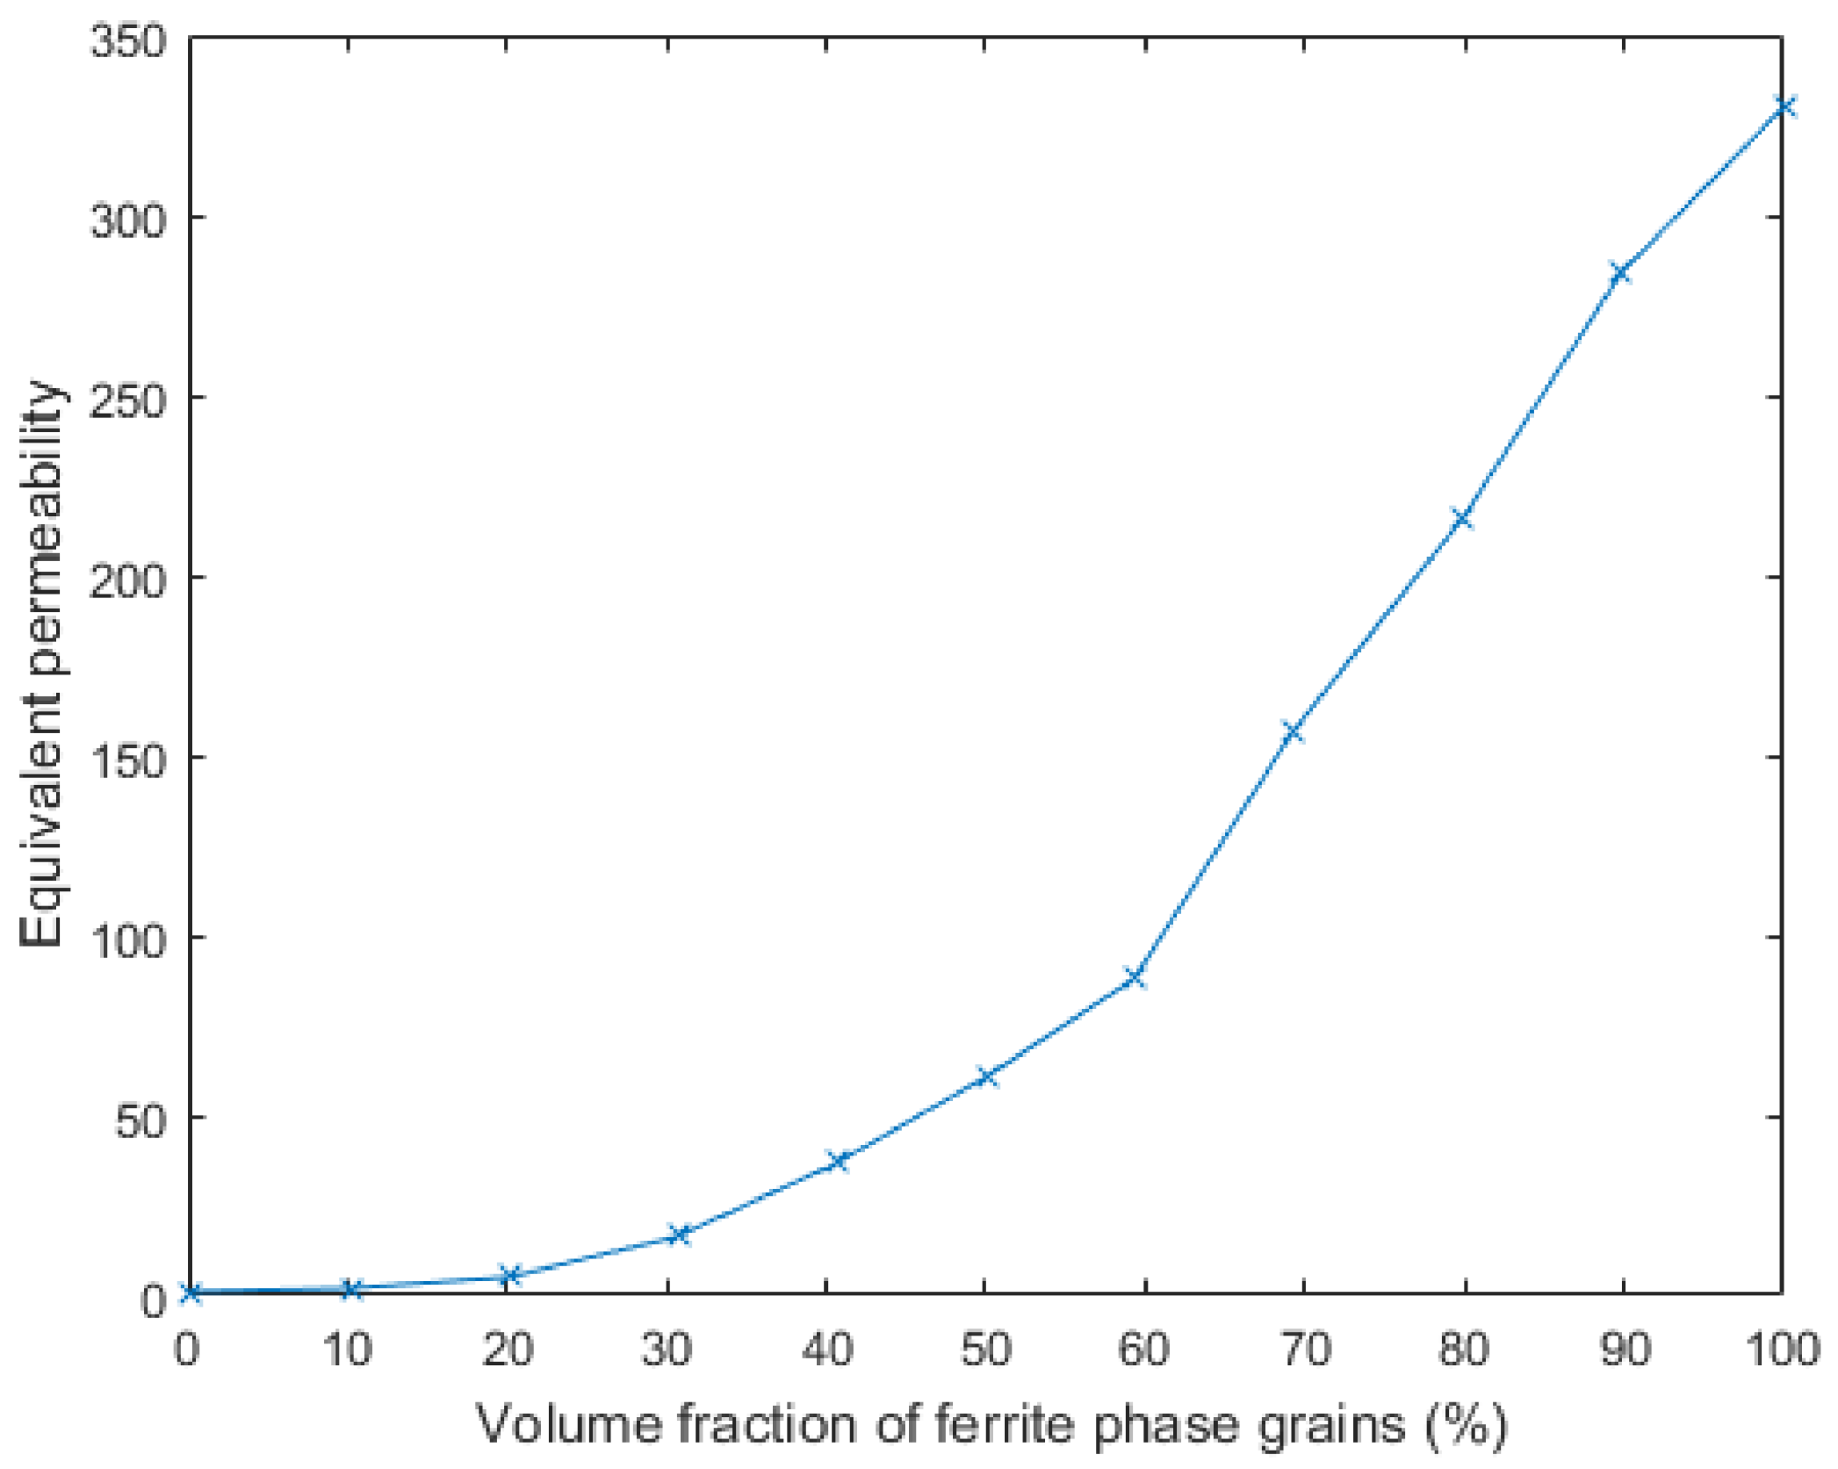
Figure 6.
Chromatogram of the magnetic H-field when the volume fraction of ferrite grains is 30%.
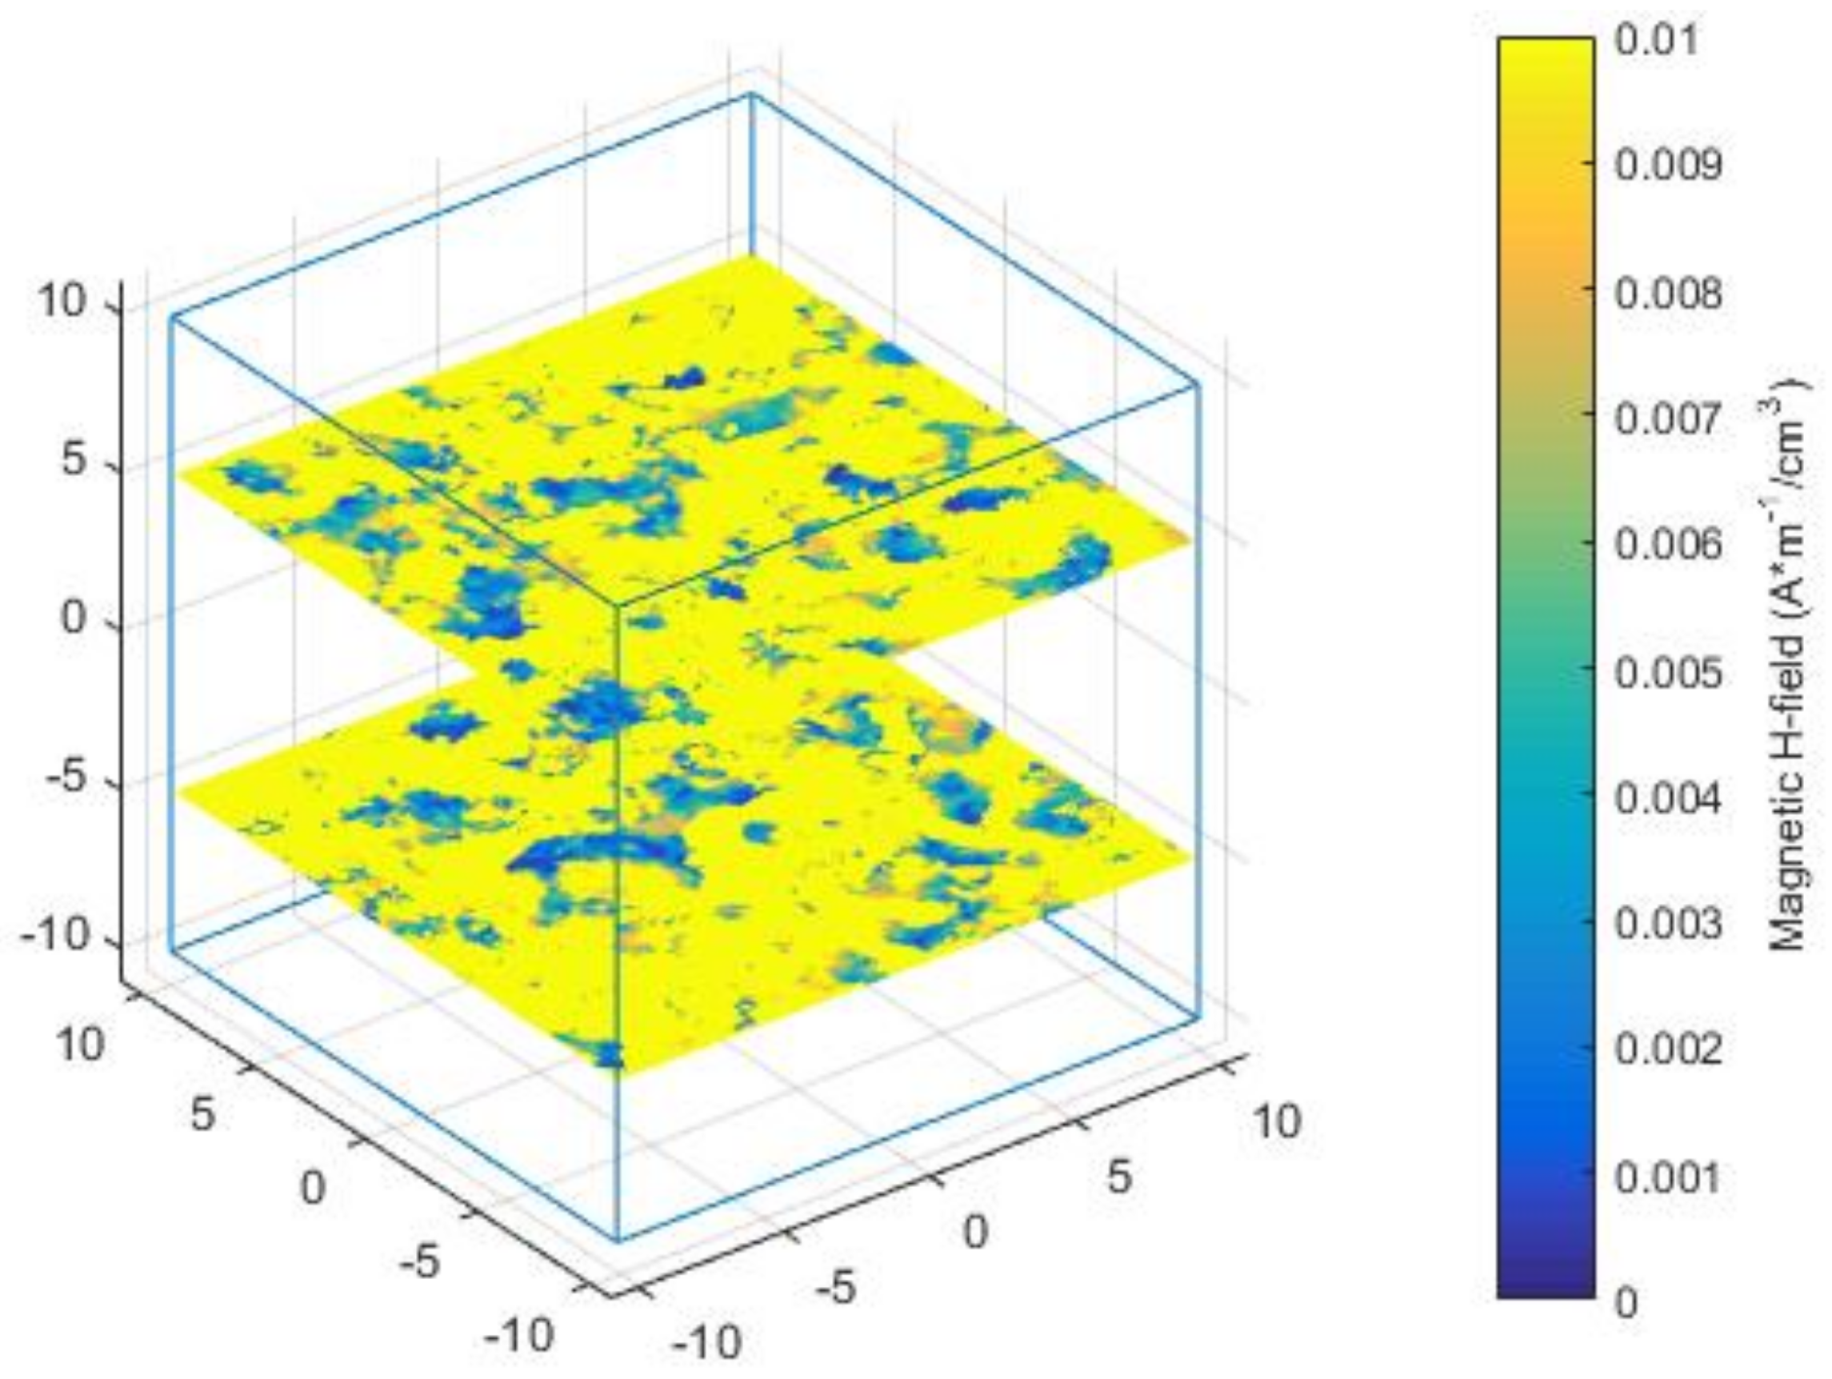
Figure 7.
Chromatogram of the magnetic H-field when the volume fraction of ferrite grains is 50%.
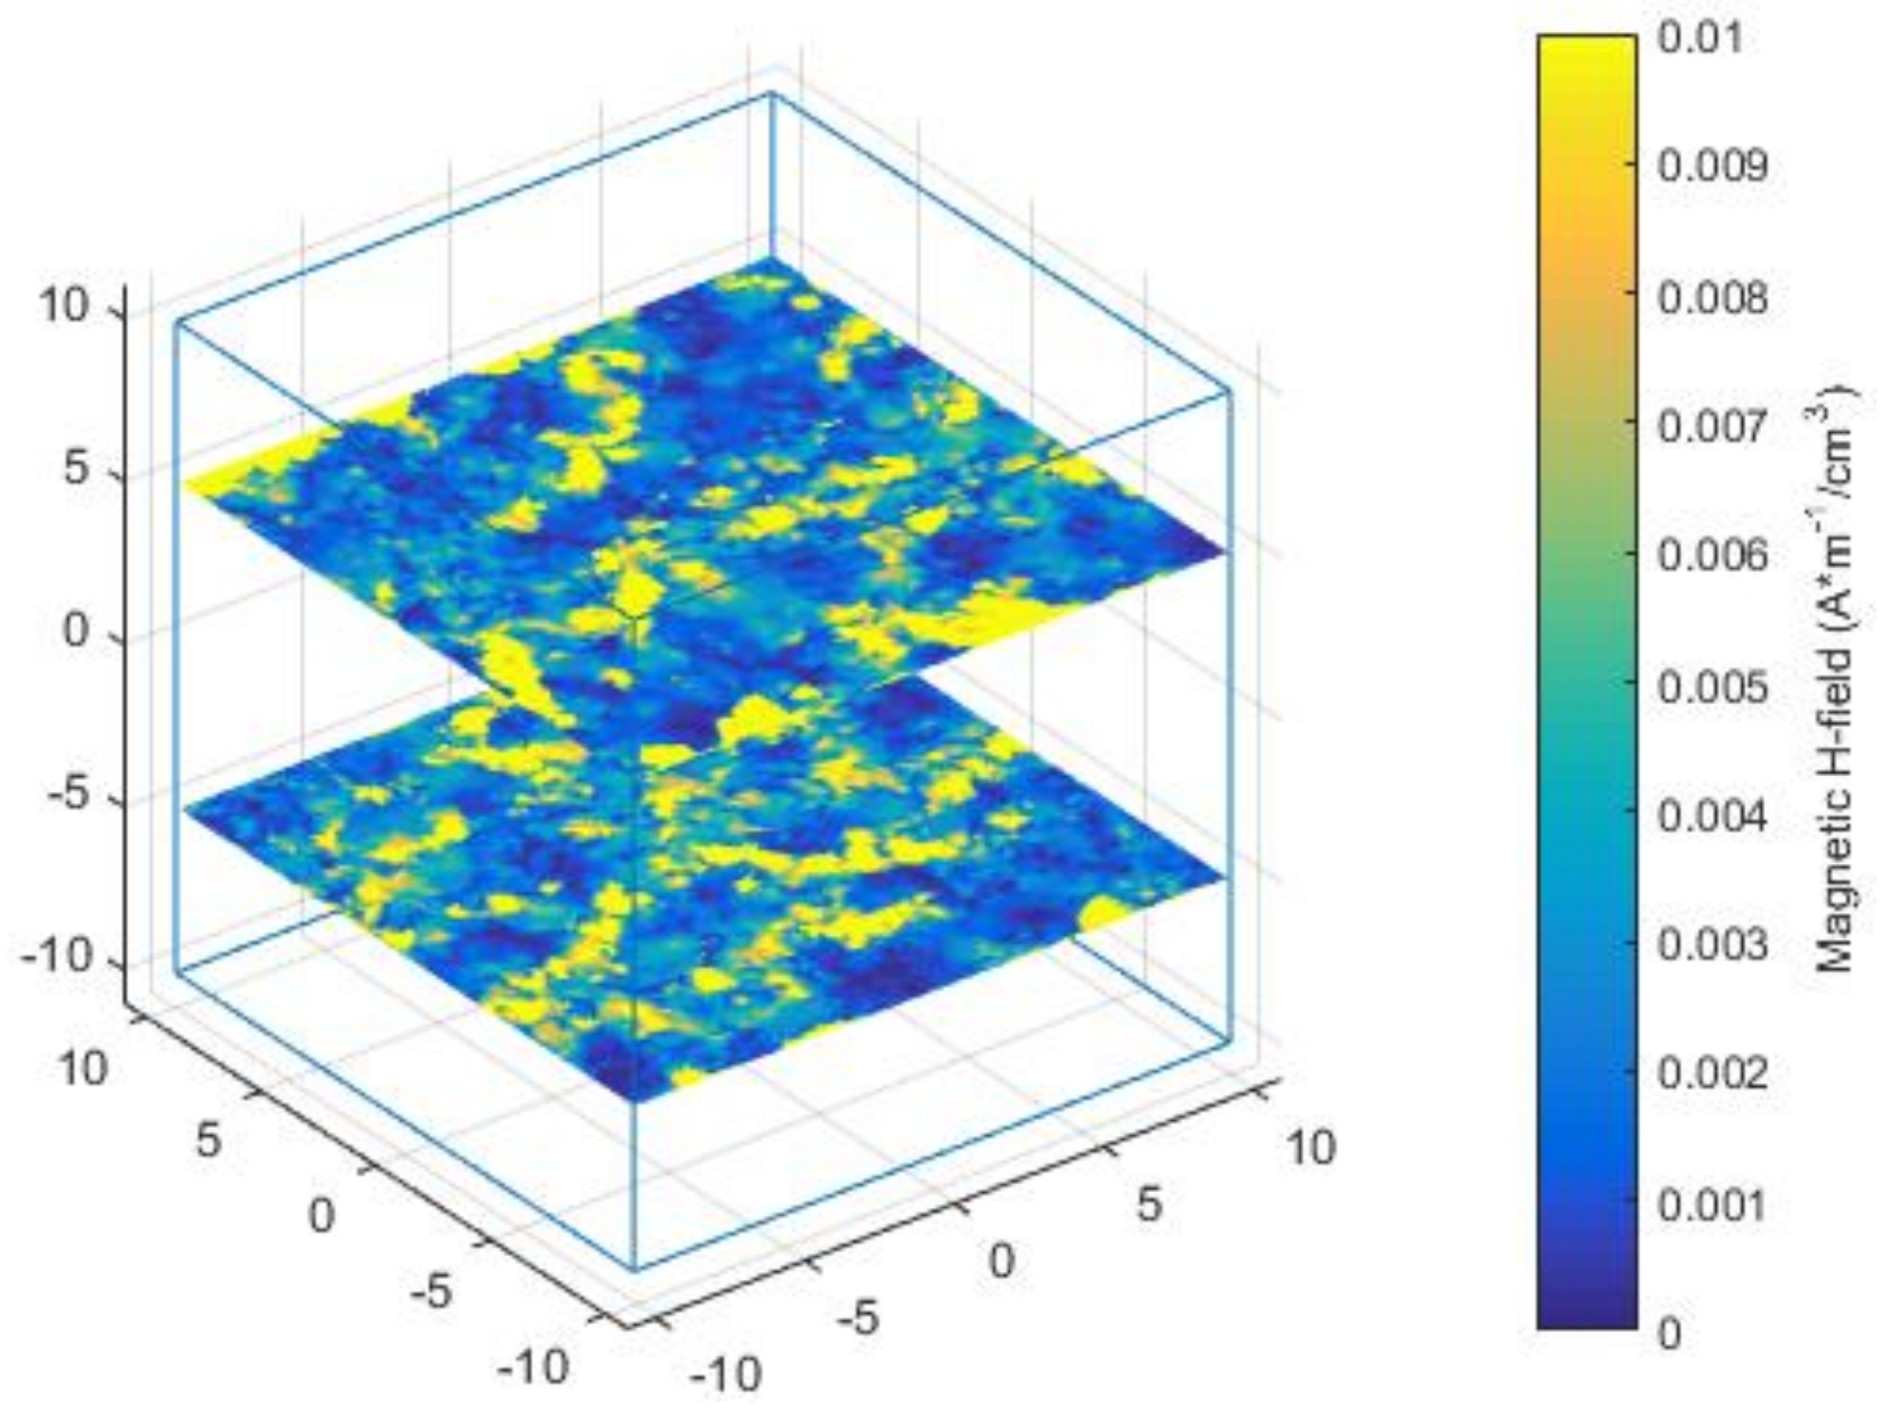
Figure 8.
Chromatogram of the magnetic H-field when the volume fraction of ferrite grains is 70%.
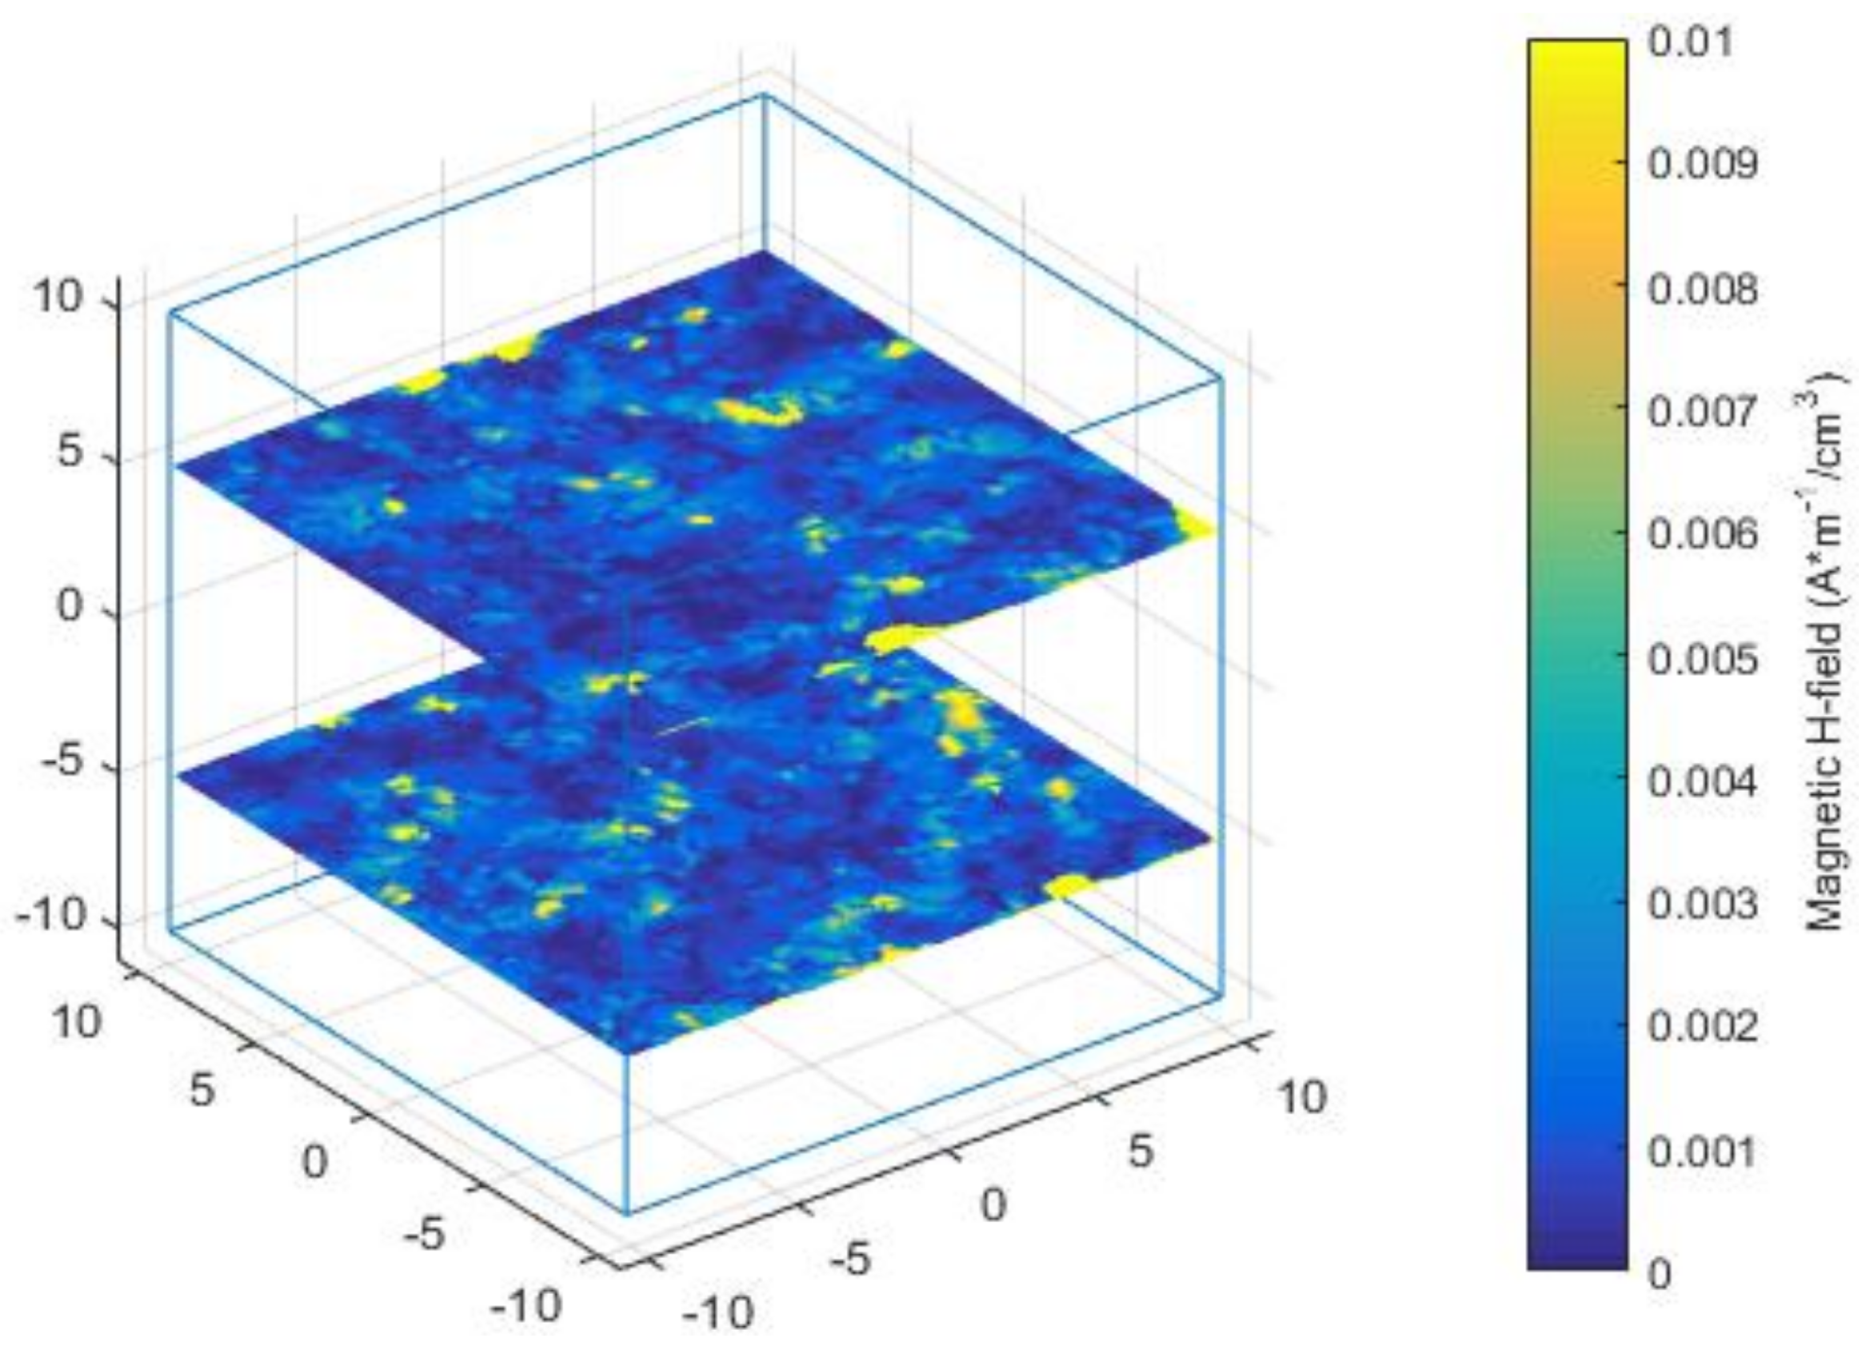
Figure 9.
(a) Measurements and equivalent relative permeability of austenite–ferrite in the RCPS-VM microstructure with varying phase fractions when the model is meshed into 0.19 M, 0.46 M, 0.82 M, and 1.23 M elements. (b) Equivalent relative permeability of austenite–ferrite in 2D and 3D EM models using COMSOL Multiphysics.
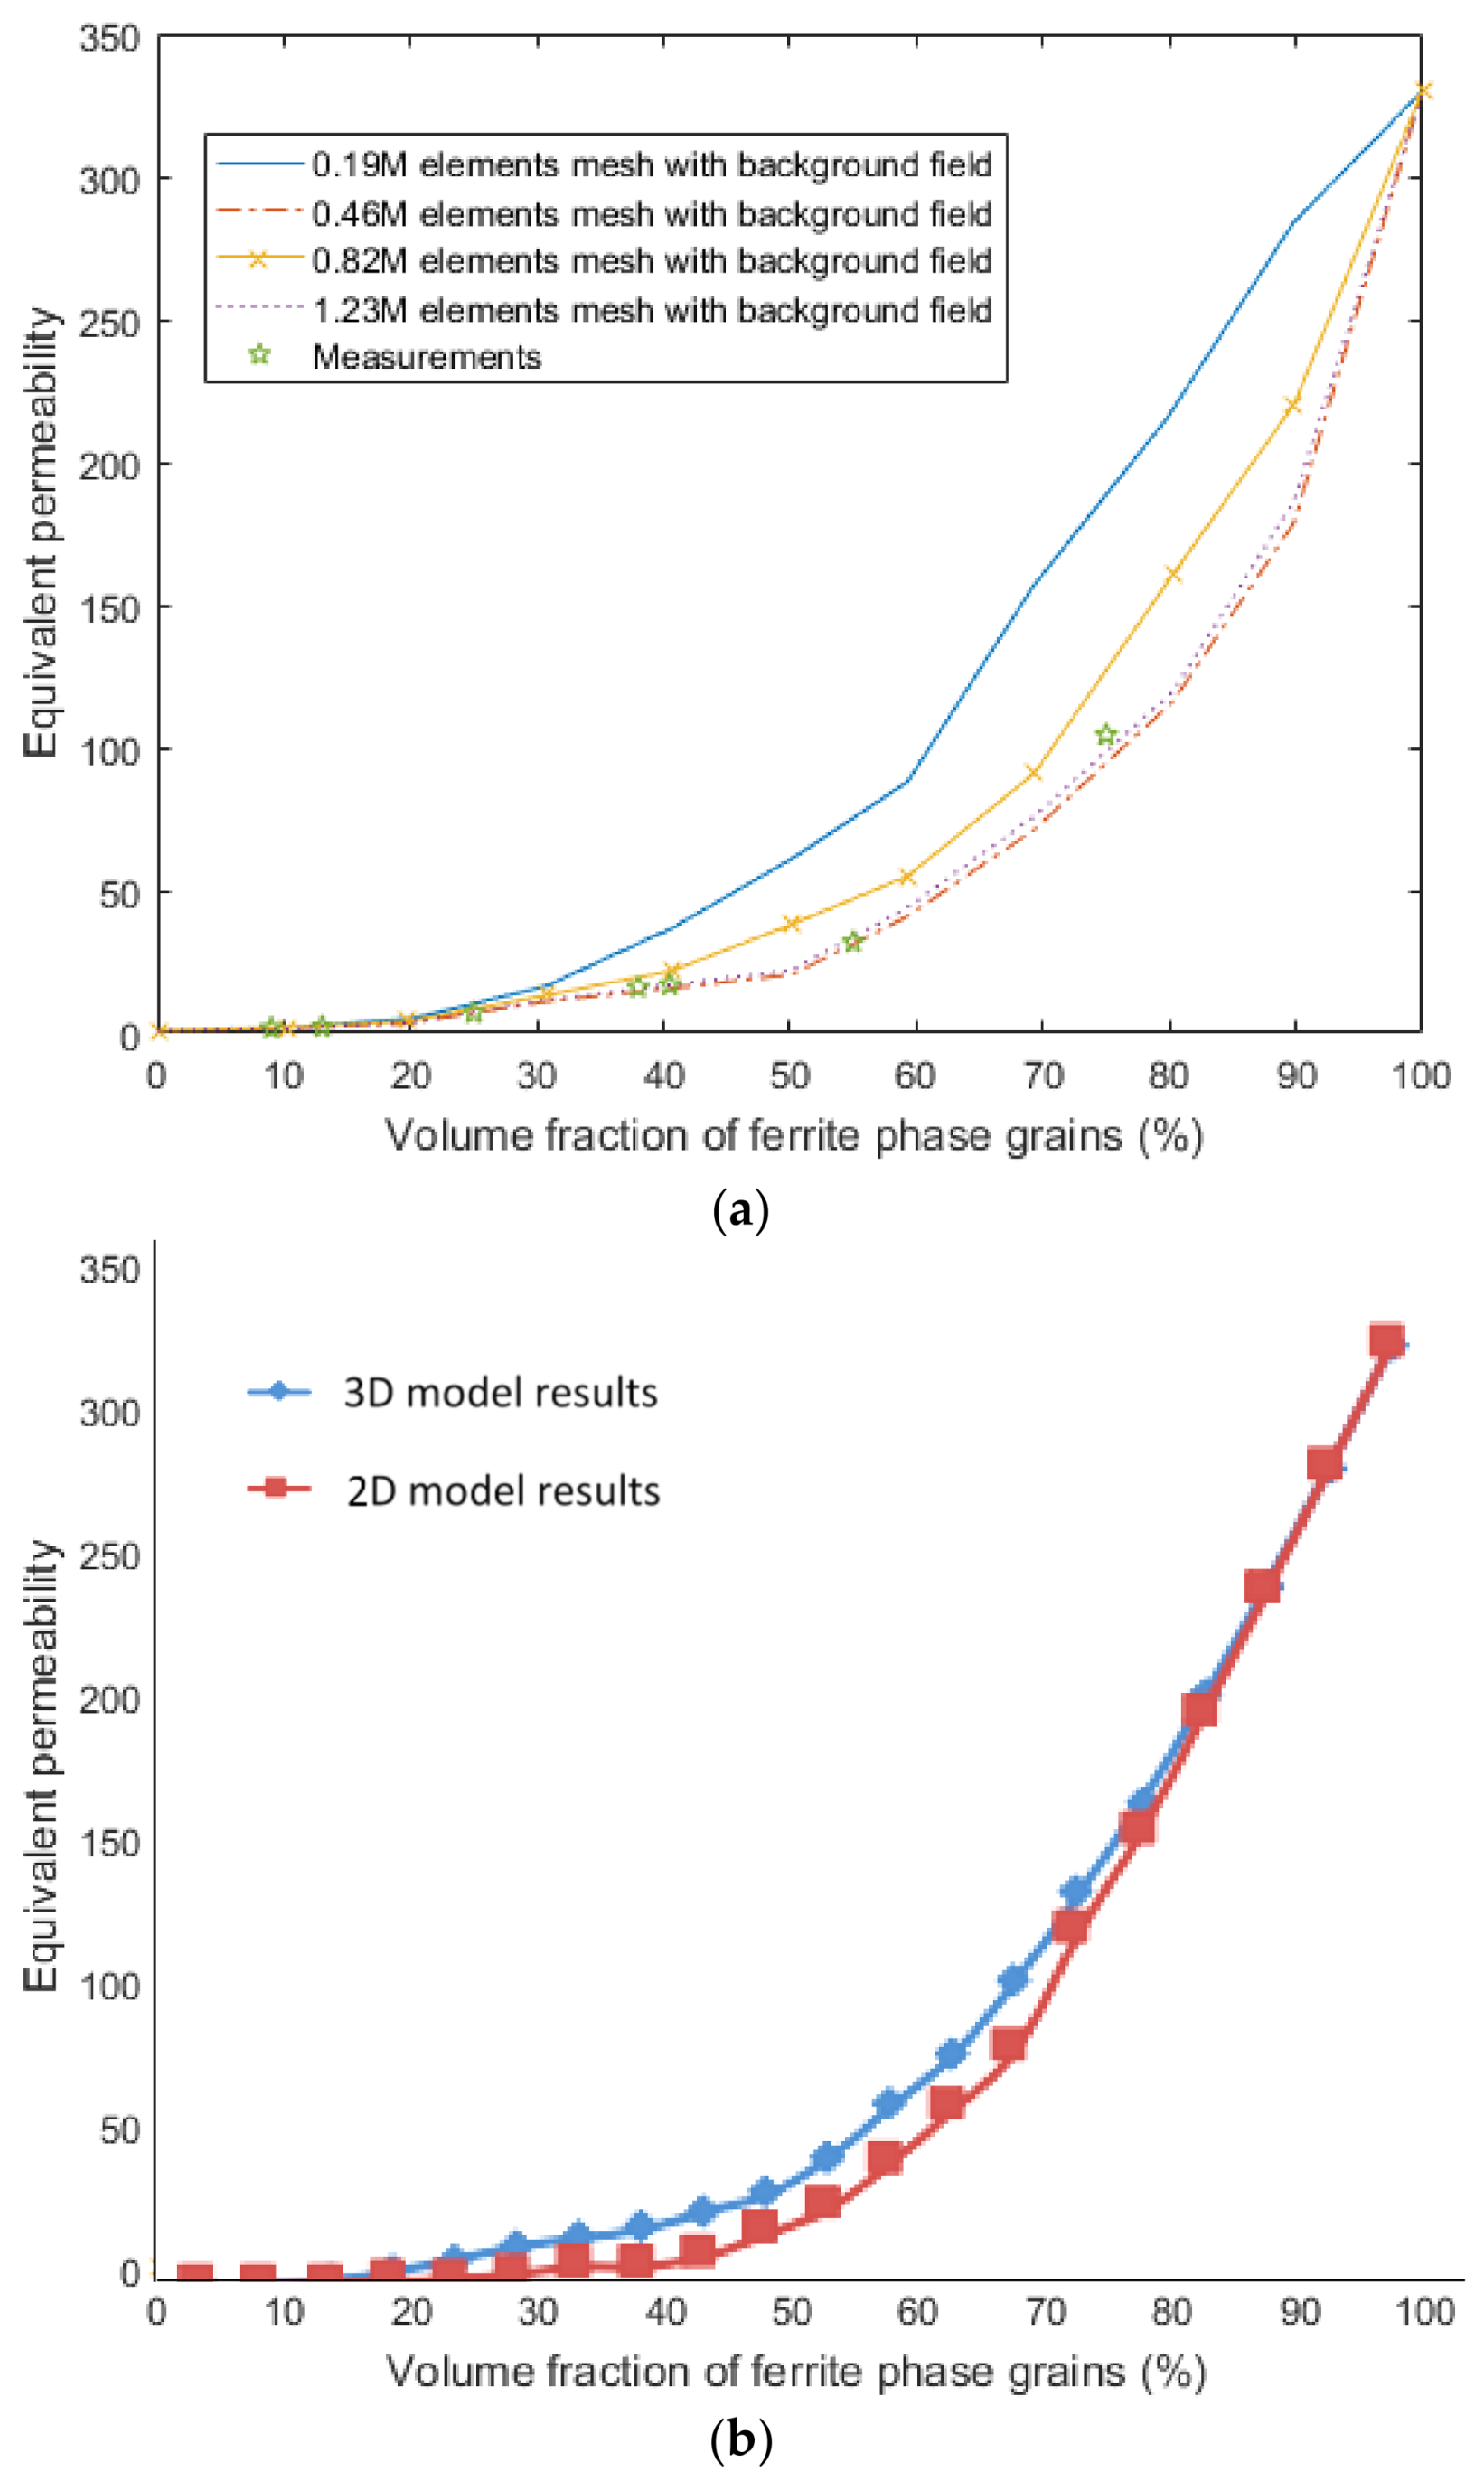
Figure 10.
Equivalent relative permeability of austenite–ferrite in the RCPS-VM microstructure with varying phase fractions when the refined model is excited by different background field tensors.
Figure 10.
Equivalent relative permeability of austenite–ferrite in the RCPS-VM microstructure with varying phase fractions when the refined model is excited by different background field tensors.

Table 1.
Characteristics of each group model.
| Group No. | 1 | 2 | 3 | 4 | 5 |
|---|---|---|---|---|---|
| Volume fraction of ferrite phase spheres | 0.1 | 0.2 | 0.3 | 0.4 | 0.5 |
| Volume fraction of ferrite phase grains | 0.1017 | 0.2019 | 0.3072 | 0.4071 | 0.5018 |
| Mean number of grains | 6425 | 6416 | 6423 | 6411 | 6435 |
| Mean number of ferrite phase grains | 1031 | 1287 | 1958 | 2607 | 3230 |
| Mean volume of grains | 1.2362 | 1.2374 | 1.2362 | 1.2405 | 1.2361 |
© 2018 by the authors. Licensee MDPI, Basel, Switzerland. This article is an open access article distributed under the terms and conditions of the Creative Commons Attribution (CC BY) license (http://creativecommons.org/licenses/by/4.0/).
Share and Cite
MDPI and ACS Style
Zhou, W.; Lu, M.; Chen, Z.; Zhou, L.; Yin, L.; Zhao, Q.; Peyton, A.; Li, Y.; Yin, W. Three-Dimensional Electromagnetic Mixing Models for Dual-Phase Steel Microstructures. Appl. Sci. 2018, 8, 529. https://doi.org/10.3390/app8040529
AMA Style
Zhou W, Lu M, Chen Z, Zhou L, Yin L, Zhao Q, Peyton A, Li Y, Yin W. Three-Dimensional Electromagnetic Mixing Models for Dual-Phase Steel Microstructures. Applied Sciences. 2018; 8(4):529. https://doi.org/10.3390/app8040529
Chicago/Turabian StyleZhou, Weibin, Mingyang Lu, Ziqi Chen, Lei Zhou, Liyuan Yin, Qian Zhao, Anthony Peyton, Yu Li, and Wuliang Yin. 2018. "Three-Dimensional Electromagnetic Mixing Models for Dual-Phase Steel Microstructures" Applied Sciences 8, no. 4: 529. https://doi.org/10.3390/app8040529
Note that from the first issue of 2016, this journal uses article numbers instead of page numbers. See further details here.