Article

Internet of Things for Sensing: A Case Study in the Healthcare System

1
School of International Education, Xidian University, Xi’an 710071, Shaanxi, China
2
School of Electronic Engineering, Xidian University, Xi’an 710071, Shaanxi, China
3
Northwest Women’s and Children’s Hospital, Xi’an 710061, Shaanxi, China
4
School of Computer Science and Technology, University of Bedfordshire, Luton LU1 3JU, UK
5
Electrical Engineering Department, University of Tabuk, Tabuk 71491, Saudi Arabia
6
School of Engineering, University of Glasgow, Glasgow G12 8QQ, UK
*
Author to whom correspondence should be addressed.
Appl. Sci. 2018, 8(4), 508; https://doi.org/10.3390/app8040508
Submission received: 1 December 2017 / Revised: 10 March 2018 / Accepted: 19 March 2018 / Published: 27 March 2018
(This article belongs to the Special Issue Wearable Wireless Devices)

Abstract

:
Medical healthcare is one of the fascinating applications using Internet of Things (IoTs). The pervasive smart environment in IoTs has the potential to monitor various human activities by deploying smart devices. In our pilot study, we look at narcolepsy, a disorder in which individuals lose the ability to regulate their sleep-wake cycle. An imbalance in the brain chemical called orexin makes the sleep pattern irregular. This sleep disorder in patients suffering from narcolepsy results in them experience irrepressible sleep episodes while performing daily routine activities. This study presents a novel method for detecting sleep attacks or sleepiness due to immune system attacks and affecting daily activities measured using the S-band sensing technique. The S-Band sensing technique is channel sensing based on frequency spectrum sensing using the orthogonal frequency division multiplexing transmission at a 2 to 4 GHz frequency range leveraging amplitude and calibrated phase information of different frequencies obtained using wireless devices such as card, and omni-directional antenna. Each human behavior induces a unique channel information (CI) signature contained in amplitude and phase information. By linearly transforming raw phase measurements into calibrated phase information, we ascertain phase coherence. Classification and validation of various human activities such as walking, sitting on a chair, push-ups, and narcolepsy sleep episodes are done using support vector machine, K-nearest neighbor, and random forest algorithms. The measurement and evaluation were carried out several times with classification values of accuracy, precision, recall, specificity, Kappa, and F-measure of more than 90% that were achieved when delineating sleep attacks.

1. Introduction

The Internet of Things (IoT) is a concept reflecting a connected set of anyone, anything, anytime, anyplace, any service, and any network [1]. The Internet of Thing is a discussion and trend that has been going on in the tech industry for a while. There are two big things to note about IoTs; first, the average individual does not leverage it greatly. Second, IoTs takes analog ideas or devices, such as sensors, actuators, home appliances etc., and connects them through inter-networking [2].
IoTs provides appropriate solutions for a wide range of applications such as smart cities, traffic congestion, waste management, structural health, security, emergency services, logistics, retails, industrial control, and health care [1].
Medical healthcare is one of the fascinating applications for IoTs. The pervasive smart environment leveraging IoTs has a potential to monitor various human’s activities by the deployment of smart devices. Recently, in the medical healthcare domain, the research focus has moved toward human activity recognition. Daily routine activities have a prospect to be monitored and supported by IoTs. Patient’s activity detection is a vital issue for caregivers with adequate information about the subject can be documented in healthcare systems. Activity recognition enables nurses or caretakers to provide timely assistance. For instance, in a pervasive environment, a caregiver can monitor activity using devices such as a computer or mobile phone to provide instant care for subject in risky situations [3]. For these reasons, we seek to incorporate small wireless devices used in S-band sensing technique to monitor the sleep attacks of patients suffering from narcolepsy disease (ND).
Narcolepsy is a neurological disorder in which individuals lose the ability to regulate their sleep–wake cycle. The normal cycle between sleeping and being awake is blurred, leading to sleeping excessively during the day [4]. It is an impairment with symptoms such as acute drowsiness and falling asleep without any prior warning. Loss of orexin neurons in the brain is attributed to the disruption of transitions between sleep–wake states [5]. People suffering from narcolepsy disorder have fewer excitatory neurons, and each neuron carries less of the neuropeptides orexin A and orexin B [6]. These orexins increase the activity of wake-promoting regions of the brain, thereby tipping the scales in favor of wakefulness and preventing inappropriate transitions into a sleeping state. ND primarily damages the neurons delivering orexin, and therefore less orexin is sent out and sleep-related symptoms start to intrude into wakefulness. ND can be triggered by activities such as walking, exercise, etc. or sudden, strong emotions like anger or excitement [7]. Narcolepsy sleep episodes typically last up to few minutes.
In a nutshell, patients suffering from narcolepsy fall asleep involuntary while doing daily activities. Continuous monitoring of ND patients, for targeted treatment—particularly the elderly—is of the utmost importance to avoid the risk of injury or to shed light on its triggers [5]. Thus, to monitor the daily routine activities of ND patients, we use the S-Band sensing technique leveraging wireless devices such as card, omni-directional antenna, etc. Each human activity generates a particular wireless channel information imprint in terms of variances of amplitude and phase information that is used to detect various human activities for sleep attack experiences by ND patients. The amplitude and phase information obtained are classified using support vector machine (SVM), K-nearest neighbor (KNN), and random forest (RF) for identifying sleep attacks.

2. Related Work

Human activity recognition for various applications has attracted much attention from researchers around the world. Applications include fall detection [8], activity detection for energy saving at homes or offices [9], 24-hour sleep-wake monitoring in narcolepsy [10], a detection system for motion disorders in Autism patients [11], and other uses leveraging IoTs [12,13,14,15,16,17,18]. The methods introduced in [13,14] leverage body sensor nodes powered by human energy harvesting and wireless sensor networks for remote patient monitoring. Cretikos et al. [19], Pantelopoulos et al. [20], and Coronato et al. [14] introduced systems for monitoring vital signs in medical problems. Many chronic diseases as in [20,21] can be forecasted and prevented using activity recognition. However, recording such information in a timely manner is a daunting task. Several methods have been proposed both in academia and in the industry for healthcare informatics and can be categorized as non-invasive sensors [22,23,24], and invasive sensors [25,26,27]. Currently, invasive sensors are a rich source of information as far as healthcare is concerned. However, some invasive sensors are uncomfortable and not suitable for everyone since patients suffering from Parkinson’s disease, narcolepsy, skin diseases, and infants are not encouraged for wearing such sensors [22] or to be deployed on their bodies. Qi et al. [27] propose RadioSense, a prototype system of ZigBee radio-based activity sensing leveraging Institute of Electrical and Electronics Engineers (IEEE) 802.15.4 specifications. Thus, the non-invasive sensors might be the only solution for patients with the aforementioned diseases. Various technologies have successfully demonstrated the efficacy of non-invasive sensors. Kaushik et al. [28] proposed a non-invasive system leveraging a pyroelectric infra-red detector. Zhou et al. [29] developed video-based system detecting various activities with good classification accuracy but raised privacy concerns. Tsutsui [23] utilized ultrasound echo to detect different human movements, but the system provided poor coverage range. Li et al. [30] used Doppler radar for fall detection and gait analysis with adequate performance. Zhang et al. [31] exploited an ultra-wide-band (UWB) radar system for vital signs monitoring. However, the aforementioned technique leveraging radar faces limitations such as infrastructure deployment, spectrum licensing, and the fact that it requires specialized hardware. This paper presents a novel method leveraging the S-Band sensing technique using IEEE 802.11 specifications operating at 2.4 GHz exploiting wireless devices such as a card, antennas, etc.

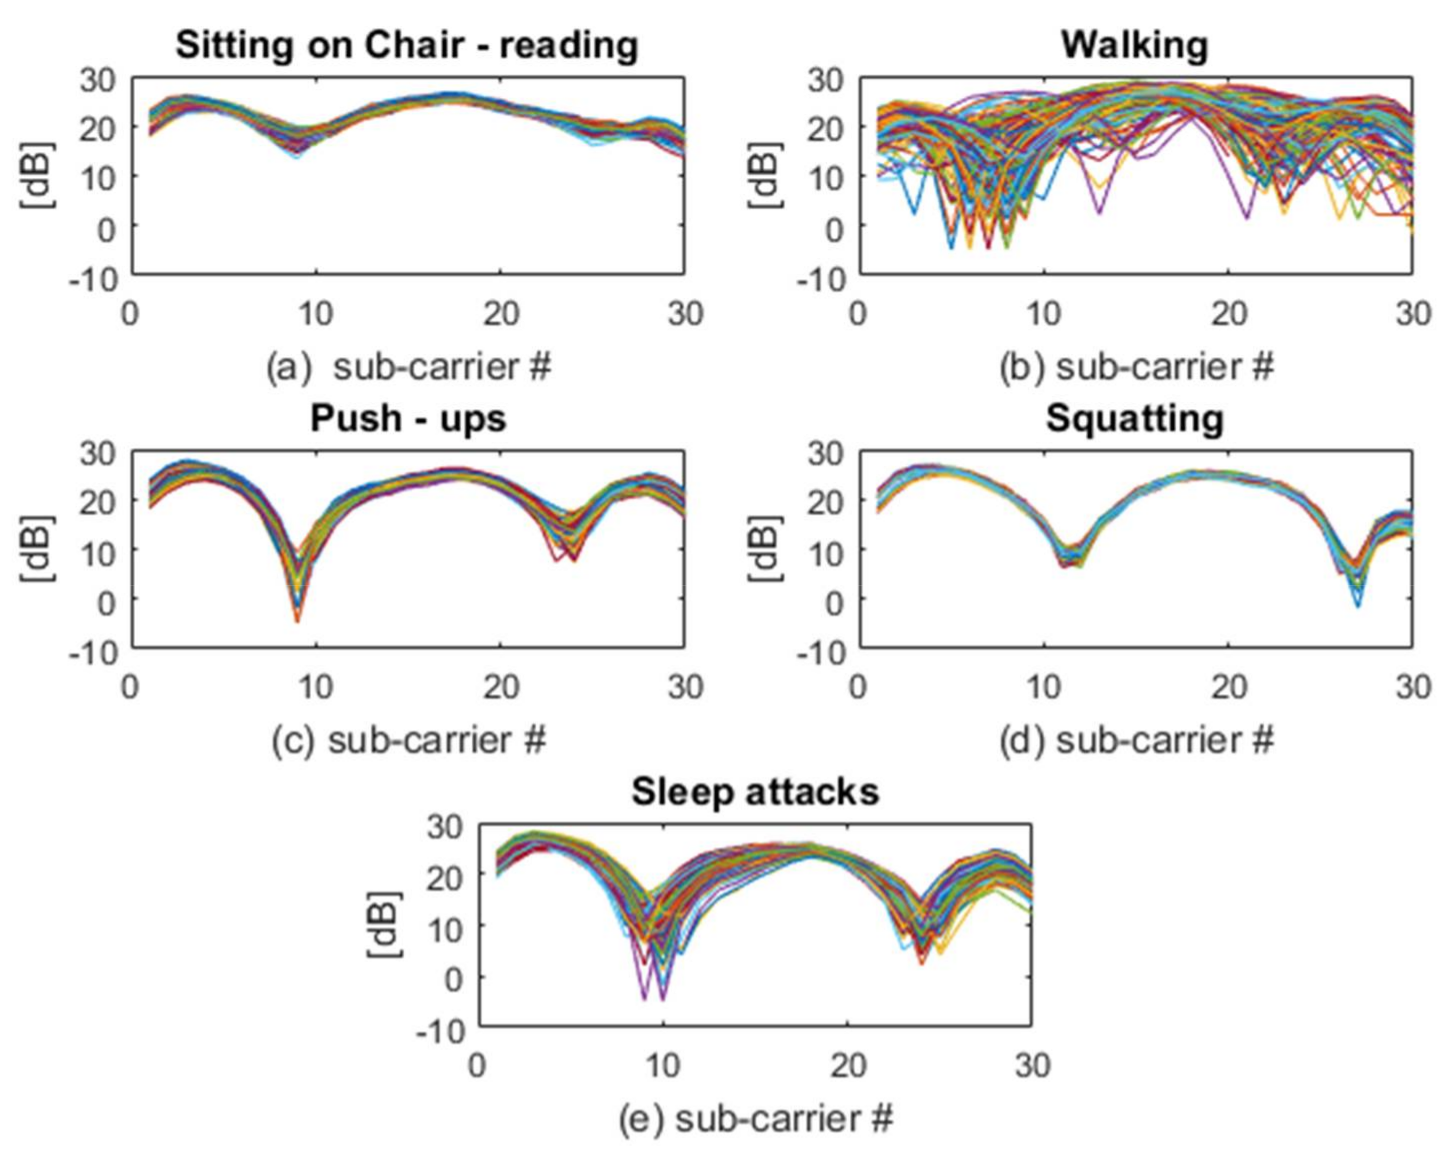
3. S-Band Sensing and Data Processing
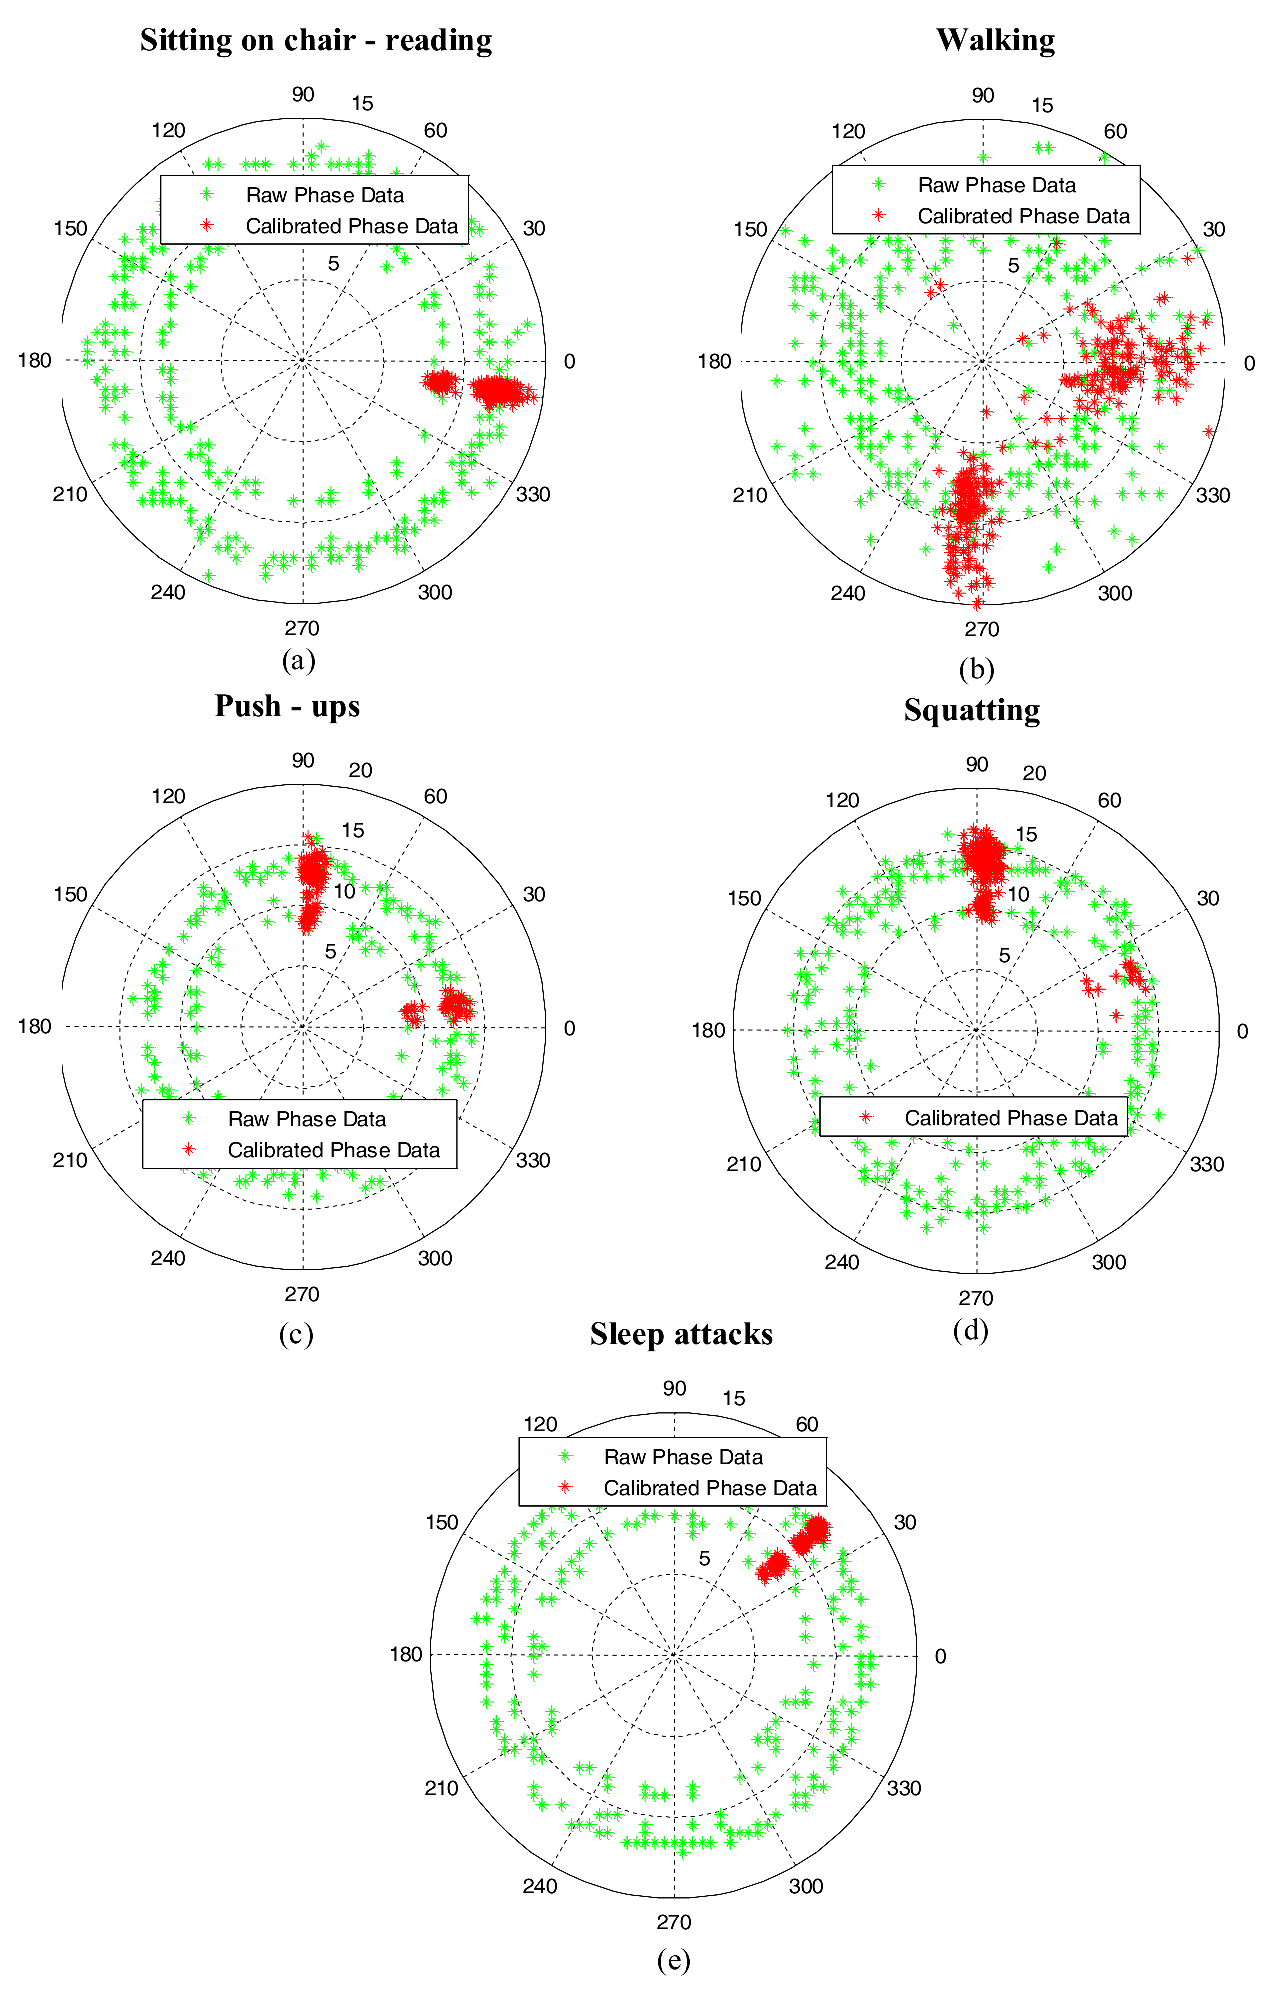
The proposed method uses the S-Band sensing technique for tracking human activities. The S-Band sensing technique exploits wireless channel information to obtain signals by use of wireless devices such as an omni-directional antenna as a receiver, and a card that is connected to the receiving antenna.
The S-Band sensing technique is channel sensing based on frequency spectrum sensing using the orthogonal frequency division multiplexing transmission at 2 to 4 GHz frequency range. The transceiver has higher efficiency because it uses frequencies that are orthogonal increasing the robustness. The orthogonal frequency division multiplexing is composed of 64 frequencies spaced 312.5 KHz apart [32]. The spacing is selected because of the FFT sampling size. The IEEE 802.11n uses 52 frequencies for data, eight as null frequencies, and four as pilot carriers over a channel. The card primarily reports 30 different frequencies for data processing and form one channel information (CI) packet. The main advantage of obtaining multiple frequencies is that any one or more than one frequencies can be used for analysis.
The wireless channel parameters such as carrier frequency, bandwidth, delay spread, and Doppler spread are extremely sensitive to variations in the spatial domain, causing multipath fading. We thus use such CI data that are affected by multipath reflections generated by human motion in a room or free space with a transmitting–receiving antenna. To discern the signals amplitude and phase information unique to motion, we need a second level of processing. The variances of amplitude and phase information for activity recognition generated by motion have to be looked at for uniqueness in their CI signatures.
The method we present efficiently detects various human activities such as walking, squatting, sitting on chair, pushups, and narcolepsy sleep attacks using the S-band sensing technique, which can be reported in a human understandable format. The raw phase information retrieved via the network interface card is extremely random and inapplicable for the detection of sleep episodes. Hence, the proposed design fully exploits both amplitude and calibrated phase information by applying a linear transformation on the raw phase data discussed in the subsequent section. Furthermore, SVM, KNN, and RF classifiers are used to segregate human activities and detect sleep episodes. The performance metrics such as accuracy, precision, recall, specificity, Kappa, and F-measure were used to evaluate the three classifiers.
An RF signal is received from a transmitter through multiple paths in an indoor environment when the transceiver pair is connected via network interface card. The received signal can be expressed as
Y j = X j ×    W C I j + N ,
Here, Y and X denote the received and transmitted signals, respectively, for jth frequency. The CI data is the wireless channel information; that carries the channel frequency response (CFR) and N is the random noise. The raw CI data can be denoted as follows:
W C I j = | | W C I j | | e j W C I j ,
where | | W C I j | | represents the amplitude information and W C I j is the phase data for all j = [1, 30]. A packet or channel matrix specifies the amplitude and phase information measured for a certain period of time. The wireless channel information over a time period for a particular frequency can be expressed as
W C I t i m e _ h i s t o r y = W C I j 1 + W C I j 2 + W C I j 3 W C I j z ,
Here, j is the particular frequency number and z is the total number of CI packets received.

Phase Calibration

The phase data extracted from wireless CI stream is largely random and inapplicable for detecting Narcolepsy sleep episodes due to the presence of random noise and phase offset between transceiver pair. Thus, to mitigate the impact of random noise from the CI phase data and remove the phase offset, we use linear transformation on raw phase data.
Let W C I j represent the measured wireless CI phase data for jth frequency.
W C I j = W C I j + 2 π k j Z τ + β + N ,
Here, W C I is the true phase data, N is the random noise, τ is the unsynchronized timing between transceiver, and β is the unknown phase offset. The frequency indices k j for j = [1, 30] and FFT size Z can be obtained from IEEE 802.11n specifications [33]. The unknown terms τ and β listed above make it infeasible to obtain useful phase information solely from S-band sensing technique. Thus, to remove the unknown terms, we apply a linear transformation to the raw CI phase data across the frequency bands [34].
Let the two terms L and M represent the slope of the CI phase and phase offset considering overall frequency bandwidth, respectively.
L = W C I 30 W C I 1 k 30 k 1 .
M = 1 30 i = 1 30 W C I j .
By subtracting the linear term L k j + M from raw CI phase data, we get the calibrated phase information W C I j [10], denoted as
W C I j = W C I j L k j M .

4. Data Classification

Data classification is the process of categorizing data sets into different forms, types or any other distinct class. There exist several data classification techniques such as K-nearest neighbor (KNN) [35], neural networks (NN) [36], Random Forest (RF) [37], and support vector machine. In this paper, we have compared several data classification techniques such as the support vector machine, KNN, and RF algorithm.

4.1. Support Vector Machine for Data Classification

The advantage of using the SVM algorithm is that it provides efficient performance when it comes to practical problems [38,39]. Also, the inner-product kernel functions of SVM solve the linearly non-separable problems in higher dimension space.
The support vector machine is applied to classify subject’s various activities such as walking, squatting, push-ups, sitting on a chair, and sleep episodes due to ND. The SVM is applied to the measured CFR data received using the S-band sense. SVM is a binary classifier developed for non-linear boundary problems [40]. A hyper-plane is used as a decision boundary to classify the two datasets. The closest data points to the hyper-plane, which impart construction of the hyper-plane, are called support vectors [41]. The optimum hyper-plane can be written as follows:
w T x + c = 0 ,
here w denotes the weight vector, x is the input vector and c is the bias. Support vectors representing each class are expressed as
w T x + c = 1 ,   for   ;   corresponds   to   class   A
w T x + c = 1 ,   for   y i = 1 ;   corresponds   to   class   B
The optimum hyper-plane for training sample data is expressed as
min ϕ ( w ) = w T w 2 ,   for   y i ( w T x i + c ) 1
where i = 1, 2, 3, …, n. The inner product kernel functions used in this paper are shown in Table 1.
Since we need to differentiate the ND sleep episodes from other four human activities, we adopt a one-versus-rest approach using SVM. The CFR data comprising amplitude information for the individual frequency and calibrated phase information is discussed in Section 3. Data obtained using S-band sensing techniques were processed to extract features for classifying various human activities accurately. The feature selection technique is important to reduce the number of operations and to represent the key changes against the amplitude or phase.
Various human activities can be classified using time-domain analysis, frequency-domain analysis, and time-frequency domain analysis [39]. The time-domain features can be easily extracted since they are the simplest ones, as compared to the frequency-domain and time-frequency domain features. In time-domain approaches, the time-domain waveform is analyzed directly to extract statistical indices such as the root-mean-square amplitude, skewness, and kurtosis [31]. Frequency-domain approaches are usually employed to find the characteristic frequencies via frequency analysis, such as the Fourier spectrum, cepstrum analysis, and the envelope spectrum [42]. This approach is also simple and characterizes an intuitive nature by allotting the components to their corresponding frequency in a particular spectrum. Time-frequency domain approaches including wavelet analysis, the fast Fourier transform (FFT), Wigner–Ville distribution, and Hilbert–Huang transform, etc., investigate waveform signals in both the time and frequency domain and can provide more information about the data classification [43,44]. However, this approach is essentially more complicated than the frequency-domain or time-domain approaches in a practical scenario. In this study, we use 10 time-domain statistical features as listed in Table 2. Here, xi denotes a particular frequency of choice while x denotes the signal of every frequency.

4.2. K-Nearest Neighbor Algorithm

K-Nearest Neighbor (KNN) is a simple data classification method that takes k number of nearest training samples in the feature space. KNN algorithm works on a dataset that is classified by its neighbors based on majority vote. The dataset is assigned to a particular class that is common in the k nearest neighbor defined by the distance function. For example, when k = 1, the dataset is assigned to the nearest neighbor class. There are three main distance functions used in KNN algorithm considering continuous variables.
M a n h a t t a n = i = 3 k | x i y i |
M i n k o w s k i = ( i = 1 k | x i y i | q ) 1 / q
E u c l i d e a n = i = 1 k ( x i y i ) 2
H a m m i n g   D i s t a n c e = D H = i = 1 k | x i y i |
In a case where categorical variables exist, Hamming distance as in Equation (13) should be used. When there is a combination of numerical values and categorical variables in a given dataset, the issue of standardization arises as the numerical variables are between 0 and 1. The optimum value for k is chosen by thorough inspection of the given datasets. Generally, when the value of k is large, the overall noise is reduced. Cross validation or rotation estimation is another method to identify the optimal value for k.

4.3. Random Forest Algorithm

Random forest algorithm is another power machine learning algorithm that is capable of performing classification tasks. RF algorithm is combination of different but simple predictors that can decrease the computational cost and obtain better performance [45]. Employing the regression tree as the learning algorithm of sub-models, the random forest is a modified version of Bagging [45]. In random forest algorithm, the random selection features grow a tree on the new training datasets at every node to identify the split. The RF algorithm reduces the complexity in following ways: the parallel computing procedure in combination with parallel ensemble, and the introduction of the sub-model at each sample subset with no communication from the CPU [45]. The construction of the sub-models built on the subsets dramatically decreases the training samples. The bootstrap replications, such as sample subsets, are simple and maintain very low complexity. Also, the learning algorithm of the sub-models is considered to be the regression tree.

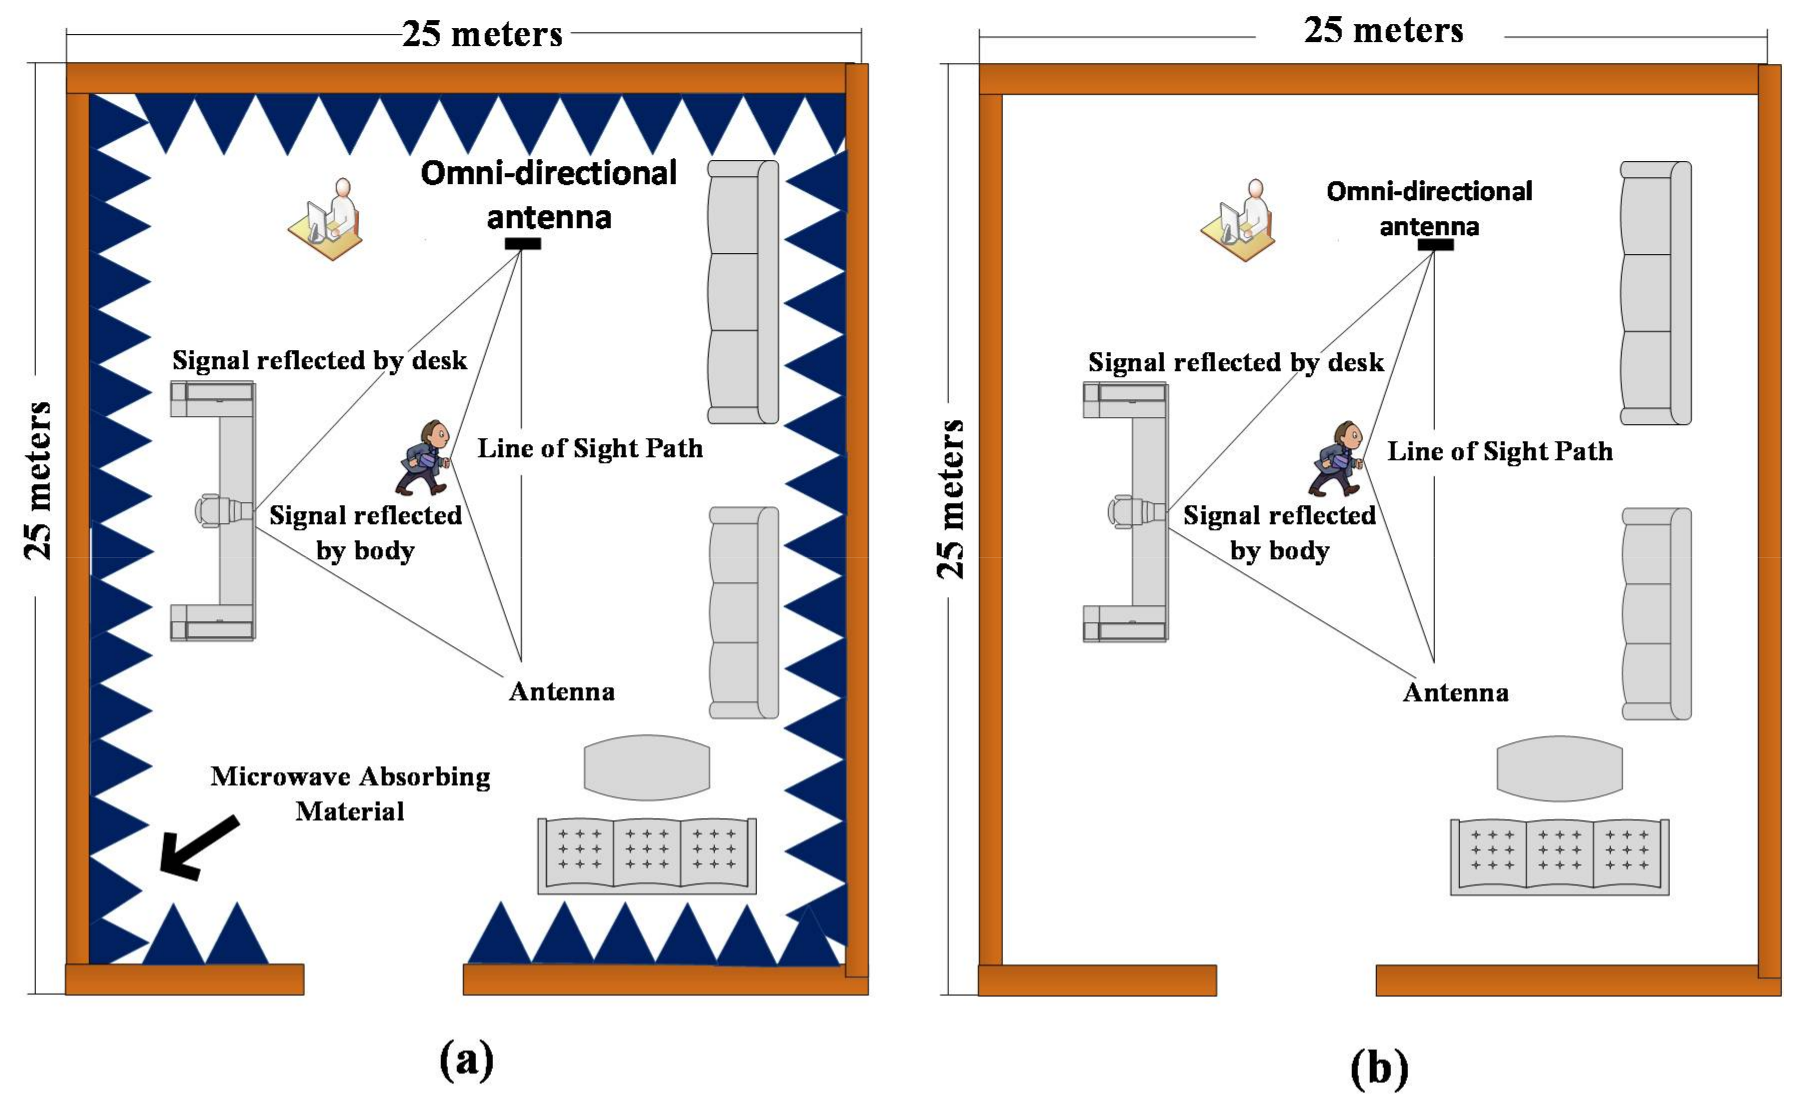
5. Experimental Setup

We implemented the experiment in a large room (25 m × 25 m) as shown in Figure 1. The experiment had two parts. In the first part, microwave-absorbing materials were deployed along the walls. Three tables, three chairs, and two persons at one time, one taking the measurements and a subject, were present inside the room, as shown in Figure 1a. The main reason for using microwave-absorbing material was to reduce multipath reflections that could affect the experimental results. In the second part, as indicated in Figure 1b, the experimental design was the same, but the microwave-absorbing material was removed, and it was observed that the percentage accuracy (described in Table 3) slightly decreased due to multipath propagation. S band antenna was deployed as a transmitter, and an omni-directional antenna served as a receiving antenna. The transmitter and receiver were placed 15 m apart at a 1-m height. The receiving antenna worked as the detection point. A channel information collection tool introduced by Harpin [33] was installed in the host computer would constantly receive 20 wireless CI packets per second. In order to differentiate the ND episodes from other daily activities, we tested five body motions: walking, squatting, push-ups, sitting on chair, and subject falling asleep due to narcolepsy. Each body motion disturbed the wireless medium; as a result, a unique CI signature was recorded, indicating a particular human activity. The experiments were performed for 16 ND patients.

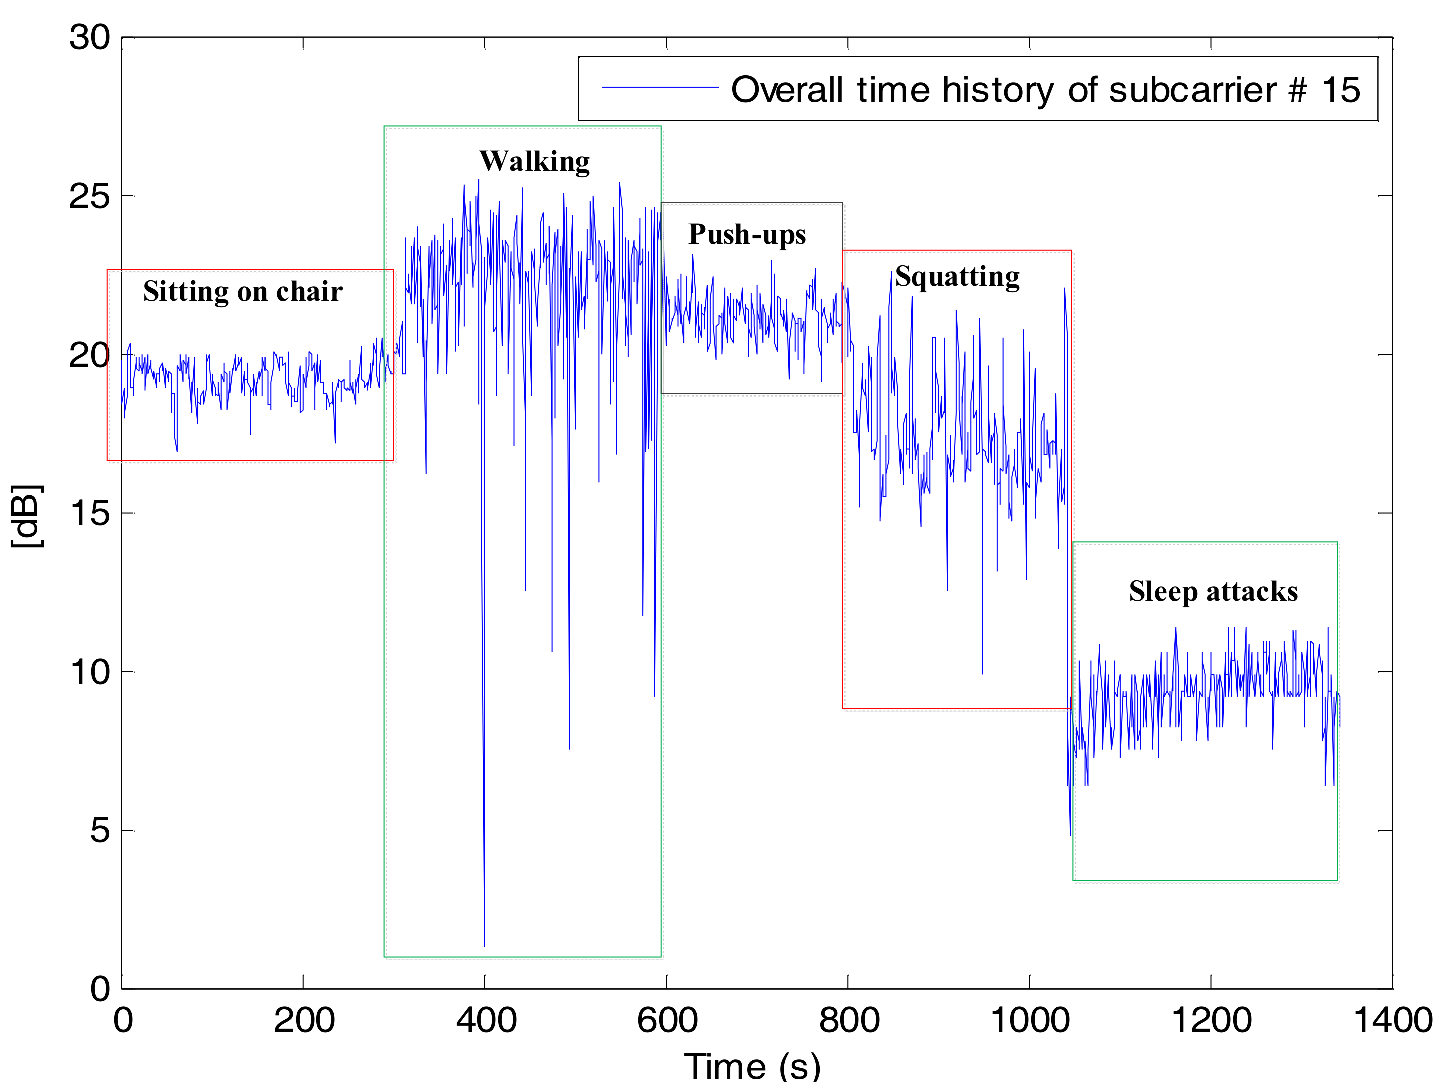
6. Results and Discussion

This section describes the simulation results obtained during the experiment. Firstly, we examine the CFR obtained for five human activities such as sitting on a chair, walking around the room, push-ups, squatting, and sleep episodes due to ND, as shown in Figure 2.
Figure 2 describes the CFR data for various human activities, transitioning from one activity to another over a period of time. We analyze each human activity that has induced a particular CFR pattern. For example, when the subject was sitting on a chair, the corresponding amplitude information against 30 frequencies is almost stationary, as evident in Figure 2a, but as the person started walking, the wireless medium constantly got disturbed, and as a result, the CFR data also changed, as in Figure 2b. On the other hand, slight variances in amplitude information against the 30 frequencies can be observed in Figure 2c when the subject was performing push-ups on the ground. Figure 2e describes the results of squatting. When the person experienced sleep episodes, due to which no large-scale movement was observed within wireless range, the amplitude information remained stationary. To further validate our point, we looked into the CI signatures generated by various activities considering the calibrated phase information and analyzed the data shown in Figure 3.
Analyzing the calibrated phase information for corresponding human activities, we can clearly see that each human behavior has generated a particular registration as far as calibrated phase is concerned. A cluster of stationary data can be seen in Figure 3a that indicate sitting. Looking at activities such as motion or sitting, we are able to differentiate them with raw data and also with an SVM. Unlike a sitting posture, significant variances in the calibrated CI phase information can be seen in Figure 3b when a person starts walking within the area of interest. When the subject makes the transition to push-ups, two chunks of data can be seen in Figure 3c. Similarly, the phase information changes when the person is squatting. Finally, Figure 3e shows the stationary data when a person experienced sleepiness. In order to discuss the time history of narcolepsy sleep attacks, we analyze the acquired signal, as seen in Figure 4.
Figure 4 shows that 1400 packets in total were received for 1400 s when the experiment was being performed. A frequency # 15 was selected for amplitude-vs.-time history analysis as in [44]. We can see that the amplitude levels for sleep episodes fluctuate between 5 dB to 10 dB from 1150 s to 1350 s are clearly different from the other four activities. However, the power levels for walking and push-ups remain the same for a certain period of time. Similarly, there are moments where the power level of push-ups, walking and sitting activity are similar. Thus, to classify the different human activities and detect the ND sleep episodes accurately, we use the support vector machine.

6.1. Classification Results

6.1.1. Results Obtained Using SVM

As discusses in an earlier section, the proposed method utilizes two parameters for evaluation: the variances of amplitude information and calibrated phase information when the subject performs various activities. We adopted the one-versus-rest approach and trained the SVM classifier using built-in function in MATLAB called “svmtrain” and obtained the optimal decision boundary by utilizing the sequential minimal optimization solver. In order to train the SVM, 40, 80, and 120 samples from each class were used separately. The 10 SVM features extracted from training data are indicated in Table 2. Each one of them describes the measurement per CI packet distinctively. The results in this particular table indicate the percentage accuracy, which is one of the six performance metrics used in this paper. We have explored the remaining metrics along with accuracy in a later part of this paper. The data classification results using the SVM algorithm are described in Table 3 using microwave absorbing material and without using microwave absorbing material, respectively. The first column in Table 3 indicates the type of SVM kernel function used for training data set, and the second column denotes the training samples (40, 80 and 120). The remaining five columns a, b, c, d, e representing the sitting, walking, push-ups, squatting, and sleep attacks describes the percentage accuracy. The results indicate that when the linear kernel function was used to differentiate the five human activities from 40 training samples, the percentage accuracy is 98.75% for sitting, 78.25% for walking, 98.25 for push-ups, and 65% for sleep attacks. Similarly, the accuracy rate is around 65% for sleep attacks using linear kernel function when 80 and 120 training samples were considered, as shown in Table 3. An increase in the training dataset marginally improved the accuracy rate for sleep attacks but remained around 65%. However, the percentage accuracy greatly improved when the ten SVM features were considered using linear kernel function. The accuracy is between 75.25% and 98.5% for 40 training samples, 78.2% to 98.75% for 80 training samples, and 78% to 99% for 120 training samples. The accuracy rate of sleep attacks detection for 40, 80, and 120 training samples is 84%, 87%, and 89.75%, respectively, as shown in Table 3. The polynomial kernel function worked better than linear kernel function. The error rate is between 69.25% and 98.5% for 40 training samples, 71.5% to 99.5% for 80 training samples, and 74.25% to 99% for 120 training samples when the polynomial kernel function was used as far as five SVM features were considered. The accuracy rate obtained for the RBF kernel function is between 74% and 98% when five SVM featured were used, as shown in Table 3. However, the polynomial kernel function and RBF kernel function provided the best results when 10 SVM features were used. The accuracy rate obtained using polynomial kernel function considering ten SVM features is between 81% to 98.5% for 40, 80, and 120 training samples, respectively. While the percentage accuracy is between 78.75% and 98.75% when 10 SVM features were used, considering the RBF kernel function. However, we observe a slight decrease in percentage accuracy when the experiment was performed without microwave-absorbing material. The results obtained are shown in Table 3. Table 3 indicates the comparison between the three SVM kernel functions used for transforming the data. We observe that the accuracy rate is decreased by 5–7% without deploying microwave-absorbing material in the indoor environment. We further investigate the results obtained using KNN and RF algorithms.

6.1.2. Data Classification Using KNN and RF

The data collected using S-Band sensing technique was then classified using KNN and RF algorithms [45,46,47]. The former classification method is based on supervised learning where voting criteria classifies the new objects. The nearest object k from the training datasets is considered that assigns a new object to a particular class based on the majority votes. The training procedure of the KNN classification method includes storing of features and class label of the particular training datasets. In classification procedure, the most frequent training samples k assign an unlabeled object of a particular class. Various distance parameters are used in KNN algorithm as discussed in Equations (10)–(13). In our case, we have used Euclidean distance as in Equation (12) and set the value of k to 1, which implies that the selected class label was exactly the same as the one nearest to the training dataset On the other hand, the RF classification method primarily integrates a set of independent decision tree classifiers [48]. A decision tree in an RF classifier with N number of leaves divides the feature space into N number of regions such as R m , 1 m N . The prediction function f(x) for each tree is described as
f ( x ) = m = 1 N c m ( x , R m ) ,
Here, N indicates the total number of regions in a feature space, Rm corresponds to the m region, cm represents a constant number that corresponds to m, and describes the indicator function.
  ( x , R m ) = ( 1 ,   i f   x   ε R m 0 ,   o t h e r w i s e
The final decision function for random forest algorithm is based on majority vote of all the trees. In our case, we have used an RF classification method with 100 trees.
We now discuss the data obtained using KNN and RF algorithms in terms of accuracy, precision, recall, specificity, Cohen’s Kappa coefficient, and F-measure. The formulae for six performance metrics are discussed as follows:
A c c u r a c y = T p + T n T p + T n + F p + F n
Accuracy is a fraction of instances that are correctly classified [46],
P r e c i s i o n = T p T p + F p
Precision is estimated as a ratio of true predictions pertaining to a class [46].
R e c a l l = T p T p + F n
Recall is the fraction of relevant instances that have been retrieved over the total amount of relevant instances [47].
K a p p a = ( A c c u r a c y A c c u r a c y e x p e c t e d ) 1 A c c u r a c y e x p e c t e d
Kappa is the accuracy of the system to the accuracy of the random system.
S p e c i f i c i t y = T n F p + T n ,
Specificity measures the proportion of negatives that are correctly identified.
F - m e a s u r e = 2 T p ( 2 T p + F p + F n )
F-measure is the harmonic mean of precision and recall.

6.1.3. Results Obtained Using SVM, KNN, and RF Classifiers

The KNN and RF classifiers were trained and tested using 120 samples. The confusion matrices obtained for SVM, KNN, and RF classifiers are shown in Table 4, respectively.
Based on these confusion matrices, we have obtained the values of six performance metrics as shown in Table 5.
Table 5 shows the accuracy, precision, recall, specificity, F-measure, and Kappa values obtained using support vector machine. In the earlier section, we discussed the percentage accuracy using three kernel functions considering 10 SVM features. The accuracy presented in Table 5 is obtained using the RBF kernel function considering 10 SVM features, as shown in Table 3. The precision for all five human activities is more than 90%, while for sleep attack, it is 94%. The recall values received using SVM vary between 91% and 94.4%. The specificity obtained is more than 96% for all activities. The F-measure values also vary between 90% and 95.4%. The average Cohen’s Kappa coefficient value obtained for all five human activities is 0.925. Table 5 indicates the six performance metrics received using KNN classifier. The accuracy for sitting, walking and squatting is 94.8%, 92.8%, and 90.2%, respectively. The accuracy rate for push-ups, and sleep attack is 86.6% and 88.5%, respectively. The precision values for walking and squatting are below 90%, while the rest of the three are above 90%. The recall values for push-ups and sleep attacks are 86.6% and 88.6%, respectively. The other three values are above 90%. The specificity is more than 90% for all five human activities. The F-measure values for all human activities are near to 90% except squatting activity (87%). The average Cohen’s Kappa coefficient for all five activities is 0.811.
We further examine the results obtained using random forest algorithm as shown in Table 5. The accuracy rate for sitting and walking is approximately 87%. For push-ups, the accuracy is 88.1%, while for squatting and sleep attacks, the accuracy rate is approximately 91%. Looking at the precision values, sitting has a received value of 87.5%, walking has 80.0%, and the rest have received values of more than 90%. The recall value for sitting and walking is approximately 87%, the push-ups value is 88.1%, and for squatting and sleep attacks, the value is approximately 91%. The specificity for all five human activities is more than 94%. The F-measure value for sitting and walking activity is 84.4% and 83.4%, respectively, while the value for value is more than 90% for the rest of the three activities. The average Cohen’s Kappa coefficient for all five human activities is 0.865%.
When we compare the values of all the six performance parameters, it is observed that the SVM algorithm provides the best results as compared to the other two classification techniques. All the values of the six performance metrics considering five human activities are more than 90%, except for of walking, which is 84.1%. As far as the KNN and RF classifiers are concerned, there are multiple instances where the values of the performance metrics are below 90%.

7. Conclusions

This paper presented an automatic method for healthcare applications in IoTs that continuously monitors a patient’s different activities and reports sleep episodes due to narcolepsy. The method leveraged S-band sensing technique is used to record variances of wireless channel information. We examined the variances of amplitude and calibrated phase information of CI data and observed that each human activity induced a particular CI registration. Three classification algorithms such as SVM, KNN, and RF algorithms were used to classify different human activities and identify sleep episodes. It was observed that the SVM classifier provided better results than KNN and RF classifiers by examining the six performance metrics. The proposed method is easily deployable and cost-effective. A musical beat alarm helps the patient in waking up and restoring routine activities.

Acknowledgments

The work was supported in part by the Fundamental Research Funds for the Central Universities (JB180205 and JB160211), in part by the National Natural Science Foundation of China (Grant No. 61671349, 61301175, 61601338), in part by the International Scientific and Technological Cooperation and Exchange Projects in Shaanxi Province (Grant No. 2017KW-005). The authors would like to thank Northwest Women’s and Children’s Hospital for its support.

Author Contributions

Syed Aziz Shah, Aifeng Ren, Dou Fan, Zhiya Zhang, Nan Zhao, Xiaodong Yang, Ming Luo designed the experiments; Syed Aziz Shah, Dou Fan performed the experiments; Syed Aziz Shah, Dou Fan analyzed the data; Weigang Wang, Fangming Hu, Masood Ur Rehman, Osamah S. Badarneh, Qammer Hussain Abbasi contributed the materials; Syed Aziz Shah wrote the paper.

Conflicts of Interest

The authors declare no conflict of interest.

References

  1. Islam, S.R.; Kwak, D.; Kabir, M.H.; Hossain, M.; Kwak, K.S. The internet of things for health care: A comprehensive survey. IEEE Access 2015, 3, 678–708. [Google Scholar] [CrossRef]
  2. Kumar, N.; Rodrigues, J.J.P.C.; Chilamkurti, N. Bayesian coalition game as-a-service for content distribution in internet of vehicles. IEEE Internet Things J. 2014, 1, 544–555. [Google Scholar] [CrossRef]
  3. Tentori, M.; Favela, J. Activity-aware computing for healthcare. IEEE Pervasive Comput. 2008, 7. [Google Scholar] [CrossRef]
  4. Kudo, M.; Sklansky, J. Comparison of algorithms that select features for pattern classifiers. Pattern Recognit. 2000, 33, 25–41. [Google Scholar] [CrossRef]
  5. Burgess, C.R.; Scammell, T.E. Narcolepsy: neural mechanisms of sleepiness and cataplexy. J. Neurosci. 2012, 32, 12305–12311. [Google Scholar] [CrossRef] [PubMed]
  6. La Herrán-Arita, D.; Alberto, K.; Guerra-Crespo, M.; Drucker-Colin, R. Narcolepsy and Orexins: An example of progress in sleep research. Front. Neurol. 2011, 2, 26. [Google Scholar] [CrossRef] [PubMed]
  7. Siddiqui, M.M.; Srivastava, G.; Saeed, S.H. Diagnosis of narcolepsy sleep disorder for different stages of sleep using Short Time Frequency analysis of PSD approach applied on EEG signal. In Proceedings of the Computational Techniques in Information and Communication Technologies (ICCTICT), New Delhi, India, 11–13 March 2016; pp. 500–508. [Google Scholar]
  8. Han, C.; Wu, K.; Wang, Y.; Ni, L.-M. Wifall: Device-free fall detection by wireless networks. IEEE Trans. Mob. Comput. 2017, 16, 581–594. [Google Scholar]
  9. Pu, Q.; Gupta, S.; Gollakota, S.; Patel, S. Whole-home gesture recognition using wireless signals. In Proceedings of the 19th Annual International Conference on Mobile Computing & Networking, Miami, FL, USA, 30 September–4 October 2013; pp. 27–38. [Google Scholar]
  10. Kohsaka, M.; Fukuda, N. Twenty-four-hour sleep-wake monitoring in narcolepsy: Comparison with MSLT. Sleep Med. 2013, 14 (Suppl. 1), e172. Available online: https://doi.org/10.1016/j.sleep.2013.11.403 (accessed on 5 March 2018). [CrossRef]
  11. Coronato, A.; de Pietro, G.; Paragliola, G. A situation-aware system for the detection of motion disorders of patients with Autism Spectrum Disorders. Expert Syst. Appl. 2014, 41, 7868–7877. [Google Scholar] [CrossRef]
  12. Islam, M.Z.; Nahiyan, K.M.T.; Kiber, M.A. A motion detection algorithm for video-polysomnography to diagnose sleep disorder. In Proceedings of the 2015 18th International Conference on Computer and Information Technology (ICCIT), Dhaka, Bangladesh, 21–23 December 2015; pp. 272–275. [Google Scholar]
  13. Ibarra, E.; Antonopoulos, A.; Kartsakli, E.; Rodrigues, J.J.; Verikoukis, C. QoS-aware Energy Management in Body Sensor Nodes Powered by Human Energy Harvesting. IEEE Sens. 2016, 16, 542–549. [Google Scholar] [CrossRef]
  14. Tennina, S.; Santos, M.; Mesodiakaki, A.; Mekikis, P.V.; Kartsakli, E.; Antonopoulos, A.; Di Renzo, M.; Stavridis, A.; Graziosi, F.; Alonso, L.; et al. WSN4QoL: WSNs for Remote Patient Monitoring in e-Health Applications. In Proceedings of the IEEE ICC, Kuala Lumpur, Malaysia, 22–27 May 2016. [Google Scholar]
  15. Jara, A.J.; Zamora, M.A.; Skarmeta, A.F. An internet of thingsBased personal device for diabetes therapy management in ambient assisted living (AAL). Pers. Ubiquit. Comput. 2011, 15, 431–440. [Google Scholar] [CrossRef]
  16. Tian, J.; Morillo, C.; Azarian, M.H.; Pecht, M. Motor Bearing Fault Detection Using Spectral Kurtosis-Based Feature Extraction Coupled With K-Nearest Neighbor Distance Analysis. IEEE Trans. Ind. Electron. 2016, 63, 1793–1803. [Google Scholar] [CrossRef]
  17. Dong, B.; Ren, A.; Shah, S.A.; Hu, F.; Zhao, N.; Yang, X.; Haider, D.; Zhang, Z.; Zhao, W.; Abbasi, Q.H. Monitoring of atopic dermatitis using leaky coaxial cable. Healthc. Technol. Lett. 2017, 4, 244–248. [Google Scholar] [CrossRef] [PubMed]
  18. Yang, X.; Shah, S.A.; Ren, A.; Zhao, N.; Fan, D.; Hu, F.; Ur-Rehman, M.; von Deneen, K.M.; Tian, J. Wandering Pattern Sensing at S-Band. IEEE J. Biomed. Health Inform. 2017. [Google Scholar] [CrossRef]
  19. Cretikos, M.A.; Bellomo, R.; Hillman, K.; Chen, J.; Finfer, S.; Flabouris, A. Espiratory rate: The neglected vital sign. Med. J. Aust. 2008, 188, 657–659. [Google Scholar] [PubMed]
  20. Pantelopoulos, A.; Bourbakis, N.G. A survey on wearable sensor-based systems for health monitoring and prognosis. IEEE Trans. Syst. Man Cybern. Part C 2010, 40, 1–12. [Google Scholar] [CrossRef]
  21. Chen, L.; Nugent, C.D.; Wang, H. A knowledge-driven approach to activity recognition in smart homes. IEEE Trans. Knowl. Data Eng. 2012, 24, 961–974. [Google Scholar] [CrossRef]
  22. Lee, Y.S.; Pathirana, P.N.; Steinfort, C.L.; Caelli, T. Monitoring and analysis of respiratory patterns using microwave doppler radar. IEEE J. Transl. Eng. Health Med. 2014, 2, 1–12. [Google Scholar] [CrossRef] [PubMed]
  23. Yang, X. Detection of Essential Tremor at the S-Band. IEEE J. Transl. Eng. Health Med. 2018, 6, 1–7. [Google Scholar] [CrossRef] [PubMed]
  24. Bryan, J.D.; Kwon, J.; Lee, N.; Kim, Y. Application of ultra-wideband radar for classification of human activities. IET Radar Sonar Navig. 2012, 6, 172–179. [Google Scholar] [CrossRef]
  25. Shany, T.; Redmond, S.J.; Narayanan, M.R.; Lovell, N.H. Sensorsbased wearable systems for monitoring of human movement and falls. IEEE Sens. J. 2012, 12, 658–670. [Google Scholar] [CrossRef]
  26. Karantonis, D.M.; Narayanan, M.R.; Mathie, M.; Lovell, N.H.; Celler, B.G. Implementation of a real-time human movement classifier using a triaxial accelerometer for ambulatory monitoring. IEEE Trans. Inf. Technol. Biomed. 2006, 10, 156–167. [Google Scholar] [CrossRef] [PubMed]
  27. Qi, X.; Zhou, G.; Li, Y.; Peng, G. RadioSense: Exploiting wireless communication patterns for body sensor network activity recognition. In Proceedings of the 2012 IEEE 33rd Real-Time Systems Symposium, San Juan, Puerto Rico, 4–7 December 2012; pp. 95–104. [Google Scholar]
  28. Kaushik, A.R.; Lovell, N.H.; Celler, B.G. Evaluation of PIR detector characteristics for monitoring occupancy patterns of elderly people living alone at home. In Proceedings of the 29th Annual International Conference of the IEEE Engineering in Medicine and Biology Society, Lyon, France, 22–26 August 2007; pp. 3802–3805. [Google Scholar]
  29. Zhou, Z.; Chen, X.; Chung, Y.-C.; He, Z.; Han, T.X.; Keller, J.M. Videobased activity monitoring for indoor environments. In Proceedings of the IEEE International Symposium on Circuits and Systems, Taipei, Taiwan, 24–27 May 2009; pp. 1449–1452. [Google Scholar]
  30. Li, C.; Lubecke, V.M.; Boric-Lubecke, O.; Lin, J. A review on recent advances in Doppler radar sensors for noncontact healthcare monitoring. IEEE Trans. Microw. Theory Tech. 2013, 61, 2046–2060. [Google Scholar] [CrossRef]
  31. Zhang, G.; Yi, T.; Zhang, T.; Cao, L. A multiscale noise tuning stochastic resonance for fault diagnosis in rolling element bearings. Chin. J. Phys. 2018, 56, 145–157. [Google Scholar] [CrossRef]
  32. Ström, E.G. On 20 MHz channel spacing for V2X communication based on 802.11 OFDM. In Proceedings of the 39th Annual Conference of the IEEE Industrial Electronics Society, Vienna, Austria, 10–13 November 2013; pp. 6891–6896. [Google Scholar]
  33. Halperin, D.; Hu, W.; Sheth, A.; Wetherall, D. Predictable 802.11 packet delivery from wireless channel measurements. In Proceedings of the ACM SIGCOMM 2010 Conference, New Delhi, India, 30 August–3 September 2010; pp. 159–170. [Google Scholar]
  34. Shah, S.A.; Zhang, Z.; Ren, A.; Zhao, N.; Yang, X.; Zhao, W.; Yang, J.; Zhao, J.; Sun, W.; Hao, Y. Buried Object Sensing Considering Curved Pipeline. IEEE Antennas Wirel. Propag. Lett. 2017, 16, 2771–2775. [Google Scholar] [CrossRef]
  35. Gao, W.; Oh, S.; Viswanath, P. Demystifying Fixed k-Nearest Neighbor Information Estimators. In Proceedings of the 2017 IEEE International Symposium on Information Theory (ISIT), Aachen, Germany, 25–30 June 2017. [Google Scholar]
  36. Sreejith, B.; Verma, A.K.; Srividya, A. Fault diagnosis of rolling element bearing using time-domain features and neural networks. In Proceedings of the IEEE Region 10 and the Third international Conference on Industrial and Information Systems, Kharagpur, India, 8–10 December 2008. [Google Scholar]
  37. Phan, H.; Maaß, M.; Mazur, R.; Mertins, A. Random Regression Forests for Acoustic Event Detection and Classification. IEEE/ACM Trans. Audio Speech Lang. Process. 2015, 23, 20–31. [Google Scholar] [CrossRef]
  38. Cortes, C.; Vapnik, V. Support-Vector Networks. Mach. Learn. 1995, 20, 273–297. [Google Scholar] [CrossRef]
  39. Dumais, S.T. Using SVMs for text categorization. IEEE Intell. Syst. 1998, 13, 21–23. [Google Scholar]
  40. Jerome, F.; Hastie, T.; Tibshirani, R. The Elements of Statistical Learning; Springer: New York, NY, USA, 2001. [Google Scholar]
  41. Haykin, S. Neural Networks: A Comprehensive Foundation, 2nd ed.; Prentice Hall PTR: Upper Saddle River, NJ, USA, 1994. [Google Scholar]
  42. Rai, V.; Mohanty, A. Bearing fault diagnosis using FFT of intrinsic mode functions in Hilbert-Huang transform. Mech. Syst. Signal Process. 2007, 21, 2607–2615. [Google Scholar] [CrossRef]
  43. Qin, Y.; Xing, J.; Mao, Y. Weak transient fault feature extraction based on an optimized Morlet wavelet and kurtosis. Meas. Sci. Technol. 2016, 27, 085003. [Google Scholar] [CrossRef]
  44. Shah, S.A.; Zhao, N.; Ren, A.; Zhang, Z.; Yang, X.; Yang, J.; Zhao, W. Posture Recognition to Prevent Bedsores for Multiple Patients Using Leaking Coaxial Cable. IEEE Access 2016, 4, 8065–8072. [Google Scholar] [CrossRef]
  45. Breiman, L.; Friedman, J.H.; Stone, C.J.; Olshen, R.A. Classification and Regression Trees; CRC Press: Boca Raton, FL, USA, 1998. [Google Scholar]
  46. Kumar, P.S.; Pranavi, S. Performance analysis of machine learning algorithms on diabetes dataset using big data analytics. In Proceedings of the 2017 International Conference on INFOCOM Technologies and Unmanned Systems (Trends and Future Directions) (ICTUS), Dubai, UAE, 18–20 December 2017; pp. 508–513. [Google Scholar]
  47. Wikipedia.org. Available online: https://en.wikipedia.org/wiki/Precision_and_recall (accessed on 12 February 2018).
  48. Breiman, L. Random forests. J. Mach. Learn. 2001, 45, 5–32. [Google Scholar] [CrossRef]
Figure 1. Experiment design for detection sleep attacks. (a) Experimental setup with the microwave absorbing material. (b) Experimental setup without microwave absorbing material.
Applsci 08 00508 g001
Figure 2. Channel frequency response (CFR) data obtained for five different human activities, different colors in the figures indicate variances of amplitude information of different frequencies.
Applsci 08 00508 g002
Figure 3. Raw channel information (CI) phase and calibrated phase information obtained during the experiment.
Applsci 08 00508 g003
Figure 4. Time history of person’s five different activities.
Applsci 08 00508 g004
Table 1. Inner product kernel functions.
TypeKernel FunctionK
(x, xi), i = 1, 2, 3, …, P
Linear x T x i + c
Polynomial ( x T x i + 1 ) p
Radial-basis function (RBF) e ( | x | x i | | 2 2 σ 2 )
Table 2. Ten features used to train and test support vector machine (SVM).
R o o t   m e a n   s q u a r e   ( Y R M S )   = 1 P i = 1 P x i 2 C r e s t   F a c t o r   ( Y C F )   = max ( | x i | ) Y r m s
M a r g i n a l   f a c t o r   ( Y M F )   = max ( | x i | ) Y S R A S k e w n e s s   v a l u e   ( Y S V )   = 1 P i = 1 P ( [ x i μ x ] σ ) 3
S q u a r e   r o o t   o f   a m p l i t u d e   ( Y S R A ) = [ 1 P i = 1 P | x i | ] 2 I m p a c t   f a c t o r   ( Y I F )   = max ( | x i | ) 1 P i = 1 P | x i |
M e a n   v a l u e   ( Y M V ) = 1 N i = 1 P x i P e a k   t o   p e a k   v a l u e   ( Y P P V )   = max ( x i ) min ( x i )
K u r t o s i s   v a l u e   ( Y K V )   = 1 P i = 1 P ( [ x i μ x ] σ ) 4 S t a n d a r d   d e v i a t i o n   ( Y S T D ) = 1 P i = 1 P ( x i μ x ) 2
Table 3. Accuracy of SVM used for sleep attack detection (%).
(a) Accuracy of SVM Used for Sleep Attack Detection—With Microwave Absorbing Material
Kernel5 Features10 Features
FunctionSabcdeabcde
Linear4098.7578.2590.5098.2565.0097.0075.2594.7598.5084.00
8098.2577.2591.7598.0065.5098.7578.2595.2598.7587.00
12098.2576.5090.0098.0066.2599.0078.0095.5099.0089.75
Polynomial4098.5069.2589.5095.0080.5095.5081.7590.5098.5089.75
8099.5071.5087.7595.0085.2598.0087.7592.2598.5092.00
12099.0074.2588.5099.0087.7598.5084.7595.2598.5092.75
RBF4098.2574.7589.5098.0084.0098.2578.7592.5099.5088.50
8098.2574.5089.0098.2586.2598.2583.2595.0099.2591.00
12098.2588.0088.5098.0087.2598.7584.5096.0099.2591.25
(b) Accuracy of SVM Used for Sleep Attack Detection—Without Microwave Absorbing Material
Kernel5 Features10 Features
FunctionSabcdeabcde
Linear4091.6574.1985.5096.8060.0091.5073.1391.9896.5282.22
8093.1174.8786.5596.1461.4392.0474.9192.1196.6184.74
12095.5574.7187.5296.0062.3191.9575.1197.5097.4388.75
Polynomial4092.7566.1488.7296.6177.5292.5079.8188.0096.1981.12
8094.2866.5089.8591.2179.5294.4279.9089.1395.9389.54
12094.9670.1388.8997.1183.8196.6280.0191.7297.0988.75
RBF4096.6971.1190.1098.2180.1497.1576.7590.8095.3185.77
8096.1171.3290.3298.7180.8597.9580.9491.8495.5490.64
12096.2574.4390.5198.2881.2597.7581.7492.5696.3388.91
Table 4. Classification results considering different approaches.
(a) Confusion matrix obtained using SVM for 120 training samples
SittingWalkingPush-upsSquattingSleep attacks
Sitting1183112
Walking1101101
Push-ups0411603
Squatting1521194
Sleep attacks0700110
(b) Confusion matrix obtained using KNN for 120 training samples
Sitting1111131
Walking2104240
Push-ups4611061
Squatting2521022
Sleep attacks1455116
(c) Confusion matrix obtained using RF for 120 training samples
Sitting1058232
Walking596351
Push-ups4811212
Squatting3321092
Sleep attacks3512113
Table 5. Classification results.
(a) Classification results obtained using SVM (%)
AccuracyPrecisionRecallSpecificityF-MeasureKappa
Sitting98.394.494.499.096.00.925
Walking84.197.197.096.090.0
Push-ups96.694.394.399.195.4
Squatting99.190.891.099.795.2
Sleep attacks91.694.094.097.892.8
(b) Classification results obtained using SVM (%)
Sitting94.892.594.897.593.60.811
Walking92.886.692.896.689.6
Push-ups86.691.686.697.789.0
Squatting90.285.090.296.087.5
Sleep attacks88.596.688.599.092.4
(c) Classification results obtained using RF (%)
Sitting87.587.587.596.684.40.865
Walking87.280.087.294.883.4
Push-ups88.193.388.197.590.6
Squatting91.590.891.597.491.2
Sleep attacks91.194.191.198.392.6

