Power Control Optimization of an Underwater Piezoelectric Energy Harvester
by
 , ,
, ,
Iñigo Aramendia
1 ,
,
Unai Fernandez-Gamiz
1,* ,
,
Ekaitz Zulueta Guerrero
2,
Jose Manuel Lopez-Guede
2 and
Javier Sancho
1 1
Nuclear Engineering and Fluid Mechanics Department, University Basque Country, UPV/EHU, 01006 Vitoria, Spain
2
Automatic Control and System Engineering Department, University Basque Country, UPV/EHU, 01006 Vitoria, Spain
*
Author to whom correspondence should be addressed.
Appl. Sci. 2018, 8(3), 389; https://doi.org/10.3390/app8030389
Submission received: 29 December 2017
/
Revised: 25 February 2018
/
Accepted: 2 March 2018
/
Published: 7 March 2018
(This article belongs to the Special Issue Development and Application of Thermoelectric Power Generators, Energy Harvesters and Refrigerators)
Abstract
:Over the past few years, it has been established that vibration energy harvesters with intentionally designed components can be used for frequency bandwidth enhancement under excitation for sufficiently high vibration amplitudes. Pipelines are often necessary means of transporting important resources such as water, gas, and oil. A self-powered wireless sensor network could be a sustainable alternative for in-pipe monitoring applications. A new control algorithm has been developed and implemented into an underwater energy harvester. Firstly, a computational study of a piezoelectric energy harvester for underwater applications has been studied for using the kinetic energy of water flow at four different Reynolds numbers Re = 3000, 6000, 9000, and 12,000. The device consists of a piezoelectric beam assembled to an oscillating cylinder inside the water of pipes from 2 to 5 inches in diameter. Therefore, unsteady simulations have been performed to study the dynamic forces under different water speeds. Secondly, a new control law strategy based on the computational results has been developed to extract as much energy as possible from the energy harvester. The results show that the harvester can efficiently extract the power from the kinetic energy of the fluid. The maximum power output is 996.25 µW and corresponds to the case with Re = 12,000.
1. Introduction
In order to provide the amplified demand of energy caused by the population expansion and larger power consumption, development of new energy harvester devices and their optimization have become key points for a few decades [1]. In fact, when the issue is to construct optimized energy harvester systems, the balance between demand and supply is also a fundamental problem to deal with from a multidisciplinary point of view. It is desirable to obtain sustainable, safe and world-wide applicable methods [2,3,4]. Before the 2000s, most energy consumption was based on fossil fuels working in so-called conventional energy systems. Nevertheless, both the limitations in the supply and the worldwide inhomogeneous distribution make the use of those fossil based fuels inefficient. In the study of Lund et al. [5], an integrated cross-sector approach was used to argue the most efficient and least-cost storage options for the entire renewable energy system.
According to Cottone [6] and Nickolaus et al. [7], the demand of portable power source devices is increasing over the last decade because it is not satisfied by batteries, the subject of energy harvesting from ambient has attracted extensive attention, Farsangi et al. [8] and Kurt [9]. Energy harvesting devices permits energy deliver for low power electronic equipment such as wireless sensors, pacemakers, and health monitoring systems. Additionally, harvesters can be used as a supplementary power device, which increases the life-time of the batteries with appropriate maximal power point tracking mechanisms, Brunelli et al. [10], Dini et al. [11], and Lopez-Lapena et al. [12]. These devices are usually designed to obtain electrical power from ambient and they convert it into energy for low power devices. Numerous energy harvesting methods such as vibration, solar, thermal gradient, wind, etc. have been developed in recent years; see Wu et al. [13] and Zulueta et al. [14]. There are a lot of ambient vibrations such as human and machine motions, wind or seismic actions in the environment, see O’Donnell [15], Zulueta et al. [14] and Kurt et al. [16]. In the work of Nesarajah et al. [17], a new thermoelectric energy harvesting system was developed to convert the waste heat from exhaust pipes. The response of a piezoelectric harvester in pendulum shape was investigated by Uzun et al. [18] under a periodic magnetic field both theoretically and experimentally.
Uzun et al. [19] reported a performance exploration of a piezoelectric harvester positioned near an operating induction motor. The harvested power per surrounding volume was increased up to 0.11 mW/cm3. Monitoring of underwater pipelines through wireless sensor nodes (WSNs) is an important area of research especially for locations such as underground or underwater pipelines, where it is costly to replace batteries [20].
Some advantages of the energy harvesters are based on long-term operability, cost efficiency, maintenance free, no requirement of charging points, and inaccessible sites operability [21]. Additionally, these systems are very helpful in applications for hard natural conditions. Most of the WSNs cannot be enabled without Energy Harvesting technology. Vibrations can be converted into energy by numerous techniques: electromagnetic, electrostatic/capacitive, and piezoelectric [15]. Moreover, the piezoelectric devices are appropriate to be optimized for a certain excitation frequencies and that can facilitate the raise of the system efficiency, see Kurt et al. [22] and Uzun et al. [18]. According to Cottone [6], non-linear oscillators can offer the option of broadening the response of vibration energy systems, in that way they can physically respond to changes in driving frequency, Uzun et al. [23]. They can also harvest energy from sources where vibrations are present in several frequencies, see Frizzell et al. [24] and Cottone et al. [25], and [26]. Dong et al. [27] developed a new energy harvesting device based on two side-by-side flexible plates. The adopted algorithm was verified and validated by the simulation of flow past a square flexible plate.
Vibrations can be converted into energy by several techniques: electromagnetic, electrostatic/capacitive, and piezoelectric, O’Donnell [15]. Among the aforementioned techniques, piezoelectrics have some advantages such as elevated power density and voltage. In addition, the piezoelectrics are appropriate to be optimized for some excitation frequencies and can be useful to increase the system efficiency, see Kurt et al. [22] and Uzun et al. [18]. The materials used for piezoelectric conversion are naturally-occurring ones as crystals, ceramics, and polymers, see Patel et al. [28] and Westwood [29].
In 2001, an eel-shaped piezoelectric energy harvester with five side-by-side flexible beams, which vibrated mechanically by the vortex street was presented by Taylor et al. [30]. A power output of 10 μW was achieved calculated with a water velocity of 1 m/s. Afterward, many researchers focused on piezoelectric energy harvesting using flow-induced vibration [31,32,33,34]. Shan et al. [35] studied a macro fiber composite piezoelectric energy harvester in the water vortex at a fluid velocity of 0.5 m/s, and 1.32 μW of power was generated. Weinstein et al. [36] investigated a piezoelectric beam induced by the vortex shedding from an upstream cylinder and the power output generated at fluid velocities of 2.5 m/s and 5 m/s were 200 μW and 3 mW, respectively.
In the present work, a system for powering sensors to monitor physical and chemical parameters in a water pipeline is modelled. Carbon nanotube-based sensors are usually used to measure the pH of water and chemical compounds, such as chloride. Furthermore, Micro-Electro-Mechanical Systems (MEMS) sensors are also employed to measure fluid temperature and velocity, conductivity, flow rate, pressure, etc. Thus, as presented in [37,38] no batteries are implemented in order to provide self-powering capability to wireless sensor devices. Hydraulic turbines, such as Pelton and Darrieus, are used for capturing the energy of the water flux, but we have chosen a circular cylinder on a pipeline to take advantage of the vibrations induced by the Von Karman Vortex street generated in the wake of a circular cylinder at low Reynolds numbers due to the simplicity of the device.
The main goal of the current study is to demonstrate how a novel optimization system implemented into an underwater energy harvester increases the captured energy by the device. Due to this objective, a new piezoelectric control law has been designed using exhaustive search algorithms. In the literature, there are a number of control algorithms designed to increase the captured power such as Ronkanen et al. [39]. In our study, we have introduced a piezoelectric voltage based control law which highly enhances the mean power captured by the energy harvester.
2. Harvester Description
The device investigated in the current work is based on the study of Cottone et al. [40] and consists of a piezoelectric beam assembled to an oscillating body, a circular cylinder of diameter D = 0.01 m, inside the water of pipes from 0.0508 to 0.1270 m of diameter, see Figure 1.
The harvester device includes housing and at least one energy transducer. A circular cylinder is arranged to receive collisionally transferred kinetic energy from the fluid, resulting in vibration due to the vortices formed closely downstream of the circular cylinder. The energy transducer is attached to the housing.
3. Computational Setup
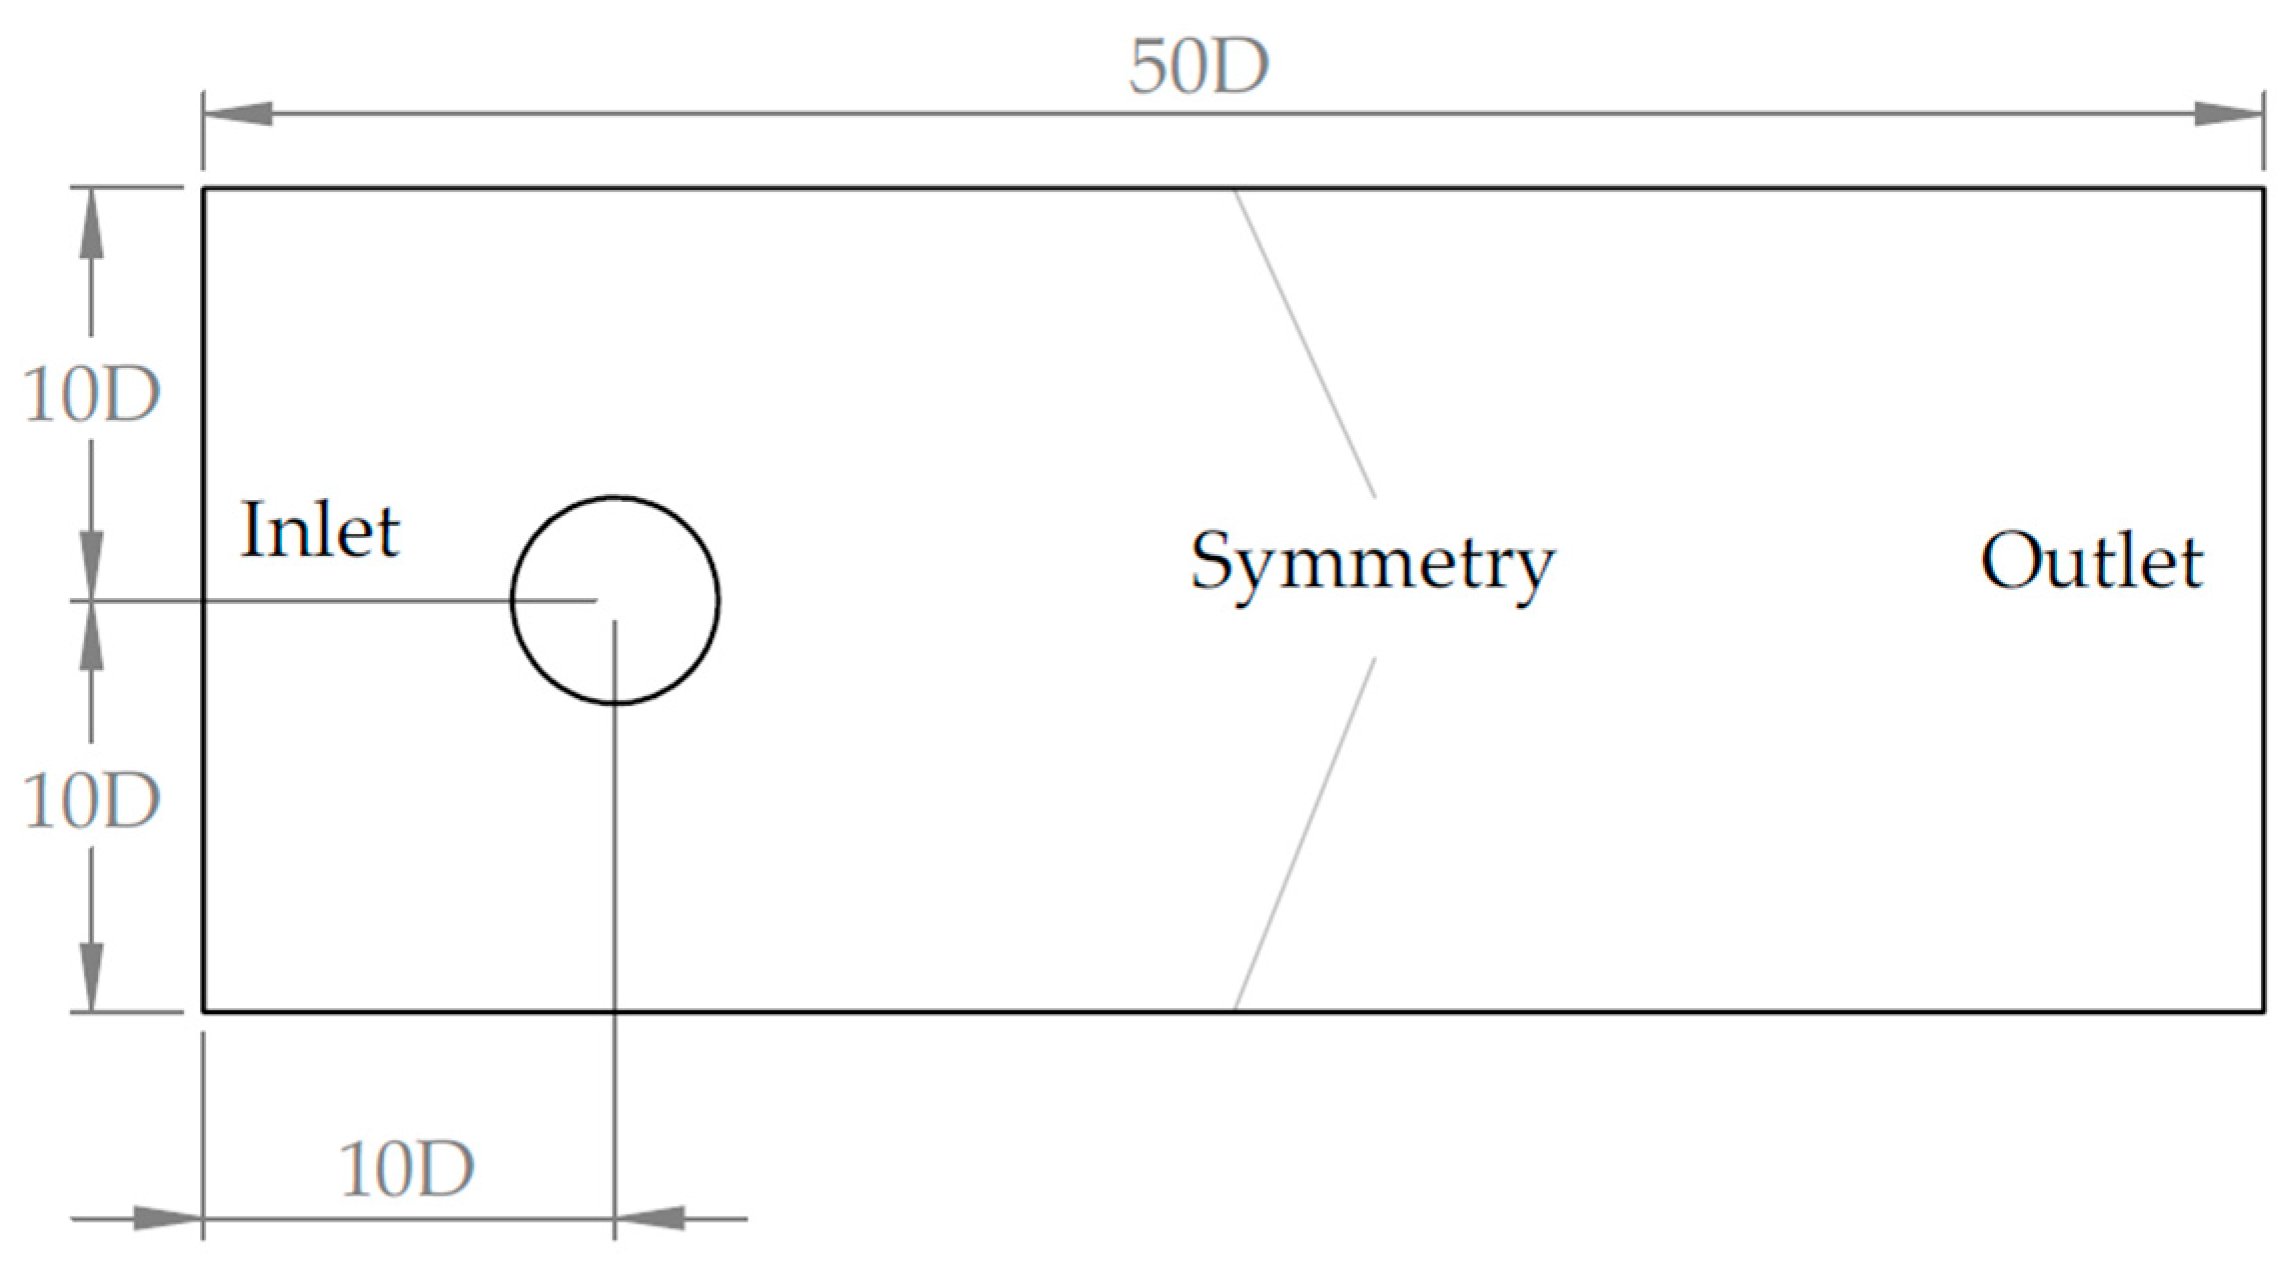
A computational model has been developed to characterize the behavior of the circular cylinder of the underwater harvester. The fluctuating lift acting on a stationary circular cylinder in cross flow at four different Reynolds numbers has been investigated. The dimensions of the computational domain are shown in Figure 2. Downstream of the cylinder, a domain of 40 times the cylinder diameter (D) has been chosen to investigate the vortices caused by the fluid passing around the body. Slip condition has been selected for the top and bottom boundaries and velocity inlet at the inlet of the domain.
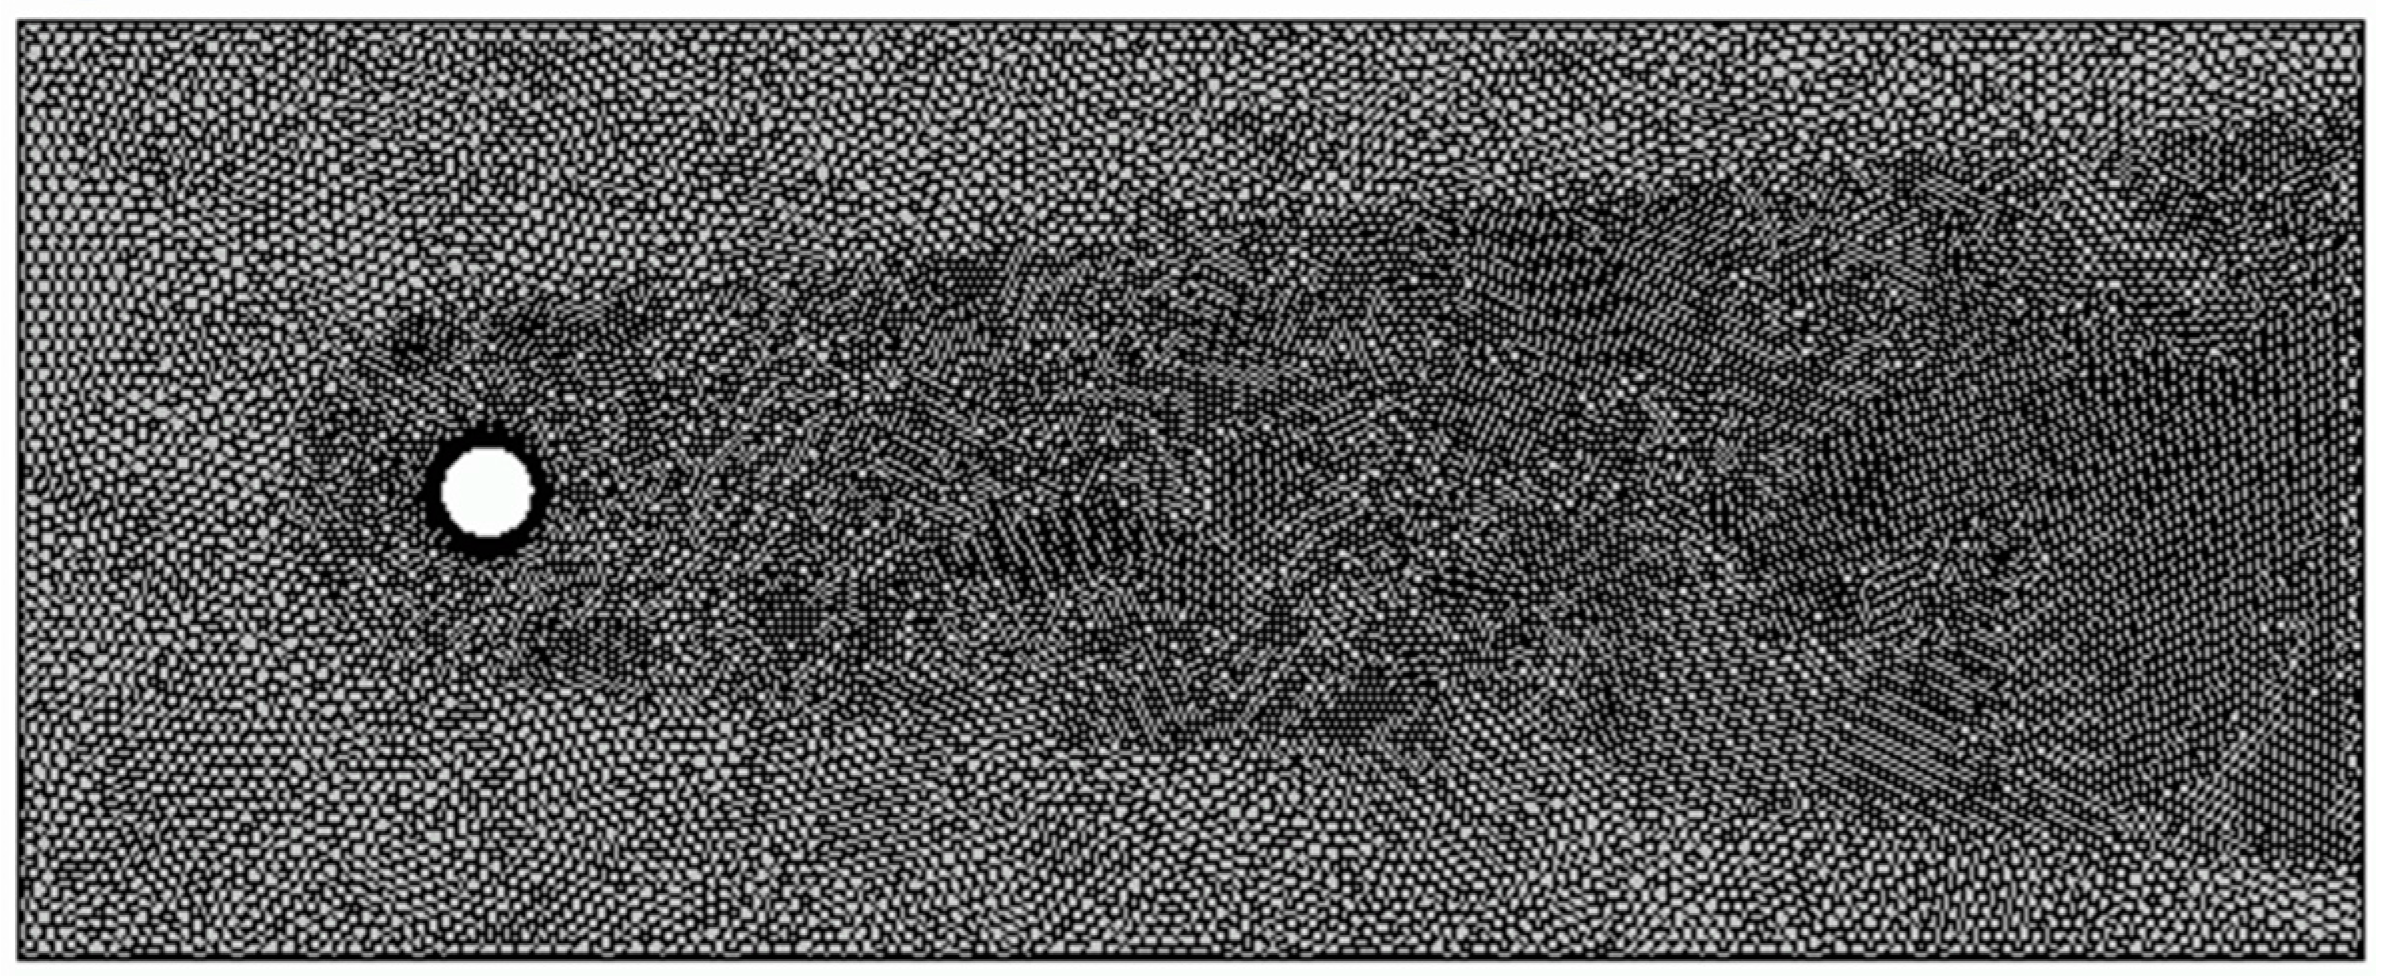
The design and construction of a high quality grid is crucial to the success of the Computational Fluid Dynamics (CFD) analysis and have the most direct influence on the precision, convergence, and time required of the solution. In the present case, the mesh consists of 56,000 two-dimensional cells, the most of them where located around the cylinder and downstream of the cylinder in order to capture the vortex shedding in the wake. Around the cylinder 20 prismatic layers of cells where located to obtain a wall y+ less than 1 and polyhedral cells were chosen for the rest of the domain, as illustrated in Figure 3.
The numerical solution has been reached by applying RANS (Reynold Average Navier-Stokes) equations for unsteady state flow in a finite volume flow solver for unstructured grids STAR-CCM+ [41]. The CFD code uses discretization methods to convert the continuous system of equations to a set of discrete algebraic equations by means of the Finite Volume Method. The time step was calculated as 0.002 s and 15 inner iterations were determined as the optimal number. The time intervals have been chosen to be small enough to capture the vortex shedding. Upwind scheme [42] was used to discretize the convective terms, ensuring the robustness of the solution. The turbulence is modeled through the kω-SST turbulence model by Menter [43]. Unsteady state computations have been successfully applied to the similar cases in the previous studies of Mahbubar et al. [44] and Rajani et al. [45]. All the simulations were converged until a satisfactory residual convergence was achieved on the velocities, pressure, and turbulence quantities.
4. Computational Results
The turbulent flow over a circular cylinder for Reynolds numbers: Re = 3000, 6000, 9000, and 12,000 is investigated in the present study using a two-dimensional finite volume method. The Re number is based on the cylinder diameter and has been calculated by Equation (1), where ρ and µ correspond to the density and the dynamic viscosity of the water, respectively, at 15 °C of fluid temperature.
The different Re numbers were achieved by changing the water speed Vwater at the inlet. The solutions were computed during a time from 0 to 20 s. The vortex shedding is observed and the drag and lift forces are also calculated using CFD techniques. The computations have been validated by the experimental work of Roshko [46] which locates the beginning of the laminar-to-turbulent transition at Reynolds numbers between 200 and 300. Further than those Reynolds number but less than around 3 × 10⁵ the wake of the cylinder is completely turbulent. In finite volume methods, the flow domain is divided into a number of control volumes or cells. Therefore, a discretized form of Equation (2) must be set up at a nodal point placed within each control volume in order to solve the problem. For control volumes neighboring to the domain boundaries, the general equation is modified to include boundary conditions. The resulting system of linear algebraic equations is then solved to obtain the velocity and pressure distribution n at each nodal point. The drag coefficient is computed as follows:
where FD is the drag force on the cylinder, is the density of the water at standard conditions and U∞ is the free stream velocity of the fluid depending on the Re number.
A mesh independency study has been carried out to verify sufficient mesh resolution. To that end, the Richardson extrapolation method has been applied to the drag coefficient calculations. Figure 4 shows the comparison between the experimental data of Roshko [46] and the current CFD results of CD with three different meshes: 14,000 (coarse), 28,000 (medium), and 56,000 (fine) cells.
Table 1 shows the results of the mesh independency study where RE represents the extrapolated solution, R the ratio of errors, and p the order of accuracy. Since the value of R is less than 1, all three integral quantities converge monotonically for all Reynolds number cases Re = 3000, 6000, 9000, and 12,000. As shown in Figure 4, the results of the fine mesh predict quite well the drag coefficients. Therefore, this higher resolution mesh has been used for the current computations.
The vortex shedding is visualized by means of the contours of stream function vorticity. Figure 5 shows the vorticity contour lines for Re = 3000, 6000, 9000, and 12,000 cases at the time of 20 s. The alternating formation, convection, and diffusion of the vortices can be clearly observed.
According to Figure 5, it is clearly visible how at the Reynolds numbers investigated in the current work a vortex shedding appears in the wake of the cylinder which provokes an oscillating in the lift coefficient which is in concordance with the work of Norberg [47].
The results show that the vortex shedding is an intrinsic phenomenon of the flow, fairly well predicted by the numerical solution based on the Navier-Stokes equations. The vortex shedding is generated by a loss of symmetry of the two dimensional symmetric structures in the wake of the circular cylinder.
Figure 6 represents the lift coefficient CL evolution at the range of Reynolds numbers studied in the current work determined by the Equation (3), where FL is the force normal to the flow direction induced by the water on the cylinder:
At the lowest Reynolds number of 3000, the frequency of the wave is much lower than the other cases. As the Reynolds number increases, the oscillating frequency increases as well. Note that Figure 6 shows the evolution of lift coefficient only at the first 5 s for better illustration of the wave form development.
The Strouhal number, St, is commonly used when describing oscillating flows and is determined from the power spectrum of the normal force. It has been calculated by Equation (4):
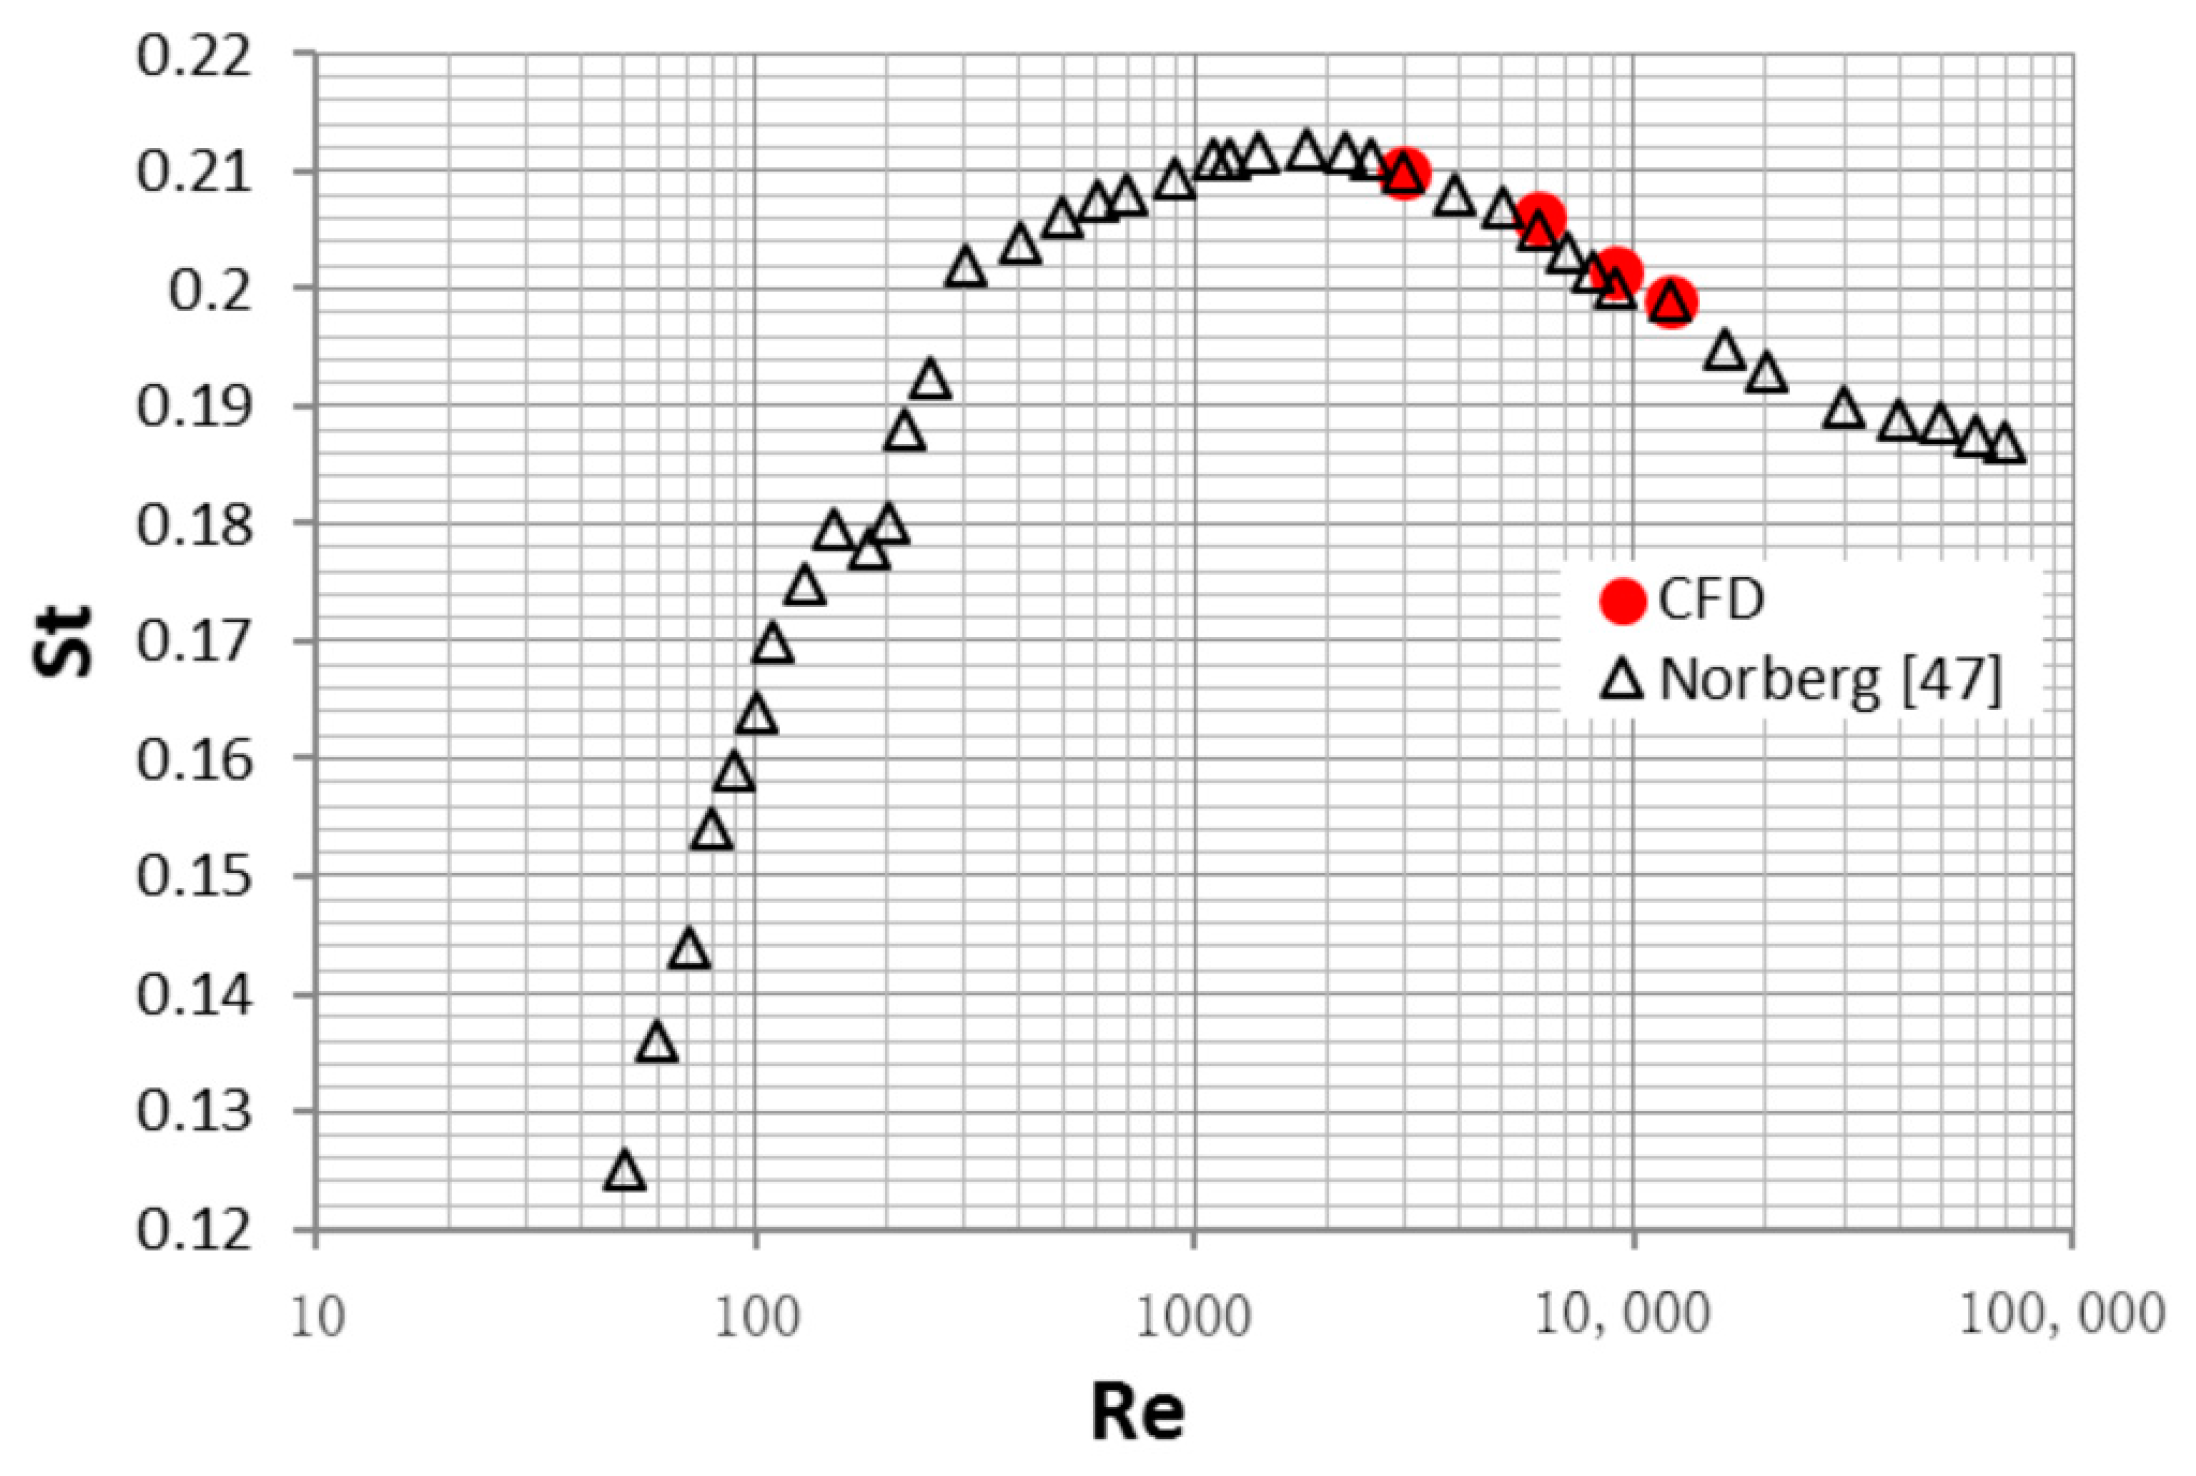
where f is the frequency of the vortex shedding, D the diameter of the cylinder and U∞ the freestream velocity. Looking at the variation of the Strouhal number as function of Reynolds number shown in Figure 7, the typically reported value around 0.2 was found for the range of Reynolds number studied in the present work. CFD results are represented by red color circles and the experimental data were extracted from Norberg [47].
5. Harvester Control Modeling
The main goal of the current work is to increase the mean power captured from the underwater energy harvester by developing and implementing a new control algorithm to optimize the control parameters. The system model input parameters are defined in Table 2, while Table 3 defines the variables used in the control. The main problem is to choose an appropriate cost function, since it should be strongly linked to the objective that is pursued. In this case, the objective is to increase the power captured by the harvester as the first step. Figure 8 illustrates a sketch of the harvester device with the piezoelectric and cylinder distribution.
5.1. Piezoelectric System
The harvester model used in this work is based on the modeling proposed in Cottone et al. [40]. The main variables are the water speed (Vwater), the angular pulsation of the lift coefficient (ω0), the electrical current (i), and the voltage for the piezoelectric element (V). The first two variables are the most important inputs of the system, while the rest are the most important outputs. The piezoelectric model is described by equations from Equations (5)–(7):
where the reference of the piezoelectric deflection, u1, is defined by the division between the piezoelectric beam deflection, r1, and the transduction gain, Ktrans:
The proposed material for the underwater cylinder is Polypropylene (PP). PP is the most popular thermoplastic in use today and with the good behavior of being inert in a drinking water environment [48]. PP is a thermoplastic polymer used in a wide variety of industrial applications with good resistance to fatigue by aqueous solutions of inorganic salts and by practically all mineral acids and bases [49].
5.2. Hydro-Mechanical Model
The hydro-mechanical model proposed in the current work is defined by the Equation (8), where the hydro-mechanical torque Thydro is determined by Equation (9) and the moment Tm generated by the piezoelectric force Fm can be found in Equation (10).
The system has been designed with a torsion spring with the corresponding spring constant Kspring in order to keep the harvester device in a vertical equilibrium position without piezoelectric force. This spring lets the system keep energy from the fluid as a harmonic resonator. Thus, the spring is an element that stores the mechanical energy while the piezoelectric is taking the energy from it in a harmonic known state.
5.3. Piezoelectric Power Control
The proposed control law for the power control of the piezoelectric energy harvester is defined by the following equations. Equation (11) determines the piezoelectric current with the proportional gain of the control law, and Equation (12) is formed by matching Equations (5) and (10).
We supposed that the electrical time constant is lower than the mechanical time constant.
Therefore, in piezoelectric steady response we have:
Equation (14) is an approximation of the Equation (13) given that the term could be negligible in a steady state of the piezoelectric. Since the cylinder angle θ is very small, we can also assume that θ is very similar to sin(θ), as stabilized in Equation (15).
The previous system can be reduced to the Equations (16)–(18). Equation (16) is a combination between Equations (8) and (10).
The parameter θ is introduced in Equation (18) as a variable state and the parameter r1 is replaced by the formulation proposed in Equation (15). In this way, Equation (19) is obtained. Now the variable Fm has been isolated to one side of the Equation (20) and everything else to the other side.
Now we proceed to introduce the variable Fm defined by Equation (20) in the Equation (16). Therefore, a new equation is obtained, Equation (21). Note that some terms have been grouped to make it clearer.
After that, the terms of Equation (21) are ordered to achieve the Equation (22) which describes the energy harvester performance:
The hydro-dynamical performance of the harvester is defined by Equation (23):
The equivalent dynamic of the whole system can be considered as a second order linear system, see Equation (24). The chosen output is the rotational speed of the cylinder, because the extracted power depends on it. The input variable is the lift coefficient CL because this is the only term on Equation (24) that changes with the time. The lift coefficient has a sinusoidal time waveform as it is shown in Atluri et al. [50].
Appling the Laplace Transform, the Equation (24) can be written as follows:
The transfer function, H, has been analyzed in a harmonic response, see Equations (32) and (33) since the lift coefficient has a sinusoidal wave form, as mentioned before.
Given that the lift coefficient has a sinusoidal waveform, the time waveform of the rotational speed has also a sinusoidal waveform. If the amplitude of the lift coefficient is CL,max, and w0 the pulsation of the lift coefficient, the rotational speed of the cylinder can be written as described in Equation (34). The zero time base has been synchronized with the speed not with the lift coefficient.
The output power can be deduced as follows:
From Equations (14) and (15), the extracted power can be written as follows:
Therefore, the mean value of this instantaneous power can be evaluated over the period given by angular pulsation of the lift coefficient
Once we know the mean value of the power, we have made an exhaustive search along two design parameters: the spring constant and proportional gain of the control law .
6. Results
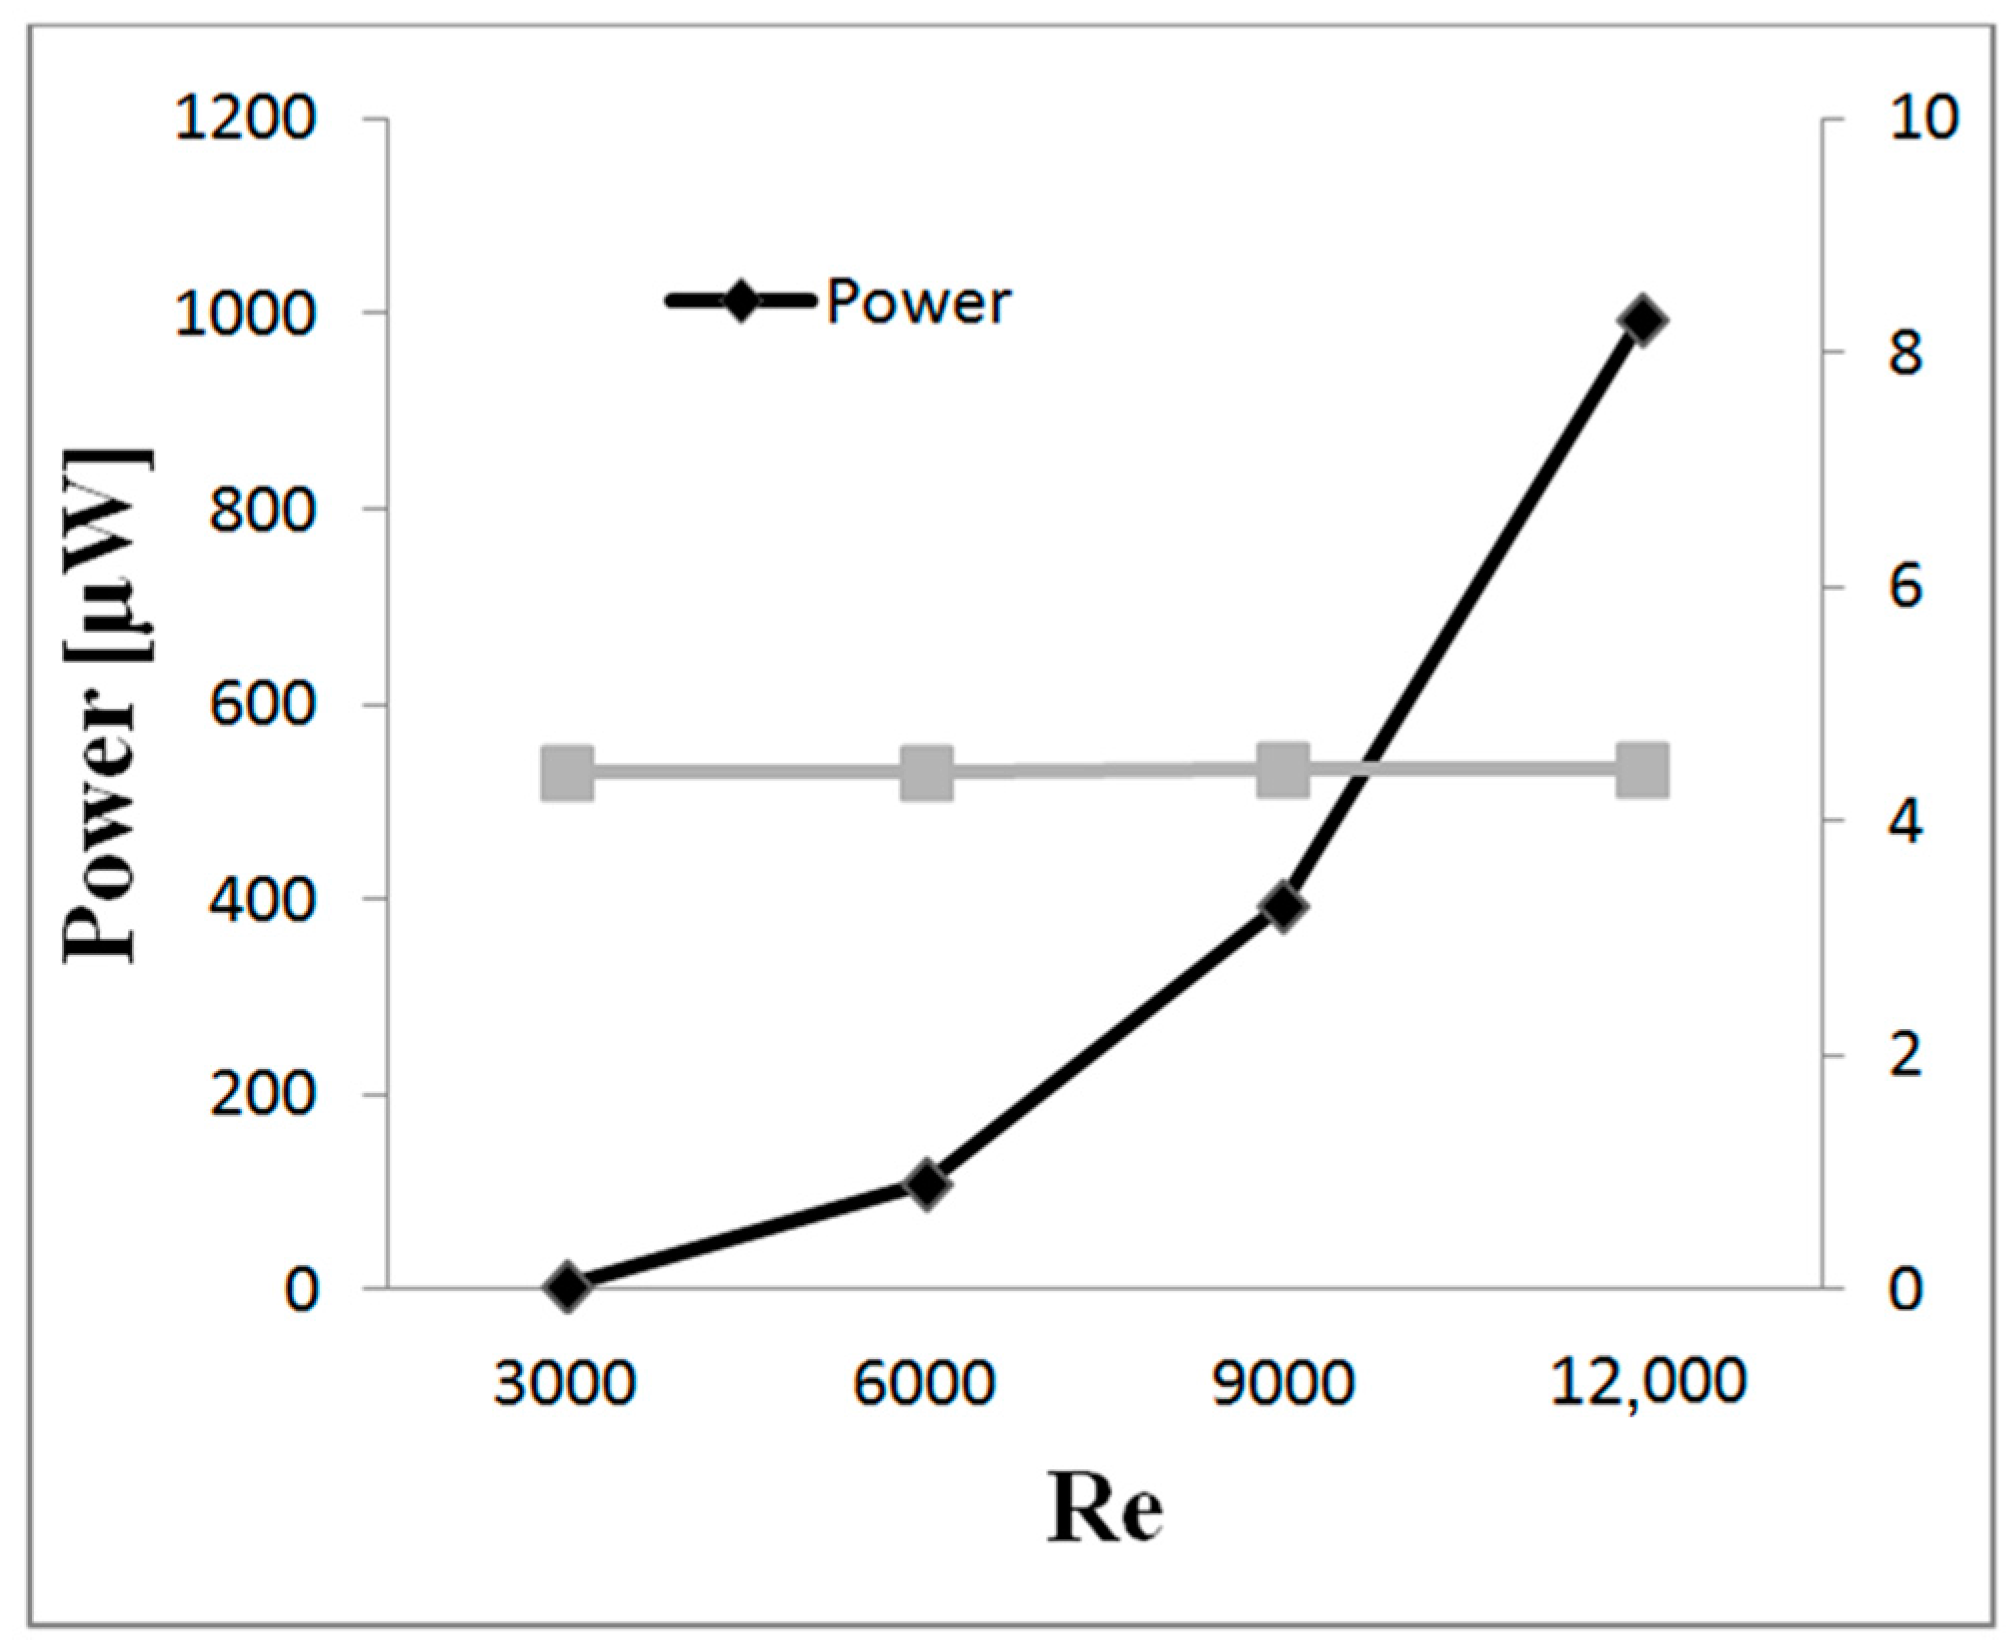
After applying the optimization algorithm to the control system, we have obtained the following results. Figure 9 illustrates the curve of the extracted power from the energy harvester versus the proportional gain of the control law, for each Reynolds number. The optimal value of the spring constant, , for each case is also denoted. It is clearly visible in each plot that a maximum power is achieved in the range of examined . The maximum extracted power at the lowest Reynolds number, Re = 3000, is 3.95 µW which corresponds to a water velocity of Vwater = 0.34 m/s. At the maximum Reynolds number, Re = 12,000 with a Vwater = 1.36 m/s, the power is much larger reaching the value of 996.25 µW. For the intermediate water velocities of Vwater = 0.68 m/s and Vwater = 1.02 m/s corresponding to the Re = 6000 and Re = 9000, respectively, the mean power extracted is also considerable. The largest leap in the power is achieved in the range from Re = 3000 to Re = 9000 where the power is multiplied by almost 10 times. Table 4 represents the values of the extracted power for all water velocity cases and their corresponding optimal values of the spring constant and proportional gain of the control law .
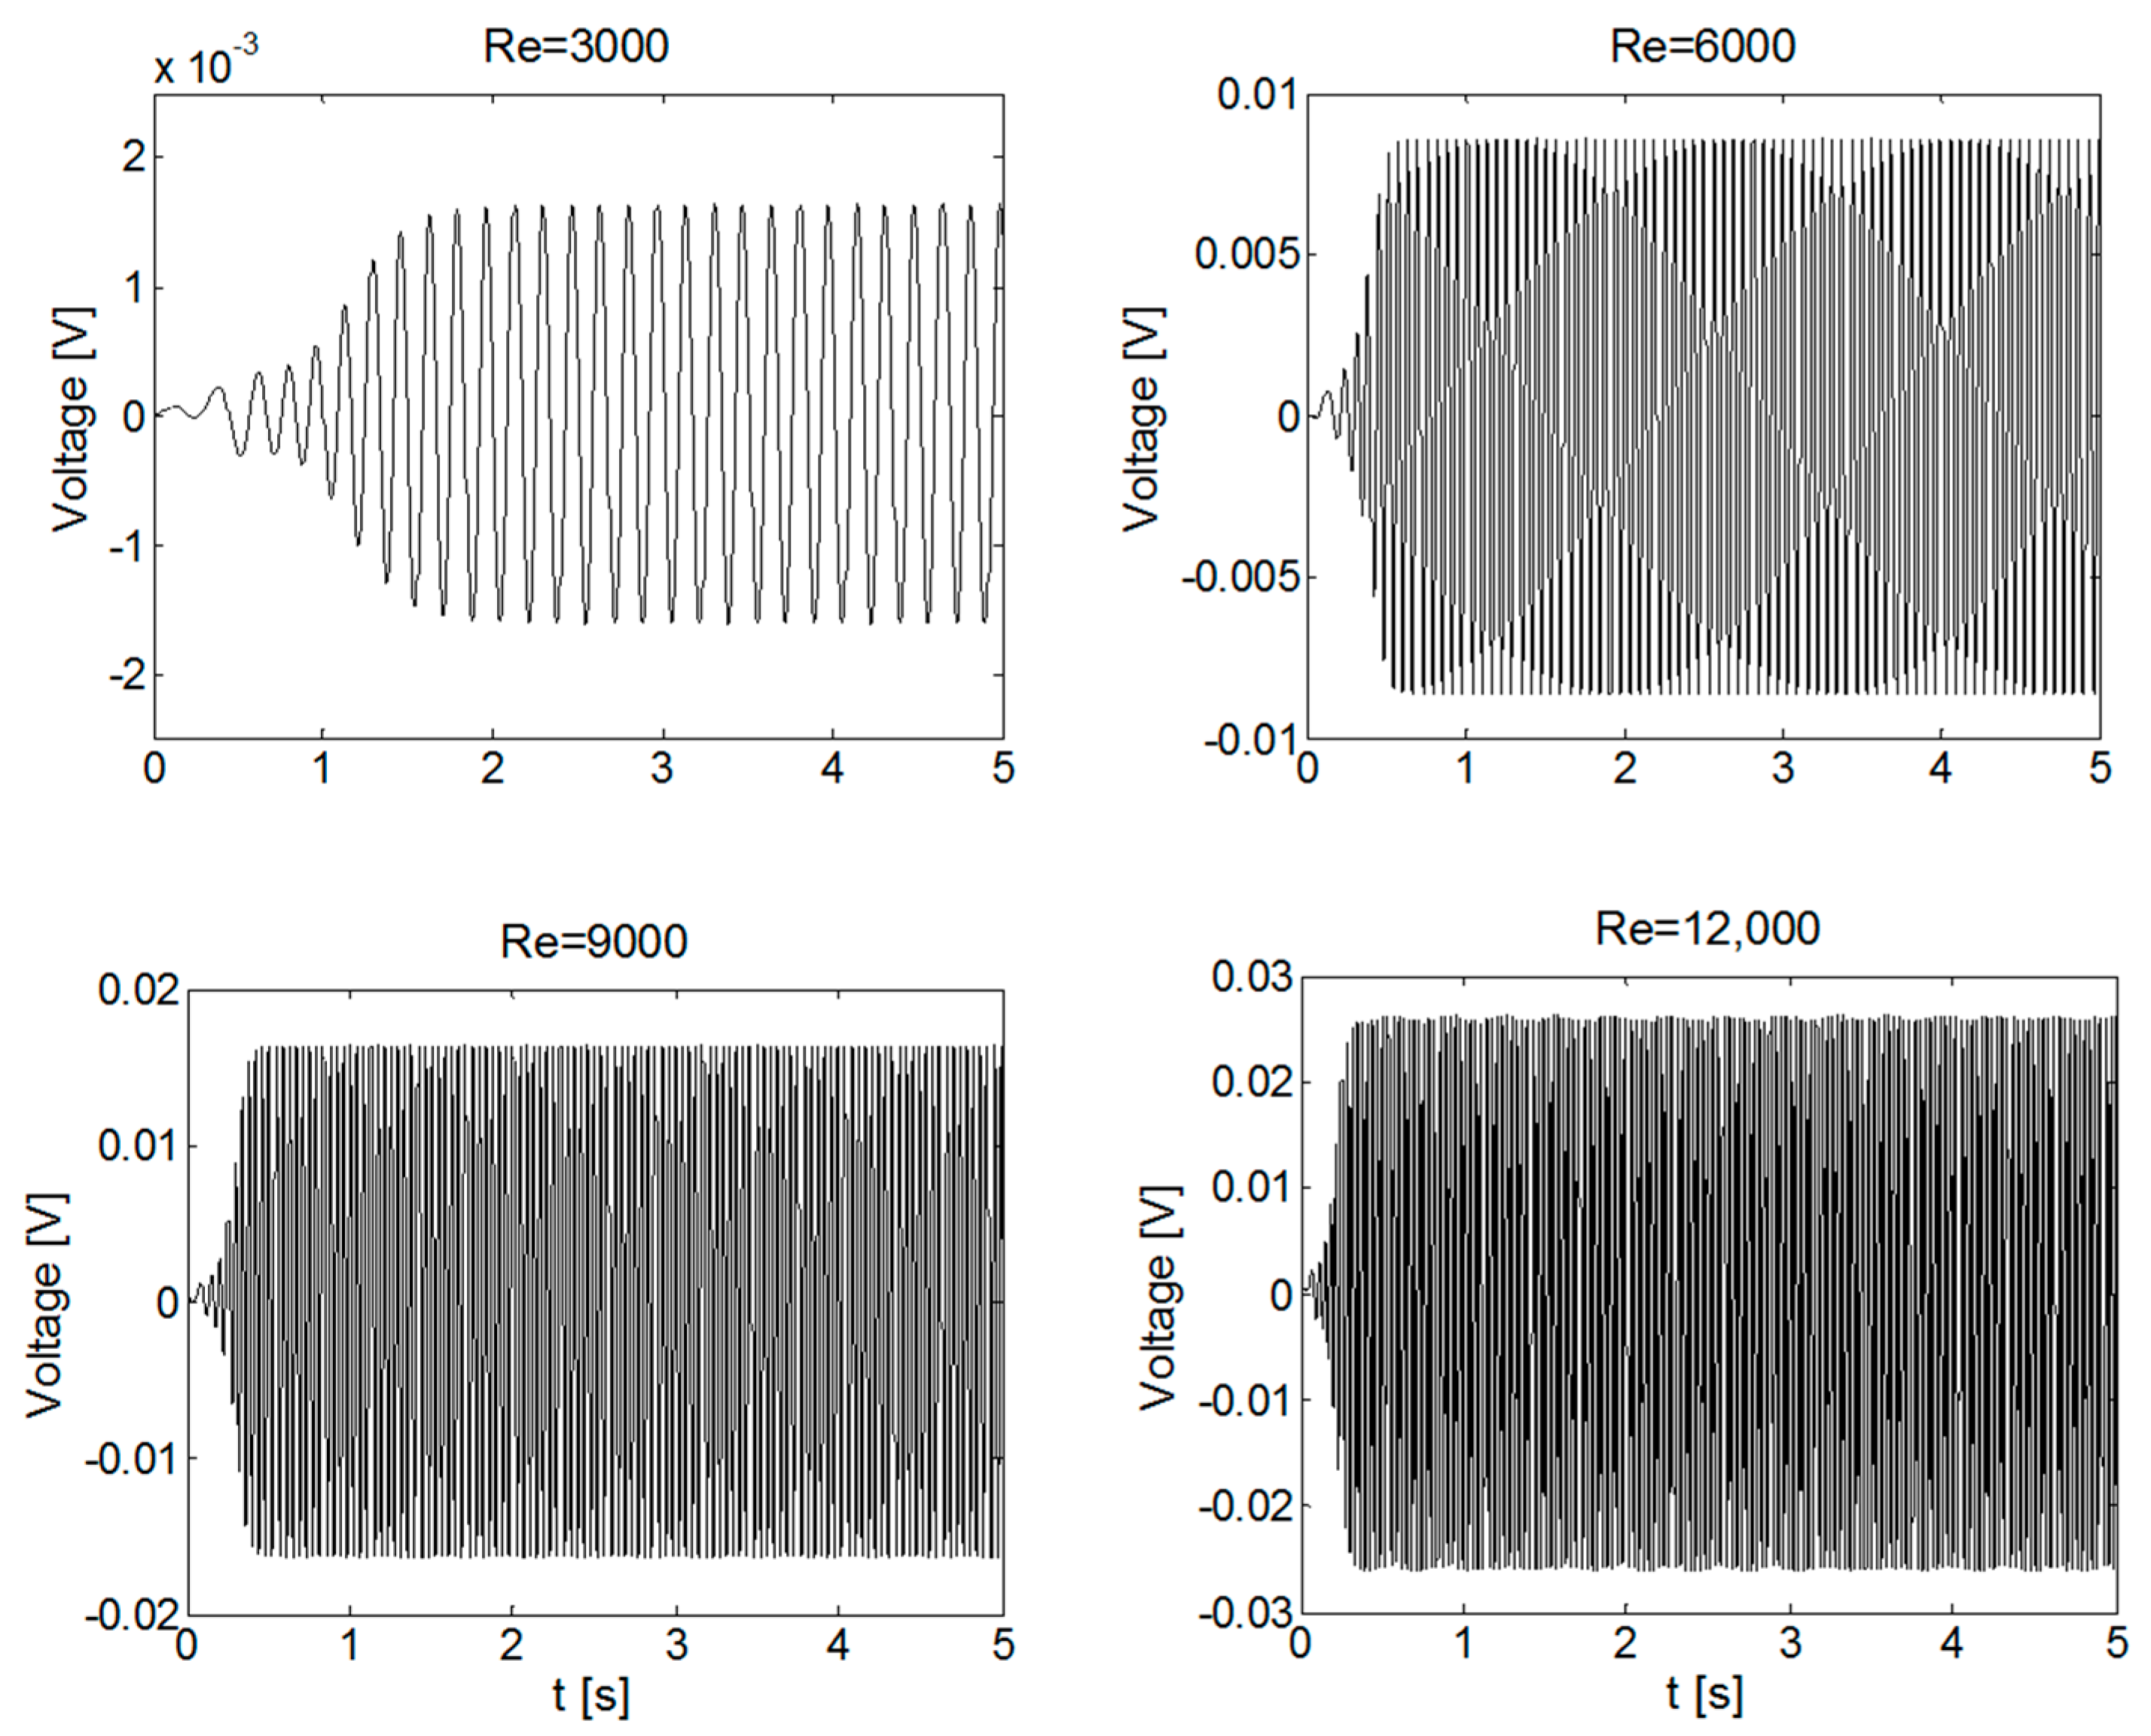
The variation of the output voltage at different Reynolds numbers is shown in Figure 10. Note that Figure 10 represents the transient state from the initial state t = 0 s and only up to 5 s for better illustration of the wave form progress. It could be found that the output voltage of the piezoelectric vibrator increases as the Reynolds number increases. As expected, the maximum value of voltage is achieved by the case with the largest fluid velocity which corresponds to the case Re = 12,000.
Figure 11 represents the power output evolution of the energy harvester and the optimal proportional gain of the control law, , for each Reynolds number. Note that the parameter of the proportional gain keeps almost constant while the power seems to increase following an exponential law. The results of the current work show that thanks to the implementation of the new control law and optimization scheme, the power output of the energy harvester has significantly increased in comparison with previous studies of Taylor et al. [30], Weinstein et al. [36], and Shan et al. [35]. Furthermore, in a similar work carried out by Song et al. [51] equipped with two piezoelectric beams and two cylinders, the power output (calculated by the sum of the upstream and downstream beams) obtained in the case of the 1 cm was around 1 µW at the water velocity of 0.34 m/s. In the present study, the power output achieved at that velocity is four times larger with a more simple mechanical system.
7. Conclusions
In the present study, a new control algorithm based on the circular cylinder lift coefficient, water velocity, and piezoelectric voltage has been developed and implemented into an underwater energy harvester system. Firstly, a computational study of a piezoelectric energy harvester for underwater applications has been studied for using the kinetic energy of water flow. The device consists of a piezoelectric beam assembled to an oscillating body, a circular cylinder that is 1 cm in diameter. Therefore, two-dimensional computational simulations around a circular cylinder have been carried out in the current work at four different Reynolds numbers Re = 3000, 6000, 9000, and 12,000. Unsteady state simulations were performed for a period of time of 20 s to investigate the evolution of the wake and the vortex shedding as well as to check the dynamic behavior of the cylinder. The lift coefficient of the circular cylinder has a sinusoidal time waveform and it has been used as an input variable in the system control. Secondly, a new control law strategy has been developed to extract as much energy as possible from the energy harvester. The maximum extracted power is 996.25 µW and corresponds to the case with Re = 12,000. The results show that thanks to the new control law and optimization scheme the power output of the harvester has significantly increased in comparison with previous studies. The power output of the underwater energy harvester seems to follow an exponential law at the Reynolds numbers studied. Furthermore, the proportional gain of the control law maintains approximately constant at the water velocities studied in the present work, which is an indicator of the robustness of the control system.
Supplementary Materials
The following are available online at https://www.mdpi.com/2076-3417/8/3/389/s1, Video S1: Vortex Shedding.
Acknowledgments
The funding from the Government of the Basque Country and the University of the Basque Country UPV/EHU through the SAIOTEK (S-PE11UN112) and EHU12/26 research programs, respectively, is gratefully acknowledged. The authors are very grateful to SGIker of UPV/EHU and European funding (ERDF and ESF) for providing technical and human.
Author Contributions
I.A., U.F.-G. and E.Z. Guerrero performed the computational simulations and developed the new control algorithm. J.M.L.-G. and J.S. supervised the methodology and the preparation of the current study.
Conflicts of Interest
The authors declare no conflict of interest.
References
- Sreekanth, K.J.; Jayaraj, S.; Sudarsan, N. Economic Impact of CDM Implementation through Alternate Energy Resource Substitution. Int. J. Renew. Energy Dev. 2013, 2, 6. [Google Scholar] [CrossRef]
- Mishra, S.P.; Ali, S.M.; Pradhan, A.; Mohapatra, P.; Singh, V. Increasing energy efficiency in India by the use of green building. Int. J. Renew. Energy Technol. 2013, 4. [Google Scholar] [CrossRef]
- Daoutidis, P.; Zachar, M.; Jogwar, S.S. Sustainability and process control: A survey and perspective. J. Process Control 2016, 44, 184–206. [Google Scholar] [CrossRef]
- Parisio, A.; Rikos, E.; Glielmo, L. Stochastic model predictive control for economic/environmental operation management of microgrids: An experimental case study. J. Process Control 2016, 43, 24–37. [Google Scholar] [CrossRef]
- Lund, H.; Østergaard, P.A.; Connolly, D.; Ridjan, I.; Mathiesen, B.V.; Hvelplund, F.; Thellufsen, J.Z.; Sorknæs, P. Energy Storage and Smart Energy Systems. Int. J. Sustain. Energy Plan. Manag. 2016, 11. [Google Scholar] [CrossRef]
- Cottone, F.; Vocca, H.; Gammaitoni, L. Nonlinear Energy Harvesting. Phys. Rev. Lett. 2009, 102, 080601. [Google Scholar] [CrossRef] [PubMed]
- Bruno, N.M.; Ciocanel, C.; Feigenbaum, H.P.; Waldauer, A. A theoretical and experimental investigation of power harvesting using the NiMnGa martensite reorientation mechanism. Smart Mater. Struct. 2012, 21, 094018. [Google Scholar] [CrossRef]
- Farsangi, M.A.A.; Cottone, F.; Sayyaadi, H.; Zakerzadeh, M.R.; Orfei, F.; Gammaitoni, L. Energy harvesting from structural vibrations of magnetic shape memory alloys. Appl. Phys. Lett. 2017, 110, 103905. [Google Scholar] [CrossRef]
- Kurt, E. Harvester systems under the magnetic media. In Proceedings of the International Conference Nuclear Renewable Energy Resources, Istanbul, Turkey, 14–19 May 2010. [Google Scholar]
- Brunelli, D.; Moser, C.; Thiele, L.; Benini, L. Design of a Solar-Harvesting Circuit for Batteryless Embedded Systems. IEEE Trans. Circuits Syst. I Regul. Pap. 2009, 56, 2519–2528. [Google Scholar] [CrossRef]
- Dini, M.; Romani, A.; Filippi, M.; Bottarel, V.; Ricotti, G.; Tartagni, M. A Nanocurrent Power Management IC for Multiple Heterogeneous Energy Harvesting Sources. IEEE Trans. Power Electron. 2015, 30, 5665–5680. [Google Scholar] [CrossRef]
- Lopez-Lapena, O.; Penella, M.T.; Gasulla, M. A Closed-Loop Maximum Power Point Tracker for Subwatt Photovoltaic Panels. IEEE Trans. Ind. Electron. 2012, 59, 1588–1596. [Google Scholar] [CrossRef]
- Wu, Y.; Zuo, L.; Zhou, W.; Liang, C.; McCabe, M. Multi-source energy harvester for wildlife tracking. Act. Passiv. Smart Struct. Integr. Syst. 2014, 9057, 905704. [Google Scholar] [CrossRef]
- Zulueta, E.; Kurt, E.; Uzun, Y.; Lopez-Guede, J.M. Power control optimization of a new contactless piezoelectric harvester. Int. J. Hydrogen Energy 2017, 42, 18134–18144. [Google Scholar] [CrossRef]
- O’Donnell, R. Energy harvesting from human and machine motion for wireless electronic devices. Proc. IEEE 2008, 96, 1455–1456. [Google Scholar] [CrossRef]
- Kurt, E.; Cottone, F.; Uzun, Y.; Orfei, F.; Mattarelli, M.; Özhan, D. Design and implementation of a new contactless triple piezoelectrics wind energy harvester. Int. J. Hydrogen Energy 2017, 42, 17813–17822. [Google Scholar] [CrossRef]
- Nesarajah, M.; Frey, G. Optimized Design of Thermoelectric Energy Harvesting Systems for Waste Heat Recovery from Exhaust Pipes. Appl. Sci. Basel 2017, 7, 634. [Google Scholar] [CrossRef]
- Uzun, Y.; Kurt, E. The effect of periodic magnetic force on a piezoelectric energy harvester. Sens. Actuators A 2013, 192, 58–68. [Google Scholar] [CrossRef]
- Uzun, Y.; Kurt, E. Performance exploration of an energy harvester near the varying magnetic field of an operating induction motor. Energy Convers. Manag. 2013, 72, 156–162. [Google Scholar] [CrossRef]
- Qureshi, F.U.; Muhtaroglu, A.; Tuncay, K. Sensitivity Analysis for Piezoelectric Energy Harvester and Bluff Body Design toward Underwater Pipeline Monitoring. J. Energy Syst. 2017, 1, 10–20. [Google Scholar] [CrossRef]
- Bizon, N.; Tabatabaei, N.M.; Blaabjerg, F.; Kurt, E. Energy Harvesting and Energy Efficiency; Springer: Berlin, Germany, 2017. [Google Scholar]
- Kurt, E.; Uzun, Y.; Durmus, C. Power characteristics of a new contactless piezoelectric harvester. In Proceedings of the 2015 4th International Conference on Electric Power and Energy Conversion Systems (EPECS), Sharjah, UAE, 24–26 November 2015. [Google Scholar]
- Uzun, Y.; Kurt, E.; Hilal Kurt, H. Explorations of displacement and velocity nonlinearities and their effects to power of a magnetically-excited piezoelectric pendulum. Sens. Actuators A Phys. 2015, 224, 119–130. [Google Scholar] [CrossRef]
- Frizzell, R.; Kelly, G.; Cottone, F.; Boco, E.; Nico, V.; O’Donoghue, D.; Punch, J. Experimental characterisation of dual-mass vibration energy harvesters employing velocity amplification. J. Intell. Mater. Syst. Struct. 2016, 27, 2810–2826. [Google Scholar] [CrossRef]
- Cottone, F.; Basset, P.; Guillemet, R.; Galayko, D.; Marty, F.; Bourouina, T. Bistable Multiple-Mass Elecrostatic Generator for Low-Frequency Vibration Energy Harvesting. In Proceedings of the 26th IEEE International Conference on Micro Electro Mechanical Systems (Mems 2013), Taipei, Taiwan, 20–24 January 2013; pp. 861–864. [Google Scholar]
- Cottone, F.; Frizzell, R.; Goyal, S.; Kelly, G.; Punch, J. Enhanced vibrational energy harvester based on velocity amplification. J. Intell. Mater. Syst. Struct. 2014, 25, 443–451. [Google Scholar] [CrossRef]
- Dong, D.; Chen, W.; Shi, S. Coupling Motion and Energy Harvesting of Two Side-by-Side Flexible Plates in a 3D Uniform Flow. Appl. Sci. Basel 2016, 6, 141. [Google Scholar] [CrossRef]
- Patel, I.; Siores, E.; Shah, T. Utilisation of smart polymers and ceramic based piezoelectric materials for scavenging wasted energy. Sens. Actuators A 2010, 159, 213–218. [Google Scholar] [CrossRef]
- Westwood, A. Materials for Advanced Studies and Devices. Metall. Mater. Trans. A 1988, 19, 749–758. [Google Scholar] [CrossRef]
- Taylor, G.; Burns, J.; Kammann, S.; Powers, W.; Welsh, T. The energy harvesting Eel: A small subsurface ocean/river power generator. IEEE J. Ocean. Eng. 2001, 26, 539–547. [Google Scholar] [CrossRef]
- Wang, D.; Chiu, C. Huy-Tuan Pham Electromagnetic energy harvesting from vibrations induced by Karman vortex street. Mechatronics 2012, 22, 746–756. [Google Scholar] [CrossRef]
- Wang, D.; Chao, C.; Chen, J. A miniature hydro-energy generator based on pressure fluctuation in Karman vortex street. J. Intell. Mater. Syst. Struct. 2013, 24, 612–626. [Google Scholar] [CrossRef]
- Tam Nguyen, H.-D.; Pham, H.-T.; Wang, D.-A. A miniature pneumatic energy generator using Karman vortex street. J. Wind Eng. Ind. Aerodyn. 2013, 116, 40–48. [Google Scholar] [CrossRef]
- Sarpkaya, T. A critical review of the intrinsic nature of vortex-induced vibrations. J. Fluids Struct. 2004, 19, 389–447. [Google Scholar] [CrossRef]
- Shan, X.; Song, R.; Liu, B.; Xie, T. Novel energy harvesting: A macro fiber composite piezoelectric energy harvester in the water vortex. Ceram. Int. 2015, 41, S763–S767. [Google Scholar] [CrossRef]
- Weinstein, L.A.; Cacan, M.R.; So, P.M.; Wright, P.K. Vortex shedding induced energy harvesting from piezoelectric materials in heating, ventilation and air conditioning flows. Smart Mater. Struct. 2012, 21, 045003. [Google Scholar] [CrossRef]
- Gammaitoni, L. There’s plenty of energy at the bottom (micro and nano scale nonlinear noise harvesting). Contemp. Phys. 2012, 53, 119–135. [Google Scholar] [CrossRef]
- Priya, S.; Inman, D.J. Energy Harvesting Technologies; Springer: Berlin, Germany, 2009; p. 517. [Google Scholar]
- Ronkanen, P.; Kallio, P.; Vilkko, M.; Koivo, H.N. Displacement Control of Piezoelectric Actuators Using Current and Voltage. IEEE-ASME Trans. Mechatron. 2011, 16, 160–166. [Google Scholar] [CrossRef]
- Cottone, F.; Goyal, S.; Punch, J. Energy Harvester Apparatus Having Improved Efficiency. U.S. Patent 20110074162 A1, 30 September 2009. [Google Scholar]
- STAR-CCM+ v.11.06 User’s Guide. Available online: https://www.sharcnet.ca/help/index.php/STAR-CCM+ (accessed on 21 September 2017).
- Osher, S.; Chakravarthy, S. Upwind Schemes and Boundary-Conditions with Applications to Euler Equations in General Geometries. J. Comput. Phys. 1983, 50, 447–481. [Google Scholar] [CrossRef]
- Menter, F.R. 2-Equation Eddy-Viscosity Turbulence Models for Engineering Applications. AIAA J. 1994, 32, 1598–1605. [Google Scholar] [CrossRef]
- Rahman, M.; Karim, M.; Alim, A. Numerical investigation of unsteady flow past a circular cylinder using 2-D finite volume method. J. Nav. Archit. Mar. Eng. 2007, 4, 27–42. [Google Scholar] [CrossRef]
- Rajani, B.N.; Kandasamy, A.; Majumdar, S. Numerical simulation of laminar flow past a circular cylinder. Appl. Math. Model. 2009, 33, 1228–1247. [Google Scholar] [CrossRef]
- Roshko, A. Vortex Shedding from Circular Cylinder at Low Reynolds Number; NACA Report No. 1191; Cambridge University Press: Cambridge, UK, 1954. [Google Scholar]
- Norberg, C. Flow around a circular cylinder: Aspects of fluctuating lift. J. Fluids Struct. 2001, 15, 459–469. [Google Scholar] [CrossRef]
- Tripathi, D. Practical Guide to Polypropylene; Rapra Technology LTD.: Shawbury, Shropshire, UK, 2002. [Google Scholar]
- Maier, C.; Calafut, T. Polypropylene: The Definitive User’s Guide and Databook; William Andrew: Norwich, NY, USA, 1998. [Google Scholar]
- Atluri, S.; Rao, V.K.; Dalton, C. A numerical investigation of the near-wake structure in the variable frequency forced oscillation of a circular cylinder. J. Fluids Struct. 2009, 25, 229–244. [Google Scholar] [CrossRef]
- Song, R.; Shan, X.; Lv, F.; Li, J.; Xie, T. A Novel Piezoelectric Energy Harvester Using the Macro Fiber Composite Cantilever with a Bicylinder in Water. Appl. Sci. Basel 2015, 5, 1942–1954. [Google Scholar] [CrossRef]
Figure 1.
Energy harvester assembly on a pipe (not to scale).
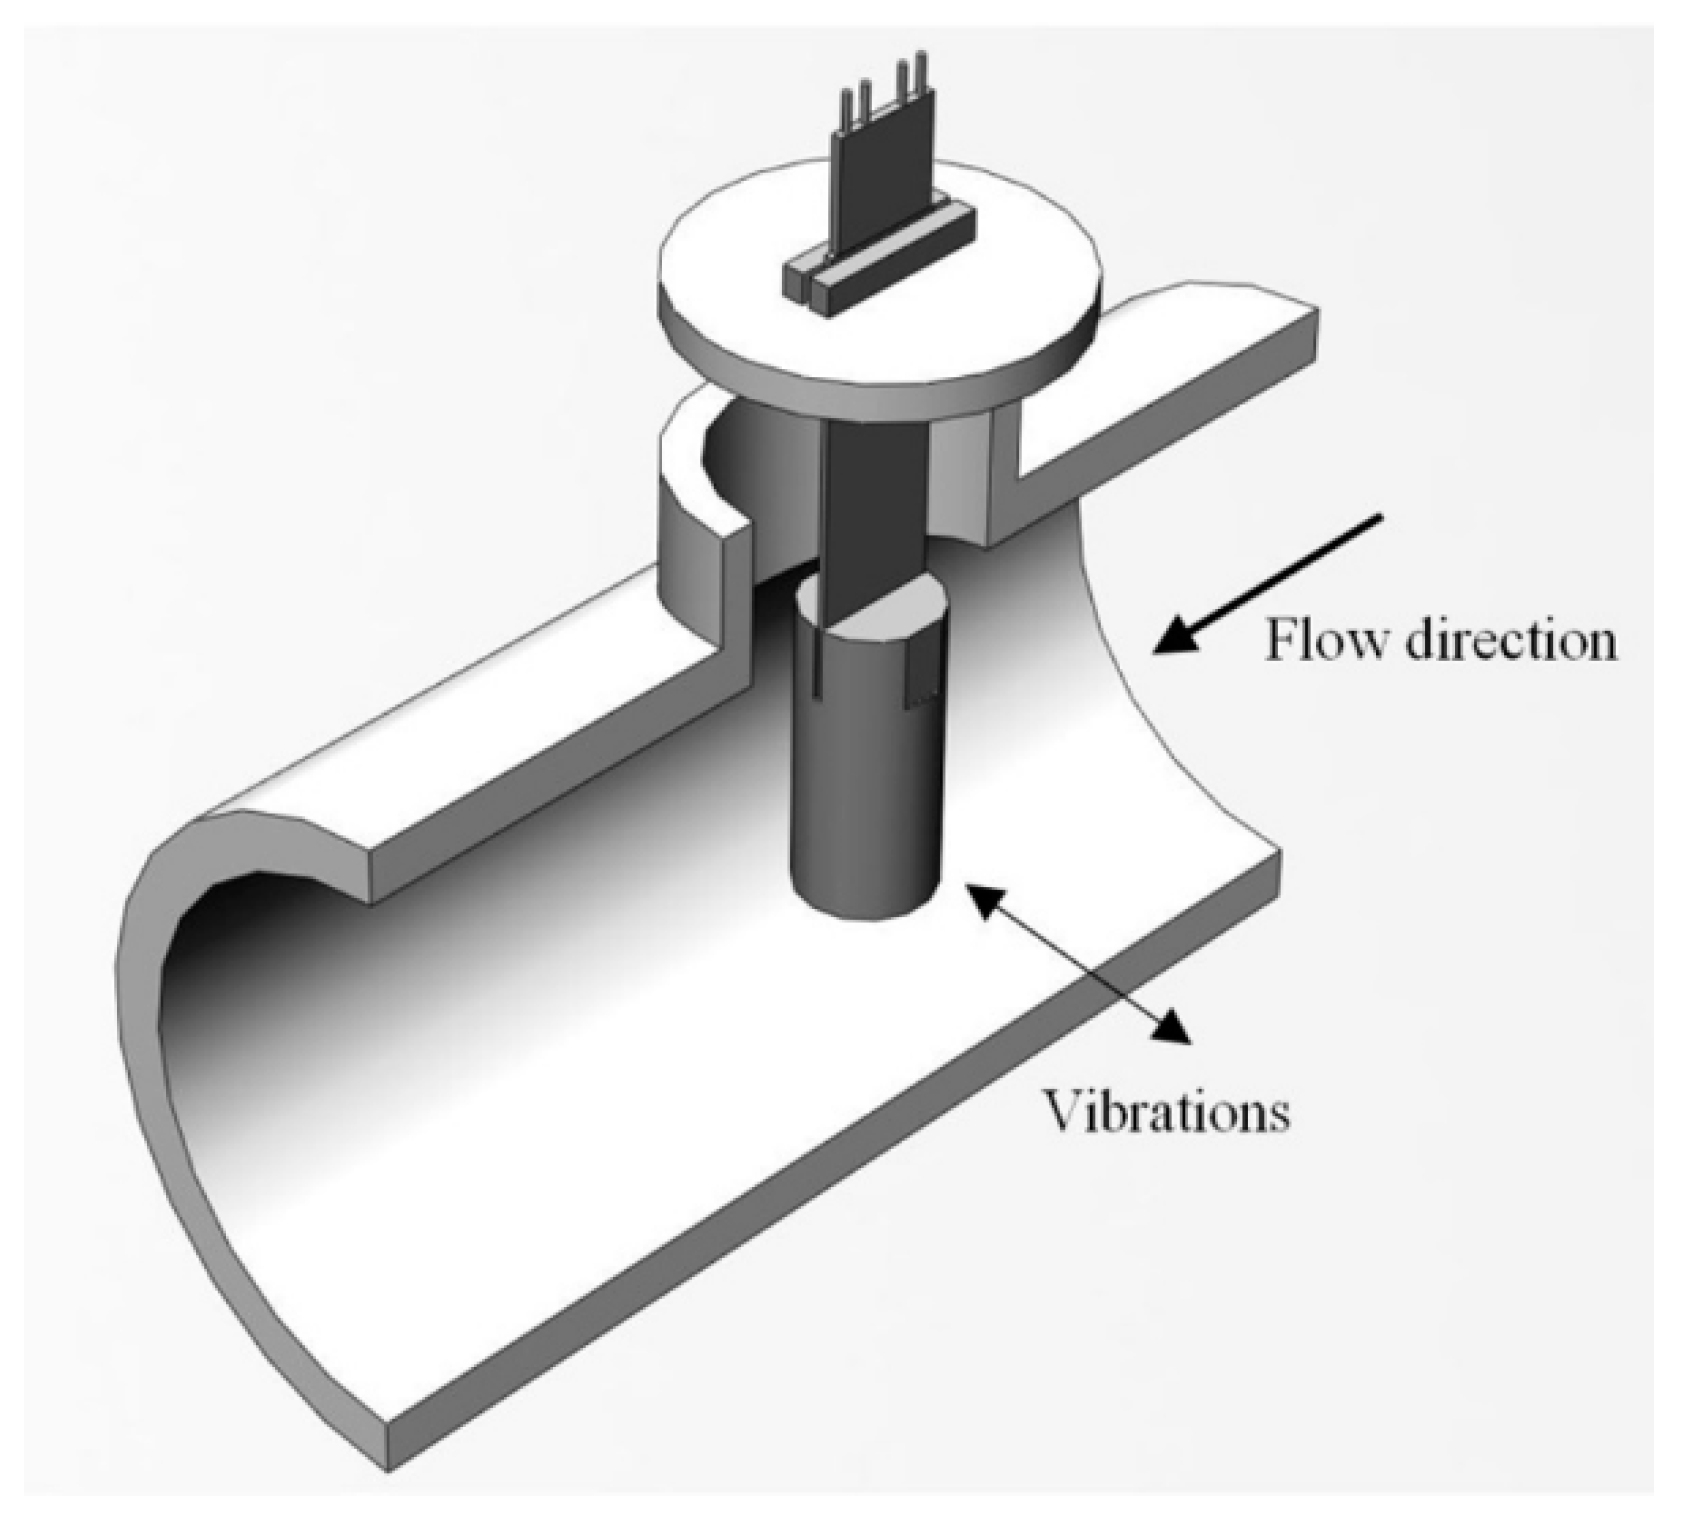
Figure 2.
Computational domain dimensions (not to scale).

Figure 3.
Mesh distribution around the cylinder.

Figure 4.
Drag coefficients comparison between the experiments and the current Computational Fluid Dynamics (CFD) simulations.
Figure 4.
Drag coefficients comparison between the experiments and the current Computational Fluid Dynamics (CFD) simulations.
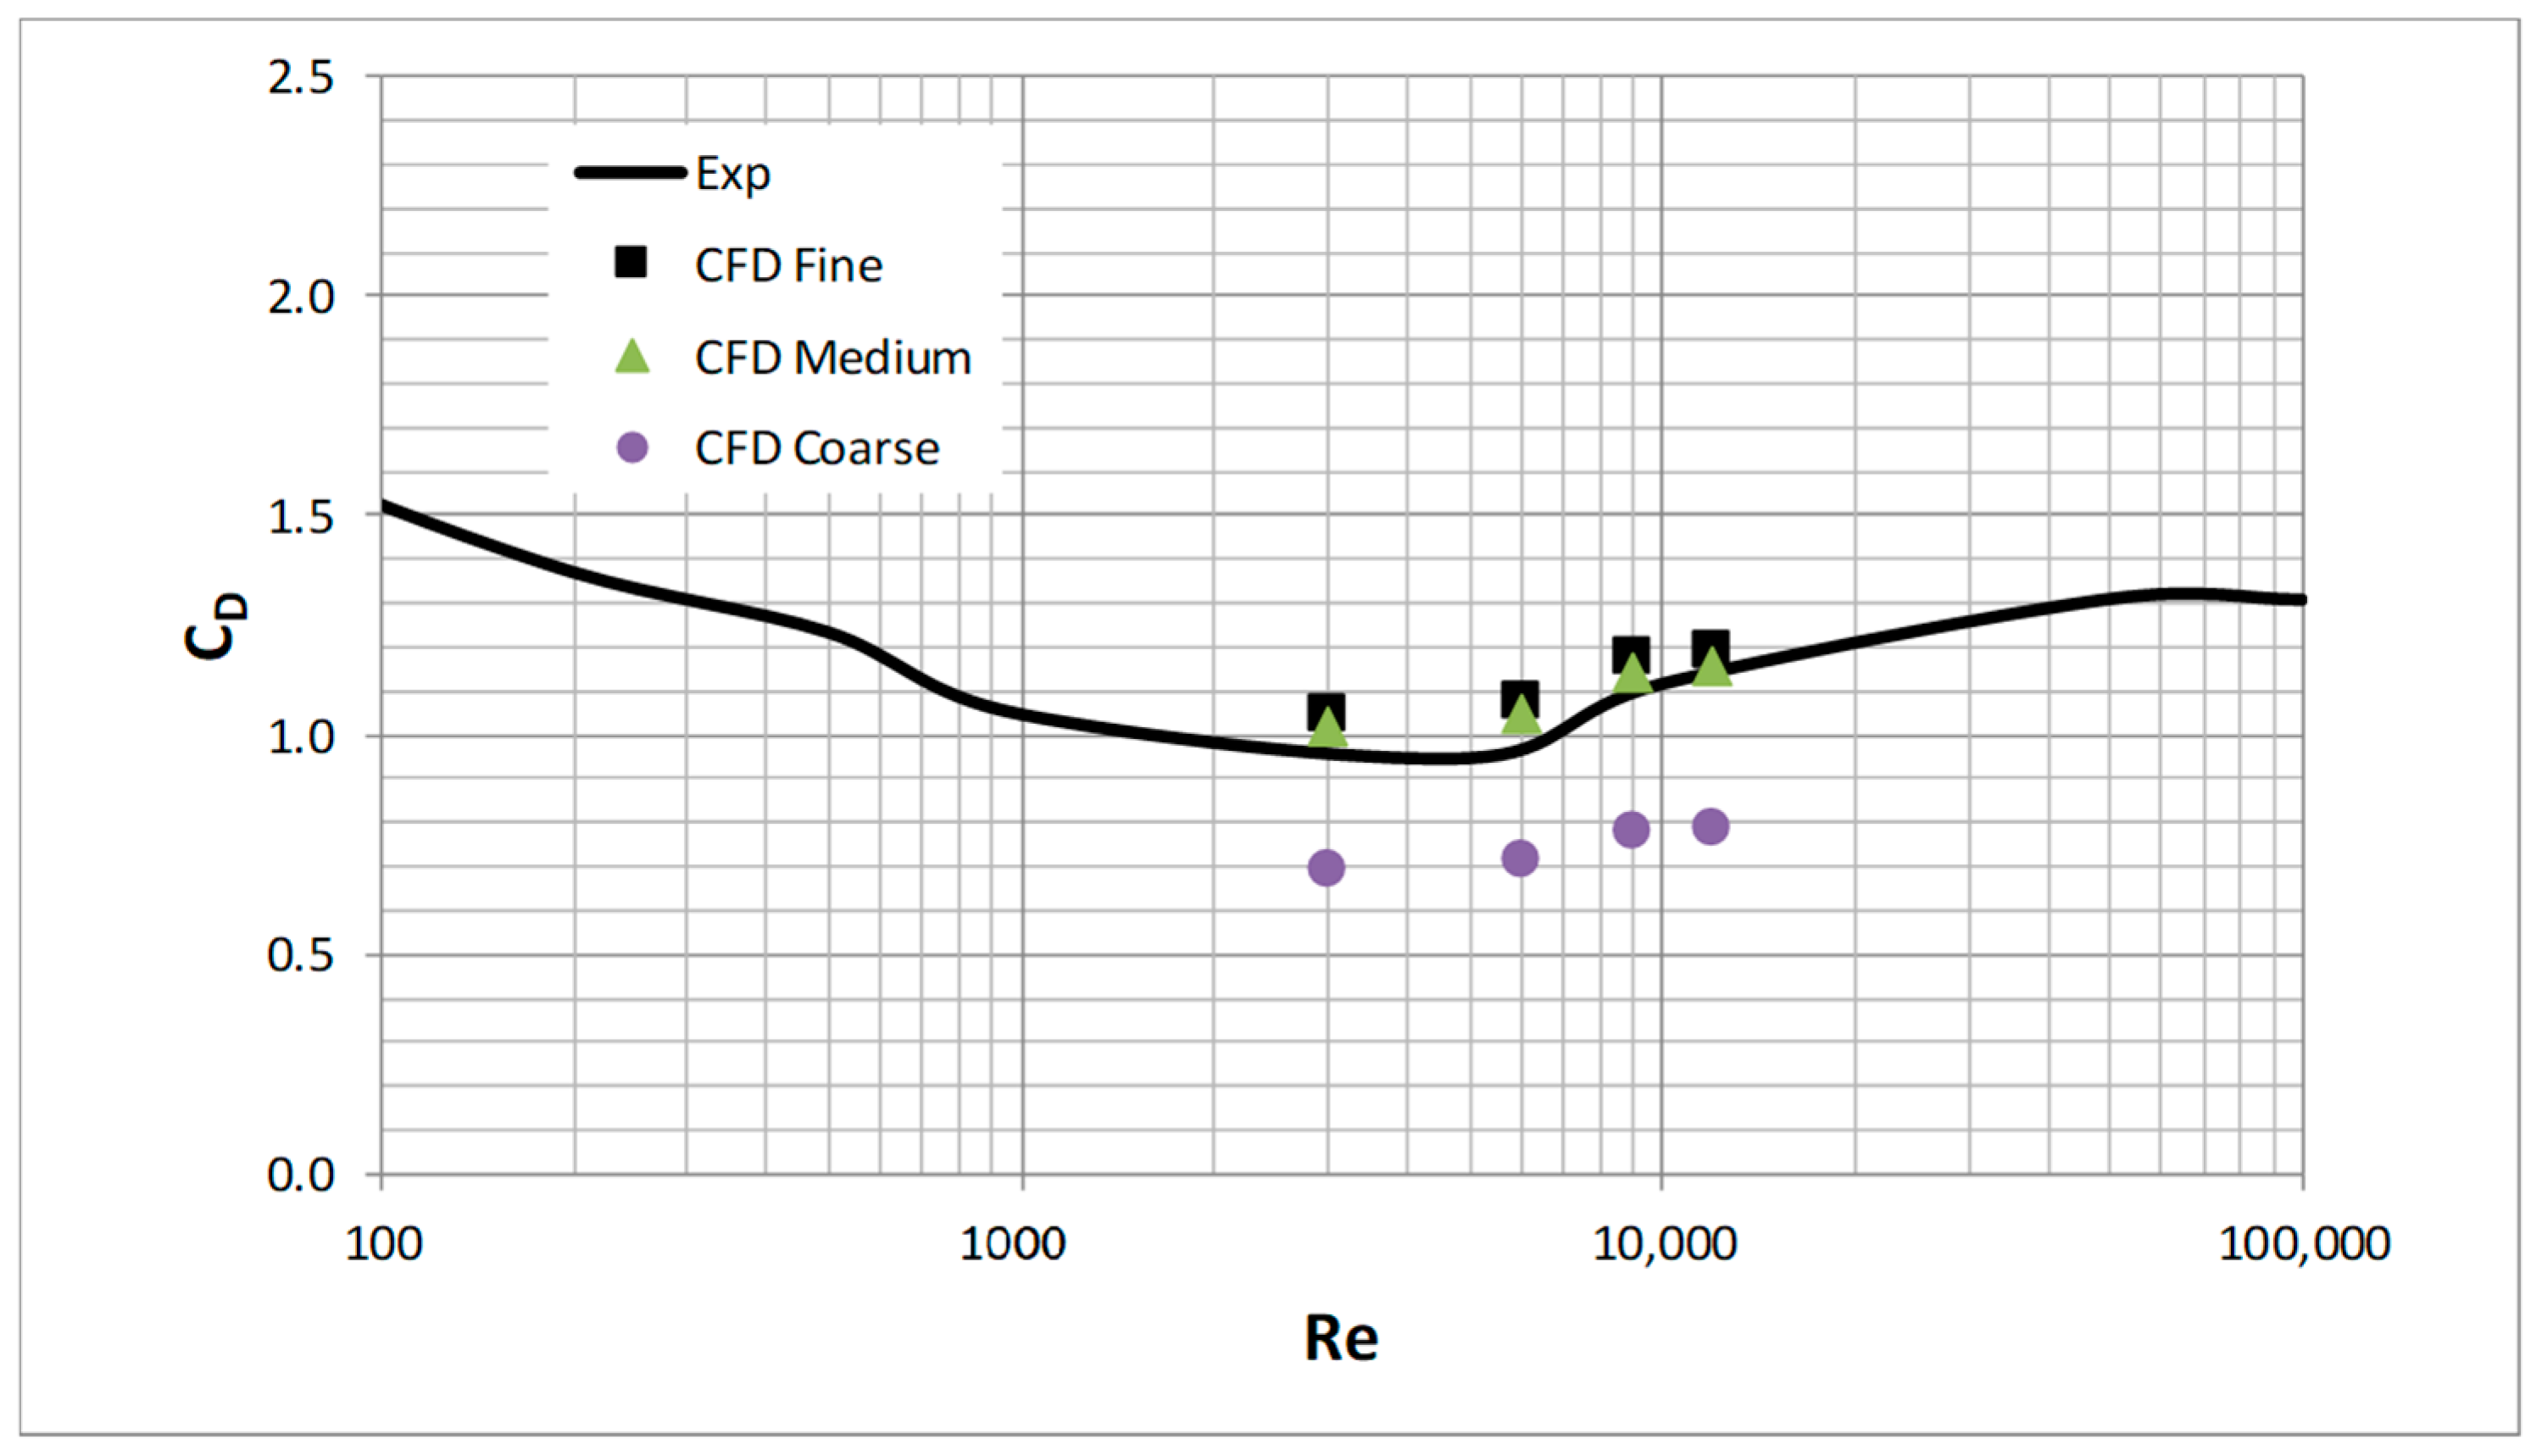
Figure 5.
Vortex shedding comparison behind a circular cylinder at different Reynolds numbers.
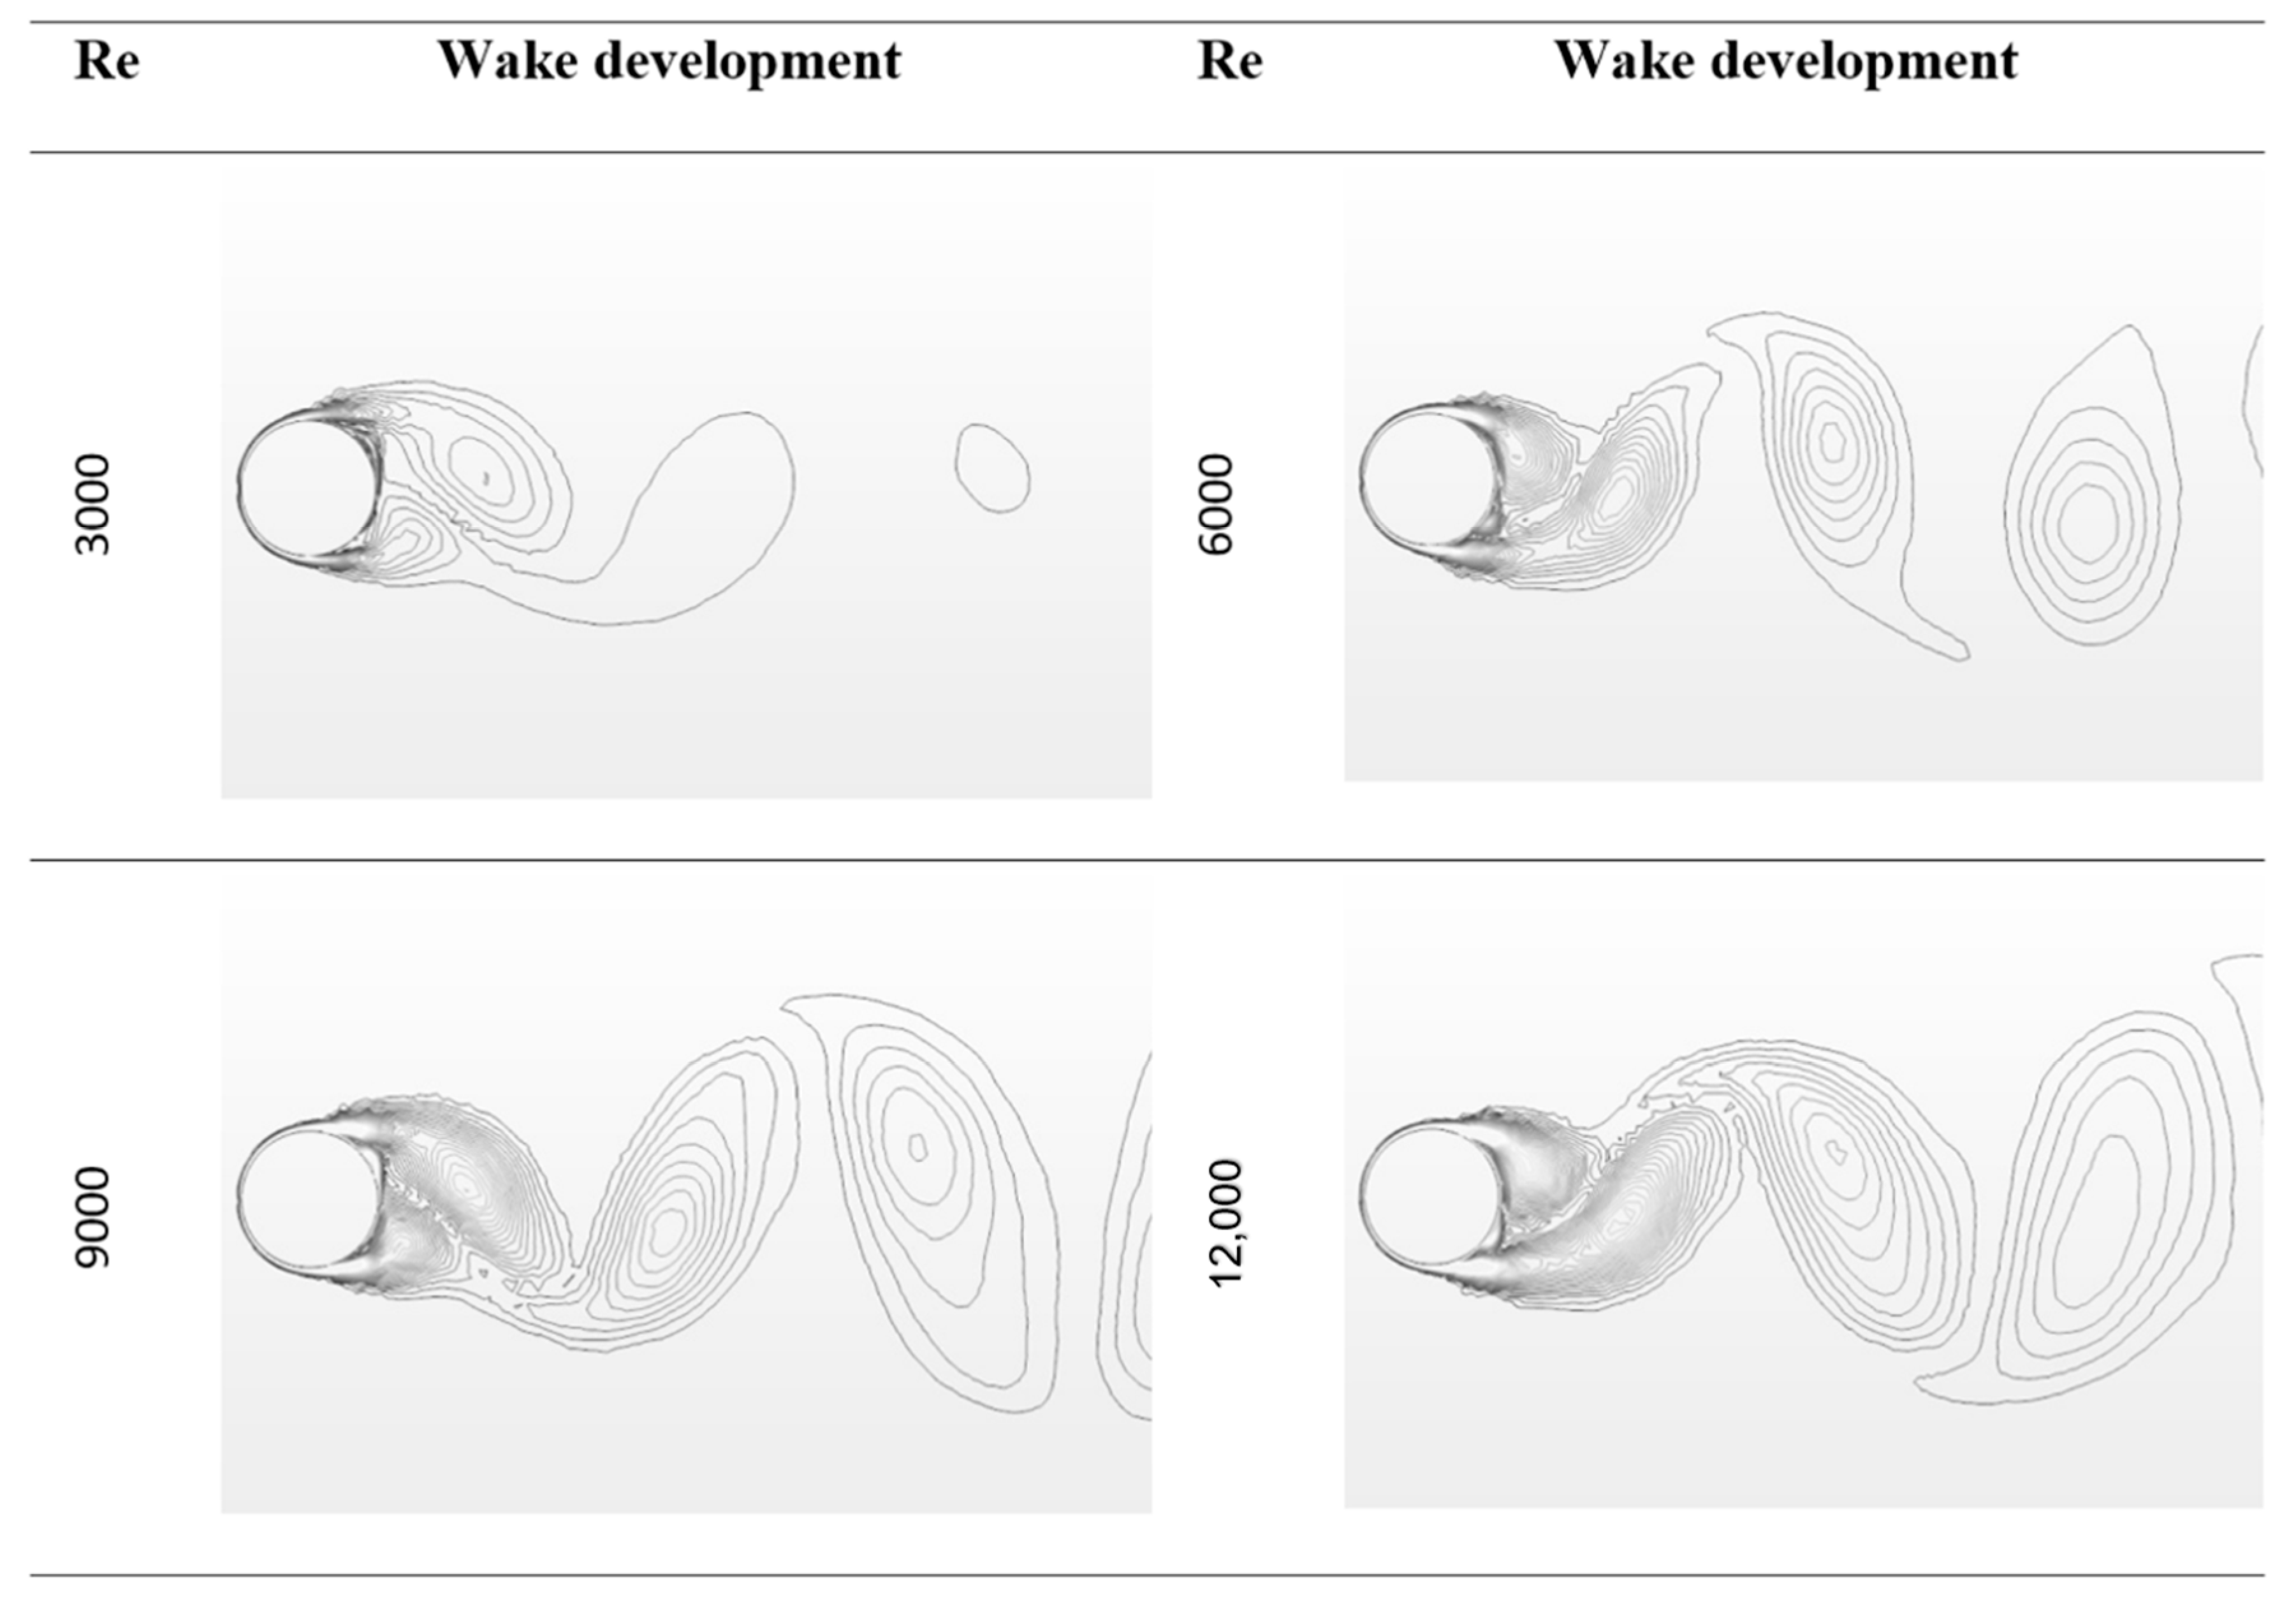
Figure 6.
Lift coefficient evolution for different Reynolds numbers.
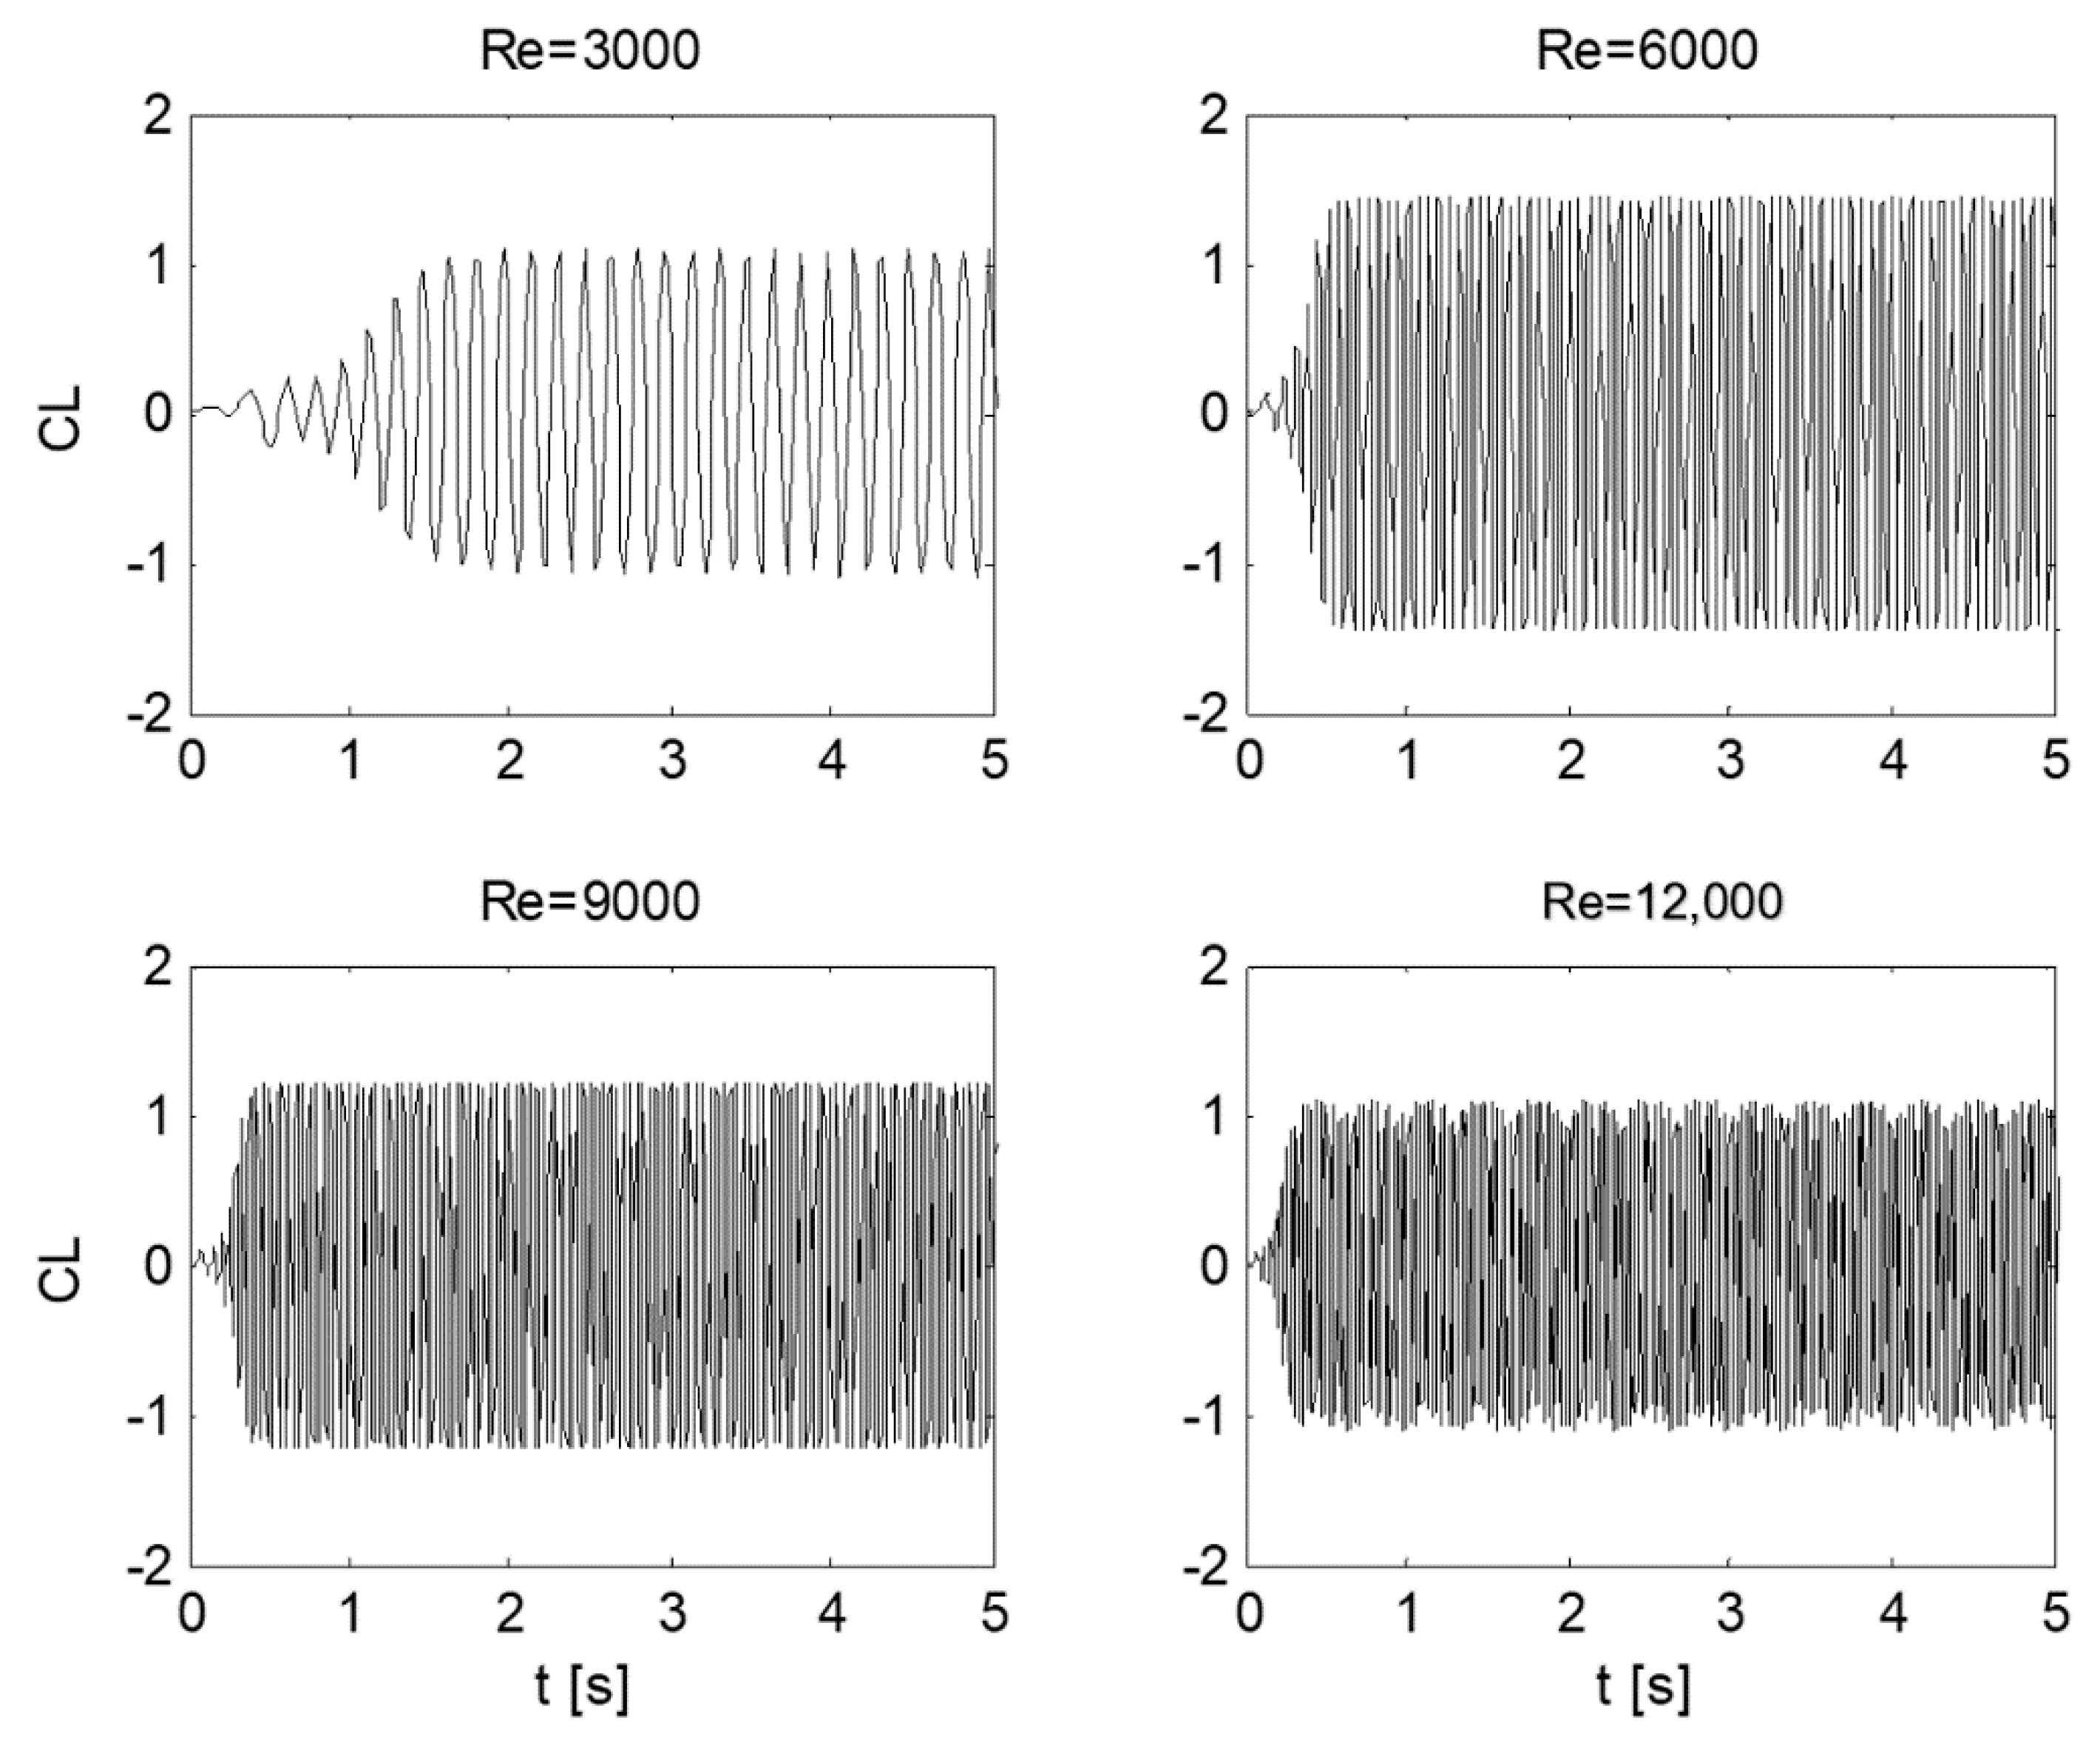
Figure 7.
Variation of Strouhal number, St, with Reynolds number, Re. Experimental data extracted from Norberg [47].
Figure 7.
Variation of Strouhal number, St, with Reynolds number, Re. Experimental data extracted from Norberg [47].

Figure 8.
Sketch of the harvester device (not to scale).
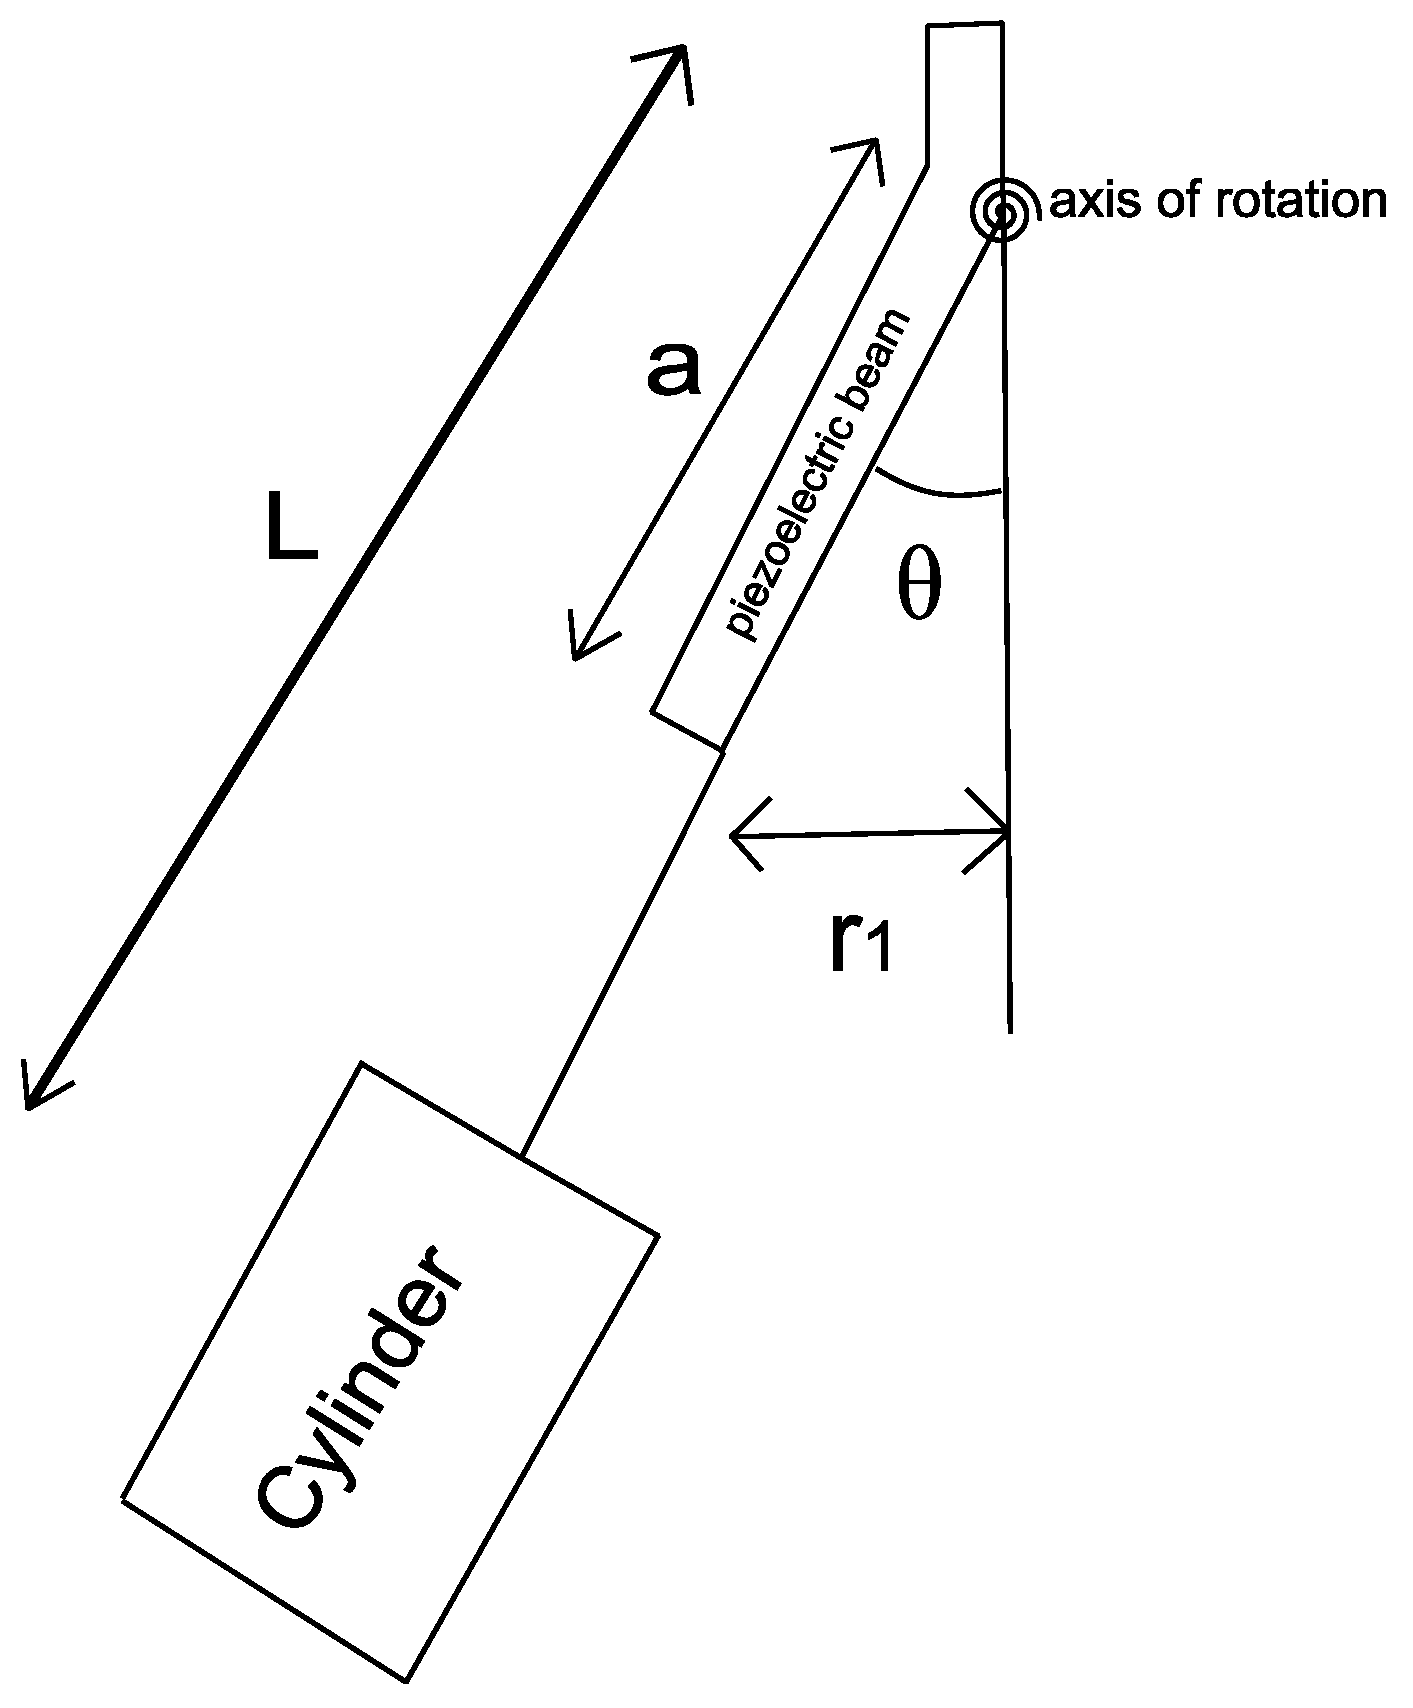
Figure 9.
Power results along the proportional gain of the control law Kp for different Reynolds numbers. The optimal Kspring is also dented for each Re case.
Figure 9.
Power results along the proportional gain of the control law Kp for different Reynolds numbers. The optimal Kspring is also dented for each Re case.

Figure 10.
Output voltage for each case at different Reynolds numbers.

Figure 11.
Power output of the energy harvester and the optimal kp for each Reynolds number.

Table 1.
Results of the mesh independency study.
| Mesh | Richardson Extrapolation | |||||
|---|---|---|---|---|---|---|
| Re | Coarse | Medium | Fine | RE | p | R |
| 3000 | 0.69 | 1.02 | 1.05 | 1.05 | 3.46 | 0.09 |
| 6000 | 0.71 | 1.05 | 1.08 | 1.08 | 3.37 | 0.10 |
| 9000 | 0.78 | 1.14 | 1.18 | 1.18 | 3.34 | 0.10 |
| 12,000 | 0.79 | 1.15 | 1.19 | 1.19 | 3.35 | 0.10 |
Table 2.
Model parameters.
| Name | Definition | Value | Units |
|---|---|---|---|
| Piezoelectric Material density | 5319 | kg/m3 | |
| Circular cylinder Material density | 920 | kg/m3 | |
| Fluid density | 997.5 | kg/m3 | |
| A | Section of piezoelectric | 0.01 | m2 |
| k | Piezoelectric stiffness | 123 | N/m |
| Ktrans | Transduction gain | 2 | - |
| C | Piezoelectric Capacitance | 1 | nF |
| Frictional coefficient | 0.01 | (N·m·s)/rad | |
| L1 | Length of layer | 0.0035 | m |
| L | Radius of gyration | 0.08 | m |
| Ha | Cylinder height | 0.05 | m |
| a | Force application distance point | 0.01 | m |
| α | Voltage induced bending factor | 100 | A·s/m |
| Jwt | Cylinder inertia moment | 4.2 × 10⁻⁷ | kg·m2 |
Table 3.
Model variables.
| Name | Definition | Units |
|---|---|---|
| CL,max | Maximum lift coefficient | - |
| V | Piezoelectric voltage | V |
| i | Piezoelectric current | A |
| t | Time | s |
| θ | Beam angle | rad |
| Vwater | Water speed | m/s |
| Rotational speed | rad/s | |
| Spring constant | - | |
| Proportional gain | A/V | |
| Tm | Moment generated by the piezoelectric | Nm |
| Fm | Piezoelectric force | N |
| Angular pulsation of the lift coefficient | rad/s | |
| r1 | Piezoelectric beam tip deflection | m |
| u1 | Reference of the piezoelectric deflection | m |
Table 4.
Energy harvester power output for all water velocity cases for all cases and their corresponding optimal values of the spring constant and proportional gain of the control law
Table 4.
Energy harvester power output for all water velocity cases for all cases and their corresponding optimal values of the spring constant and proportional gain of the control law
| Re | Vwater (m/s) | Power µW | Kp (Optimal) | Kspring (Optimal) |
|---|---|---|---|---|
| 3000 | 0.34 | 3.95 | 4.412 | 7.2671 × 10⁻⁹ |
| 6000 | 0.68 | 108.15 | 4.419 | 3.4594 × 10⁻⁸ |
| 9000 | 1.02 | 395.12 | 4.459 | 6.5404 × 10⁻⁸ |
| 12,000 | 1.36 | 996.25 | 4.452 | 1.1627 × 10⁻⁷ |
© 2018 by the authors. Licensee MDPI, Basel, Switzerland. This article is an open access article distributed under the terms and conditions of the Creative Commons Attribution (CC BY) license (http://creativecommons.org/licenses/by/4.0/).
Share and Cite
MDPI and ACS Style
Aramendia, I.; Fernandez-Gamiz, U.; Zulueta Guerrero, E.; Lopez-Guede, J.M.; Sancho, J. Power Control Optimization of an Underwater Piezoelectric Energy Harvester. Appl. Sci. 2018, 8, 389. https://doi.org/10.3390/app8030389
AMA Style
Aramendia I, Fernandez-Gamiz U, Zulueta Guerrero E, Lopez-Guede JM, Sancho J. Power Control Optimization of an Underwater Piezoelectric Energy Harvester. Applied Sciences. 2018; 8(3):389. https://doi.org/10.3390/app8030389
Chicago/Turabian StyleAramendia, Iñigo, Unai Fernandez-Gamiz, Ekaitz Zulueta Guerrero, Jose Manuel Lopez-Guede, and Javier Sancho. 2018. "Power Control Optimization of an Underwater Piezoelectric Energy Harvester" Applied Sciences 8, no. 3: 389. https://doi.org/10.3390/app8030389
Note that from the first issue of 2016, this journal uses article numbers instead of page numbers. See further details here.