SCoPE: Service Composition and Personalization Environment


1
Instituto Federal Farroupilha, Santa Maria 971110-767, Brazil
2
Faculty of Science and Technology, NOVA University of Lisbon, and UNINOVA-CTS, 2829-516 Monte Caparica, Portugal
*
Authors to whom correspondence should be addressed.
Appl. Sci. 2018, 8(11), 2297; https://doi.org/10.3390/app8112297
Submission received: 25 October 2018
/
Revised: 12 November 2018
/
Accepted: 13 November 2018
/
Published: 19 November 2018
Abstract
:Current demographic trends suggest that people are living longer, while the ageing process entails many necessities calling for care services tailored to the individual senior’s needs and life style. Personalized provision of care services usually involves a number of stakeholders, including relatives, friends, caregivers, professional assistance organizations, enterprises, and other support entities. Traditional Information and Communication Technology (ICT) based care and assistance services for the elderly have been mainly focused on the development of isolated and generic services, considering a single service provider, and excessively featuring a techno-centric approach. In contrast, advances on collaborative networks for elderly care suggest the integration of services from multiple providers, encouraging collaboration as a way to provide better personalized services. This approach requires a support system to manage the personalization process and allow ranking the {service, provider} pairs. In accordance with these requirements, an Elderly Care Ecosystem (ECE) framework and a Service Composition and Personalization Environment (SCoPE) are proposed. ECE provides the context for the personalization method which is based on the match between a taxonomy of care needs and the {service, provider} pairs, and the calculation of a service adherence index to identify suitable services and corresponding providers. To demonstrate the feasibility and applicability of SCoPE, a number of methods and algorithms are presented. Furthermore, an illustrative scenario is introduced in which {service, provider} pairs are ranked based on multidimensional assessment method and composition strategies are based on customer’s profile and requirements.
1. Introduction
The increasing demographic shift related to elderly population represents a striking fact in the recent history of humanity. The senior population above 80 years old is expected to increase by 205% in 2050 when compared to 2017 [1]. At the same time, elderly are supposed to exceed teenagers in various world regions [2], which highlights the relevance of research on the aging process in our societies [1,3].
With aging, when the objective is to keep seniors healthy and enjoying a high quality of life, specific care needs appear. Each individual elderly person may require particular services (e.g., care and assistance) according to his/her life context. In fact, characterizing a person as elderly involves more than age as a determinant factor. Singular elements of the aging process, such as life settings, individual capacities, and abilities, contribute to characterize an elderly person. As a result, a specific care service might be sufficient for an individual and very futile for another. This brings up the necessity of personalized and composite services in this sector.
The notion of personalized service typically involves a composition of various basic services, possibly offered by different providers, which together fit the needs of each individual [4,5,6,7]. Therefore, customizing a (composite) service includes an understanding amongst customer and suppliers (and all other involved stakeholders) through which they share data to allow an adequate adaptation of the service offer [8,9,10].
The idea of a collaborative business environment for elderly care can help on the integration of various services from different service providers [11,12,13]. Likewise, finding the set of services and corresponding service providers that best cover the senior’s life style, needs, and desires is a challenge. Although related approaches can be found in the literature, there is a lack of a comprehensive framework that manages the process of service composition and evolution for elderly care in a collaborative environment.
The Collaborative Networks discipline [14] provides a base to help addressing these challenges and design the conceptual model of an Elderly Care Ecosystem (ECE) (Baldissera et al., 2017a). In this context, this work focuses on a method for service personalization and composition with the aim to better attend the customer’s care needs. To facilitate the process of finding the best {service, provider} pairs in the context of ECE, an environment called Service Composition and Personalization Environment (SCoPE) is designed to personalize and compose services based on service filtering, service adherence calculation, and service composition strategies.
The remainder of this article is organized as follows: the research methodology is presented in Section 2. The trends and requirements in personalized care ecosystems are briefly summarized in Section 3. Section 4 presents the ECE conceptual model and its components. The customer profile identification in the context of a collaborative network environment is described in Section 5. Section 6 introduces the main algorithms of SCoPE, highlighting their key steps: scope filtering, service adherence calculation, and service rating and composition. A practical application case is discussed through Section 5 and Section 6. Finally, conclusions and directions for future work are presented in Section 7.
2. Research Methodology
The research approach applied in this work follows the steps of the constructive research method [15]. This design science method helps to validate applied research in the area of the chosen domain, through the building of some artifacts that cope with the resolution of a relevant societal problem and showing how the solution is new or better than the previous ones.
The research is supported on the body of knowledge of the Collaborative Networks discipline [14] and focuses on providing methods and tools that contribute to the service composition and evolution of collaborative networks. While service composition plays a fundamental role during the construction of virtual organizations, evolution aims to achieve better solutions over time, considering changes occurring in the lifestyle of elderly, in the environment, or in the care business itself.
A set of Elderly Care Ecosystem (ECE) definitions and a template of customer (elderly) profile identification in the context of a collaborative network environment are presented with the purpose of demonstrating the theoretical relevance of the proposed solution. Moreover, methods and algorithms for classifying personalized and composited services are proposed to implement the Service and Composition Environment—SCoPE framework.
To make tangible the practical relevance of the proposed solution, we applied our framework in a case study involving a non-trivial scenario. The evidence collected during the case study provided relevant information to support better decision-making during Collaborative Networks Organizations (CNOs) life-cycle management through interactions with elderly care services organizations.
3. Background and Literature Review
In this section, a number of key concepts, relevant for service personalization in elderly care ecosystems are briefly presented, such as business services, collaborative networks, collaborative business ecosystem, and service composition and personalization.
Business Services: the concept of business service has been developed mainly in two areas: computer science and management. For the Information and Communication Technology (ICT) community, a software or technical service represents a computational action executed in response to a trigger event. On the other hand, from the business perspective, business services add value to a customer [16,17,18]. According to the same authors, it is logical to separate these two views, being worth noting that business service delivery is performed through business process execution. The activities of a business process can be done automatically (invocation of some software service) or manually (human-executed activities). Nevertheless, the concept of business service itself is not clearly defined, and different authors offer slightly different notions. Table 1 summarizes some partial definitions from the literature.
From the definitions presented in Table 1, it can be inferred that care and assistance services for elderly can be considered as a kind of business service. The notion of business process corresponds to the management of services execution, involving in this context both software services and or manual services.
In Figure 1, software services fundamentally represent software applications that define part of a system which can be “consumed” distinctly by numerous objects [24]. Thus, software services execute elements that perform business processes activities. Manual services correspond to services provided to the customers which involve some human interventions [25]. Hence software services and manual services support the business process execution, materializing the notion of business service delivered to the customers [24].
Many initiatives on services for elderly care have been mostly focused on isolated services development, considering a single service provider and often presenting an extreme techno-centric idea. However, through collaboration to overcome their weaknesses and strengthen their expertise, companies can more efficiently respond to current challenges and deliver better integrated services, resulting in the acquisition of a competitive advantage [11,26,27]. Additionally, in the elderly care domain, personalized services should cover the specific needs of each user, respecting the elderly individuality, and the evolution of limitations that come as the person and life environment change [17,28,29].
Collaborative Networks: a Collaborative Network (CN) is an “alliance constituted of a variety of entities (e.g., organizations and people) that are largely autonomous, geographically distributed, and heterogeneous in terms of their operating environment, culture, social capital and goals, but that collaborate to better achieve common or compatible goals, and whose interactions are supported by a computer network” [14].
Various authors have shown that membership in a collaborative environment offers a number of advantages to the engaged organizations, including “survivability in a context of market turbulence, acquisition of a larger apparent dimension, access to new or wider markets and new knowledge, sharing risks and resources, joining of complementary skills, reaching high level of agility, and better achieving common goals” [30,31,32]. As a result, many examples of collaborative networks can be found in society, including supply chains, virtual teams, virtual organizations and virtual enterprises, professional virtual communities, industry clusters, business ecosystems, collaborative virtual laboratories, etc.
Examples of business areas that have benefited from the adoption of the collaborative networks paradigm include the classical supply chain in automotive industry [33,34,35], the agribusiness sector [36,37,38], the transport sector [39], the smart grid sector [27,40], water management [41,42], biodiversity data providers [43], ICT and aging [44,45], etc. More specifically, for the elderly care domain examples can extend to home safety and care, localization and mobility assistance, health monitoring, rehabilitation and disabilities compensation, caring and intervention on medication or nutrition, learning support systems, social and entertainment services, adjusted working spaces, intergenerational relations, assisted living facilities (e.g., with sensors, smart home appliances, and service robotics), senior intelligent villages, etc. [11].
A growing number of virtual communities or social networks specifically for seniors can already be found on the Internet. Some examples are shown in Table 2, this sample includes 24 social networks offering services exclusively for seniors, ranging from leisure, dating, and games, to health and sports. Some of these cases go beyond a simple social network and present some characteristics of a virtual professional community, aiming at supporting active aging.
Most collaborative networks manifestations are usually business-oriented and present clear organizational structures—Collaborative Networked Organizations. Other more spontaneous collaborative networks can emerge, as a result of people “spontaneously” grouping together to enhance an overall goal by contributing individually and voluntarily. These CNs are known as Ad-hoc Collaboration forms. For instance, searching for a missing group in a mountain or rescue missions after a hurricane that passed through a city, or mass collaboration initiatives, are typical examples of this sort of CNs. These two main kinds of CNs represent the first level of a collaborative networks’ taxonomy (Figure 2).
Advances in Internet and pervasive computing have boosted collaboration possibilities and enabled or induced the emergence of new collaboration forms. However, the rapid formation of a CN to respond to a business opportunity also faces a number of challenges, whereas the two most relevant are: (i) dealing with the large heterogeneity (technological infrastructures, business practices, culture, etc.) of the autonomous participants involved in the process and (ii) the time needed to build trust relationships [32].
One approach to overcome these challenges is to establish “long-term strategic” alliances. In this direction the concept of Virtual Organizations Breeding Environment (VBE) has been introduced as an “association of organizations and the related supporting institutions, adhering to a base long-term cooperation agreement, and adopting common operating principles and infrastructures. The main objective of this association is to increase the preparedness of its members towards rapid configuration of temporary alliances for collaboration” [46].
Several aspects must be considered by an organization when deciding to join a strategic network like a VBE. As an illustration, a sample of the aspects that positively impact the adoption of business models based on VBEs is shown in Table 3 [31,47]. The involvement of an organization into a VBE might have two main purposes: improving the member’s management capabilities or improving the strategic-level of the business operation [31].
While participation in a VBE has advantages, as illustrated in Table 3, there are also some challenges. For instance, we can point out the fact that VBE partners may have to share activities and internal company information. This information can be used by organizations that do not follow proper ethical principles which may cause losses to the company [13].
Among the VBEs, we highlight the Business Ecosystem sub-class which is inspired on biological ecosystems, and is a relevant category of long-term strategic networks. This concept suggests “an economic community supported by a foundation of interacting organizations and individuals—the organisms of the business world. This economic community produces goods and services of value to customers, who themselves are members of the ecosystem” [48].
A business ecosystem (and thus a care ecosystem as well) can be identified as a “particular case of a VBE, which tries to preserve local specificities, tradition, culture, and frequently benefit from local government incentives, involving a complex interplay of collaboration and competition around producers, consumers, regulators, and support entities” [32,49].
Collaborative Business Ecosystem: an example of business ecosystem is given by the term Digital Business Ecosystem [3], which is also inspired on biological ecosystem, but with a stronger emphasis on the technological support perspective. On the other hand, based on advances in the discipline of Collaborative Networks, and current demanding market challenges (better services and prices, market survival, increase of competitors, etc.), the term Collaborative Business Ecosystem (CBE) was introduced to emphasize the “collaborative environment” perspective [16,50,51]. A CBE supports organizations which must collaborate to overcome their weaknesses and strengthen their expertise and skills, to offer better integrated (composite) services and acquire competitive advantage with the main focus on customer satisfaction.
A CBE is thus supposed to provide a variety of software services and manual services that can be combined to fulfill the needs of each customer. This requires proper management of business services composition and integration, as explained in the next Section. By adopting this approach, we can say that care and assistance services for elderly should (likely) result from the collaboration among various entities, possibly including governmental and non-governmental organizations, individual or cooperative professionals, family, friends, caregivers, etc., which in consequence calls for a supporting collaboration environment.
Care Services Composition: building business solutions typically requires combining multiple available business services. A service composition is an aggregate of services (atomic or integrated) collectively composed to deliver a particular service pack or business process [52]. These composite (or integrated) services can be in turn recursively composed with other services into higher level solutions, (and so on), constituting an essential part of service provision. The novel (composite) service is adding value that was not existent in the atomic services.
In the CBE context, a single provider probably might not be able to cover all care needs of a customer, since a service provider typically has its area of service application and a customer typically may have needs (required services) of various areas. As such, service providers may get together in alliances aiming at the creation of composite services which can meet the entire customer’s care needs.
As a composite service may involve several service providers, require various devices and a support infrastructure, depend on another service or resource, involve people and frequent information exchange, etc. [10], managing all these elements and relationships with efficiency is indeed a significant challenge.
Care Service Personalization: the notion of service personalization means that a service is tailored to fit each individual [4,5,6,9,53]. For several authors, e.g., [4,8,9], personalizing a service covers an agreement between customers and providers (and possibly other involved stakeholders) through which they share information to be organized intelligently and adaptively.
The effective establishment of a CBE requires, in fact, a proper understanding of the customers’ profile in order to ensure that offered services are both competitive in market terms and relevant to the individuals. Some customers may require distinct types of care services to satisfy their particular needs, which lead to the notion of personalized services.
If the elderly and family are satisfied with the provided service, they feel like an exclusive customer and are inclined to keep loyalty towards the service provider [4]. Collecting feedback information in this context can help service providers to deliver better-personalized services. Direct communication with customer representatives remains the most preferred channel for consumers and small companies with few customers. In this scenario, it is “easy” to personalize customers services [8]. However, businesses (e.g., care service providers) with many customers need to seek multiple information sources to achieve personalization, using both human interventions and automatized mechanisms. These feedback acquisition transactions can be efficiently handled through ICT strategies like Internet of Things (IoT) devices and tele assistance [11,54].
In the elderly care domain, it is primordial to understand the customer, her/his limitations, and longings, as well as the elderly living environment and associated stakeholders [7]. As a consequence, a personalized service package is likely to be provided by some providers working together, acting as a virtual organization.
Care Service Evolution: service evolution is the process of maintaining and evolving existing care services to cater for new requirements and technological changes [55]. The CBE needs to constantly monitor the context and, for each new context change, to analyze the situation, plan the service evolution, and implement the evolution to fit that context.
An evolutionary ambient assisted living system is suggested by O’Grady, Muldoon [28] following this vision, but their focus is on a techno-centric evolution and adaptability of the system, and ignore the service providers and stakeholders. More recently, new developments appear to address user-stakeholders-centric services, combined with ICT, to offer services non-dependent of a place and time [18,56,57].
Under this perspective, the notion of evolutionary service [5,11,18,53] means that the provided service adapts to the customer’s needs, environment and any changes that affect the customer’s life context, as well as CBE demands, new regulations, and technological requirements.
In the literature, researchers present partial solutions for service composition [29,58], service personalization [11,21,59] and service evolution [28,55], mostly considering single service providers and comparison between isolated services (not combined with the service provider). In [60], service selection and ranking in cross-organizational business processes collaboration is considered. In this work, different parts of a business process are performed by different organizations (services providers in our approach). The focus of [60] is based on business strategies in the industrial sector. Our proposal is similar but emphasizes a user-centric view of elderly care (elderly profile and requirements) and integrates providers of different nature (regulators, support entities, and service providers) and categories (public, private, non-governmental, and mixed).
4. Elderly Care Ecosystem and Related Definitions
An Elderly Care Ecosystem (ECE) can be considered a particular case of a collaborative business ecosystem, specially designed to support the management of service providers, services, and customers (elderly people and relatives). The main idea of ECE is to have an environment to facilitate the personalization, composition, and evolution of care services. To construct the ECE framework, a number of information elements is necessary. This information fundamentally describes available providers and services in the ECE, the customers, and the care needs/goals taxonomically organized. In [10], we describe a detailed conceptual model for the ECE. In the following, we present the fundamental definitions of this model that are used during the description of Scope method (see Section 6):
Definition 1.
Elderly Care Ecosystem—represents the system that supports the creation, management, and analysis of virtual organizations to attend customer’s needs. In other words, a kind of breeding environment for virtual organizations in elderly care. An ECE is composed of two subsystems, defined as:
whereis the information subsystem that maintains the ECE objects andis the evolution subsystem that identifies opportunities for service personalization and evolution and ranks potential services and service providers to attend the new opportunities. Anis described as:
whereis a set of virtual organizations existing in the ECE,represents the service providers available in the ECE,is the set of services offered in the ECE,the set of customers,the set of customer’s requests, and TX is the taxonomy of services and care needs, which is unique for the ECE, but at the same time dynamic. We describe the elements of anin the following.
Defintion 2.
Virtual organization (VO)—represents an alliance of independent organizations sharing resources and skills that collaborate to achieve a common goal [61,62,63]. It represents a temporary consortium of organizations that come together to deliver an integrated care service. We define a particularas:
whereis a set of service providers,is a set of services provided byrepresents a set of customers, andthe customer’s requests.
Definition 3.
Service providers (SP)—represents a set of organizations (physical or virtual) that provide care services. Therefore, the relation SP-r-SE:holds. A service provider is characterized by one or more areas of actuationand its trustworthiness rating. Thus, a service provideris defined as:
whererepresents a set of actuation areas, andis the trustworthiness of the service provider. We assumebased on the four life settings described by Camarinha-Matos, Rosas [11]. Trustworthiness is given by a combination of the customers rating and the reliability level calculated by the ECE framework management. The scale assumes one as the lowest and five as the highest level of trustworthiness.
Definition 4.
Services (SE)—represent the set of services offered in ECE. Each service represents a business value provided to a customer by a service provider [17]. A service can be either atomic or integrated (combining several other services). Service characteristics include service goals, service rating, geographical area of coverage, a business process, applicability constraints, suggestions of application to strengthen the preferences of the customer, and necessary or provided resources. A serviceis defined as:
whereis the set of goals the service attends based on the taxonomy of care needs (see Definitions 7 and 8),is a set of restrictions applied to the provision of the service. The setis the set of dependent services, whereindicates the service is atomic, otherwise it is integrated. Service restrictions are applied considering a predefined restriction listfor the ECE. Thus, we assume. The reputation of a service (rep) is expressed by a value in the scale 1…5, where 1 represents the lowest reputation and 5 the highest one. We assume that there is a system that computes the reputation of the service.
Definition 5.
Customers (CU)—represent the set of entities that consume the services provided by the VOs in ECE. Each customer is associated with a unique profile that follows a template configured by the ECE administrator. Typically, a template includes personal data, lifestyle aspects, customer’s limitations and general data. A customeris defined as:
whereis a customer profile based on a template,is a set of impairments and relevant individual constraints.
The template involves the main information elements identified in ECE to build a customer profile, for instance, personal data (including his/her lifestyle specification), customer’s available resources, one or more persons responsible for them (identified as guardians), etc. More details about customer’s profile can be found in (Baldissera et al., 2017b).
The impairments involve, for instance, information about one or more locations to deliver the service (described by geographical area), the limitations that an elderly might have, namely: human and environment constraints (if these exist), identified as special conditions: for instance the maximum investiment and the presence of chronic diseases.
Definition 6.
Taxonomy of Care Need Goals (TX)—representing a taxonomy of care need goals used in a specific ECE. A taxonomyis defined as:
whererepresents the goals,represents a parent relation between two goals, andis the inverse relation of parent relation representing refinement relations. Given, the following formula holds:
In order to build the taxonomy of care need goals, a number of research projects on ICT and aging were analyzed and used as the baseline for the care needs identification. From the results of these projects, which included extensive field analysis, the necessary requirements for designing the ECE are identified.
In this analysis we particularly feature the ePAL project (Extending Professional Active Life) which established “a strategic research roadmap focused on innovative collaborative solutions and ensuring a balanced post-retirement lifestyle” (Camarinha-Matos et al., 2012), the BRAID project (Bridging Research in Ageing and ICT Development) (Camarinha-Matos et al., 2013) which has built a “comprehensive RTD roadmap for active ageing by consolidating and extending existing roadmaps in close interaction with relevant stakeholders”, and the AAL4ALL project (Ambient Assistance Living for All), which conducted a large “field survey aimed at both characterizing current users of AAL technologies” (Camarinha-Matos, 2015).
Figure 3 illustrates the care needs taxonomy adopted in ECE. The global goal for the customer is Well-being, and sub-goals are divided in Independent living, Useful, and Healthy. This taxonomy of care needs is used by customers to map their requirements to a certain goal level and by service providers to indicate which goals they can attend based on the services they are declaring in ECE. For example, the need for social relationship expressed by an elderly (customer) could be mapped to the node Useful → Occupation/Socialization → Entertainment/Relationship. Similarly, a service provider that offers health services in the rehabilitation area can map a service to Healthy → Cognitive Rehabilitation, for instance.
Goals (G) can be abstract or concrete. Abstract goals are only informational and cannot have any direct association with customer care needs or services. The higher the goal in the hierarchy the more abstract it is. Thus, top goals are devoted to express broad intentions declared by customers and service providers. The nodes representing goals in the taxonomy are managed by the ECE administrator that updates the taxonomy by adding/removing, enabling/disabling nodes according to emerging categories of care needs and services.
The taxonomy is used during the process of ranking service providers.
Definition 7.
Care Needs (CA)—represent a set of goals related to the care needs taxonomy associated with a relevance scale. We define a care needas:
whereis a goal in the taxonomy, andis the relevance degree of the goal for the customer. We adopt a fuzzy scale for
When the customer expresses his/her request and care needs, the identified nodes are activated (for identifying the potential {service, provider} pairs) for this customer. When a provider registers a service into the ECE, it suggests a level of coverage () for a particular goal (or more than one) in the taxonomy of care need goals.
Definition 8.
Request (RQ)—represents a solicitation of services made by a customer. We define a requestas:
whereis the customer,is a care need () andis a set of requirements for the care need. A requirement represents constraints applied to the request. For example, a customer may request a health service and one of the requirements is to provide it in the geographical location chosen by the customer. Requirements are described in terms of logical expressions. Formally, we define a requirementas:
whereis a label identifying the name of the requirement (e.g., location),is the type of requirements,is a logical operator andis the value to be considered in the expression. The label that identifies the requirement is provided by the ECE, according to pre-determined variables associated with the taxonomy of care need goals. Requirements are considered soft or hard, thus. A hard requirement eliminates the service that evaluates the expression as false, e.g., it does not attend the requirement imposed by the customer. If the requirement is soft the service is not eliminated during the ranking process even if it fails to satisfy the requirement. Logical operators supported by the current solution includeand. Finally, value can be crisp (number, string, etc.) or fuzzy (depending if the requirements are expressed in crisp value or fuzzy scale).
Definition 9.
Service Offer (SEOF)—represents a potential service that can attend a customer request.
whererepresents a service provider,is a service,represents a customer,represents a customer’s request, and adherence is a compatibility index relating the customer profile, requirements and priorities to the providers’ characteristics and care services features. It represents a combined view of fitness between the considered service and the individual care need. It is determined by a ranking algorithm, through a comparison between the request and the offer of services. More details about the ranking process are shown in Section 6.
Elements of ECE and their relationships. A subset of the elements of ECE is considered in the personalization and composition process. The Unified Modeling Language (UML) diagram in Figure 4 illustrates these elements: A Service Provider provides one or more Services that attend one or more Goals which are organized in a Taxonomy. ECE can have Customers who express their Requests which are composed of Requirements and Care Needs.
5. ECE Environment
The ECE environment supports three main process related to care services: Preparation; Execution; and Monitoring.
The ECE Preparation phase corresponds to the creation of ECE and definition of its rules and functionalities within a collaborative environment. It involves representing the main body of information and knowledge, identifying the target audience, the involved stakeholders, namely partners in the various groups (support entities, regulation entities, private companies, governmental institutions, freelancing professionals, caregivers, etc.) which are members of ECE, ICT and human resources, business and management rules; and characterizing the available services. Based on the templates it creates the care needs list, goals lists, links between care need and goals (taxonomy of care needs), identifies the services providers and services profile and the profile of customers.
The ECE Execution phase relates to the process of composition and personalization (SCoPE) of services, including the ranking of the pairs offer (services) and demand (customer care needs). This process is the focus of this paper and is more detailed in Section 6.
The ECE Monitoring phase supports the service evolution and monitoring of the ECE environment. Considering the dynamic environment and stages of life, the ECE broker analyses the situation (in collaboration with the relevant stakeholders) and adapts the services to fit each new context. In this way, a service solution evolves to cope with the new phase of the customer’s life (for instance, handling new or obsolete care needs, new customer inputs, technological changes, new strategies of service providers, etc.). The detailed process of the self-adaptive system approach for service evolution into ECE can be seen in [16,50,51].
To better understand the Execution process, preliminary data on the customer profile and an example of scenario are presented in the next sections.
5.1. Customer Profile
The customer’s profile identification reinforces that each person is treated individually (his/her attributes, special conditions, resources, life style and preferences, geographical area, guardian, and other personal information). Along with the current process of customer’s request () identification it includes identification of current care needs () and their respective relevance (), guiding the choice of the most promising services to these care needs (personalization process). The more information that is known about the customer, the greater the accuracy in matching services to him/her [10].
5.2. An Application Scenario
A typical scenario involving a senior man, Mr. Silva, who requires personal care needs is used to illustrate the applicability of the proposed ECE customer profile and request identification process (see Table 4).
We start by characterizing the life style of the customer Mr. Silva. The life style includes aspects of independent living, culture, religion, technology, among other data. For each parameter, the status and the personal relevance are associated. Mr. Silva’s lifestyle characteristics are thus illustrated in Table 5. Note that this is not a comprehensive list of life style characteristics.
The first care need (bloodPressure) can be associated with the goal diseaseMaintenance in the care need goals taxonomy, and the second need (homeSafety) can be associated with the goal Safety. After identifying the care needs, it is time to obtain their relevance level (rl). For Mr. Silva, rl for the care need bloodPressure is high, and very high for homeSafety. The formalization is thus presented in Equation (13).
6. Service Composition and Personalization Environment
As mentioned above, it is assumed that, in general, the needs of a customer cannot be fully satisfied by a single service. Instead, a composition of various services is needed to (reasonably) cover all aspects (all care needs) of the customer’s requirements.
In order to determine how well a given service can satisfy some care needs of a specific customer, besides the intrinsic characteristics of the service, it is also necessary to consider the characteristics of the service provider. On the other hand, a set of needs typically require a number of services, each one covering only part of the needs. Therefore, an integrated care solution results from the composition of various “solution fragments”, in which each fragment is a pair spij = {service i, provider j}. Thus, it is necessary to determine how well each spij matches or adheres to the user requirements. In other words, how well each particular “solution fragment” does its job.
Therefore, the proposed SCoPE framework differs from classical approaches in the sense that first, we assess the adherence of each potential “solution fragment” (spij) to the user requirements, by making a detailed analysis of the involved characteristics (the personalization perspective), ranking all potential candidates, and only then the potential global solutions are ranked (compositions of promising “solution fragments”). Figure 5 illustrates this process, which consists of three main steps:
Step: 1—Scope Filtering, the available services (and corresponding providers) that cover some of the customer’s care needs are identified, resorting to the taxonomy of care need goals. From this list, we exclude those that are unsuitable due to geographical restrictions, special conditions, unavailable resources, and other hard constraints.
Step: 2—Adherence Calculation, which determines a compatibility index relating the customer profile, requirements and priorities to the providers’ characteristics and care services features. The notion of adherence represents an aggregated view of fitness between the service and the need. The larger the adherence is, the more personalized the service is for a given customer’s profile (and thus the smaller is the mismatch, dark area in Figure 5). Adherence is calculated for all spij selected in the previous step.
Step: 3—Service Composition and Ranking, which rates and suggests compositions of services based on selected strategies. A composite care service represents a collection of related and integrated care services that provide a particular (complete) solution. The components of an integrated service may be provided by a number of service providers that must collaborate to offer such solution, and thus constitute a virtual organization (VO) for service provision. As such, the created virtual organization for delivering an integrated service is indirectly determined by the service selection and composition process. These steps are explained in the next sub-sessions.
6.1. Step: 1—Scope Filtering
This step is responsible for the matching of {service, provider} pairs that can meet the customer’s request. The process is based on goals of the taxonomy of care needs and customer’s requirements. First, the {service, provider} pairs are selected based on TX′ goals (with penalties for pairs that do not meet the same level of selected TX′ goal). In the second stage, these pairs are filtered based on hard constraints (customer’s requirements’ type restriction hard, customer’s limitations, service application restrictions, etc.).
For instance, if service delivery is not guaranteed in the customer’s region, it is excluded, or if the service requires a specific resource which the customer does not have, this service is excluded. These are just some examples of hard restrictions for the exclusion process, but others can be considered, e.g., maximum cost, service provider preference, delivery time, etc.
At the end, a suitable set of spij for the customer (and related care needs) is identified. Algorithm 1 shows a partial and simplified pseudo code formalism of Scope Filtering.
| Algorithm 1 Scope Filtering Algorithm |
| function ScopeFiltering; |
| // ECE is the ecosystem, cu is the customer, CA’ the set of relevant care needs to be processed |
| Input: ECE, cu, CA’ |
| // SSE is a set of tuples, in which cu is the customer, ca is a care need of the customer cu, se is the service that can attend the care need, and weight is the matching level of the service associated with the service taxonomy |
| Output: SSE = {< cu, ca, se, weight >} |
| // Variables |
| var LSE; // a set containing services (SE) |
| var Lweight; // a weight to associate with the taxonomy matching |
| var Penalty: 0.1; // Penalty for higher-level matching |
| // Main |
| foreach ca in CA’ do |
| LSE ← null; |
| foreach sp in ECE.SP do |
| foreach se in sp.SE do |
| // provided services (SE) by specific service provider(sp) |
| Lweight ← 1; |
| More ← true; |
| Node1 ← ca.taxonomy.node; |
| Node2 ← searchNodeTaxonomy(se.taxonomy.node); |
| while True do |
| if (Node2 = null) or (Node1 = Node2) then |
| break; |
| end |
| else |
| Lweight ← Lweight − Penalty; |
| Node2 ← Node2.parent; |
| end |
| end |
| if (Lweight <= 0) or (Node2 = null) then |
| // Did not have correspondence in the taxonomy |
| Lweight ← 0; |
| SSE ←+ < cu, ca, se, Lweight >; |
| end |
| end |
| end |
Figure 6 illustrates the scenario previously presented for Mr. Silva. The main care needs of Mr. Silva are haveSafety (associated with the node Safety) and bloodPressure (associated with diseaseMaintenance). In this example, the identified services can be provided by either a unique service provider, or a VO. These aspects influence the adherence calculation of the suggested spij fragments.
Let us imagine that based on the matching of care needs and services, the following services are found: s1: Security_Guard Service; s§2: Remote_Monitoring Service; s3: Agenda_Reminder Service; s4: Medication_Alert Service; s5: Nursing_Robotic; and s6: Home_Exercise Service. However, considering that s5 (Nursing_Robotic) is not recommended for diabetic patients, which is the case of Mr. Silva, s5 is removed from the list.
6.2. Step: 2—Adherence Calculation
Considering that Adherence represents a compatibility relation between the individual customer and a solution fragment, it is calculated by estimating three coefficients: Closeness (); Partial Adherence (PA); and Adherence (AD). is represented by a multidimensional matrix of the proximity between customer’s requests and the features of the {service, provider} pair fragment. PA is an intermediate computation that refines the closeness based on ponderation between customer’s relevance () and service’s coverage level () for each care need. Finally, represents the resulting adherence considering all care needs together.
Table 6 summarizes the adherence calculation process, including the purpose, inputs, and outputs for each sub-step.
The three sub-steps should be repeated for each spij fragment resulted from the Scope Filtering step. Let’s see these sub-steps in more details:
Sub-step 1—CL calculation. Since we aim at service personalization and adaptability for each customer, particular consideration is put on comparing solutions with the customer’s profile and requests. To find the solution that has the best adherence, the assessment it based on each customer’s requirement.
CL considers the distance between customer’s requests and the related features of spij. The larger the distance is, the smaller CL is. As each customer has different needs/requests, the same service and provider fragment can have a different closeness to each customer.
Currently, CL calculation considers the following situations: (a) when the customer’s request and the features of {service, provider} fragment are quantitatively expressed (crisp); (b) when the customer’s request and the features of the {service, provider} fragment are qualitatively expressed (fuzzy); and (c) when the customer’s request is not previously planned in the ECE.
The initial classification of the {service, provider} pair features can be given by the ECE stakeholders (e.g., service provider members, customers, or ECE manager), by professionals in elderly care, or derived from statistical data. Some values might not be available yet (e.g., the service is not rated yet because it is new in the ECE) or not necessary for the customer (e.g., the customer has no constraints).
It is considered that all {service, provider} fragments that offer equal or better features in comparison with customer’s requests have a cli corresponding to the optimal solution (cli = 1). For the other cases, we calculate the closeness based on the distance of customer’s requirements to {service, provider} fragment features. Following the situations (a), (b), and (c) above, the adopted CL calculation is done by:
Calculation for situation (a)—a crisp comparison:
For instance, if the customer wishes a maximum cost of 50 €, and the fragment’s price is 60 €, then clcrisp is “0.83”.
Calculation for situation (b)—a fuzzy comparison:
The adopted method for distance calculation in this situation is based on fuzzy linguistic variables. Trapezoidal fuzzy numbers are more appropriate since the degree of uncertainty in the variable values is high [64]. Considering £i as a trapezoidal fuzzy number, defined by , where ∈ [0, 1], the distance between two numbers and is given by (Zimmermann, 1996):
For instance, if the customer’s level of technological knowledge is low and the service usability is medium, two fuzzy trapezoidal numbers with linguist terms Low (£1) and Medium (£2) are illustrated in Figure 7. The distance between them (from Equation (17)) has the value “0.11”, and the corresponding clfuzzy value is “0.89” (from Equation (16)).
Calculation for situation (c)—based on service provider flexibility:
At an individual level, flexibility is the ability to incorporate variations in the execution of the care service within a process definition by customer request. For instance, modification of service delivery in response to a customer desire. As such, the specific request is represented by parameters characterizing the flexibility level, e.g., delivery conditions, business process, service features, etc. We consider different flexibility zones, for instance, the service provider can be very flexible for delivery resources, but not very flexible to change the business process.
Table 7 shows a possible scale of flexibility degrees. If the service provider has a flexibility level very flexible, clflex has value “1”.
For instance, if a customer requests a car with a specific colour for delivering a service (e.g., red car), the request has a very high exigency level (corresponding to a very flexible service provider), and the service provider has a Moderately flexible flexibility level; thus, the corresponding clflex is “0.5”.
Algorithm 2 shows a partial closeness calculation algorithm in a simplified pseudo code formalism.
| Algorithm 2 Closeness Adherence Algorithm |
| function Closeness; |
| // ECE is the ecosystem, cu is the customer, ca’ is a care need, and SEW = {< ca, se, w >}, where ca is a care need, se a service that attends this care, and w weight of the service associated with the taxonomy (calculated in Algorithm 1) and req is customers requirements |
| Input: ECE, cu, SEW, RE |
| // The output is a set containing tuples composed of a requirement req, a service se, and the adherence ad ∈ [0, 1] of the service se to the requirement req |
| Output: CL[n] = {< se, req, ad >} |
| // Variables |
| var n=req; // number of requirements |
| var t; // a vector |
| // Main |
| while SEW.hasTuples do |
| t ← SEW.nextTuple(); |
| i ←1; |
| foreach req in t.ca.getRequirements do |
| foreach fea in t.se.getFeatures do |
| if (req.id = fea.id) then |
| // simplified function |
| switch req.type do |
| case FUZZY do |
| // closeness calculation based on fuzzy function, distance between trapezoidal numbers |
| CL[i] ←+ < se, req, doTrapezoidal(se, req, f e) >; |
| break; |
| case CRISP do |
| // closeness calculation based on crisp function, relation between customer requirements and service features |
| CL[i] ←+ < se, req, doCrisp(se, req, fe)) >; |
| break |
| otherwise do |
| // closeness calculation based on provider flexibility level |
| CL[i] ←+ < se, req, doF lexibility(se, req, f e) >; |
| end |
| end |
| i++ |
| end |
| end |
| end |
At the end, a closeness vector is calculated, where the number of elements (n) corresponds to the number of requirements. For instance, if we considered the previous scenario examples, is obtained.
Sub-step 2—Weighted PA vector calculation. For each care need m, the G(clm) coefficient is the average of closeness CL vector elements given by:
PA combines the G(cl) coefficient and compares the service coverage level () in relation to the customer’s care needs relevance (). For each care need m, a corresponding pam is calculated. The is defined when the service provider registers a service in the ECE and it is associated with a care need. The RL is defined by the customer when the care need is requested. and coefficients are expressed in a fuzzy scale. However, they are often checked and adjusted at any time if necessary. The condition presented below gives the calculation.
where distance represents the distance between and (given by Equation (12)) related to care need m.
Our partial adherence calculation method is shown in Algorithm 3 using a simplified pseudo code formalism.
| Algorithm 3 Partial Adherence Algorithm |
| function PartialAdherence; |
| // G(CL) is the average closeness considering all requirements of each care need, CO is the service coverage level in relation to the customers care need relevance RL |
| Input: G(CL), CO, RL |
| // The output is a set containing tuples composed of a requirement req, a sevice se, and the adherence ad ∈ [0, 1] of the service se to the requirement req |
| Output: PA |
| // Main |
| var m:0.0; // a number of customers care needs |
| foreach ca in cu.ca do |
| if (se.CO >= ca.RL) then |
| PA[m] ← G(CL) * (1 + distance(se.CO, ca.RL)) |
| else |
| PA[m] ← G(CL) * (1 − distance(se.CO, ca.RL)) |
| end |
| m++ |
| end |
At the end, the vector is calculated, where the number of elements (m) correspond to the number of customer’s care needs.
For instance, considering spij fragment associated to two care needs with and , and with a relevance level and and , the corresponding is (for the first care need), and is (for the second care need), thus
Sub-step 3—Adherence (ad) Calculation. represents the “global” adherence covering all care needs and is given by:
An example is shown in Table 8.
At the end, a solution’s matrix is presented. Table 9 illustrates the matrix structure: the first column identifies the solution fragment (), the next columns include the partial adherence for each care need m, the next column is “global” adherence for the current spij solution, and the last columns are the price of solution (cost) and the relation between the adherence and the corresponding price of solution (cost-benefit ratio).
Let us exemplify the Adherence Calculation process for Mr. Silva’s scenario:
Sub-step 1—CL calculation for Mr. Silva. Closeness is calculated assuming that the profile, care needs, care needs relevance, customer requirements and promising solution fragment (), are already identified or characterized.
Having this as background, let us suppose that Mr. Silva selected three requirements for classifying a solution: medium use facility; delivery time within 24 h; and the possibility of service suspension on holidays without cost. For Mr. Silva, the first criterion is identified by usability level, corresponding to situation (b) in calculation. The second criterion, delivery time represents a situation (a), and the last criterion, suspension on holiday corresponds to a situation (c) of business process flexibility level of service provider.
Taking into account the selected requirements, the first one (usability, is “medium”, and if we consider that the solution sp11 is “low”, by using balanced linguistic modeling [65] through the linguistic term and its associated trapezoidal fuzzy number, we have two fuzzy trapezoidal numbers with linguist term Low (£1) and Medium (£2). Thus (calculated by Equation (11)) represents here , is 0.89.
For the second requirement, : time delivery, the is available in two hours, so the features are better than the customer’s request (24 h), thus corresponds to “1”. The last requirement involves business process changes following a very high exigency level (corresponding to a very flexible solution). The fragment has a moderate flexibility level, thus the corresponding closeness through the linguistics terms is 0.5. For each {service, provider} fragment and set of requirements, a step-by-step calculation is performed and the corresponding closeness vector CL, for Mr. Silva and fragment, is , and the corresponding is 0.797.
Sub-step 2—Partial Adherence (PA) calculation. Considering the two care needs of Mr. Silva: bloodPressure and homeSafety, and the service coverage level () coefficient assigned in the care needs taxonomy to fragment of , the PA associated with Mr. Silva’s care needs is the following (based on Equation (14)), and , thus:
Sub-step 3—Adherence calculation. Considering that all fragments have a , the Solution’s matrix is built. Table 10 shows the matrix for Mr. Silva. Like solution , exemplified above, a similar process is applied to all spij rows.
6.3. Step: 3—Service Composition and Ranking
Considering Mr. Silva’s scenario, the relevance level indicated for bloodPressure and homeSafety are high and very high, respectively. The first process excludes services that do not cover the needs with the desired relevance. Considering the mapping of Table 11 and the high relevance indicated for bloodPressure care need, we only consider services with high or very high adherence level, thus the ( and fragments) and ( fragment) services are eliminated. Similarly, for the homeSafety care need, services fragment), and ( fragment) are discarded. Therefore, Table 11 shows the remaining {service, provider} pairs for Mr. Silva’s care needs, with the corresponding pa values. An example of cost values is also included, to illustrate the next steps.
The service composition process can then proceed using this group of spij fragments, which have a reasonable adherence level. Various alternative composition methods are considered. For instance, a method based on the greedy constructive strategy [66], which composes services based on maximization of values. The greedy strategy builds the solution “care need by care need”, i.e., for each care need, a choice is made regarding the spij that looks best for that care need (better ). In situations that two services have the same value for the same care need, both are considered as greedy options, and more than one integrated solution can be found. Considering the number of care needs is m, then the services set will have at most m services.
Another possible method seeks to minimize the number of service providers. This can be attempted by minimizing the number of included services, which will probably reduce the number of service providers, and increase the chances of better integration for service delivery.
Since having several service providers may decrease delivery disruption risks, a third method can be adopted to consider this goal.
Other methods can be considered depending on the ECE current goals or plans [29].
Table 12 summarizes some composition strategies and their corresponding benefits. In the above discussion, service adherence is the leading criterion for service ranking. However, other constraints and parameters can be used. For instance, the relation between service cost and adherence, services number, the number of involved providers, ECE management strategies or decisions (personalized choice), historical information about service performance, service reputation, etc. The customer interaction is primordial at this stage of negotiation and solution selection.
Algorithm 4 shows a partial service composition and ranking algorithm in a simplified pseudo code formalism.
| Algorithm 4 Service Composition and Ranking Algorithm |
| function ServiceComposition; |
| // Solution is a vector of services set that attends the customer request |
| Input: CA, cu, PA, cost |
| // The output is a set containing tuples composed of a solution Solution, a solution cost cost, the adherence ad ∈ [0, 1] of the solution solution to the customer cu, and the ranking based on the relation between ad and cost |
| Output: SolutionsRanking |
| Procedure AdherenceMaximization; |
| var Solution1; // a vector of solutions these containing services (SE) |
| var ad:0.0; // the solution adherence |
| var x: 0.0; // an auxiliary variable |
| var m; // care needs numbers of customer cu |
| var n:0.0; // numbers of solutions in this strategy (adherence maximization) |
| // Main |
| foreach ca in cu.CA do |
| Solution1 ← null; |
| foreach se in ca.se do |
| n++; |
| if (PA[n]) > x then |
| x ← se.pa; |
| Solution1[n] ←+ < se.ca >; |
| end |
| ad.solution1[n] ← (x); |
| end |
| ad.solution1[n] ← average; |
| end |
| Procedure ServiceMinimization; |
| var Solution2; // a set of solutions these containing services (SE) |
| var ad:0.0; // the solution adherence |
| var n:0.0; // numbers of solutions in this strategy (service minimization) |
| // Main |
| foreach ca in cu.CA do |
| Solution2 ← null; |
| foreach se in ca.se do |
| n++; |
| if se is the same than (ca++).se then |
| ad.Solution2[n] ← se.pa; |
| Solution2[n] ←+ < se.ca >; |
| end |
| end |
| ad.solution2[n] ← average; |
| end |
| Procedure ProviderMinimization; |
| // strategy for minimization of providers number |
| end |
| Procedure DefinedStrategy; |
| // new strategy |
| end |
Table 13 shows some example solutions for Mr. Silva’s scenario. The first solution has an value of 0.906, the highest adherence to the needs. A single fragment () can satisfactorily attend all Mr. Silva’s care needs (solution 2) with of 0.715. Next solutions are based on service provider minimization and have a of 0.755 and 0.774.
If we consider the cost, then the solution’s matrix can be expanded to include another ranking that combines and cost. At this stage, the human-in-the-loop process starts and ECE broker interacts with Mr. Silva, to discuss opportunities, advantages, and disadvantages of the various solutions and make a final decision.
7. Conclusions and Future Work
In the context of aging and well-being, a collaborative Elderly Care Ecosystem has the potential to provide an environment where personalized services might increase customer satisfaction, and give service providers access to new opportunities, allow sharing costs and risks, and strengthen their business. In this context, Collaborative Networks are the pillar that fosters collaboration among diverse stakeholders including service providers. However, to accomplish these objectives, rating and composition of care services should respect individual necessities, since care needs can be currently supported in distinct ways by different providers.
In this article, we propose the SCoPE method to support the process of composing and personalizing services in a collaborative network environment for elderly care. Our method is based on three main steps: (a) scope filtering—responsible for matching and excluding or accepting {service, provider} pairs based on care need taxonomy; (b) adherence calculation—resulting the first rating of {service, provider] pairs based on multidimensional matrix representing the adherence to each specific customer; and (c) service composition and solution ranking—using a number of strategies for service composition, resulting in a ranked list of potential solutions. In this context, SCoPE includes:
- A new service selection paradigm based on solution adherence to the customer needs and specificities, making possible to attend personal requirements through soft criteria.
- Dynamic care needs taxonomy as part of the personalization process, representing a common language to identify services and needs.
- Possibility of integration of services of diverse areas and types covering several care needs.
- Adherence calculation respecting personal characteristics (e.g., cultural, technological, social, etc.) based on care needs and criteria relevance.
- Service composition based on an adherence coefficient, offering tailored services to each senior context and his/her life style, strengthening service personalization.
Partial algorithms for SCoPE implementation are presented and the method was applied to an illustrative scenario in which an elderly person depends on composed care services to improve his quality of life.
The illustrative scenario application shows the viability and facility of building models on top of the ECE framework and demonstrates the appropriateness of the modelling approaches in terms of fit-for-purpose and usefulness.
As part of future work, we intend to monitor customer care needs and improve the method for service evolution proposed in our previous work [67] (continuous personalization) regarding the customer’s evolution of needs under a collaborative care ecosystem environment [68]. Also, we intend to map the ECE concepts to ISO 13940—Health Informatics—System of Concepts to support Continuity of Care to provide methods of integrating the ECE with systems that provide support for this standard.
Author Contributions
Background analysis, T.A.B. and L.M.C.-M.; General conceptual model, T.A.B. and L.M.C.-M.; Methods & Algorithms, T.A.B.; Text Revision, T.A.B. and L.M.C.-M.
Funding
This work has been partially funded by the Center of Technology and Systems (CTS) and the Portuguese FCT-PEST program UID/EEA/00066/2013 (Impactor project), and by CAPES (n. 9087-3) and Instituto Federal Farroupilha (Brazil).
Acknowledgments
We also thank the comments and suggestions of Cristiano De Faveri and Filipa A. Ferrada.
Conflicts of Interest
The authors declare no conflict of interest.
References
- World Population Data 2017. Available online: http://www.worldpopdata.org/index.php/map (accessed on 5 October 2017).
- HelpAgeInternational. Global AgeWatch Index. 2015. Available online: http://www.helpage.org/global-agewatch/ (accessed on 12 October 2016).
- Kearney, A.T. Understanding the Needs and Consequences of the Ageing Consumer. The Consumer Goods Forum. 2013. Available online: https://www.atkearney.com/documents/10192/682603/Understanding+the+Needs+and+Consequences+of+the+Aging+Consumer.pdf/6c25ffa3-0999-4b5c-8ff1-afdca0744fdc (accessed on 10 May 2015).
- Lee, W.-P. Deploying personalized mobile services in an agent-based environment. Expert Syst. Appl. 2007, 32, 1194–1207. [Google Scholar] [CrossRef]
- Hong, J.; Hong, J.; Suh, E.-H.; Kim, J.; Kim, S.Y. Context-aware system for proactive personalized service based on context history. Expert Syst. Appl. 2009, 36, 7448–7457. [Google Scholar] [CrossRef]
- Evenson, S.; Dubberly, H. Designing for service: Creating an experience advantage. In Introduction to Service Engineering; Salvendy, G., Karwowski, W., Eds.; John Wikey & Sons: Hoboken, NJ, USA, 2010; pp. 403–413. [Google Scholar]
- Baldissera, T.A.; Camarinha-Matos, L.M.; de Faveri, C. Service personalization requirements for elderly care in a collaborative environment. In Technological Innovation for Smart Systems, DoCEIS 2017; Camarinha-Matos, L.M., Parreira-Rocha, M., Ramezani, J., Eds.; Springer: Cham, Switzerland, 2017; pp. 20–28. [Google Scholar] [CrossRef]
- Manoharan, R.; Ganesan, R.; Sabarinathan, K. Impac of Hosted Speech Technology for Health Care Service Providers through Call Centers. Sch. Res. J. Interdiscip. Stud. 2015, 3, 2712–2724. [Google Scholar]
- Kwortnik, R.J., Jr.; Lynn, W.M.; Ross, W.T., Jr. Buyer monitoring: A means to insure personalized service. J. Mark. Res. 2009, 46, 573–583. [Google Scholar] [CrossRef]
- Baldissera, T.A.; Matos, L.M.C.; DeFaveri, C. Designing elderly care ecosystem in collaborative networks environment. In Proceedings of the International Conference on Computing, Networking and Informatics, Lagos, Nigeria, 29–31 October 2017. [Google Scholar] [CrossRef]
- Camarinha-Matos, L.M.; Rosas, J.; Oliveira, A.I.; Ferrada, F. Care services ecosystem for ambient assisted living. Enterp. Inf. Syst. 2015, 9, 607–633. [Google Scholar] [CrossRef]
- Baldissera, T.A.; Camarinha-Matos, L.M. Services Personalization Approach for a Collaborative Care Ecosystem. In Proceedings of the Collaboration in a Hyperconnected World: 17th IFIP WG 5.5 Working Conference on Virtual Enterprises (PRO-VE 2016), Porto, Portugal, 3–5 October 2016; Afsarmanesh, H., Camarinha-Matos, M.L., Soares, A.L., Eds.; Springer International Publishing: Cham, Switzerland, 2016; pp. 443–456. [Google Scholar] [CrossRef]
- Afsarmanesh, H.; Sargolzaei, M.; Shadi, M. A Framework for Automated Service Composition in Collaborative Networks. In Collaborative Networks in the Internet of Services; Camarinha-Matos, L., Xu, L., Afsarmanesh, H., Eds.; Springer: Berlin/Heidelberg, Germany, 2012; pp. 63–73. [Google Scholar] [CrossRef]
- Camarinha-Matos, L.M.; Afsarmanesh, H. Collaborative Networks: Reference Modeling: Reference Modeling; Springer Science & Business Media: Berlin/Heidelberg, Germany, 2008. [Google Scholar]
- Kasanen, E.; Lukha, K.; Siitonen, A. The constructive approach in management accounting research. J. Manag. Account. Res. 1993, 5, 245–266. [Google Scholar]
- Baldissera, T.A.; Camarinha-Matos, L.M. Towards a Collaborative Business Ecosystem for Elderly Care. In Proceedings of the Technological Innovation for Cyber-Physical Systems: 7th IFIP WG 5.5/SOCOLNET Advanced Doctoral Conference on Computing, Electrical and Industrial Systems (DoCEIS 2016), Costa de Caparica, Portugal, 11–13 April 2016; Camarinha-Matos, L.M., Ed.; Springer: Cham, Switzerland, 2016; pp. 24–34. [Google Scholar] [CrossRef]
- Sanz, J.; Nayak, N.; Becker, V. Business Services as a Modeling Approach for Smart Business Networks; IBM Research Devision Almaden Research Center RJ10381 (A0606-001); IBM: Armonk, New York, USA, 2006; pp. 1–16. [Google Scholar]
- Xu, X.; Wang, Z. State of the art: Business service and its impacts on manufacturing. J. Intell. Manuf. 2011, 22, 653–662. [Google Scholar] [CrossRef]
- Hill, T.P. On goods and services. Rev. Income Wealth 1977, 23, 315–338. [Google Scholar] [CrossRef]
- Bettencourt, L. Client Co-production in Knowledge-intensive Business Services. In Operations Management: A Strategic Approach; T.O.U.-S. Publications: London, UK, 2005; pp. 273–283. [Google Scholar]
- Baida, Z.; Gordijn, J.; Omelayenko, B. A shared service terminology for online service provisioning. In Proceedings of the 6th International Conference on Electronic Commerce, Delft, The Netherlands, 25–27 October 2004. [Google Scholar] [CrossRef]
- Ferrario, R.; Guarino, N. Towards an Ontological Foundation for Services Science. In Future Internet—FIS 2008; John, D., Dieter, F., Paolo, T., Eds.; Springer: Berlin, Heidelberg, 2009; pp. 152–169. [Google Scholar] [CrossRef]
- Camarinha-Matos, L.M.; Afsarmanesh, H.; Ferrada, F.; Oliveira, A.I.; Rosas, J. A comprehensive research roadmap for ICT and ageing. Stud. Inf. Control 2013, 22, 233–254. [Google Scholar] [CrossRef]
- Kohlborn, T.; Korthaus, A.; Chan, T.; Rosemann, M. Identification and Analysis of Business and Software Services—A Consolidated Approach. IEEE Trans. Serv. Comput. 2009, 2, 50–64. [Google Scholar] [CrossRef] [Green Version]
- Wang, X.P.; An, Y.F. Building Flexible SOA-Based Enterprise Process Using Decision Services. In Proceedings of the 2010 IEEE 7th International Conference on e-Business Engineering (ICEBE), Ljubljana, Slovenia, 13–14 June 2010. [Google Scholar]
- Elliott, M. Stigmergic collaboration: A framework for understanding and designing mass collaboration. In Mass Collaboration and Education; Cress, U., Moskaliuk, J., Jeong, H., Eds.; Springer: Cham, Switzerland, 2016; pp. 65–84. [Google Scholar] [CrossRef]
- Cao, M.; Zhang, Q. Supply chain collaboration: Impact on collaborative advantage and firm performance. J. Oper. Manag. 2011, 29, 163–180. [Google Scholar] [CrossRef]
- O’Grady, M.J.; Muldoon, C.; Dragone, M.; Tynan, R.; O’Hare, G. Towards evolutionary ambient assisted living systems. J. Ambient Intell. Humaniz. Comput. 2010, 1, 15–29. [Google Scholar] [CrossRef]
- Jula, A.; Sundararajan, E.; Othman, Z. Cloud computing service composition: A systematic literature review. Expert Syst. Appl. 2014, 41, 3809–3824. [Google Scholar] [CrossRef]
- Crispim, J.A.; de Sousa, J.P. Partner selection in virtual enterprises. Int. J. Prod. Res. 2010, 48, 683–707. [Google Scholar] [CrossRef] [Green Version]
- Bititci, U.; Garengo, P.; Doerfler, V.; Nudurupati, S. Performance measurement: Challenges for tomorrow. Int. J. Manag. Rev. 2012, 14, 305–327. [Google Scholar] [CrossRef] [Green Version]
- Camarinha-Matos, L.M.; Afsarmanesh, H.; Boucher, X. The Role of Collaborative Networks in Sustainability. In Collaborative Networks for a Sustainable World; Camarinha-Matos, L., Boucher, X., Afsarmanesh, H., Eds.; Springer: Berlin/Heidelberg, Germany, 2010; pp. 1–16. [Google Scholar] [CrossRef]
- Sánchez, A.M.; Pérez, M.P. Supply chain flexibility and firm performance. Int. J. Oper. Prod. Manag. 2005, 25, 681–700. [Google Scholar] [CrossRef]
- Zhu, Q.; Sarkis, J.; Lai, K.-H. Green supply chain management: Pressures, practices and performance within the Chinese automobile industry. J. Clean. Prod. 2007, 15, 1041–1052. [Google Scholar] [CrossRef]
- Meyr, H. Supply chain planning in the German automotive industry. In Supply Chain Planning; Springer: Berlin/Heidelberg, Germany, 2009; pp. 1–23. [Google Scholar] [CrossRef]
- Volpentesta, A.P.; Ammirato, S. Alternative agrifood networks in a regional area: A case study. Int. J. Comput. Integr. Manuf. 2013, 26, 55–66. [Google Scholar] [CrossRef]
- Ojijo, N.; Jakinda, D.; Annor-Frempong, I. Tropical Agriculture Platform (TAP). 2013. Available online: http://www.tropagplatform.org/ (accessed on 18 October 2016).
- FORAGRO. Agriculture and Rural Prosperity from the Perspective of Technological Research and Innovation in LAC: FORAGRO Position. 2010. Available online: http://www.fao.org/docs/eims/upload/276851/foragro_presentation_english_f_1a.pdf (accessed on 12 September 2016).
- Osório, A.L.; Afsarmanesh, H.; Camarinha-Matos, L.M. Towards a Reference Architecture for a Collaborative Intelligent Transport System Infrastructure. In Collaborative Networks for a Sustainable World; Camarinha-Matos, L., Boucher, X., Afsarmanesh, H., Eds.; Springer: Berlin/Heidelberg, Germany, 2010; pp. 469–477. [Google Scholar] [CrossRef]
- Camarinha-Matos, L.M. Collaborative smart grids—A survey on trends. Renew. Sustain. Energy Rev. 2016, 65, 283–294. [Google Scholar] [CrossRef]
- Romano, M.; Kapelan, Z. Adaptive water demand forecasting for near real-time management of smart water distribution systems. Environ. Model. Softw. 2014, 60, 265–276. [Google Scholar] [CrossRef] [Green Version]
- Hong, J.; Lee, W.; Kim, J.H.; Kim, J.; Park, I.; Har, D. Smart Water Grid: Desalination Water Management Platform. Désalin. Water Treat. 2016, 57. [Google Scholar] [CrossRef]
- Fuentes, D.; Fiore, N. The LifeWatch approach to the exploration of distributed species information. ZooKeys 2014, 463, 133. [Google Scholar] [CrossRef] [PubMed]
- Camarinha-Matos, L.M.; Afsarmanesh, H.; Ferrada, F. Collaborative networks approach to active ageing. In Proceedings of the 4th International Conference on Pervasive Computing Technologies for Healthcare (PervasiveHealth), Munich, Germany, 22–25 March 2010. [Google Scholar] [CrossRef]
- Plaza, I.; Martin, L.; Martin, S.; Medrano, C. Mobile applications in an aging society: Status and trends. J. Syst. Softw. 2011, 84, 1977–1988. [Google Scholar] [CrossRef]
- Camarinha-Matos, L.M.; Afsarmanesh, H. Collaborative networks: A new scientific discipline. J. Intell. Manuf. 2005, 16, 439–452. [Google Scholar] [CrossRef]
- Camarinha-Matos, L.M.; Afsarmanesh, H.; Ollus, M. Methods and Tools for Collaborative Networked Organizations; Springer: Berlin, Germany, 2008. [Google Scholar]
- Moore, J.F. Predators and prey: A new ecology of competition. Harv. Bus. Rev. 1993, 71, 75–83. [Google Scholar] [PubMed]
- Camarinha-Matos, L.; Rosas, M.J.; Oliveira, A.I.; Ferrada, F. A Collaborative Services Ecosystem for Ambient Assisted Living. In Collaborative Networks in the Internet of Services; Camarinha-Matos, L., Xu, L., Afsarmanesh, H., Eds.; Springer: Berlin/Heidelberg, Germnay, 2012; pp. 117–127. [Google Scholar] [CrossRef]
- Camarinha-Matos, L.M. Collaborative Business Ecosystems and Virtual Enterprises: IFIP TC5/WG5.5 Third Working Conference on Infrastructures for Virtual Enterprises; Information and Communication Technology; Springer Publishing Company, Incorporated: Berlin, Germany, 2013; p. 631. [Google Scholar]
- Graça, P.; Camarinha-Matos, L.M. The Need of Performance Indicators for Collaborative Business Ecosystems. In Technological Innovation for Cloud-Based Engineering Systems; Camarinha-Matos, L.M., Ed.; Springer: Berlin, Germany, 2015; pp. 22–30. [Google Scholar] [CrossRef]
- Kapitsaki, G.; Kateros, D.A.; Foukarakis, I.; Prezerakos, G.N.; Kaklamani, D.I.; Venieris, I.S. Service Composition: State of the art and future challenges. In Proceedings of the 2007 16th IST Mobile and Wireless Communications Summit, Budapest, Hungary, 1–5 July 2007; pp. 1–5. [Google Scholar] [CrossRef]
- LeadingAge. A Look into the Future: Evaluating Business Models for Technology-Enabled Long-Term Services and Supports. 2011. Available online: http://www.leadingage.org/uploadedFiles/Content/About/CAST/CAST_Scenario_Planning.pdf (accessed on 12 October 2016).
- Alwan, M.; Wiley, D.; Nobel, J. A Program of the American Association of Homes and Services for the Aging (AAHSA); State of Technology in Aging Services, Summary; State of Technology in Aging Services: Washington, DC, USA, 2007. [Google Scholar]
- Wang, S.; Higashino, W.A.; Hayes, M.; Capretz, M.A.M. Service Evolution Patterns. In Proceedings of the 2014 IEEE International Conference on Web Services, Anchorage, AK, USA, 27 June–2 July 2014. [Google Scholar] [CrossRef]
- Mukhopadhyay, S.C.; Suryadevara, N.K. Internet of Things: Challenges and Opportunities. In Internet of Things; Mukhopadhyay, S.C., Ed.; Springer: Berlin/Heidelberg, Germnay, 2014; pp. 1–17. [Google Scholar] [CrossRef]
- Chiarini, G.; Ray, P.; Akter, S.; Masella, C.; Ganz, A. mHealth technologies for chronic diseases and elders: A systematic review. IEEE J. Sel. Areas Commun. 2013, 31, 6–18. [Google Scholar] [CrossRef]
- Afsarmanesh, H.; Sargolzaei, M.; Shadi, M. A Framework of Automated Service Composition in Collaborative Networks. In Proceedings of the 13th PRO-VE 2012 IFIP WG 5.5 Working Conference on Virtual Enterprises, Bournemouth, UK, 1–3 October 2012. [Google Scholar]
- Brown, A.; Johnston, S.; Kelly, K. Using Service-Oriented Architecture and Component-Based Development to Build Web Service Applications; Rational Software Corporation: San Jose, CA, USA, 2002. [Google Scholar]
- Silva, F.O.D. Service selection and ranking in Cross-organizational Business Process collaboration. In Computer Science; University of Technology of Eindhoven: Eindhoven, The Netherlands, 2018. [Google Scholar]
- Kaletas, C. Emerging technologies and standards. In Virtual Organizations: Systems and Practices; Springer: Berlin, Germany, 2005; Chapter 2.2; pp. 105–132. [Google Scholar]
- Camarinha-Matos, L.M.; Afsarmanesh, H. Classes of collaborative networks. In Encyclopedia of Networked and Virtual Organizations; Goran, D.P., Manuela, C.-C.M., Eds.; IGI Global: Hershey, PA, USA, 2008; pp. 193–198. [Google Scholar] [CrossRef]
- Afsarmanesh, H.; Camarinha-Matos, L.M. Towards a semi-typology for virtual organization breeding environments. In Proceedings of the 2007 IFAC 8th IFAC Symposium on Cost-Oriented Automation, Habana, Cuba, 12–14 February 2007; Volume 40, pp. 43–44. [Google Scholar] [CrossRef]
- Zimmermann, H.-J. Fuzzy Control. In Fuzzy Set Theory—And Its Applications; Springer: Berlin, Germany, 1996; pp. 203–240. [Google Scholar]
- Chen, S.-J.; Chen, S.-M. Fuzzy risk analysis based on similarity measures of generalized fuzzy numbers. IEEE Trans. Fuzzy Syst. 2003, 11, 45–56. [Google Scholar] [CrossRef]
- Rothlauf, F. Design of Modern Heuristics: Principles and Application; Springer: Berlin, Germany, 2011; p. 278. [Google Scholar] [CrossRef]
- Baldissera, T.A.; Camarinha-Matos, L.M. Services Evolution in Elderly Care Ecosystems. In PRO-VE 2018 IFIP Advances in Information and Communication Technology, Collaborative Networks of Cognitive Systems; Camarinha-Matos, L., Afsarmanesh, H., Rezgui, Y., Eds.; Springer: Cham, Switzerland, 2018; Volume 534. [Google Scholar]
- Camarinha-Matos, L.M. New Collaborative Organizations and their Research Needs. In Processes and Foundations for Virtual Organizations, PRO-VE 2003, IFIP—The International Federation for Information Processing; Camarinha-Matos, L.M., Afsarmanesh, H., Eds.; Springer: Boston, MA, USA, 2004; Volume 134. [Google Scholar] [CrossRef]
Figure 1.
Care and Assistance Service in the Elderly Care Domain.

Figure 2.
A Collaborative Networks’ Partial Taxonomy (based on [46]).
Figure 2.
A Collaborative Networks’ Partial Taxonomy (based on [46]).

Figure 3.
Elderly Care Ecosystem (ECE) taxonomy of care need goals.

Figure 4.
The main elements of ECE and their relationships.

Figure 5.
Steps in service selection and composition.

Figure 6.
Mr. Silva’s care needs sub-taxonomy and available spij fragments.

Figure 7.
Fuzzy trapezoidal number illustration.


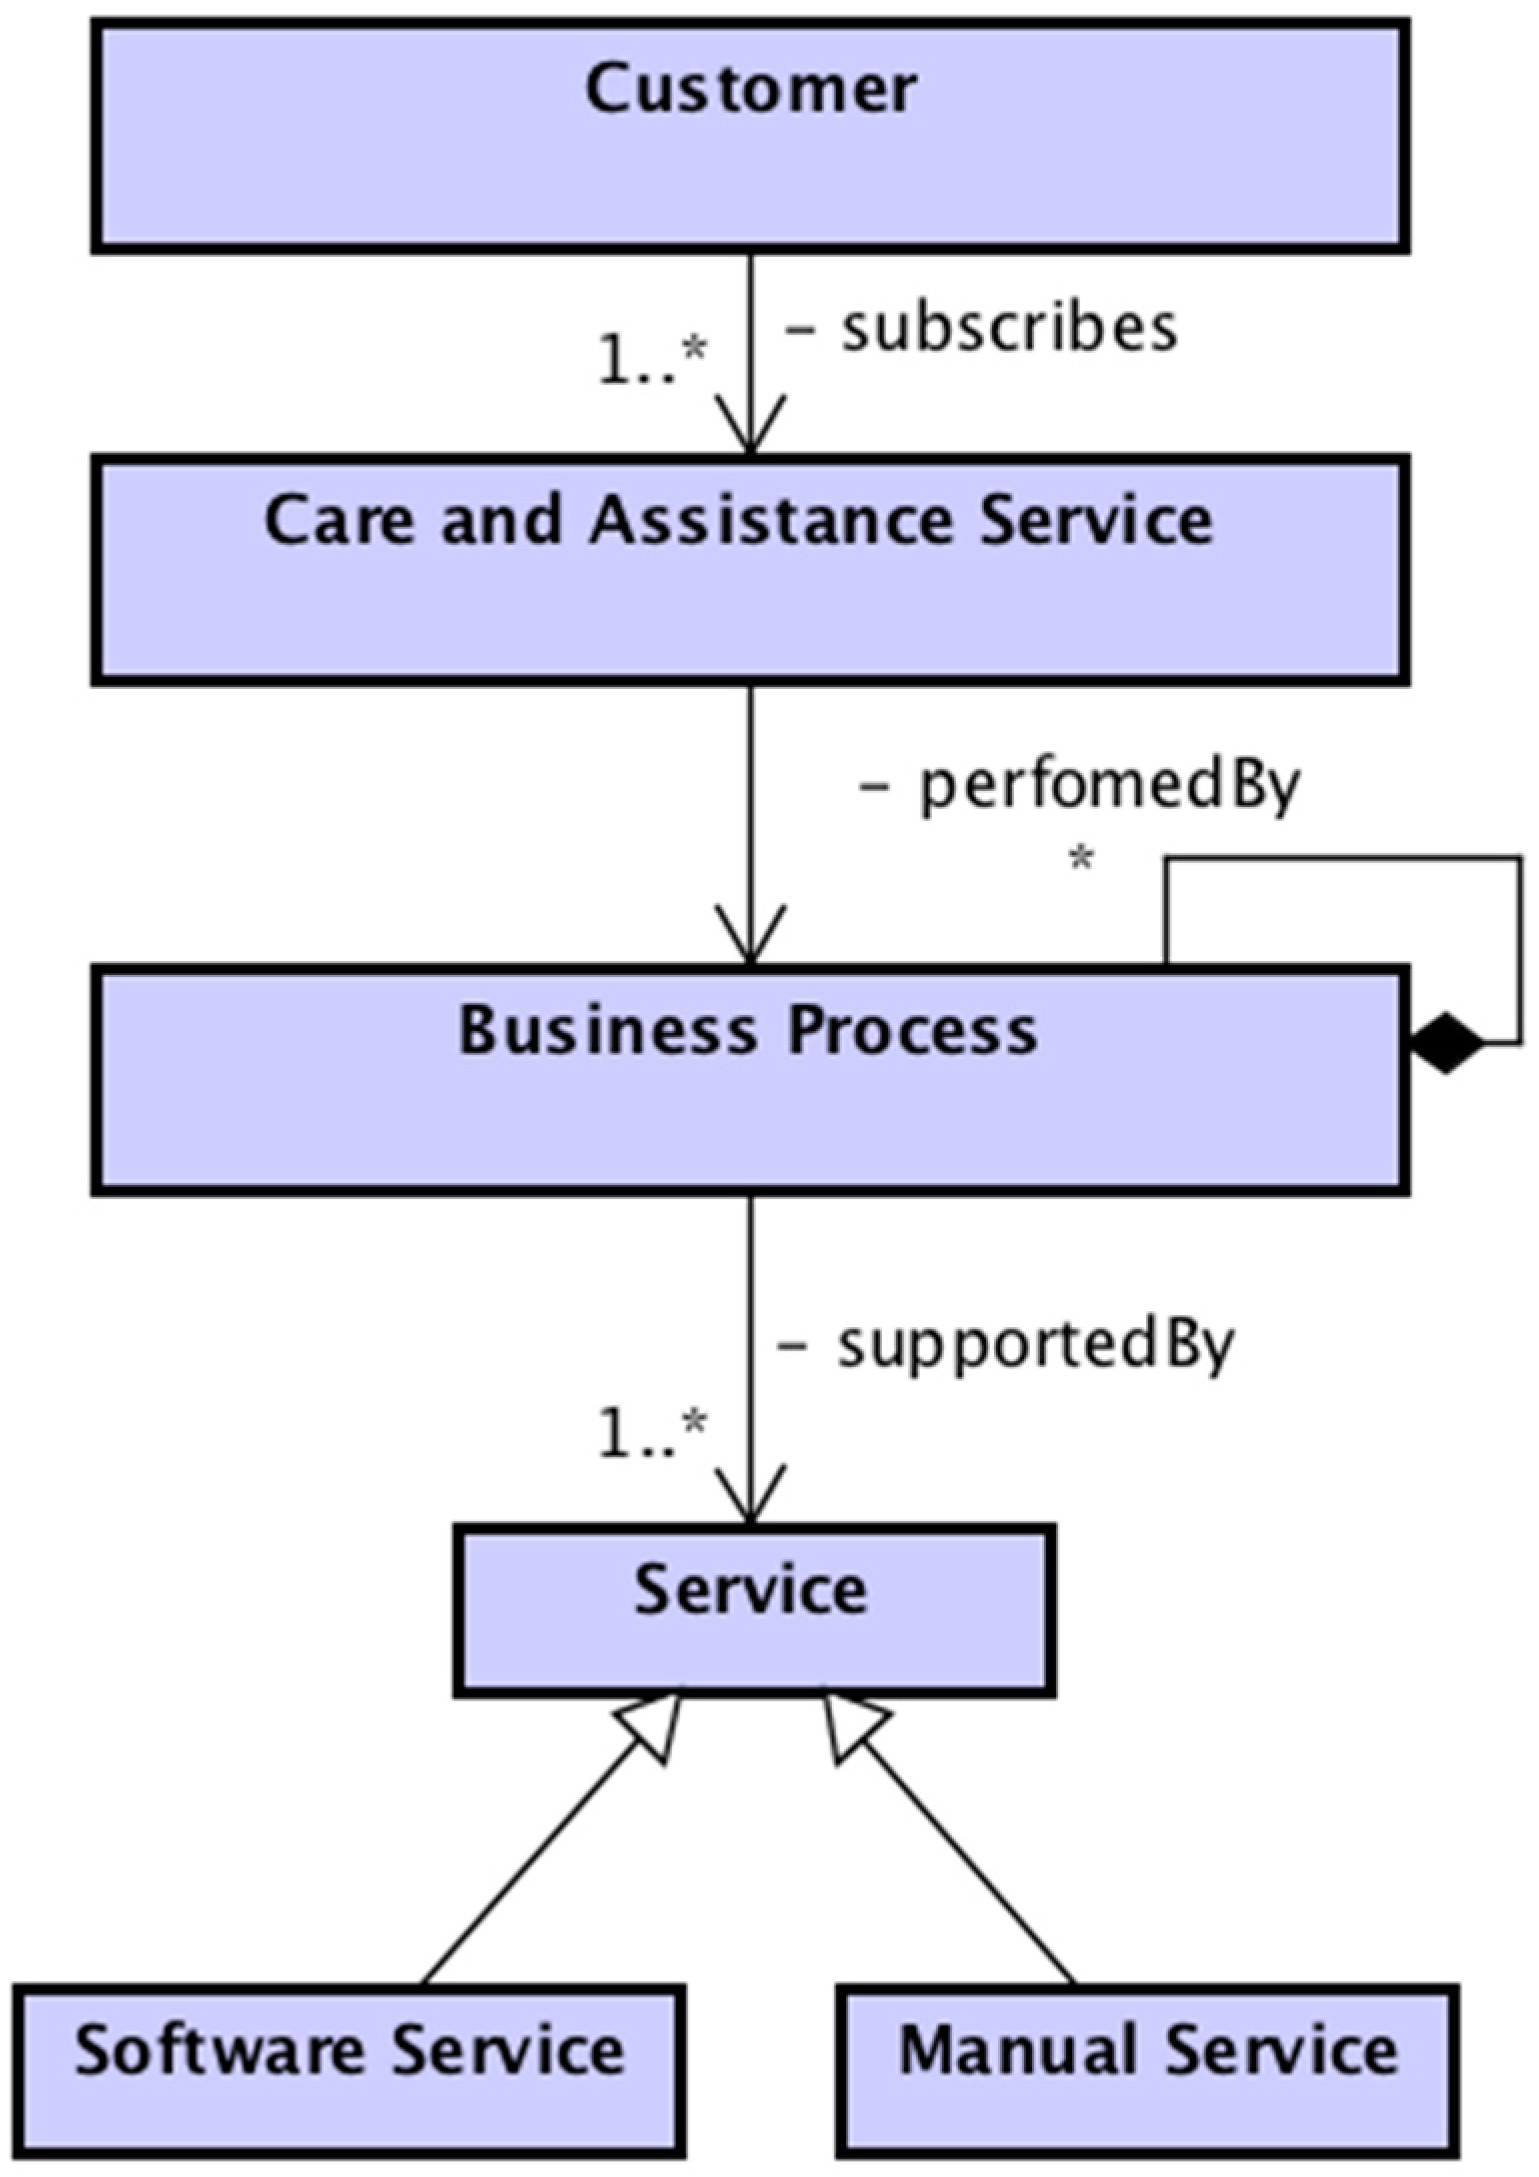
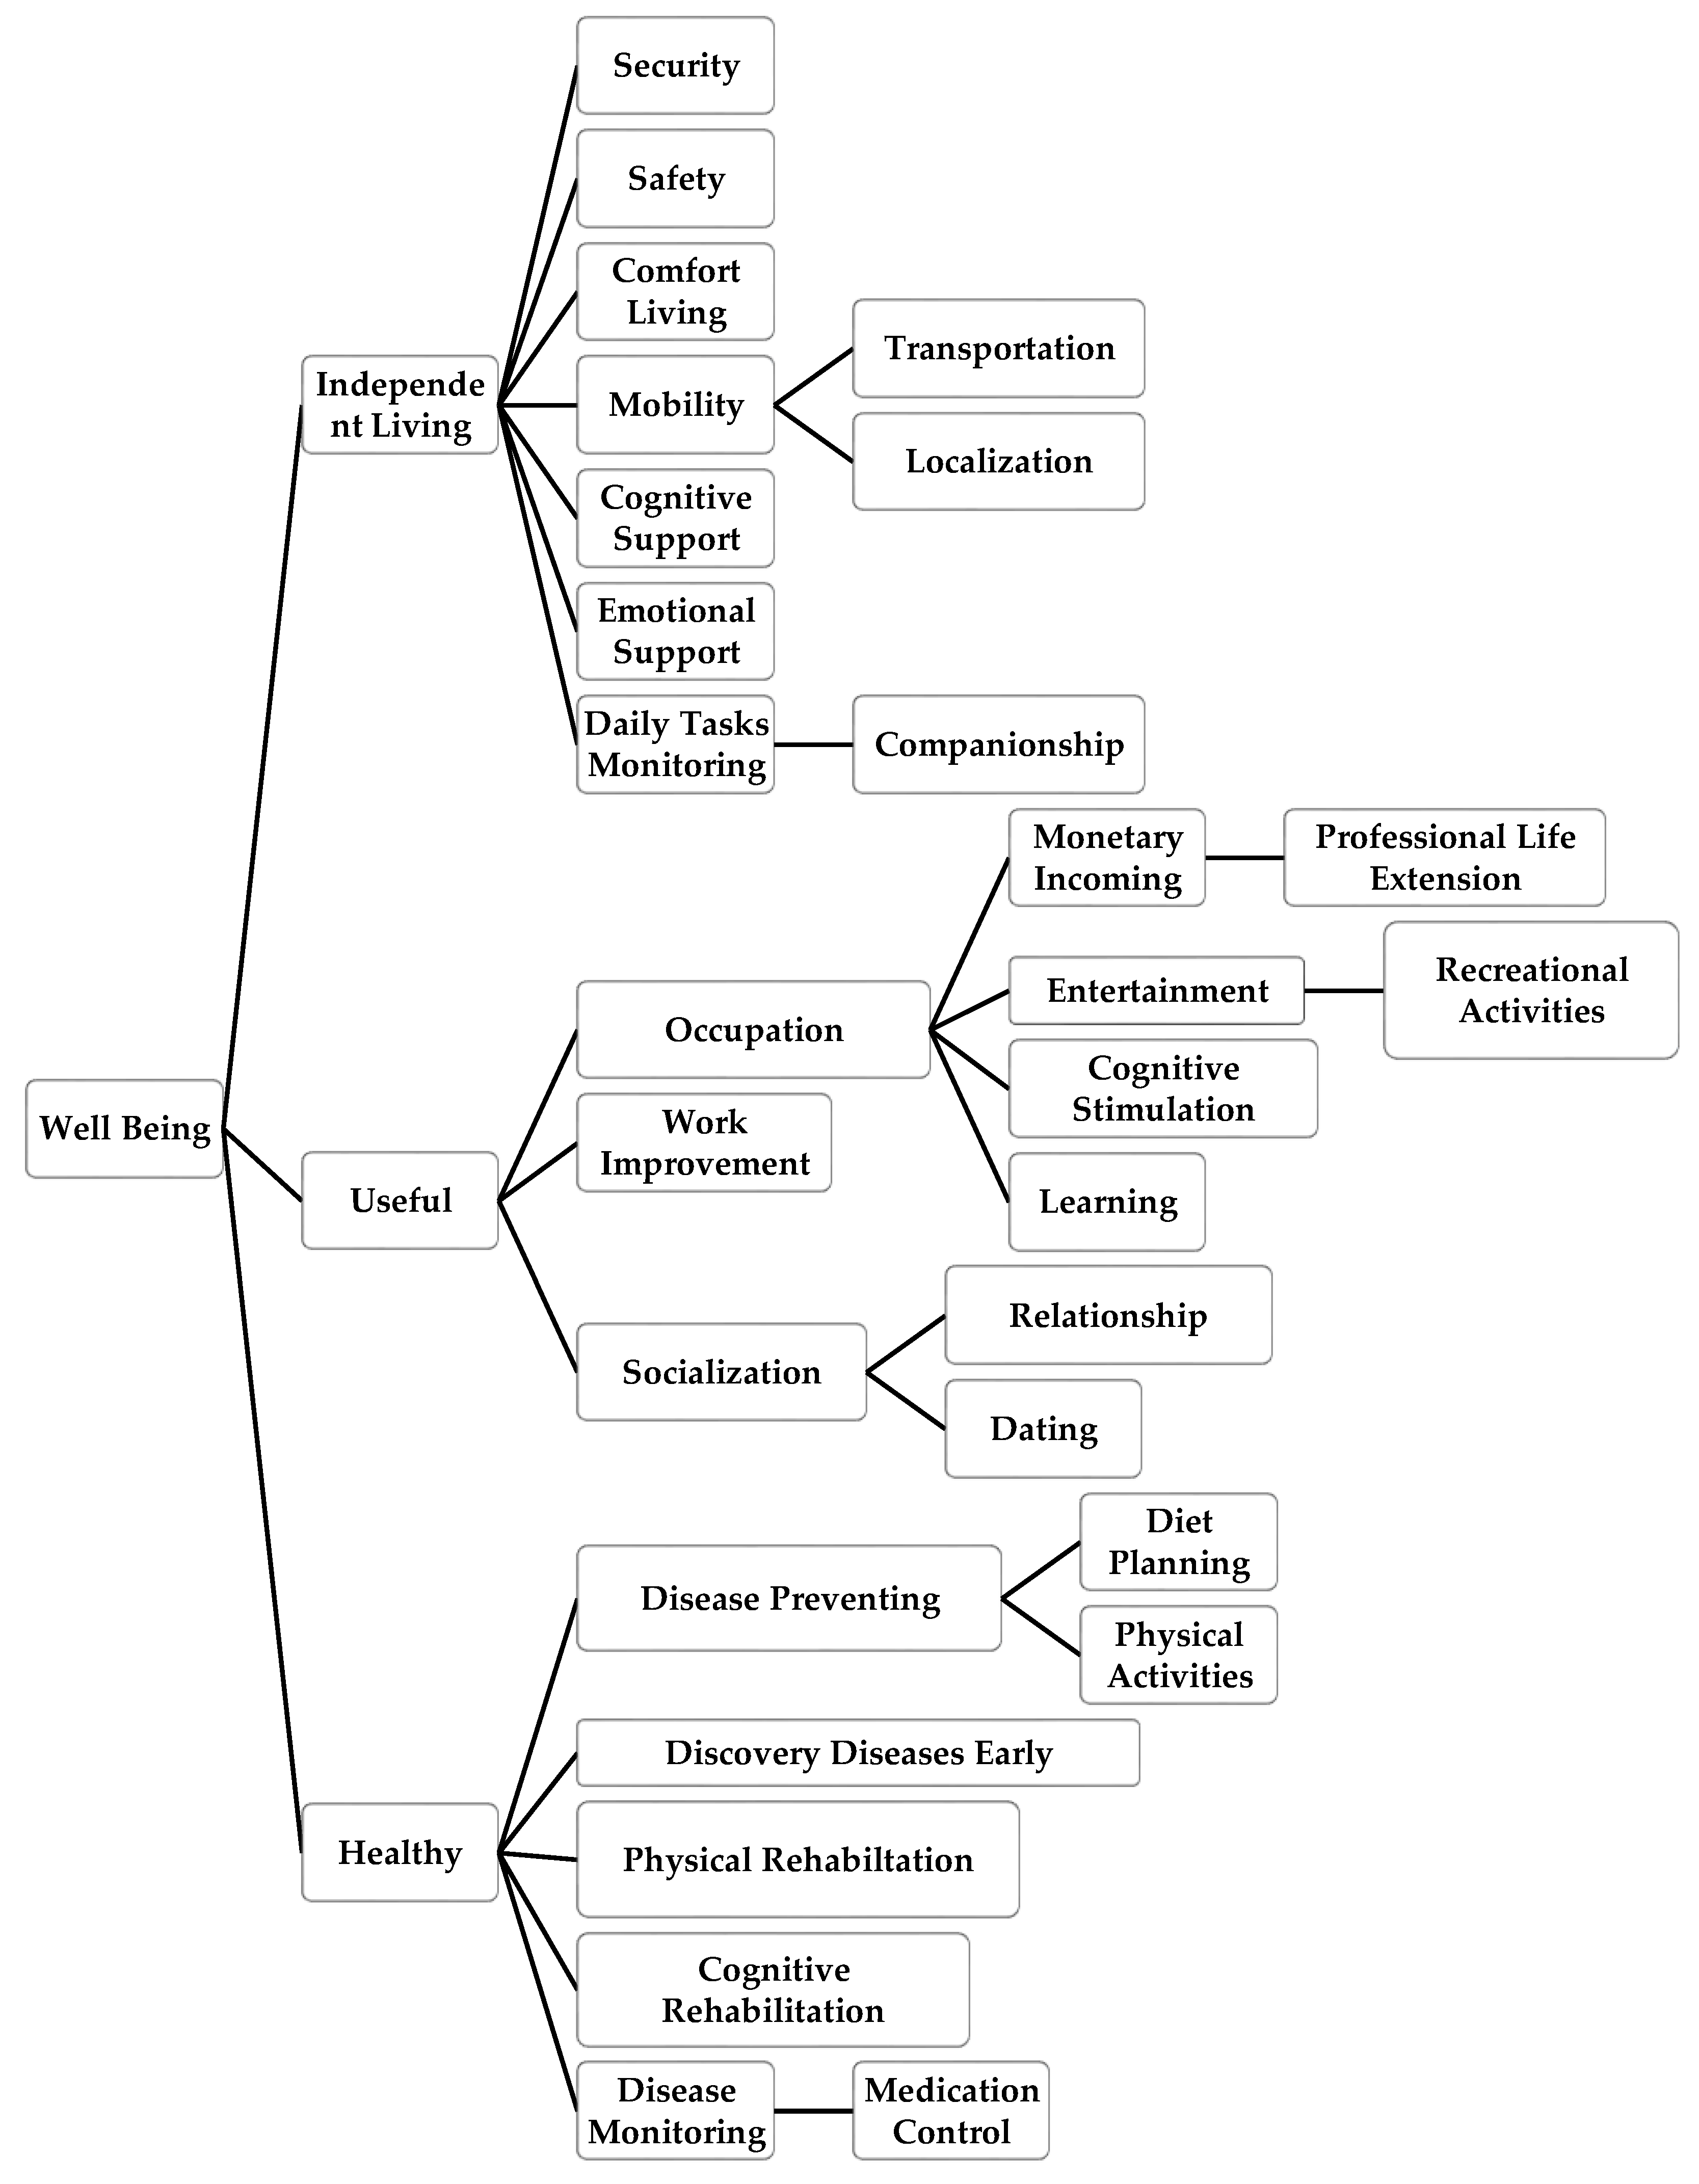
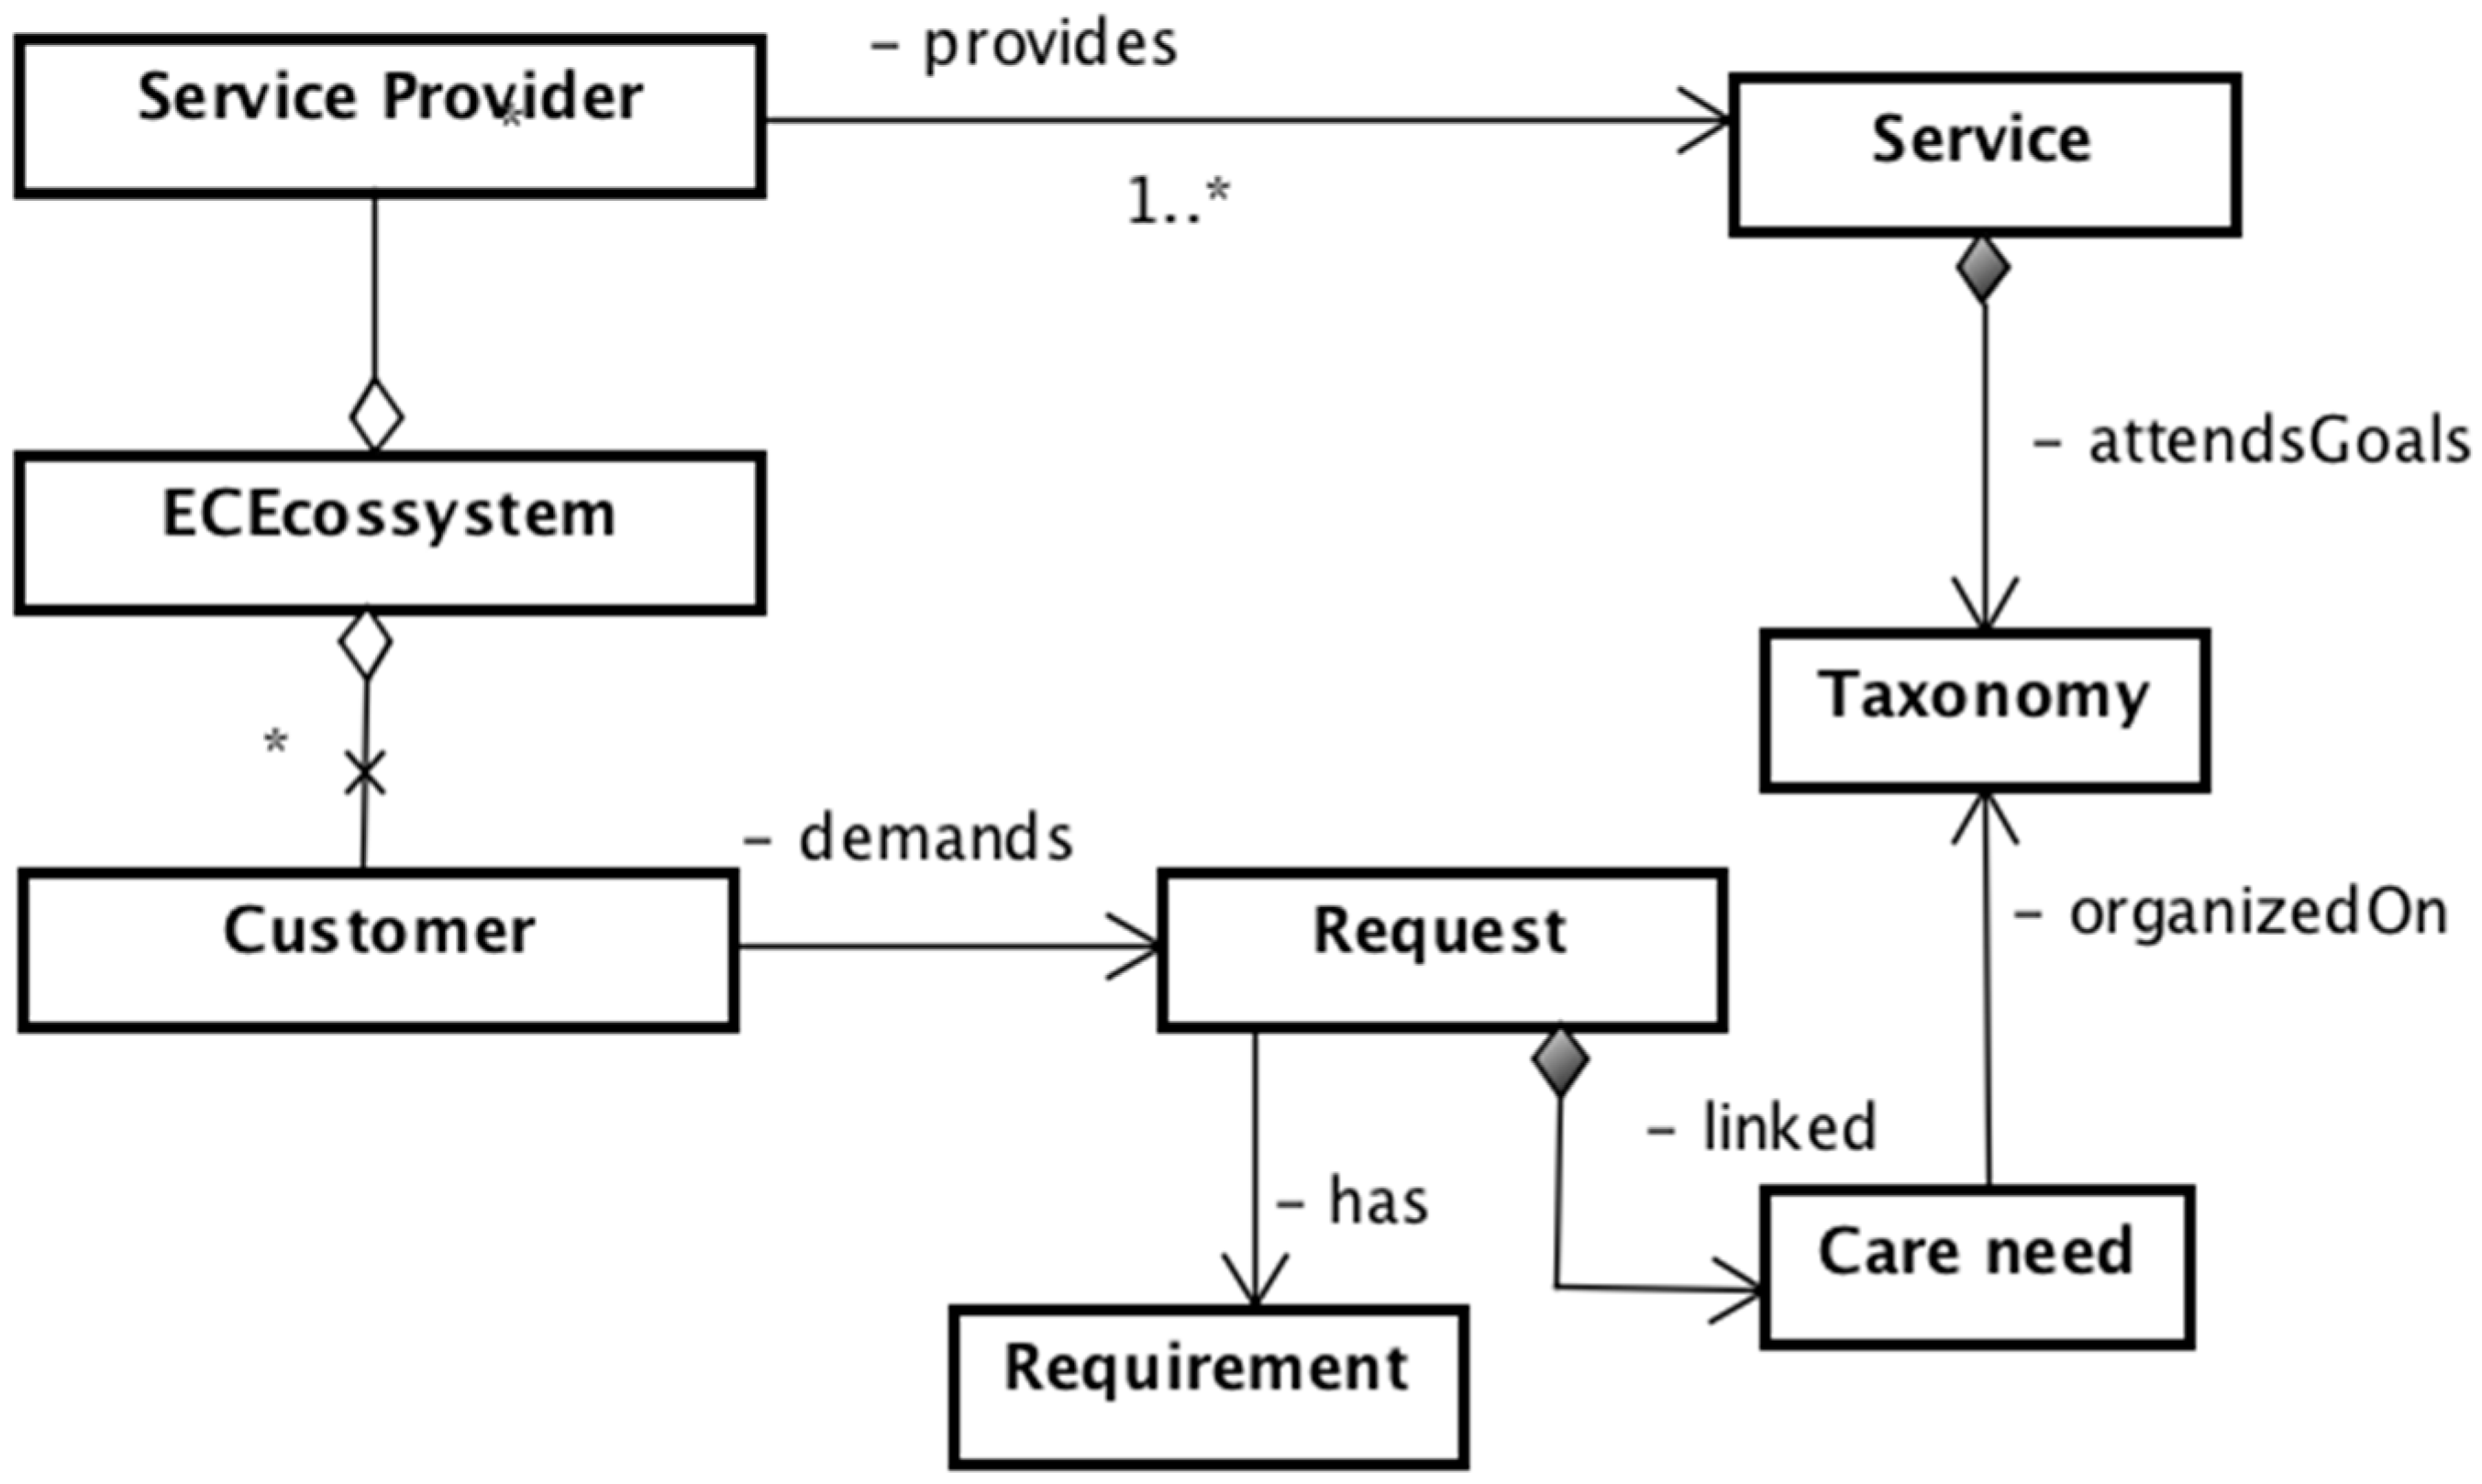
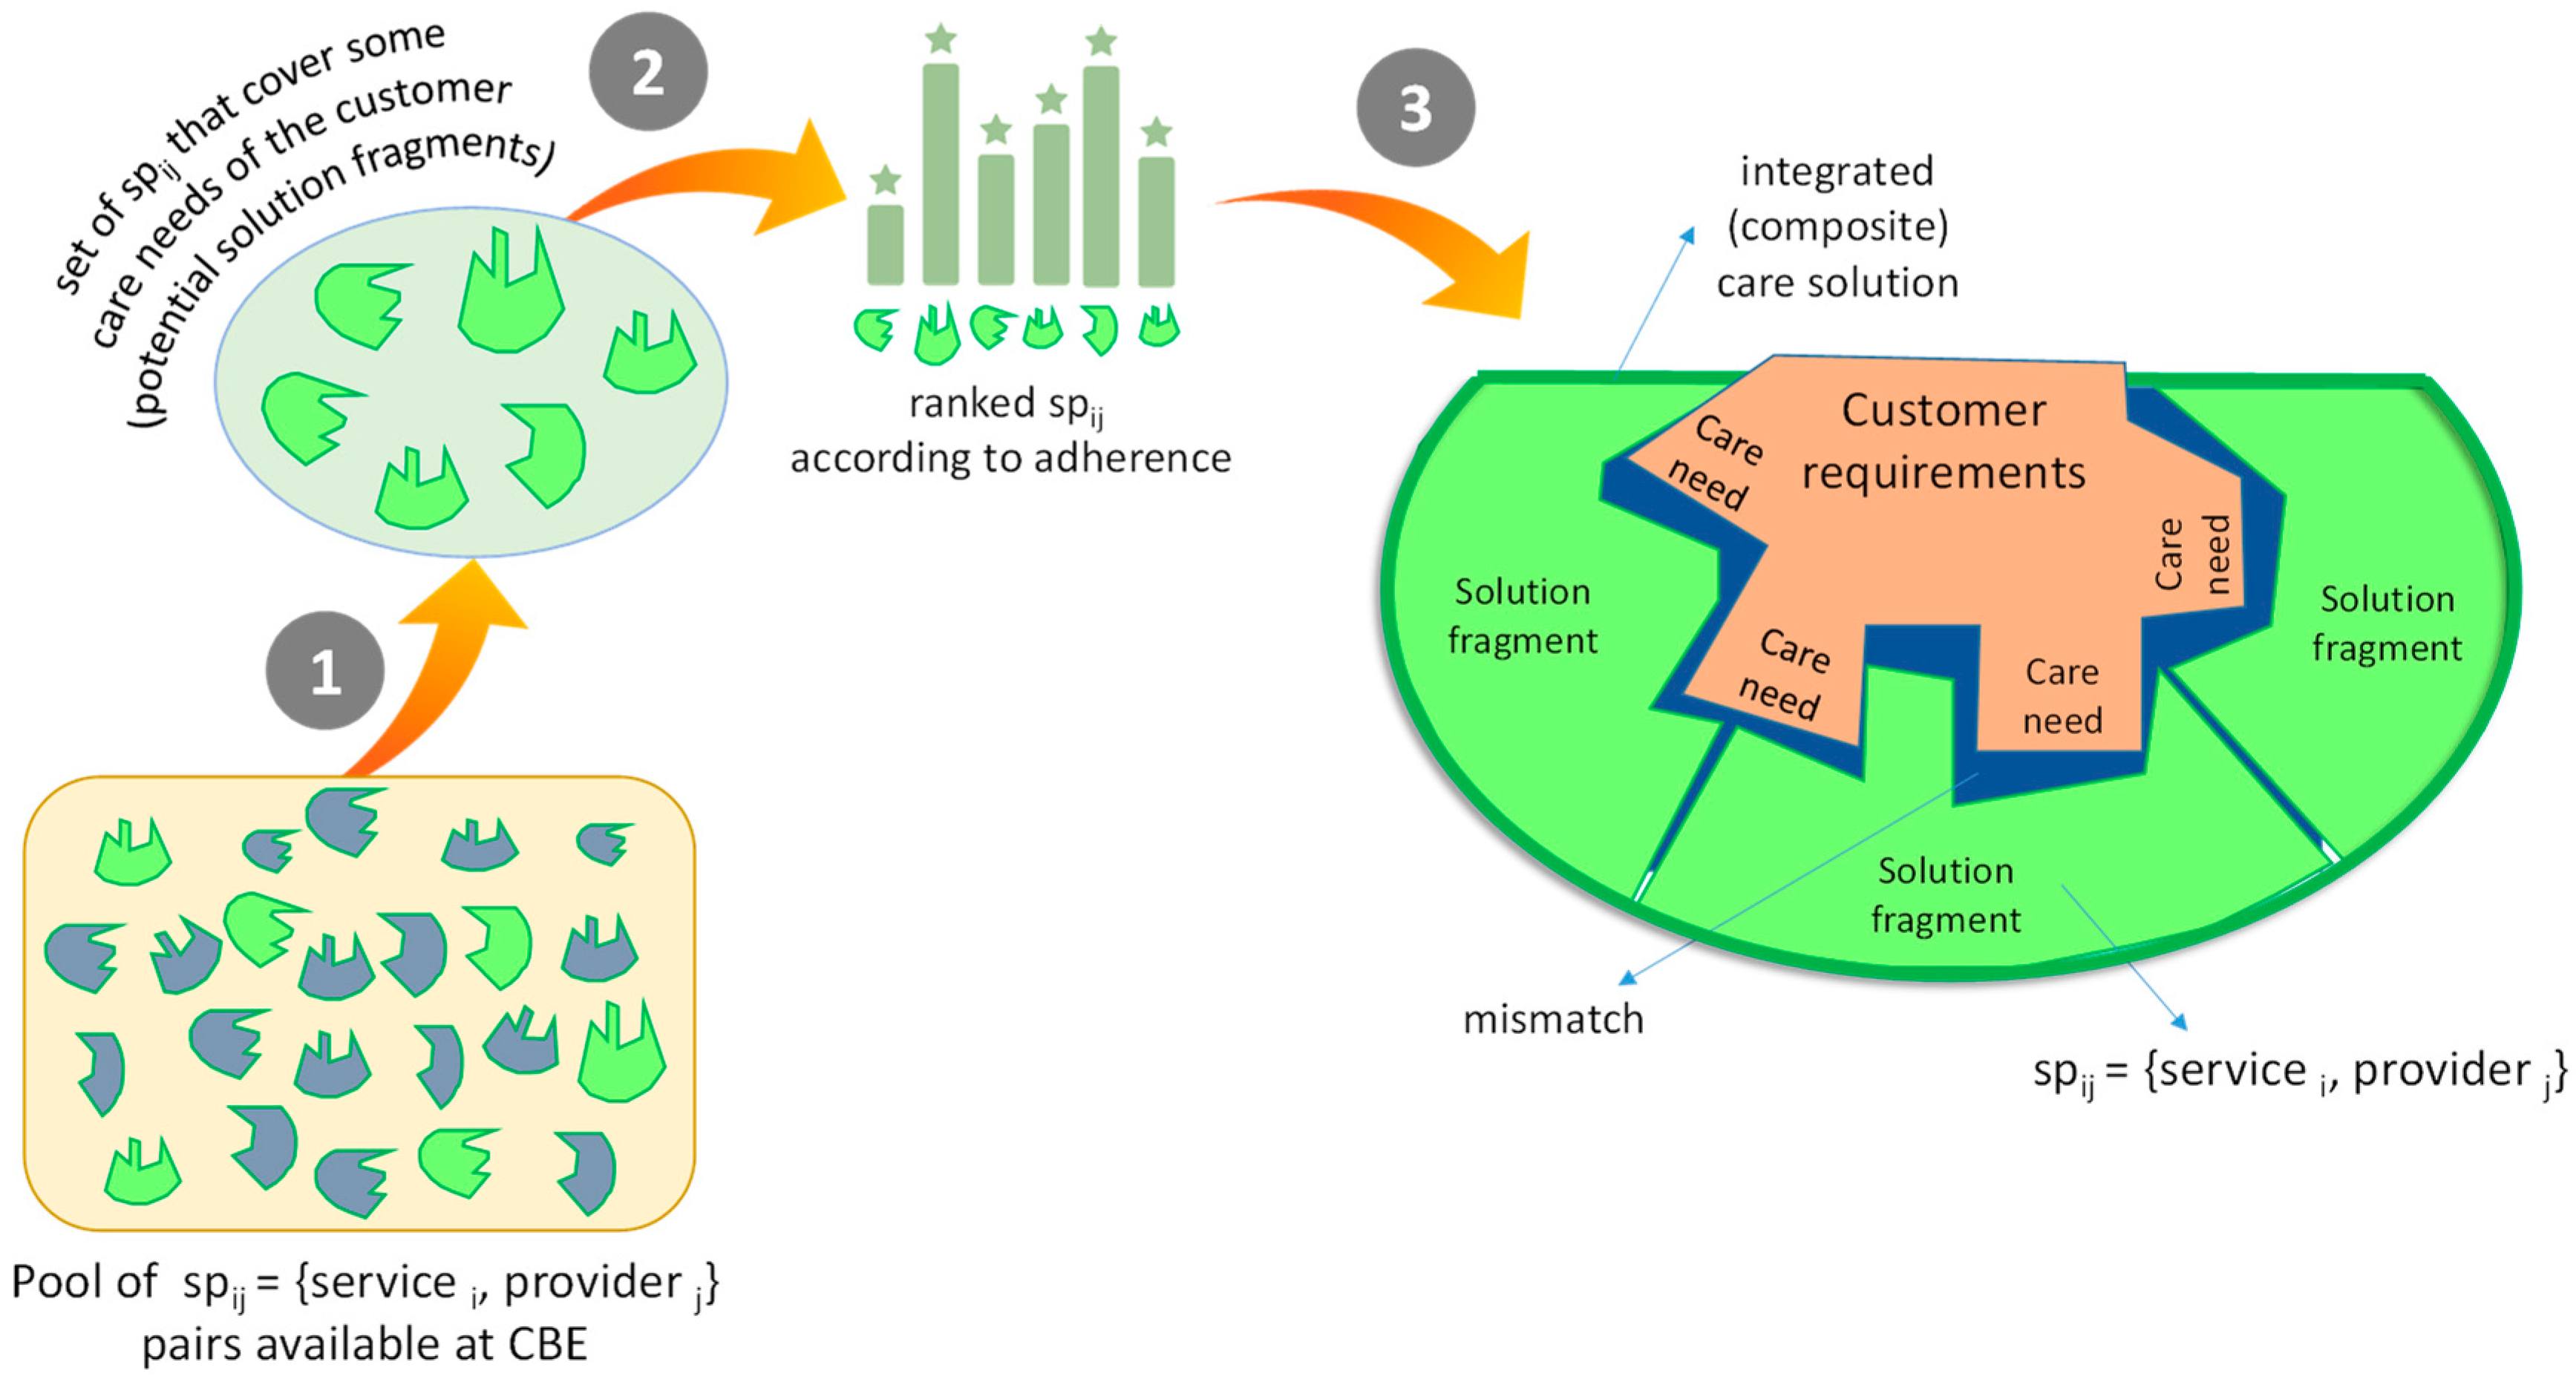
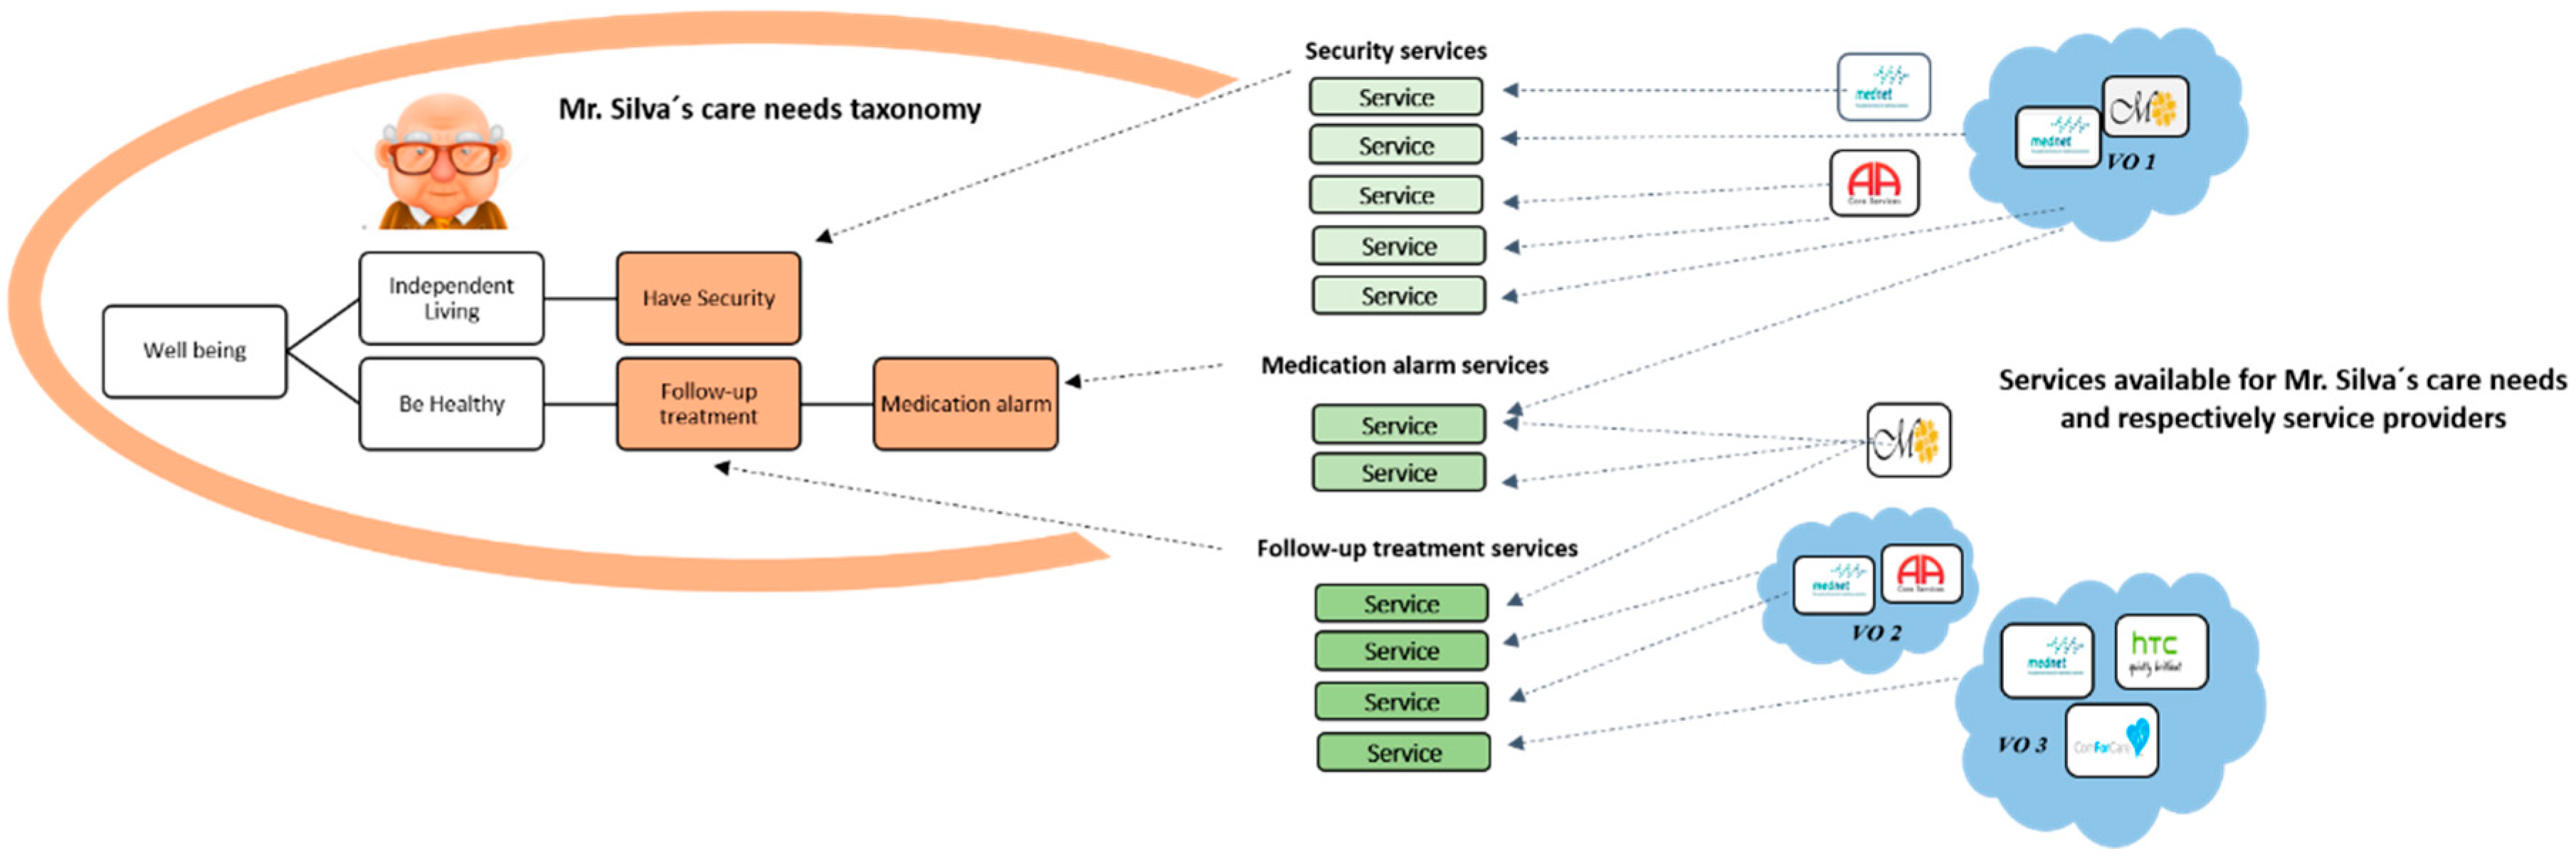
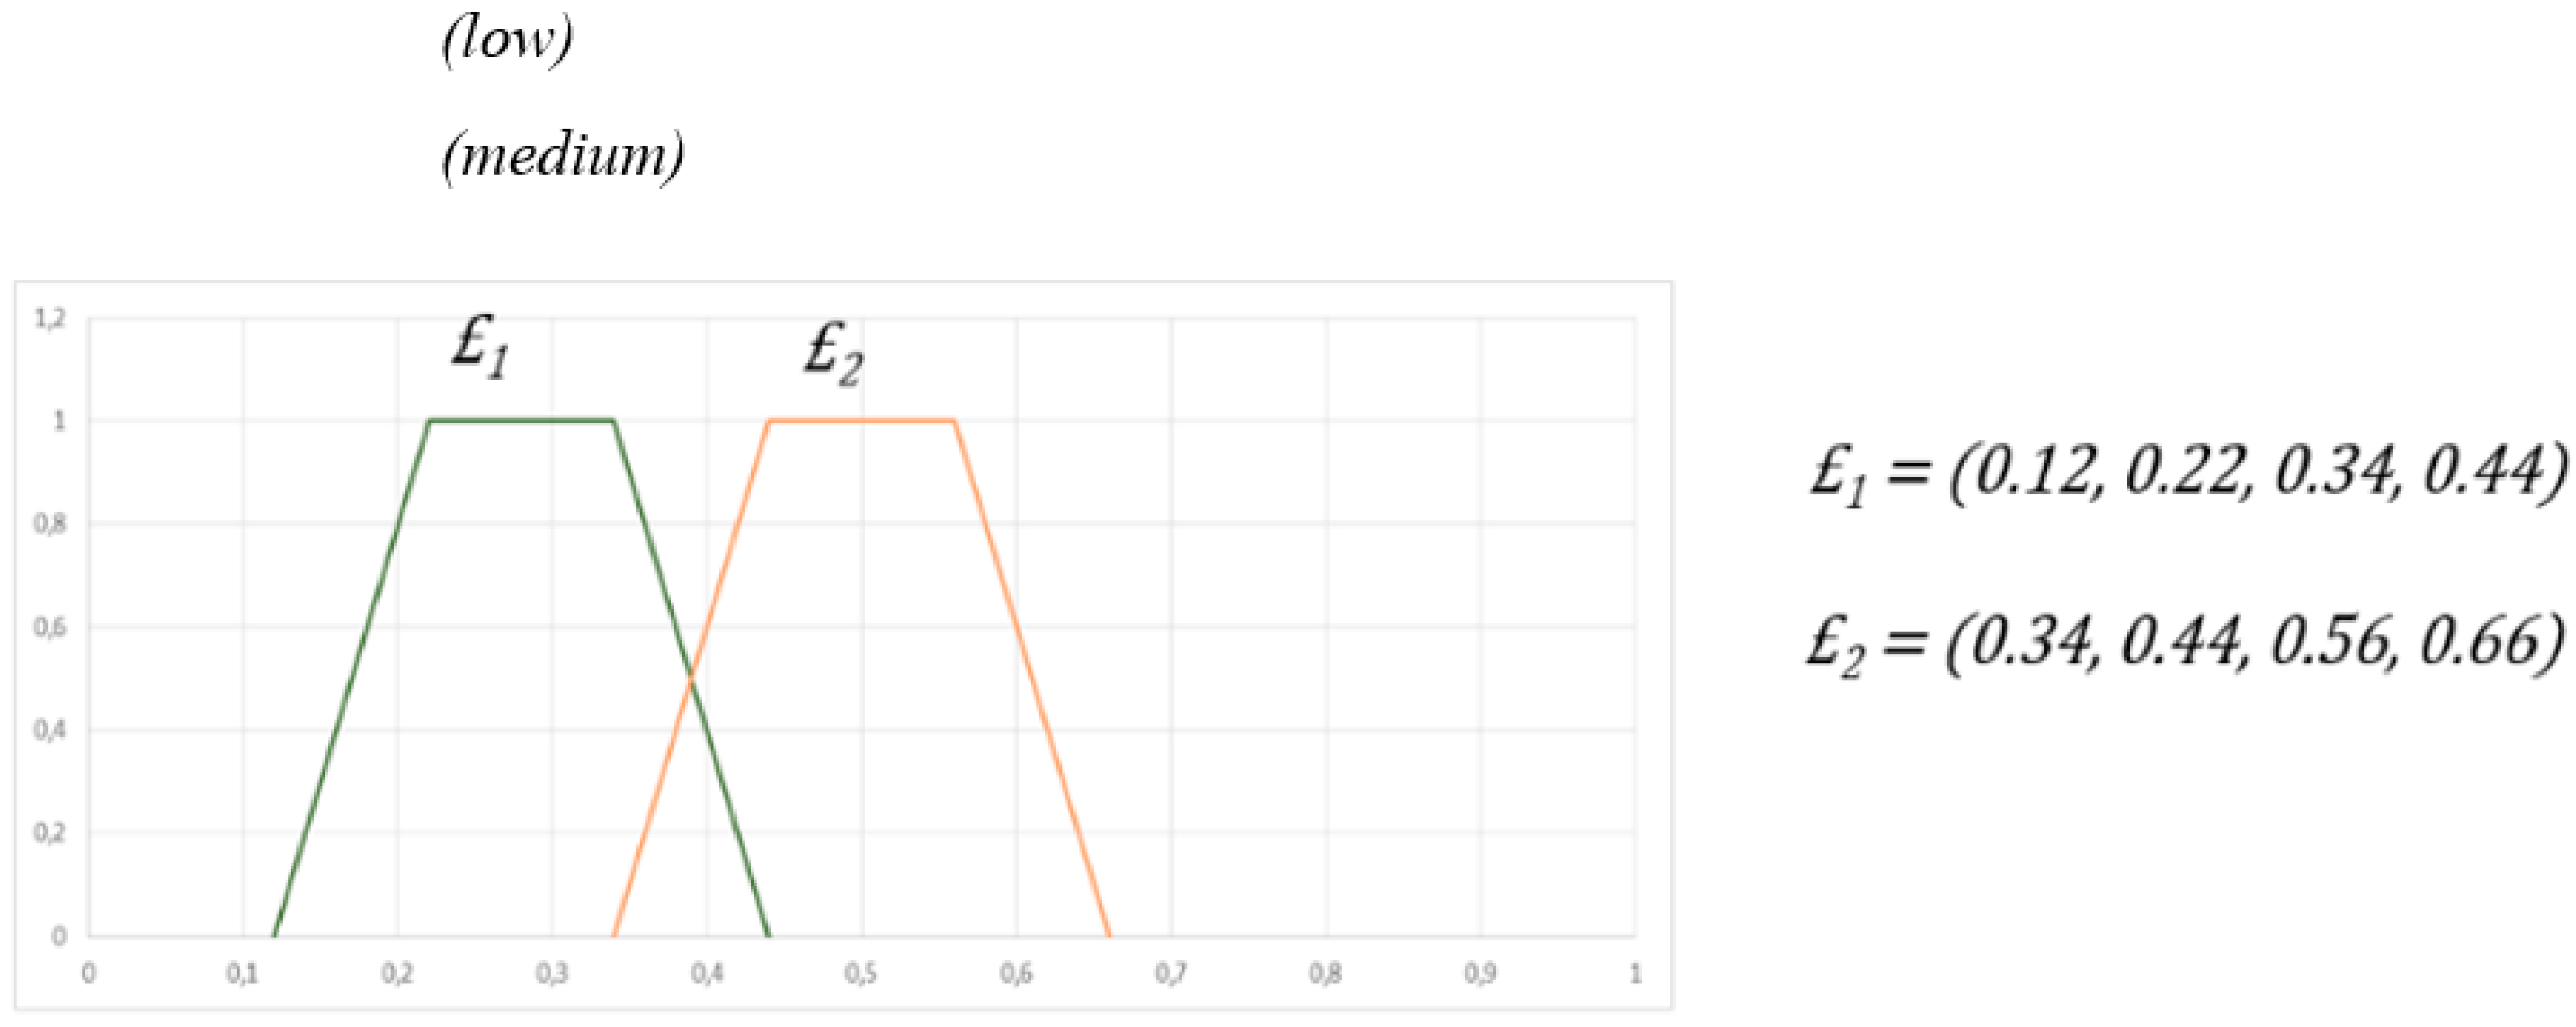
Table 1.
Business Service Descriptions.
| Business Services | Reference |
|---|---|
| “A change in the condition of a person, or a good belonging to some economic entity, brought about as the result of the activity of some other economic entity, with the approval of the first person or economic entity”. | [19] |
| “Such a kind of specialized services and business operations mainly concerned with providing professional and specialized support for the business processes of other organizations, i.e., the clients”. | [20] |
| “A business activity, part of organization’s business model, resulting in intangible outcomes or benefits”. | [21] |
| “A specific set of actions that are performed by an organization”. | [17] |
| “Are present at a time T and location L if, at time T, the agent is explicitly committed to guaranteeing the execution of some type of action at location L, on the occurrence of a certain triggering event, in the interest of another agent and upon prior agreement, in a certain way”. | [22] |
| “Traditional services that feature higher inclusions of ICT and human capital adopt new techniques, new innovative business models, and new resource configurations patterns, thereby producing more added-value”. | [18] |
| (In the elderly care domain) “Are equivalent to what is usually called care and assistance service: services provided to the end users which involve a number of software services and human intervention”. | [23] |
Table 2.
Some Social Networks for Seniors.
| Name | Website |
|---|---|
| Too Young to Retire | www.2young2retire.com |
| American Association of Retired Persons | www.aarp.org |
| Silver Surfers | www.silversurfers.com |
| 60 Plus Association | www.60plus.org |
| 50 Connect | www.50connect.co.uk |
| Senior Net | www.seniornet.com |
| Senior | www.wiredseniors.com |
| Senior.com | www.senior.com |
| Grow NUPS | www.grownups.co.nz |
| Senior Friend Finder | www.seniorfriendfinder.com |
| Senior Match | www.seniormatch.com |
| 50 Years Plus | www.50yearsplus.com |
| Dating for Seniors | www.datingforseniors.com |
| Senior Passions | www.seniorpassions.com |
| Senior Communication | www.seniorcom.jp |
| Verdurez | www.verdurez.com |
| Family Ties | www.cloud10.co.jp |
| Patient Powered | www.patientpowered.us |
| Buzz 50 | www.buzz50.com |
| eHarmony | www.eharmony.com |
| Vital Senior | www.vitalsenior.com.br |
| Portugal Senior | www.portugalsenior.org |
| Stitch Connection | www.stitch.net/ |
| EAC—Empower Assistance Care | eac-network.org/seniornet/ |
Table 3.
Motivations to Participate in a Virtual Organizations Breeding Environment (VBE).
| Management Capabilities | Strategic Level |
|---|---|
|
|
Table 4.
Illustrative Scenario.
 | Personal Data. Name: João Silva Gender and age: male, 82 years old. Place: Lisbon, Portugal. Marital Status: married. Professional Situation: Salesman, retired. Family Structure: wife, one daughter and two grandsons. |
| Backstory. Mr. Silva lives with his wife in Lisbon. He attended primary school but soon became a salesman for an important pharmaceutical company. He has a good house and combining both his salary and his wife’s they can have a comfortable life. He is a very sociable person that usually goes out for a coffee with his wife or friends and therefore never feels lonely. Nevertheless, his family responsibilities are a limitation to a more active social life. He performs all his personal and housing activities and whenever he needs help just asks his wife. He usually also helps his daughter by taking care of his grandsons. | |
| Health information. Mr. Silva is considered healthy, in general, however, he is diabetic and has some memory disabilities. | |
| Technological knowledge. Mr. Silva has a landline phone and a mobile phone that he always uses to communicate with his family and friends. He also has a computer with Internet connection that he regularly uses. | |
| Fears and Frustrations. Mr. Silva’s biggest fears are related to burglaries and fires. He is also slightly preoccupied that his health may start to decline, especially when it comes to walking or climbing stairs. | |
| Motivation. Mr. Silva is an almost healthy person but he is always trying to improve himself and maintain his health status good as long as possible. He is also very concerned with safety and would like to see some solutions to mitigate his fears, namely burglaries and fires, especially because he often has his little grandsons at home and wants them to be safe. | |
| Constraints. He is prepared to invest around 50 euros a month and wants services that are easy to use. He would like to have time to spend with his friends and family. Mr. Silva needs to gauge his blood pressure three times per day. Currently, he uses a personal device to gauge the blood pressure and takes notes in a notebook. Sometimes, he just forgets to gauge the pressure. Also, he usually takes wrong annotations, which makes the process fully unreliable. Mr. Silva also needs a security monitoring service to guarantee home safely. | |
Table 5.
Mr. Silva’s Profile.
| Mr. Silva’s Characteristics CH | Mr. Silva’s Status | Mr. Silva’s Relevance |
|---|---|---|
| Independent living | highly active | very important |
| Culture | not active | not important |
| Religion | active | not important |
| Social | not active | important |
| Technological | highly active | very important |
| Recreational | not active | very important |
| Financial | highly active | very important |
| Friendship | active | very important |
| Household | not active | very important |
| Community | not active | very important |
| Love | active | not important |
| Educational | active | not important |
| Professional | not active | not important |
| Health | active | very important |
| Family | active | very important |
Table 6.
Adherence calculation process.
| Adherence Calculation Process Steps | Purpose | Input | Output | ||
|---|---|---|---|---|---|
| Repeated for each spij fragment | Sub-step: 1 Closeness Calculation | Calculate the closeness vector (CL) of each spij fragment against the customer’s requirements. | 1. spij fragments features 2. customer’s requirements | Closeness vector | |
| Repeated for each care need | Sub-step: 2 Partial Adherence calculation | Calculate the Partial Adherence coeficient: Combining the CL and the service coverage level (CO) in relation to the customer’s care need relevance. | 1. 2. Customer’s care need relevance () 3. Service Coverage Level regarding the care need () | Partial adherence coefficient () | |
| Sub-step: 3 Adherence calculation | Calculate the Adherence combining all care needs together | 1. | Adherence coefficient () | ||
Table 7.
Provider flexibility scale.
| Flexibility Degree | Flexibility Level | Description |
|---|---|---|
| 1 | Very flexible | Always or almost always adapts to the customer’s request. |
| 0.75 | Flexible | Usually adapts to the customer’s request. |
| 0.5 | Moderately flexible | Sometimes adapts to the customer’s request. |
| 0.25 | Not very flexible | Seldom adapts to the customer’s request. |
| 0 | Not flexible | Never adapts to the customer’s request. |
Table 8.
Illustrative example of Solution combining with and .
| Solution | ad | ||
|---|---|---|---|
| spij |
Table 9.
Solution’s matrix structure.
| Solution | … | Cost | Cost-Benefit Ratio | ||||
|---|---|---|---|---|---|---|---|
| sp11 | … | ||||||
| sp22 | … | ||||||
| sp23 | … | ||||||
| … | … | … | … | … | … | … | … |
| spij | … |
Table 10.
Mr. Silva’s Solution’s matrix.
| Fragment | (ca1= Blood Pressure) | (ca2= Home Safety) | Cost | Cost-Benefit Ratio (%) | |
|---|---|---|---|---|---|
| sp11 | 0.885 | 0.622 | 0.75 | 100 € | 0.75 |
| sp21 | 0.184 | 0.782 | 0.48 | 30 € | 1.60 |
| sp22 | 0.000 | 0.927 | 0.46 | 40 € | 1.15 |
| sp33 | 0.345 | 0.451 | 0.39 | 85 € | 0.46 |
| sp41 | 0.767 | 0.000 | 0.38 | 200 € | 0.19 |
| sp64 | 0.639 | 0.791 | 0.71 | 75 € | 0.95 |
Table 11.
Selected solution fragments for Mr. Silva’s care needs.
| To Care Need Blood Pressure | To Care Need Home Safety | ||||
|---|---|---|---|---|---|
| Available Solutions | pa | Cost | Available Solutions | pa | Cost |
| sp11 | 0.885 | 100 € | sp21 | 0.782 | 30 € |
| sp41 | 0.767 | 200 € | sp22 | 0.927 | 40 € |
| sp64 | 0.639 | 75 € | sp64 | 0.791 | 75 € |
Table 12.
Some composition methods.
| Composition Method | Solution Index | Expected Benefit |
|---|---|---|
| Adherence maximization | Better service personalization | |
| Services minimization | Better service integration, less interoperability problems | |
| Providers minimization | Better integration and cost decrease | |
| Balanced Number of Providers | Minimization of service delivery disruption risks | |
| … | … | … |
| To define | To define |
Table 13.
Solution’s matrix for Mr. Silva’ scenario.
| Method | Solutions | To Care Need Blood Pressure | To Care Need Home Safety | ad | Cost | Cost-Benefit Ratio (%) |
|---|---|---|---|---|---|---|
| Solution 1 | 0.906 | 140 € | 0.647 | |||
| Solution 2 | 0.715 | 75 € | 0.953 | |||
| Solution 3 | 0.755 | 130 € | 0.581 | |||
| Solution 4 | 0.774 | 230 € | 0.337 | |||
© 2018 by the authors. Licensee MDPI, Basel, Switzerland. This article is an open access article distributed under the terms and conditions of the Creative Commons Attribution (CC BY) license (http://creativecommons.org/licenses/by/4.0/).
Share and Cite
MDPI and ACS Style
Baldissera, T.A.; Camarinha-Matos, L.M. SCoPE: Service Composition and Personalization Environment. Appl. Sci. 2018, 8, 2297. https://doi.org/10.3390/app8112297
AMA Style
Baldissera TA, Camarinha-Matos LM. SCoPE: Service Composition and Personalization Environment. Applied Sciences. 2018; 8(11):2297. https://doi.org/10.3390/app8112297
Chicago/Turabian StyleBaldissera, Thais A., and Luis M. Camarinha-Matos. 2018. "SCoPE: Service Composition and Personalization Environment" Applied Sciences 8, no. 11: 2297. https://doi.org/10.3390/app8112297
Note that from the first issue of 2016, this journal uses article numbers instead of page numbers. See further details here.