Article

Multiaxial Damage Characterization of Carbon/Epoxy Angle-Ply Laminates under Static Tension by Combining In Situ Microscopy with Acoustic Emission

by
Kalliopi-Artemi Kalteremidou
1,*,
Brendan R. Murray
1,2,
Eleni Tsangouri
1,
Dimitrios G. Aggelis
1,
Danny Van Hemelrijck
1 and
Lincy Pyl
1
1
Department of Mechanics of Materials and Constructions, Vrije Universiteit Brussel (VUB), Pleinlaan 2, BE-1050 Brussels, Belgium
2
SIM M3 Program, Technologiepark 935, BE-9052 Zwijnaarde, Belgium
*
Author to whom correspondence should be addressed.
Appl. Sci. 2018, 8(11), 2021; https://doi.org/10.3390/app8112021
Submission received: 20 September 2018 / Revised: 10 October 2018 / Accepted: 20 October 2018 / Published: 23 October 2018
(This article belongs to the Special Issue Damage Inspection of Composite Structures)

Abstract

:

Featured Application

The results presented in this manuscript are to be used as part of the full characterization of the damage in carbon/epoxy composite structures under static and fatigue conditions when multiaxial stress states are developed. In this manuscript, damage investigations under static tensile conditions are considered and will be used as an input for the fatigue damage characterization of the same composite material under different multiaxiality.

Abstract

Investigating the damage progression in carbon/epoxy composites is still a challenging task, even after years of analysis and study. Especially when multiaxial stress states occur, the development of damage is a stochastic phenomenon. In the current work, a combined nondestructive methodology is proposed in order to investigate the damage from the static tensile loading of carbon fiber reinforced epoxy composites. Flat angle-ply laminates are used to examine the influence of multiaxial stress states on the mechanical performance. In situ microscopy is combined with acoustic emission in order to qualitatively and quantitatively estimate the damage sequence in the laminates. At the same time, digital image correlation is used as a supporting tool for strain measurements and damage indications. Significant conclusions are drawn, highlighting the dominant influence of shear loading, leading to the deduction that the development of accurate damage criteria is of paramount importance. The data presented in the current manuscript is used during ongoing research as input for the damage characterization of the same material under fatigue loads.

1. Introduction

Currently, one of the main requirements for characterizing the response of materials to service loadings is the understanding of how and where damage occurs, while predicting the mechanical response of the material in different configurations. In real applications, materials are subjected to multiaxial loads. The multiaxiality of more conventional isotropic materials has been extensively studied and many analytical models have been proposed [1,2,3]. However, more advanced materials, such as polymer composite materials, have been gaining more and more interest over the last number of years, but their mechanical behavior has been mainly investigated under uniaxial stresses, mostly due to the challenges occurring when multiaxiality is taken into consideration [4,5,6]. Nevertheless, the anisotropy that characterizes these materials induces a significant complexity, and investigations regarding only uniaxial loading should not be considered as adequate.
It is generally accepted that different multiaxial stress states and combinations of normal and shear stresses result in complex mechanical behaviors and, more significantly, in dissimilar damage sequences, which affect both the short-term and long-term response of the material. Damage in composites occurs through a gradual accumulation of matrix cracking, fiber-matrix interfacial debonding, delamination, and fiber failure [4]. However, the influence of multiaxiality on the damage development in composites is still not clear, and quantitative damage observations especially under multiaxial stresses are missing in the literature. Nevertheless, in order to be able to develop suitable damage criteria for composite materials, it is of paramount importance to study how the different multiaxiality affects their progressive damage both in a qualitative and quantitative way.
There have been different approaches reported in literature for the investigation of multiaxial stresses in composite materials [7]. As Quaresimin et al. have already proposed [8], there are two different ways to introduce multiaxiality in composites—internally and externally. In flat laminates with different stacking sequences, internal multiaxiality can be developed even under simple external loading, taking advantage of the intrinsic anisotropy of the composite materials. External multiaxiality can be applied, for example, in tubular specimens under combined tension–torsion or in cruciform geometries loaded in two directions [9,10,11,12,13]. However, as far as the local developed stresses on the lamina level are the same, a similar mechanical behavior should be expected in all geometries [8,14].
The potential for using simpler and more easily manufactured flat laminates, together with well-established uniaxial testing devices, to assess multiaxiality is explored in this work, with a few studies being already reported in literature, both for static [15,16] and fatigue [17,18] loading conditions. Two different carbon fiber reinforced epoxy (CFRE) angle-ply laminates were, therefore, selected to be tested under tensile quasi-static conditions. The selection of the lay-up was based on the developed multiaxial stresses in the off-axis layers. Special attention was given to the combination of normal and shear stresses in the off-axis layers, defined by bi-axiality ratios, λ [8]. Moreover, the laminates were selected in such a manner that “clean” stress fields can be developed, so that a direct link of the progressive damage with the λ ratios can be made, which is more difficult in multidirectional laminates, like in the case of quasi-isotropic laminates.
Apart from the choice of the appropriate laminate configurations for the multiaxiality study, special attention is given to the selection of the experimental techniques for damage monitoring. Various methods have been proposed for the identification of damage in glass fiber reinforced epoxies (GFREs) [8,19], but there is still not a straightforward method identified for measuring the continuous damage sequence in CFREs. For this reason, a combined nondestructive testing (NDT) methodology is proposed to qualitatively and quantitatively estimate the damage of the CFRE laminates. Taking advantage of the fact that flat laminates allow free edge damage monitoring during testing [20,21], in situ microscopy was used to monitor the through-thickness physical damage of the laminates throughout testing, and to correlate this damage with the developed stresses. As it has been proven in this study, the initiation and propagation of damage is not necessarily the same for every laminate configuration, and it strongly depends on the developed stresses, with the damage onset mode (i.e., transverse matrix cracking or delamination) being different depending on the dominant stress state in the composite laminate.
At the same time, the acoustic emission (AE) technique was applied to monitor the acoustic response of the laminates throughout the tests. AE is a NDT method that has been used in several applications for the damage characterization of composites and other engineering materials [22,23,24,25,26], either as a self-standing technique, or in combination with other NDT methodologies [27,28,29]. However, no direct correlation of the AE activity to multiaxial stresses developed in composite materials is found in the literature. In this work, it is proven that dissimilar multiaxiality in the same composite material can lead to different AE responses and dissimilar AE wave features from early loading stages. Identifying the different acoustic responses of the same material under different stress states can be used for structural health monitoring in real composite structures. At the same time, AE can be used as a predictive tool for the final material failure, based on the detection of early stage damage.
As a supporting tool, the digital image correlation (DIC) technique was used during testing. Through the DIC analyses, strain measurements and damage indications were obtained, which enhanced the results obtained during the microscopic analysis and the AE acquisition.
The final aim of this research is the establishment of a NDT methodology in order to physically estimate and measure the static tensile damage, and to correlate its sequence with the different multiaxial stress states acting in the flat CFRE specimens. Moreover, the characterization of the different AE responses related to dissimilar multiaxial stress states in CFRE specimens is a target of this research. Ongoing research is performed for the full damage characterization of the same CFRE material under different multiaxial stress states and under fatigue loads at the same time. Therefore, the data presented in this manuscript is used as an input for the fatigue damage characterization of angle-ply CFRE laminates, and it can serve as an addition to the available datasheets in the literature, in order to contribute to the development and validation of damage criteria and models.

2. Material and Equipment

2.1. Material

The material employed in the present study was TR 360E250S pre-preg CFRE laminates, manufactured by Mitsubishi Chemical Corporation (Tokyo, Japan). The pre-preg consists of PYROFIL TR 50S15L continuous PAN-based carbon fibers and PYROFIL #360 130 °C curing modified epoxy resin. The material was cured in compression molding for 7 min at a temperature of 140 °C and a pressure of 8 MPa, with no additional post-curing. The flat specimens were cut with dimensions according to ASTM D3039 [30], with a total length of 250 mm, width of 25 mm, and thickness of 1.83 mm. All of the specimens were tabbed for a length of 50 mm on both sides, to avoid unwanted failure caused by the gripping system. The material used for the tabs was the same CFRE material with a [45°/−45°]2s lay-up, and an epoxy, Araldite 420A+B, was used to bond the end tabs to the specimens.
The mechanical properties of the material were obtained by standard tests on [0°]4, [90°]8, and [+45°/−45°]2s specimens, with dimensions according to ASTM D3039 [30], and are listed in Table 1 (with σ1,ult, σ2,ult, and σ6,ult representing the ultimate longitudinal, transverse, and shear strengths, respectively; E1, E2, and G12 the longitudinal, transverse, and shear elastic moduli, respectively; and ν12 the Poisson’s ratio, all calculated in the material coordinates system). Three repetitions of each lay-up regarding the standard tests were performed in order to obtain the material properties.
The choice of the lay-up of the tested laminates was made in such a way that specific bi-axiality ratios were developed in their off-axis layers. The bi-axiality ratios are used in multiaxiality studies, with the aim of expressing the relation between the normal and the shear stress components. Specifically, the bi-axiality ratios are defined as follows:
λ 1   =   σ 2 σ 1 ,   λ 2   = σ 6   σ 1 ,   λ 12   = σ 6   σ 2 ,
where σ1 and σ2 are the longitudinal and transverse normal stress components, and σ6 is the in-plane shear stress in the material coordinates system. In this case, two angle-ply and unbalanced laminates, namely [0°/30°]2s and [0°/60°]2s, were experimentally investigated under quasi-static tensile loading conditions.
By using the classical laminate theory, the λ12 ratio in the off-axis layers of a [0°/θ]2s laminate for different values of the angle θ is plotted in Figure 1, showing that in the [0°/30°]2s laminates, λ12 is equal to 2.02, whereas in the [0°/60°]2s laminates, it equals 0.64. These values are a first indication that in the [0°/30°]2s laminates, the in-plane shear stresses are the dominant ones, whereas in the [0°/60°]2s laminates, the transverse stresses dominate the damage process.
The λ1 and λ2 ratios are also plotted in Figure 1, showing that the σ1 component in the off-axis layers of the two laminates is in the same order of magnitude as the σ2 and σ6 components. By using the classical laminate theory, it can be calculated that until the end of the test, the σ1 component has only reached 16% of the ultimate strength of the material in the fiber direction σ1,ult for the [0°/30°]2s laminates, and only 2% of σ1,ult for the [0°/60°]2s laminates, therefore resulting in the absence of fiber damage in the off-axis layers.
This proves that the mechanical response and the damage in the respective 30° and 60° off-axis layers is matrix dominated, with behavior driven by the developed transverse and shear stresses. This permits the study of the progressive damage with respect to different combinations of the transverse and shear stresses only, or, in other words, with respect to different values of the λ12 ratio. The reason behind the insertion of 0° layers in the tested laminates was to guarantee a progressive damage sequence during testing, and not a sudden failure that would be expected in laminates consisting of off-axis layers only.

2.2. Testing Equipment and Experimental Techniques

All of the tests were performed on a MTS (Eden Prairie, MN, USA) servo-hydraulic test bench with a load cell of 100 kN capacity. The material was stored at ambient conditions and the tests were conducted at room temperature and humidity. The quasi-static tests were performed in a displacement control with a rate of 1 mm/min. Both continuous and interrupted static tests were performed; firstly, to obtain all of the mechanical material properties, and secondly, to perform damage monitoring using in situ microscopy. At least three repetitions for each test case were performed, in order to have statistically acceptable results.
In Figure 2, the total experimental set-up is presented. For the optical analysis, a Leica Microsystems (Wetzlar, Germany) MZ125 stereomicroscope with 8–100× magnification and 375 line-pairs/mm resolution was mounted on the test bench so as to monitor the free edge of the specimen and to perform through-thickness damage observations. The microscope was mounted in such a way that movements along the specimen axis were possible, allowing for damage monitoring over a total length of 70 mm along the gauge length of the specimen. The static tests were interrupted at regular steps and images were captured while keeping the specimen mounted and without unloading it. During all of these intervals, images with different magnifications were manually captured. Prior to testing, the sides of the specimens were polished using SiC grit papers of descending particle size (from 46 µm down to 5 µm) so as to remove possible edge fracture initiation points, and to improve the microscopy analysis.
An eight-channel DiSP system by Mistras Group (Princeton Junction, NJ, USA USA) was used for monitoring the acoustic activity. Two piezoelectric transducers (Pico) with a broadband response and peak frequency at 450 kHz were mounted on the front side of the specimen. Vaseline was applied for the acoustic coupling and duct tape was used to guarantee a stable placement of the sensors on the specimen. The signals were pre-amplified by 40 dB and a 35 dB threshold was applied in order to filter out the noise of the mechanical system. In order to take into account only signals related to the specific damage incidents during the test, linear localization algorithms were performed by taking into account the wave velocity and the attenuation effect, both measured by performing pencil lead breaks prior to testing. Through the post-processing of the AE data, the overall AE activity was analyzed.
The deflection during testing was measured using a 50 mm MTS extensometer, and last but not least, a DIC system, VIC-3D by Correlated Solutions (Columbia, SC, USA), was used in order to obtain the full-field strain maps on the surface of the specimen. A black/white speckle pattern was applied on the specimen using aerosol paint. A pair of 5 MP Stingray cameras and 23 mm focal length lenses were used. The strain calculation was obtained through the triangulation of the two cameras. Through the DIC software and the post-processing tools, the strains (longitudinal, transverse, and shear) developed on the surface of the specimen were obtained. In order to achieve this, the change in the average grey scale intensity of the specific collections of pixels, called subsets, between the reference and the deformed images was tracked in the DIC software. The middle point of any subset on the correlated area corresponds to one data point. By taking into account the subset size and the step size (defined as the spacing of the data points analyzed during correlation), an average map of the strains and other parameters was obtained. For the DIC analysis, a subset of 21 by 21 pixels was used and a step of seven pixels both in the vertical and in the horizontal direction was applied. Images were captured every one second.

3. Results and Discussion

3.1. Mechanical Response and Damage Development under Static Tension

Initially, tensile quasi-static tests were performed in order to obtain the mechanical properties of the angle-ply laminates, summarized in Table 2. Both laminates have an equal amount of 0° layers in the loading direction, and taking into account classical laminate theory, it is expected that the [0°/30°]2s laminates display a higher ultimate strength and elastic modulus than the [0°/60°]2s laminates. However, the increase in strength acquired by the [0°/30°]2s laminates compared to the [0°/60°]2s laminates is only 4.1% and the increase in stiffness is equal to 5.2%, showing that the two laminates lead to very similar mechanical behavior, when only the mechanical properties are taken into account. In Figure 3, the stress–strain curves of the two laminates are plotted.
Despite the fact that the two angle-ply laminates present similar mechanical properties, their main difference lies in the damage sequence during testing. Taking into consideration the tensile quasi-static tests of the angle-ply laminates, specific stress levels were chosen and stepwise tests were then performed by stopping the tests in these stress levels. With this methodology, monitoring of the through-thickness damage of the two laminates with the in situ microscope was possible, by keeping the specimen mounted on the test bench under an applied tensile load. Test interruptions were performed for every 80 MPa of applied stress from the beginning of the test up to 50% of the ultimate strength σult, then every 40 MPa up to 75% of σult, and then finally every 20 MPa until test failure. In this way, iterative measurements of the developing damage could be assessed at different load levels. Figure 4 and Figure 5 demonstrate the damage state of one [0°/30°]2s laminate and one [0°/60°]2s laminate, respectively, at different percentages of σult.
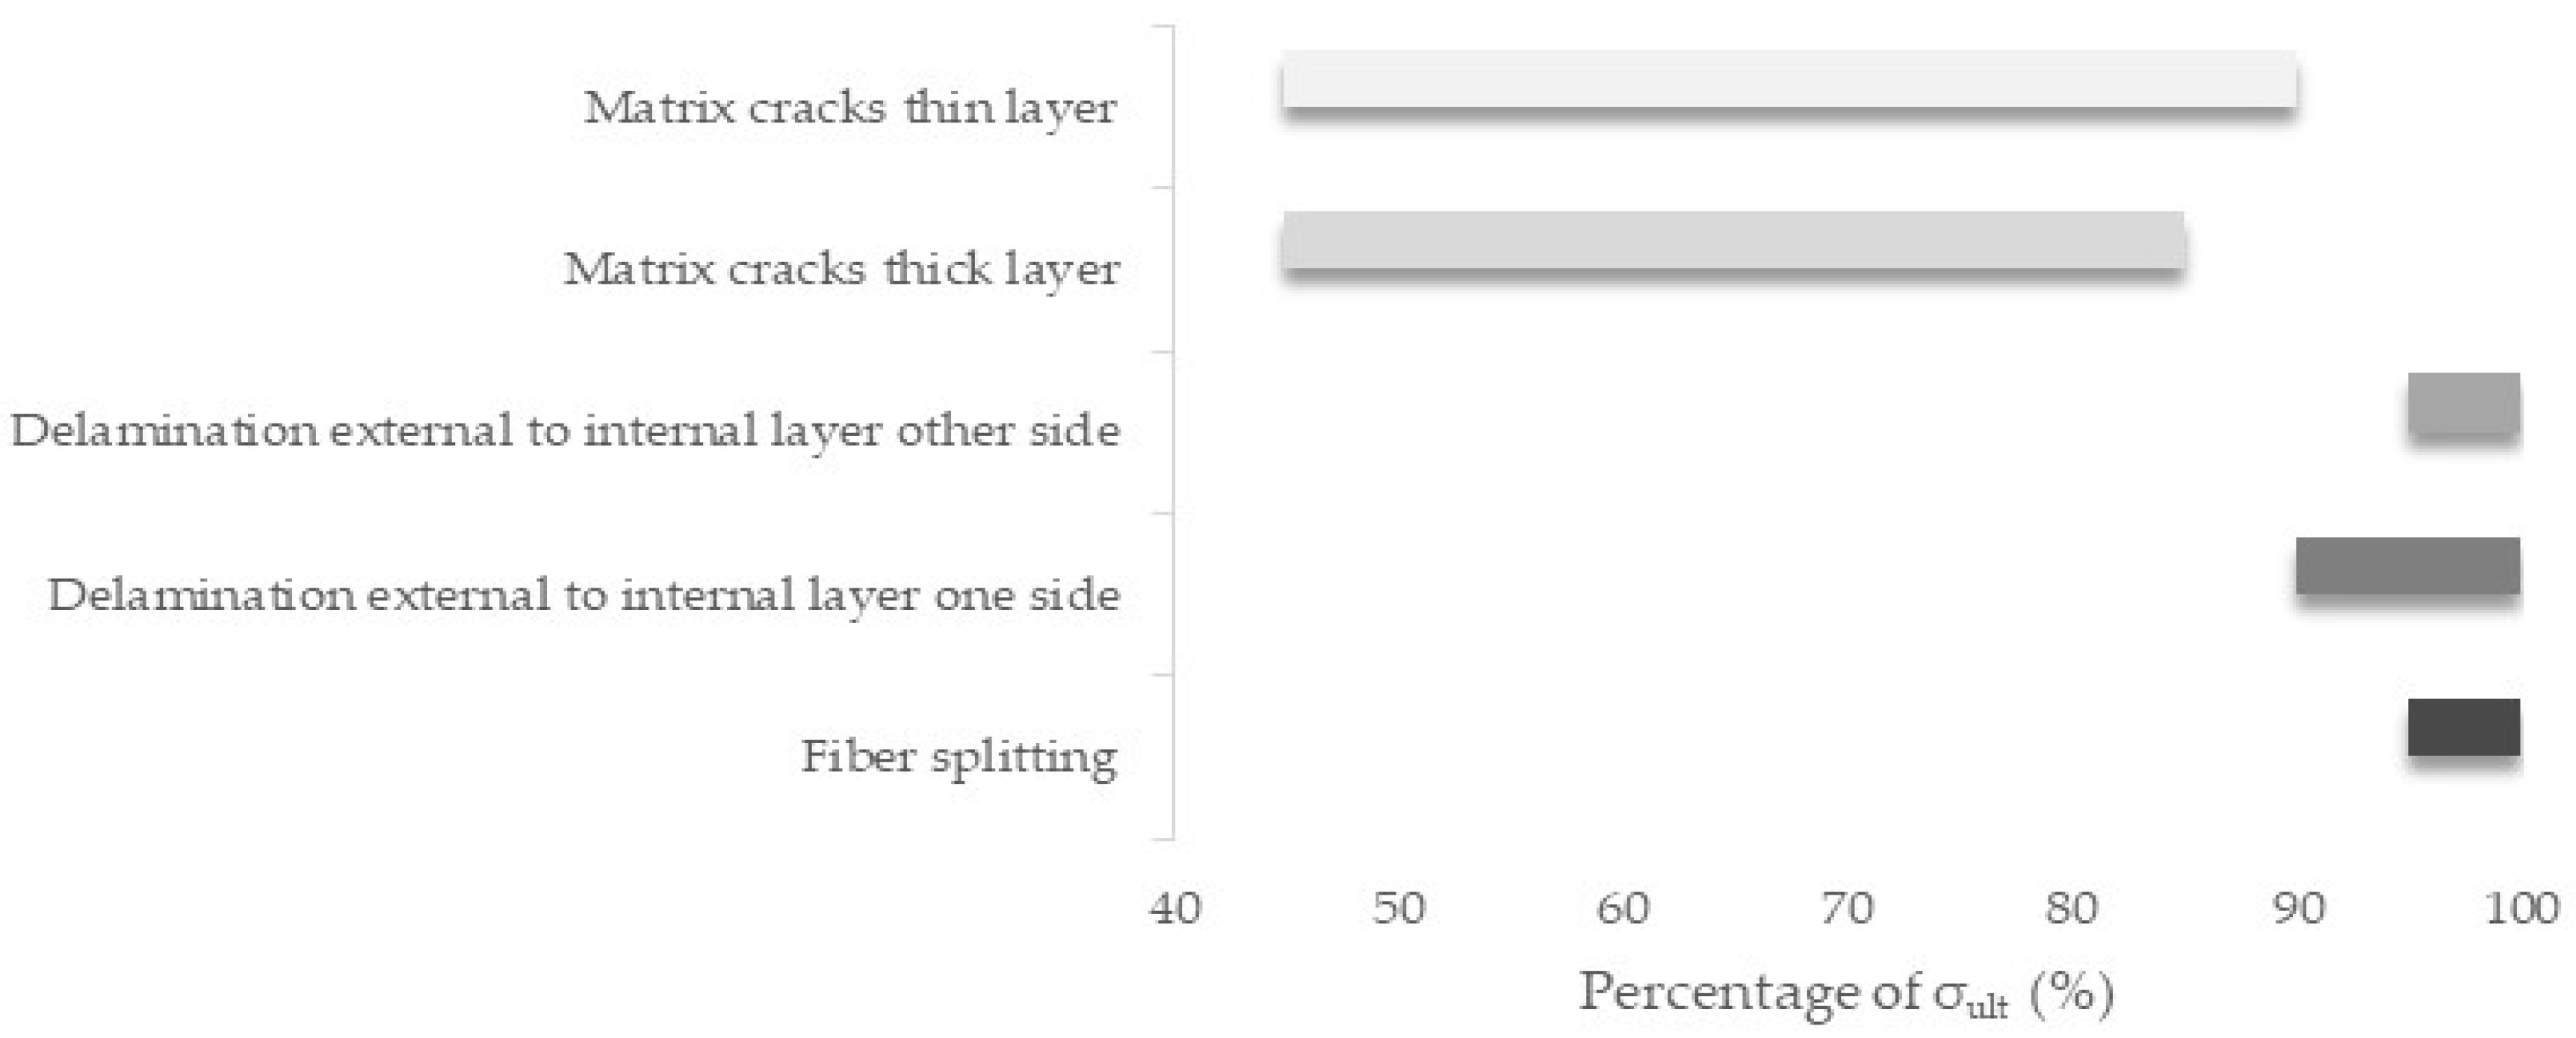
Starting with the [0°/30°]2s laminates, until 70% of σult, no damage was observed by the microscope. As shown in Figure 4a, at this stress, fiber splitting at one of the external 0° layers was observed, and when the stress reached a value equal to 75% of σult, interlaminar delamination between this outer 0° layer and the adjacent thin 30° layer was observed (external delamination), with no prior matrix cracking of the off-axis layers. Around the same stress level, fiber splitting at the second external 0° layer occurred and some limited matrix cracks in the thick 30° layer (two middle 30° layers) were recorded, which increased negligibly until the end of the test. At approximately 80% of σult, a second delamination between the external 0° layer and the adjacent off-axis layer was visible on the opposing side (Figure 4b). The fiber splitting at both external sides came to a saturation point at a stress equal to 85% of σult, whereas the length of the delaminations was increased incrementally until the end of the test. At around 85% of σult, multiple matrix cracks were recorded in one of the thin 30° layers along a limited length of the layer in the area of the previously formed delamination (Figure 4c), and this led to the appearance of a third internal delamination between this layer and the inner 0° layer shortly afterwards, at around 87% of σult (Figure 4d). The growth of all of these delaminations resulted in the final failure of the material, after catastrophic fiber breakage.
For the [0°/60°]2s laminates, the damage sequence was remarkably different (Figure 5). Damage was detected by the microscope much earlier than in the [0°/30°]2s laminates, starting from a stress equal to 45% of σult. However, the first appearing damage mode was matrix cracks and not delaminations. The matrix cracks occurred in all of the off-axis layers randomly, and they progressively increased in number. After 60% of σult, multiple matrix cracks were monitored in all of the off-axis layers, with a higher crack density for the thin off-axis layers (Figure 5b,c). The matrix cracks became saturated only at a level of 90% of σult and, only after this point, was an initial delamination between one of the external 0° layers and its adjacent thin 60° layer observed (Figure 5d). The corresponding delamination on the other side of the specimen occurred at around 95% of σult and, moreover, only during the application of the last 5% of σult, was fiber splitting evident at the external 0° layers.
Taking all of the above into consideration, in Figure 6 and Figure 7, the total damage progression during the quasi-static tests for the [0°/30°]2s and the [0°/60°]2s laminates, respectively, is shown as a percentage of the applied stress. The loading periods during which the different damage modes appeared in the test are plotted, defining which modes appeared first and which were overlapping in a specific percentage of the stress. The values of the stress are averaged, with the deviation being very small, in the range of 1–1.5%. In both of the laminates, the final catastrophic failure occurred because of brittle fiber breakage in the loading direction.
Looking at the different damage progression of the two angle-ply laminates, one can recognize the influence of the different multiaxiality in the sequence of the appearing damage modes. Taking into account the [0°/30°]2s laminates, in which the shear stresses are dominant in the off-axis layers, delaminations are prone to happen even before matrix cracking, which is in disagreement with the damage sequence that is generally accepted for the composite materials, presuming that matrix cracking is always the onset damage mode. Indeed, in the case of the [0°/30°]2s laminates, interlaminar delaminations start at a total stress of around 1030 MPa (around 75% of σult), with no prior matrix cracking. Therefore, delaminations are reasonably attributed to the developing shear friction and intralaminar shear debondings due to the high shear stresses that are developed in the laminate layers. The delamination events together with the continuously increasing shear stresses lead to the appearance of matrix cracks, which then lead to the development of internal delaminations at around 1200 MPa stress (87% of σult).
On the other hand, in the [0°/60°]2s laminates, in which the transverse stresses dominate the stress state, the damage sequence follows the commonly accepted damage sequence of the composite materials, with matrix cracks increasing in number throughout the test. Because of these matrix cracks and fiber/matrix debondings occurring as shear stresses arise, delaminations occur, but only later in the test, at a stress of around 1200 MPa (90% of σult), with no internal delaminations being observed until the end of the test.
Based on all of the above, it is clear that the damage sequence in composite materials is not straightforward and unique, and that it strongly depends on the developed stress states. It has been already shown in literature [8,14] that shear has a detrimental effect on the mechanical response of composite materials under fatigue loading. However, it is proven from the current work that when shear is dominant, a detrimental influence regarding the appearance of delaminations exists even under static loads. High shear stresses and strains seem to lead to intralaminar shear debondings, which quickly propagate into multiple interlaminar delaminations. In Figure 8, the engineering shear strains that are developed in the two laminates as measured from the DIC software are plotted versus the applied stress. For the calculation of the shear strains, the average strains for the total amount of analyzed points on the surface of the specimen were taken into consideration. It is clearly shown that in the [0°/30°]2s laminates, high shear strains occur, leading to internal shear debondings and, consequently, to early delaminations.

3.2. Quantitative Damage Assessment

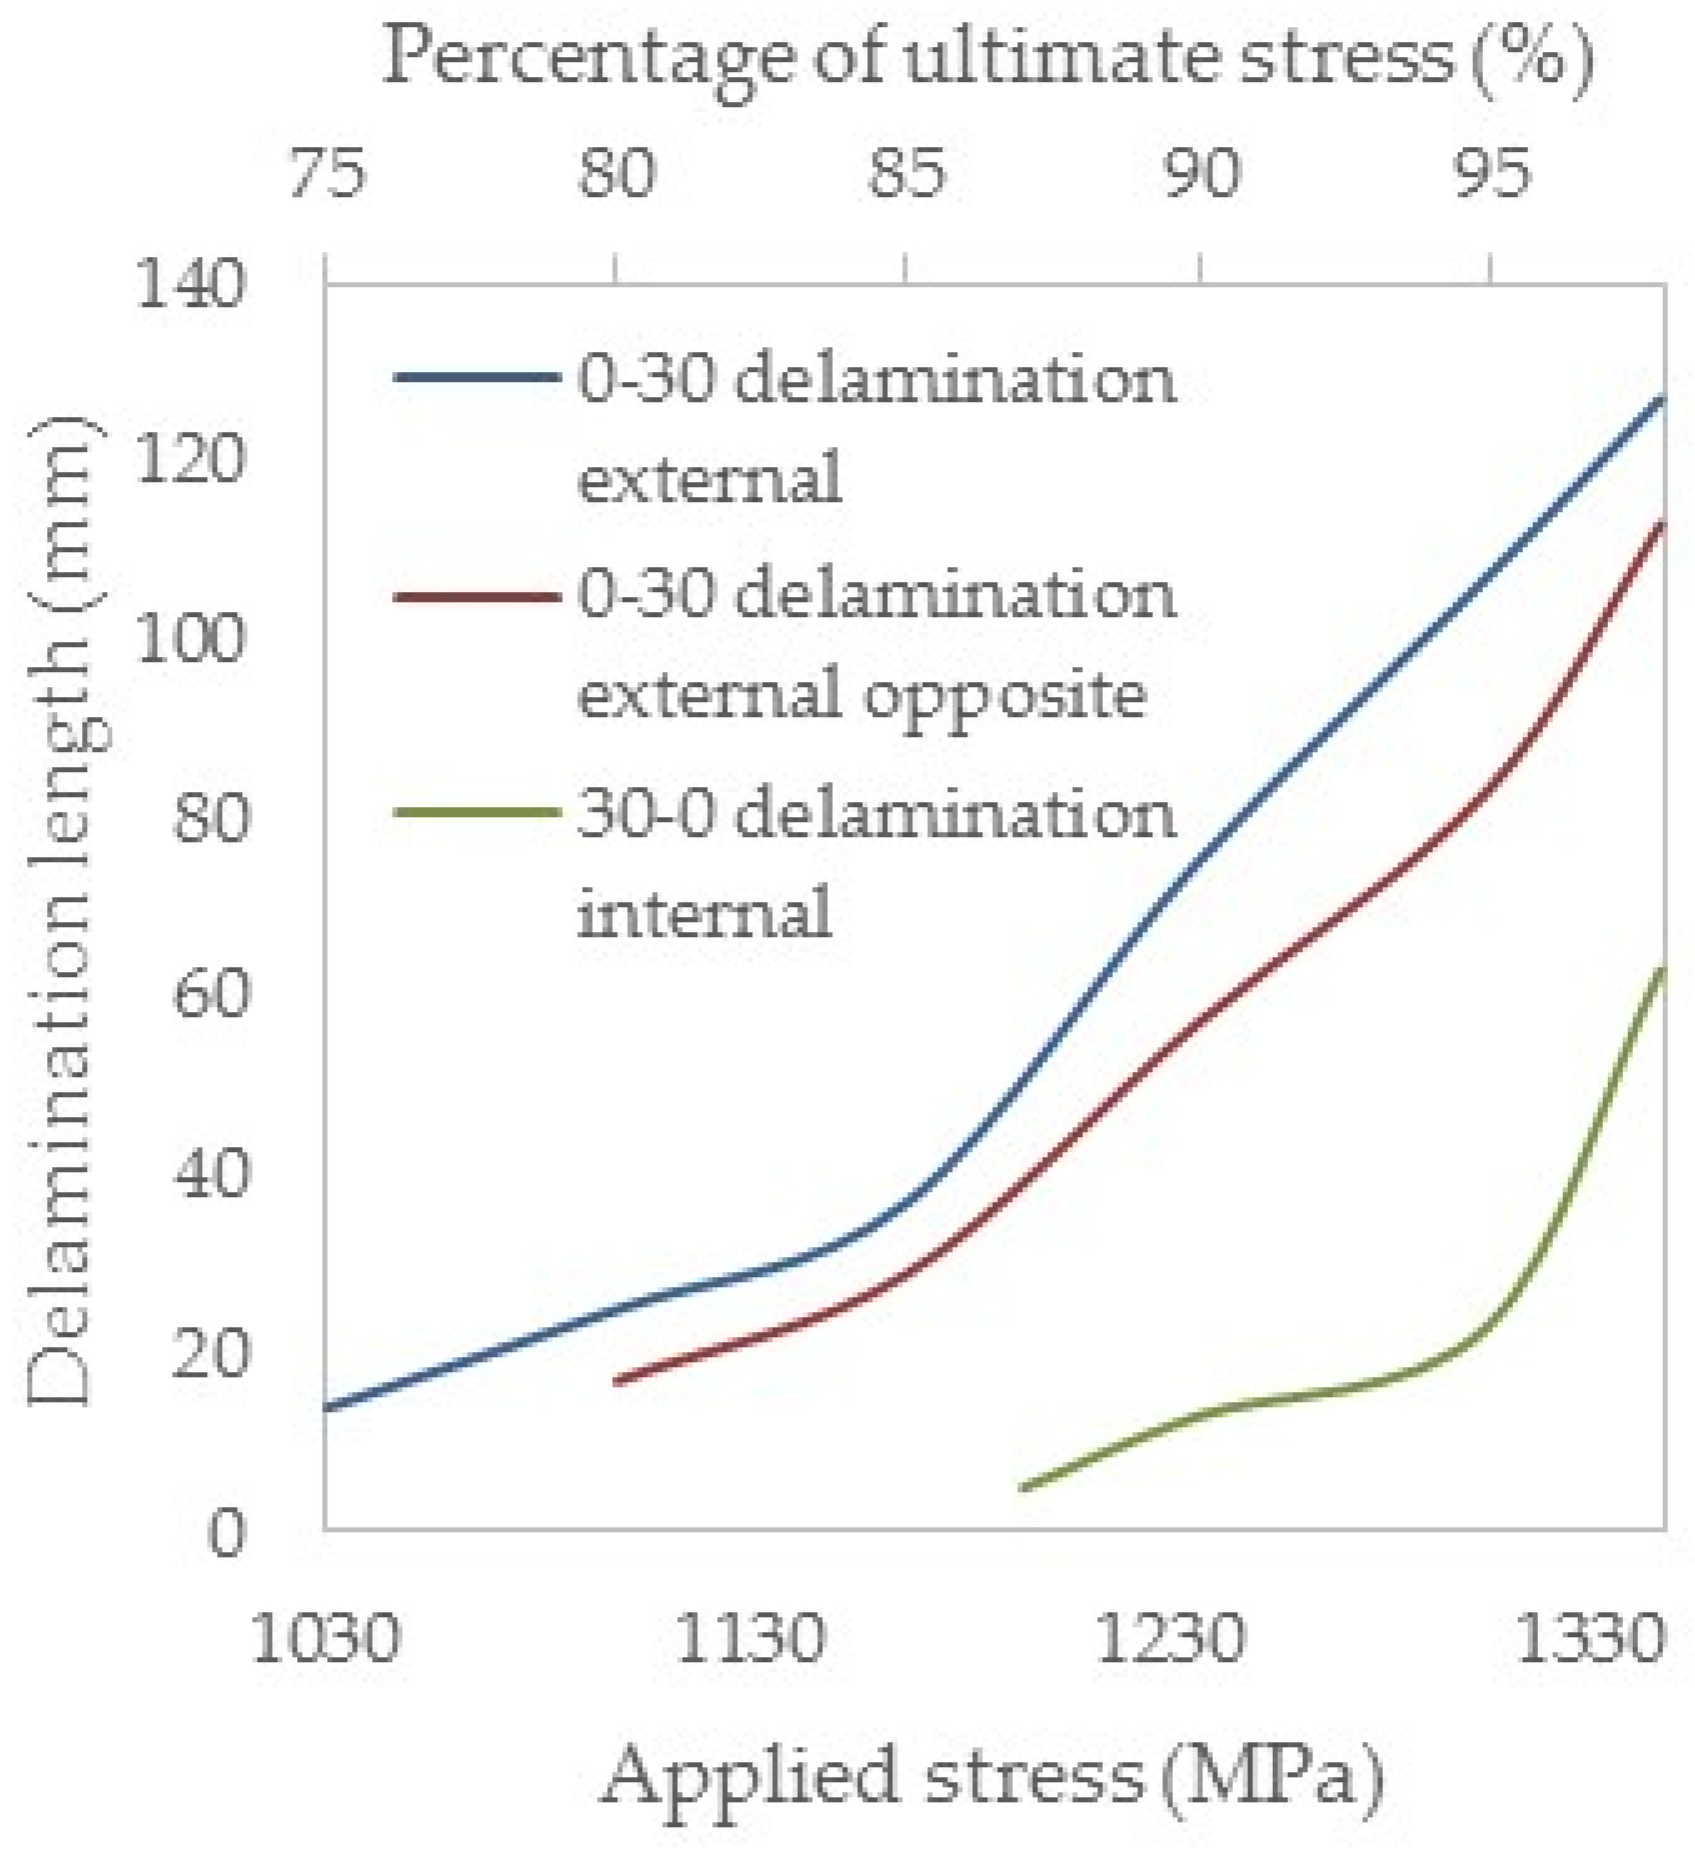
For a more quantitative damage description, and in order to better highlight the detrimental influence of shear, Figure 9 and Figure 10 show the evolution of the length of the different delaminations that appeared in the [0°/30°]2s and the [0°/60°]2s laminates, respectively, versus the applied stress and also versus the percentage of σult, as measured with the microscope. The values on the horizontal axis range between the value at which delamination was first observed and the value at which the final scan was performed, at a stress equal to approximately 98% of σult.
It is shown that in both cases, delamination accumulated constantly from its onset until the global failure. It is clearly shown that shear has a dramatic influence not only on the damage sequence, but also on the extent of damage. In the [0°/30°]2s laminates, the delaminations at the two external layers exceeded 100 mm in length, with average values of 125 mm and 115 mm, respectively. The delamination between the internal layers obtained a quite significant length, equal to 60 mm on average. On the other hand, in the [0°/60°]2s laminates, the delaminations were developed to a lower extent, reaching lengths of around 60 mm and 45 mm, close to the final failure of the material. Good repeatability was obtained among all of the different specimens tested for each lay-up.
In Figure 11 and Figure 12, the matrix crack density in the monitored length versus the percentage of σult for the [0°/30°]2s and the [0°/60°]2s laminates, respectively, is plotted. The crack density is expressed as number of cracks/mm and is measured by using the post-processing tools of the Leica software (as presented in Figure 5).
It is shown that the matrix cracks appeared late in the test for the [0°/30°]2s laminates, after 1030 MPa stress (75% of σult), and they were stochastically distributed in the thick 30° layer. The density of these cracks was low, therefore a magnification of its evolution in the same horizontal range is presented in Figure 11. Regarding the thin 30° layer, matrix cracks only occurred after a stress equal to 85% of σult, due to the former developing delaminations between the 30° and 0° layers. The crack density in the thin off-axis layer was high, more than two cracks/mm, but it was restricted to a limited length of the layer, equal to 15 mm on average. However, this high crack density proved to be responsible for the occurrence of internal delaminations.
On the other hand, in the [0°/60°]2s laminates, matrix cracks occurred at around 600 MPa (45% of σult) both in the thin and thick off-axis layers. However, it is remarkable that a higher crack density was measured for the thin 60° layers. The rate of the measured crack density reached an asymptote after a stress level of 900 MPa (68% of σult), and the cracks came almost to a saturation after 1100 MPa (83% of σult).
It is important to mention here that the measurements presented previously correspond to the damage developed on one side of the sample. In order to confirm that the findings of the microscope along one edge of the specimen were not caused by an unbalanced load introduction, a Dino-Lite (New Taipei City, Taiwan) USB-microscope with 1.3 MP sensor was used for damage monitoring on both sides of the specimens, during all of the test intervals. The advantage of this microscope is its flexibility, as it can be used to scan the total length of the specimens. On the other hand, the fact that the microscope is not mounted and that clear focus is not optimally achieved, leads to distorted pictures, which are not ideally acceptable for reporting exact measurements. However, they have been successfully used to confirm similar damage progression on both sides of the specimens.
Moreover, post-mortem monitoring was performed in at least two load steps for the two laminates tested, by removing the specimen from the test bench, cutting it, and monitoring the through-thickness damage inside the material. This was done in order to confirm that the observed damage was not driven by free edge effects on the outer side of the specimen. Despite the fact that the matrix cracks were not visible enough, as no load was applied during the post-mortem monitoring, the through-thickness damage findings on the side of the material were confirmed by the damage inside the bulk material, especially regarding the appearance and size of the delaminations.

3.3. DIC and Poisson Ratio as Damage Indicators

Apart from monitoring the damage and creating databases for the full characterization of a material, different techniques also have to be used in order to create damage indicators during testing. Supplementary to the aforementioned damage observations, the DIC can also be used for damage indications at least in a qualitative way. This can be done by using the σ value of the DIC software. This parameter represents the confidence interval for the match at any data point (defined as the middle point of a subset) of the correlated area (with respect to the initial reference image corresponding to the unloaded situation) and is measured in pixels. Any mismatch between the reference image and a deformed image during loading is received as an error in the DIC software, and is expressed as an increase in the σ value.
In Figure 13, the σ pattern over a 50 mm by 25 mm area of a [0°/30°]2s laminate (with 50 mm being the vertical dimension of the correlated area, representing the length of the specimen, and 25 mm being the horizontal dimension, representing the width of the specimen) for two subsequent DIC pictures is shown. The loading direction corresponds to the vertical dimension. The images were taken at a stress equal to 80% of σult, at which the second delamination in the laminate made its appearance. The significant difference of the σ pattern on the surface of the specimen between the two successive DIC images (corresponding to Figure 13a,b, respectively) shows that the σ pattern could successfully indicate the appearance of delamination. This difference in the σ pattern can be attributed to the out-of-plane displacement of the laminate, due to the occurring delamination between the underlying layers.
The same applies for the [0°/60°]2s laminate, for which in Figure 14, the σ pattern at two subsequent pictures at around 90% of σult is shown. The higher σ values in Figure 14b in comparison with Figure 14a indicate out-of-plane movements, confirming the appearance of delamination at this stress level also in this case. At the same time, higher σ values were obtained for the [0°/30°]2s laminates, coming to good agreement with the fact that at a stress value equal to 80% of σult, delaminations of a greater extent were observed, leading to higher out-of-plane movements. However, these observations are only qualitative, indicating that a change in the pattern of the σ value can be a sign of the appearance of delaminations.
Apart from the NDTs that are commonly applied for indicating damage in composite materials, it is known that the way that simple mechanical properties of a material evolve during testing can also be used as a damage indicator, and can provide additional verifications regarding the damage process. In this direction, this study considers the evolution of the Poisson’s ratio, defined as the negative ratio of the transverse strain to the longitudinal strain, calculated using the DIC surface strain measurements. This proves at the same time, that accurate strain measurements by the DIC software assist in the calculation of other mechanical properties, like the Poisson’s ratio, as well.
In Figure 15, the evolution of the Poisson ratio versus the applied stress is plotted for both of the testing configurations. In the beginning of the test, the Poisson’s ratio values corresponded to the theoretically calculated values using classical laminate theory. However, the evolution of the Poisson’s ratio was different for the two angle-ply laminates, as damage accumulated during the quasi-static test. As shown in Figure 15, in the [0°/30°]2s laminates which are characterized by higher shear strains, the Poisson’s ratio was higher and was continuously increasing until the stress level at which delamination occurred. After a stress of 1000 MPa, a decreasing trend was monitored coinciding with the appearance of delaminations, as indicated in Figure 15. On the other hand, in the [0°/60°]2s laminates, the Poisson’s ratio was constant in the initial part of the static test and it started decreasing at a stress value close to the point that matrix cracking occurred, having lower values than the [0°/30°]2s laminates. The above proves that even global mechanical properties, like the Poisson’s ratio, can qualitatively indicate the transition from moderate to severe damage.

3.4. Damage Identification Using AE

Moving further with the damage identification, the total AE activity of the two laminates recorded during the quasi-static tests is plotted in Figure 16. It is important to mention at this point that in order to guarantee that microdamage related signals would be recorded by the AE software, a quite low amplitude threshold equal to 35 dB was applied. In addition, linear localization was used to eliminate sources out of a certain gauge length (considered as non-relevant or noise). Furthermore, in order to exclude the possibility of electromagnetic noise and triboelectric effects, all of the AE waveforms characterized by zero energy in the software were removed from the analysis, which is a common practice in similar AE studies in the literature [31,32].
Looking at Figure 16, the first remark is that AE activity was recorded for the [0°/30°]2s laminates quite a lot earlier than for the [0°/60°]2s laminates. Additionally, more AE events were in total recorded for the [0°/30°]2s laminates, in comparison to the [0°/60°]2s ones. The deviation between the two laminates is more clearly shown after 70% of σult, after which extensive damage started occurring in the [0°/30°]
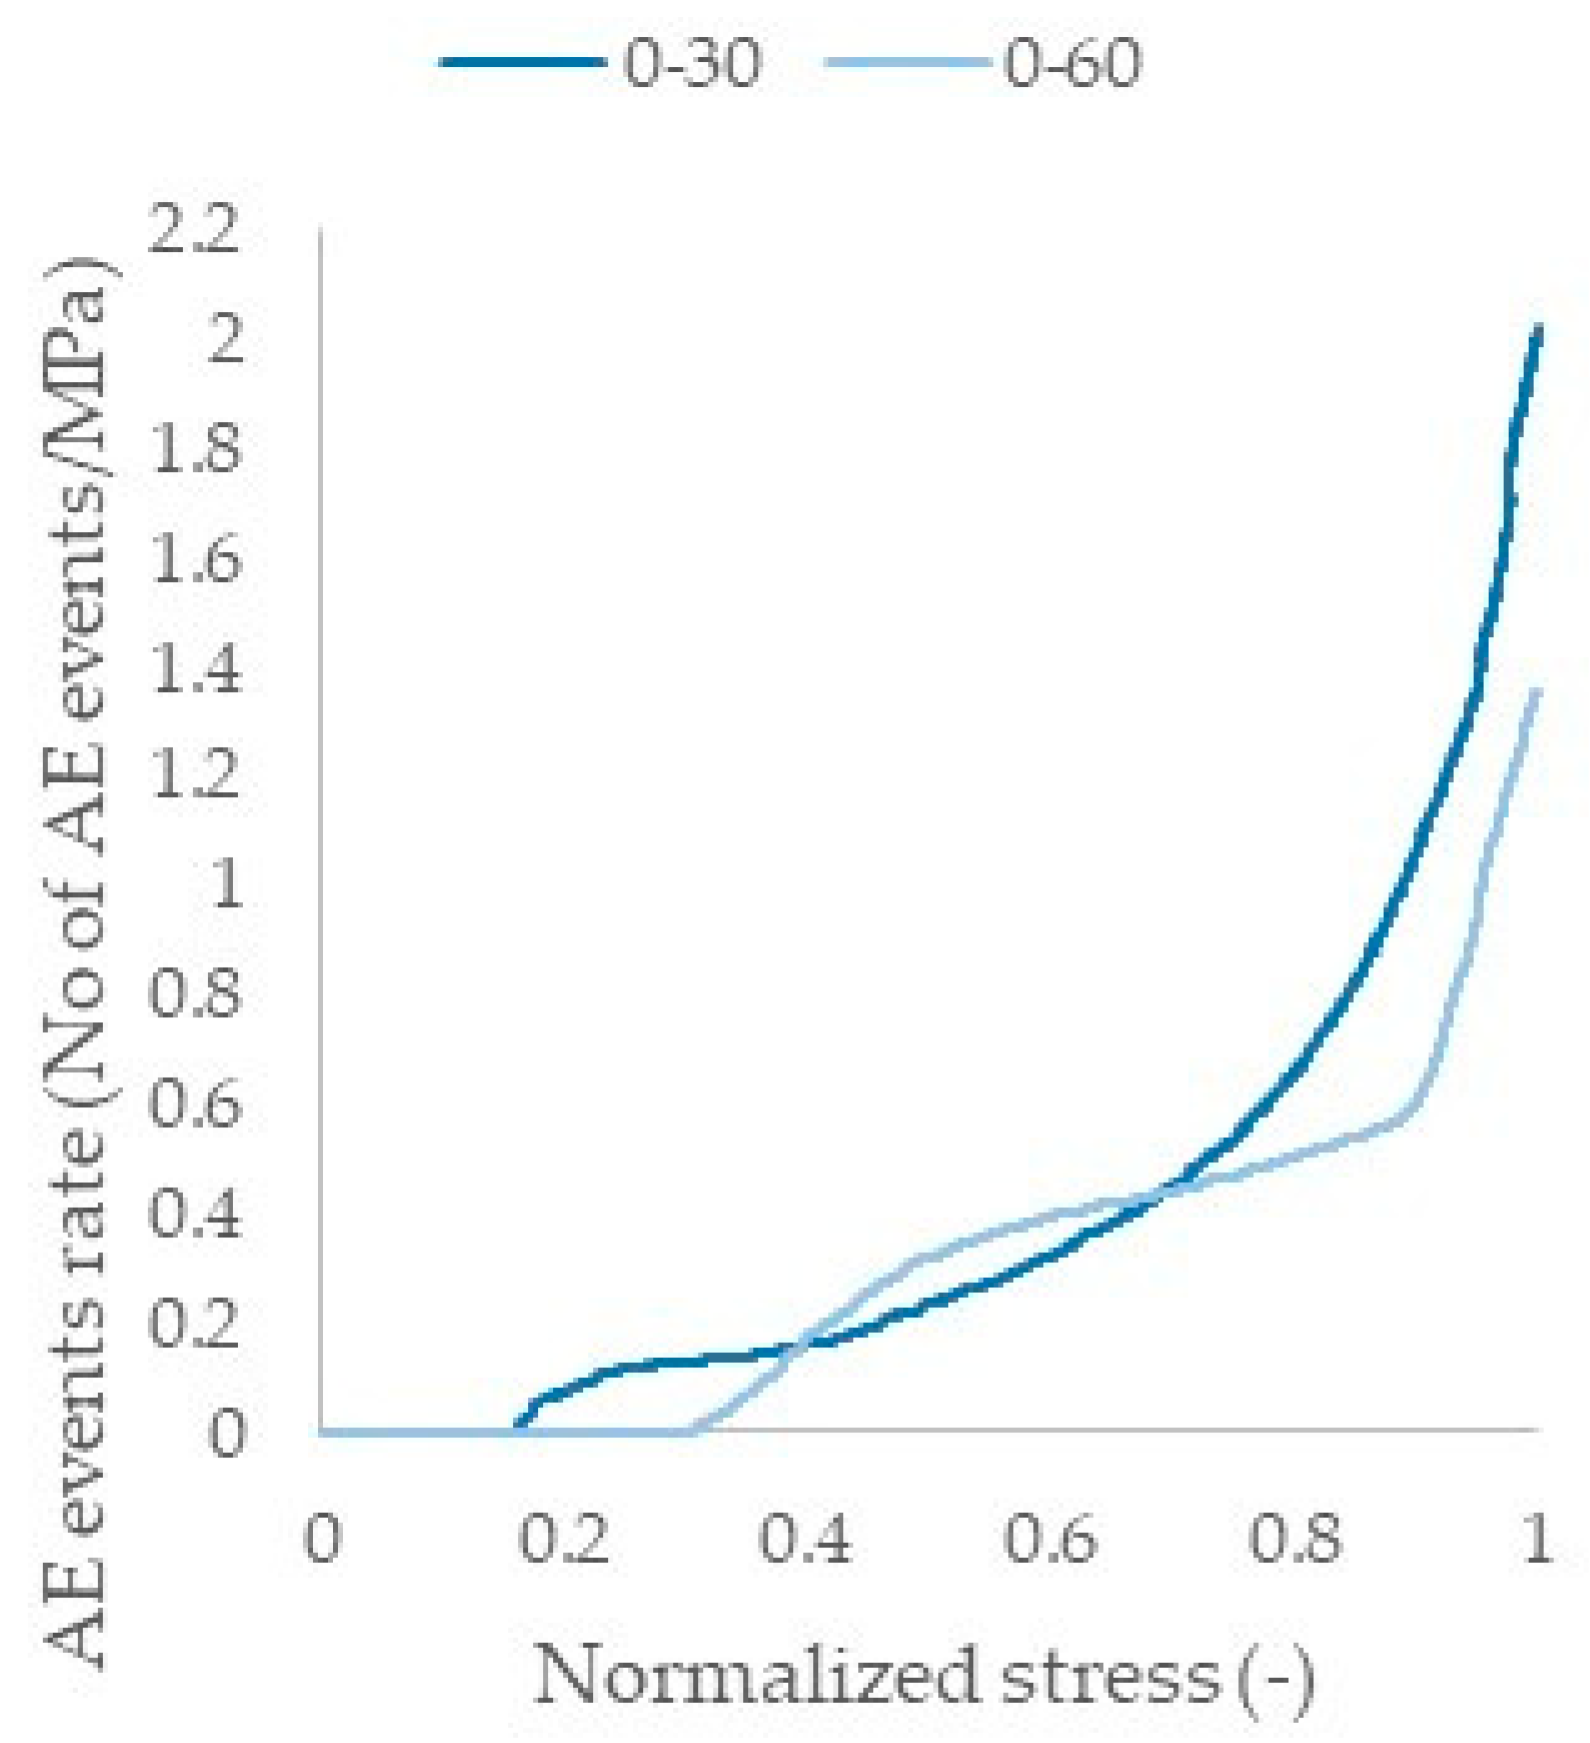
2s laminates. In order to achieve a more direct correlation of the AE activity with the stress increase in both laminates, in Figure 17, the AE events rate is plotted versus the normalized stress. The AE rate is calculated with respect to the applied stress and is therefore expressed as “number of AE events per MPa”.
In detail, the AE activity started occurring in the [0°/30°]2s laminates quite early, at an applied stress less than 20% of σult. At the same stress level, no AE was recorded for the [0°/60°]2s laminates. In the absence of observable damage mechanisms until a stress equal to 70% of σult in the [0°/30°]2s laminates, and taking into account the fact that the only differences between the two laminates are the higher shear stresses and strains of the [0°/30°]2s laminates, most of this early stage AE activity of the [0°/30°]2s laminates is reasonably attributed to internal shear damage, appearing in the form of intralaminar shear debondings. These shear debondings increased in number as the test progressed, and led to the development of interlaminar delaminations, confirmed by the high AE activity after a stress equal to 70% of σult, being in very good correspondence with the microscope observations.
For the [0°/60°]2s laminates, the AE activity was initiated at a quite higher stress level, equal to approximately 30% of σult. At this stress level, the AE events recorded were related to the initial matrix microcracking, which was not visible with the microscope, and until 60% of σult, a rapid increase in the number of the AE events was evident, coinciding with the stage at which matrix cracks were monitored with the microscope. This response is more pronounced in the curve of the AE events rate, shown in Figure 17. This rate of the AE activity continued until a stress equal to 90% of σult, following the increase of the matrix crack density, and after this, an almost instant increase in the number of AE events occurred, coinciding with the appearance of delaminations after this stress value.
The above confirms that AE can, even from an early analysis of the cumulative total activity, indicate the appearance of the occurring damage in the material as well as the transition to other damage modes or to extensive damage. It is also proven that AE can indicate the damage presence even prior to any optical observations, therefore allowing its application for the structural health monitoring in real composite structures by predicting macroscale damage based on early AE activity.
It should be noted here that the above results regarding the onset and the evolution of the AE activity depend on the choice of the applied threshold. However, as the laboratory conditions allowed the application of a quite low amplitude, equal to 35 dB, and taking into account the small cross section of the specimens, it is not considered likely that other significant damage sources were not recorded. At the same time, the application of the zero-energy filter allowed for the limitation of the noise signals.
Of course, the AE difference between the two laminates is not only quantitative, but also qualitative. This means that the signals related to specific damage sources have certain patterns, and a features analysis is necessary in order to distinguish the damage modes and to detect the damage mode transition. It is proven that the two angle-ply laminates under consideration have different features related to their damage, which is shear dominated for the [0°/30°]2s laminates, whereas it is matrix cracking dominated for the [0°/60°]2s laminates. In the current study, the rise time proved to be the most characteristic feature to prove that different multiaxiality and damage modes lead to different shapes of the AE waveforms. Undoubtedly, different AE features exist, like, for instance, the frequency and the energy, which may contribute to a more complete damage characterization. However, the rise time and its evolution was proven to be the most indicative AE feature for proving the variation of the AE waveforms when variable stresses and damage mechanisms are dominant in the CFRE laminates. The rise time is defined as the time interval between the first threshold crossing and the signal peak, as shown in Figure 18, for a typical AE waveform.
In Figure 19, the average rise time values for the two angle-ply laminates measured at specific stress levels during the quasi-static tests are plotted. It should be mentioned that, as fracture in composites is a stochastic phenomenon, large scatter in AE is inherent. However, what is more important is whether consistent trends of the average values of the AE features are obtained, which is the case for the rise time recorded throughout the quasi-static tests for both laminates under consideration.
As shown in Figure 19, there is a significant difference in the average rise time values between the two laminates. More specifically, the rise time was constantly higher throughout the static test for the [0°/30°]2s laminates. Even from a low stress, high average rise time values were recorded, related to potential intralaminar shear debondings due to the high shear stresses. The rise time continued to increase constantly, until the end of the test, following the increase in the shear stresses, the development of shear debondings, and the appearance of delaminations after 1000 MPa. It is clearly shown that these shear related mechanisms, or in other words, mode II damage incidents, in which a shear stress is acting parallel to the plane of the crack and perpendicular to the crack front, lead to AE signals with high rise time values. A characteristic example is presented in Figure 20, in which the evolution of the average rise time values versus the average delamination length in the [0°/30°]2s laminates is plotted. The rise time constantly increases following the increase of the delamination length and the release of mode II AE signals.
On the other hand, the average rise time values were significantly lower in the [0°/60°]2s laminates. At 300 MPa stress, no rise time value is plotted, as no AE activity was recorded until this stress level. When the matrix cracks started appearing, the rise time increased above 80 μs, but it remained more stable during the test, following the continuous development of matrix cracks, which are characteristic mode I fracture mechanisms, where two opposing stress components are applied on the crack sides, both vertical to the crack plane. A greater increase of the rise time was only measured towards the end of the test, coinciding with the appearance of delaminations, as recorded with the microscope, and coming to a good agreement with the corresponding increase in the [0°/30°]2s laminates.
The above results lead to the significant conclusion that high rise time values, higher than 100 μs, are linked to shear related phenomena, like intralaminar shear debondings and interlaminar delaminations, with increasing values when damage accumulates. On the other hand, smaller rise time values are expected when matrix cracks occur, with more stable values during the damage formation. Supporting conclusions regarding the evolution of the rise time, when tensile or shear related fracture phenomena occur, are found in the literature for other materials, like, for instance, [25] for glass/epoxy composites and [33] for the more traditional concrete. This means that the rise time can be used for the identification of damage modes in CFREs and for the estimation of the occurring stresses at the same time, as increasing shear stresses result in increasing rise time values. Nevertheless, it should be mentioned that the aforementioned results have been obtained for a specific type of CFRE laminate. Different constituents of the composite material, as well as the size and the geometry of the tested specimens, may have an effect, therefore, ongoing research regarding the different parameters that affect the evolution of the AE parameters and the applicability of these findings on larger scale components is performed. Although similar parameters (like rise time) are expected to be sensitive to damage, the numerical exact values are expected to differ when measured in another scale.

4. Conclusions

In the present work, two angle-ply CFRE laminates, [0°/30°]2s and [0°/60°]2s, were tested under quasi-static tension in order to qualitatively and quantitatively assess their damage development using different NDT techniques. By using an in situ microscope, mounted on the frame of the test bench, through-thickness free edge damage monitoring of the laminates was feasible. Through this monitoring, it was proven that when different multiaxial stresses are developed in the same material, significantly different damage sequences occur, even if similar mechanical properties are obtained, with noteworthy findings that can be used for further fatigue studies and for the development and/or validation of damage criteria. Specifically, when shear stresses were dominant, interlaminar delaminations had a greater potential to occur earlier in the test, even prior to matrix cracking, resulting from the developing intralaminar shear debondings and shear friction due to the increasing shear stresses. On the other hand, when the transverse stresses were the dominant ones, matrix cracks occurred early in the test, but delaminations only appeared closer to the final failure of the material. Significant differences were also evident regarding the damage magnitude when the stress state was dissimilar. In the presence of extensive shear, higher delamination lengths were measured until the ultimate failure.
At the same time, it was proven that different experimentally measured parameters can be used as damage indicators for the CFRE laminates. As an example, the Poisson’s ratio showed decreasing trends when matrix cracking or delaminations occurred. When the shear was dominant, higher values of the Poisson’s ratio were recorded and an increasing trend was noticed. The σ parameter of the DIC also proved to be a successful damage indicator, at least in a qualitative manner. In the presence of delaminations, a sudden change in the pattern of the σ parameter was evident.
Last but not least, different multiaxial stresses led to different AE activity. The internal shear damage led to more intense AE activity, even at early loading stages. It was proven that the AE activity was recorded prior to any monitored physical damage, stipulating that it can be successfully used for the estimation of early stage damage and the prediction of macrodamage concurrently. At the same time, the signal rise time seems to strongly depend on the stress state in the composite laminate, with greater values and increasing trends being recorded when the shear was dominant. In the appearance of delaminations, increasing rise time values were measured.

Author Contributions

Conceptualization, K.-A.K., D.V.H., and L.P.; data curation, K.-A.K.; formal analysis, K.-A.K.; investigation, K.-A.K.; methodology, K.-A.K., B.R.M., E.T., D.G.A., D.V.H., and L.P.; supervision, D.V.H. and L.P.; writing (original draft), K.-A.K.; writing (review and editing), B.R.M., E.T., D.G.A., and L.P.

Funding

This research was funded by the Fonds Wetenschappelijk Onderzoek (FWO) research funding program “Multi-scale modelling and characterization of fatigue damage in unidirectionally reinforced polymer composites under multiaxial and variable-amplitude loading” (G.0090.15). The work leading to this publication has been funded by the SBO project “M3Strength”, which fits in the MacroModelMat (M3) research program, coordinated by Siemens (Siemens PLM software, Leuven, Belgium) and funded by SIM (Strategic Initiative Materials in Flanders) and VLAIO (Flanders Innovation and Entrepreneurship Agency) (Flanders, Belgium).

Acknowledgments

The authors gratefully acknowledge the material suppliers Mitsubishi Chemical Corporation (Tokyo, Japan) and Honda R & D Co., Ltd. (Tochigi, Japan).

Conflicts of Interest

The authors declare no conflict of interest. The funding sponsors had no role in the design of the study; in the collection, analyses, or interpretation of data; and in the writing of the manuscript. The consortium of people involved in the M3 program and the material suppliers have accepted the publication of the results.

References

  1. Papadopoulos, I.V.; Davoli, P.; Gorla, C.; Filippini, M.; Bernasconi, A. A comparative study of multiaxial high-cycle fatigue criteria for metals. Int. J. Fatigue 1997, 19, 219–235. [Google Scholar] [CrossRef]
  2. Liu, Y.; Mahadevan, S. Multiaxial high—Cycle fatigue criterion and life prediction for metals. Int. J. Fatigue 2005, 27, 790–800. [Google Scholar] [CrossRef]
  3. Bruun, Ø.A.; Härkegård, G.A. A comparative study of design code criteria for prediction of the fatigue limit under in-phase and out-of-phase tension–torsion cycles. Int. J. Fatigue 2015, 73, 1–16. [Google Scholar] [CrossRef]
  4. Tu, W.; Pindera, M.J. Damage evolution in cross-ply laminates revisited via cohesive zone model and finite-volume homogenization. Compos. Part B Eng. 2016, 86, 40–60. [Google Scholar] [CrossRef]
  5. Shen, H.; Yao, W.; Qi, W.; Zong, J. Experimental investigation on damage evolution in cross-ply laminates subjected to quasi-static and fatigue loading. Compos. Part B Eng. 2017, 120, 10–26. [Google Scholar] [CrossRef]
  6. Kashtalyan, M.; Soutis, C. Stiffness degradation in cross-ply laminates damaged by transverse cracking and splitting. Compos. Part A Appl. Sci. Manuf. 2000, 31, 335–351. [Google Scholar] [CrossRef]
  7. Quaresimin, M. 50th anniversary article: Multiaxial fatigue testing of composites: From the pioneers to future directions. Strain 2015, 51, 16–29. [Google Scholar] [CrossRef]
  8. Quaresimin, M.; Carraro, P.A.; Mikkelsen, L.P.; Lucato, N.; Vivian, L.; Brøndsted, P.; Sørensen, B.F.; Varna, J.; Talreja, R. Damage evolution under cyclic multiaxial stress state: A comparative analysis between glass/epoxy laminates and tubes. Compos. Part B Eng. 2014, 61, 282–290. [Google Scholar] [CrossRef]
  9. Swanson, S.R.; Christoforou, A.P.; Colvin, G.E. Biaxial testing of fiber composites using tubular specimens. Exp. Mech. 1988, 28, 238–243. [Google Scholar] [CrossRef]
  10. Lee, C.S.; Hwang, W.; Park, H.C.; Han, K.S. Failure of carbon/epoxy composite tubes under combined axial and torsional loading 1. Experimental results and prediction of biaxial strength by the use of neural networks. Compos. Sci. Technol. 1999, 59, 1779–1788. [Google Scholar] [CrossRef]
  11. Lee, C.S.; Hwang, W.; Park, H.C.; Han, K.S. Failure of carbon/epoxy composite tubes under combined axial and torsional loading 2. Fracture morphology and failure mechanism. Compos. Sci. Technol. 1999, 59, 1789–1804. [Google Scholar] [CrossRef]
  12. Antoniou, A.E.; Van Hemelrijck, D.; Phillipidis, T.P. Failure prediction for a glass/epoxy cruciform specimen under static biaxial loading. Compos. Sci. Technol. 2010, 70, 1232–1241. [Google Scholar] [CrossRef]
  13. Hopgood, P.; Cook, J.; Clarke, A. Multi-axial testing of planar composite specimens. In Proceedings of the 12th International Conference on Composite Materials, Paris, France, 5–9 July 1999. [Google Scholar]
  14. Quaresimin, M.; Carraro, P.A. Damage initiation and evolution in glass/epoxy tubes subjected to combined tension-torsion fatigue loading. Int. J. Fatigue 2014, 63, 25–35. [Google Scholar] [CrossRef]
  15. Katerelos, D.T.G.; Kashtalyan, M.; Soutis, C.; Galiotis, C. Matrix cracking in polymeric composites laminates: Modelling and experiments. Compos. Sci. Technol. 2008, 68, 2310–2317. [Google Scholar] [CrossRef] [Green Version]
  16. Mohammadi, B.; Pakdel, H. Experimental and variational-based analytical investigation of multiple cracked angle-ply laminates. Eng. Fract. Mech. 2018, 190, 198–212. [Google Scholar] [CrossRef]
  17. Shokrieh, M.M.; Lessard, L.B. Multiaxial fatigue behavior of unidirectional plies based on uniaxial fatigue experiments—II. Experimental evaluation. Int. J. Fatigue 1997, 19, 209–217. [Google Scholar] [CrossRef]
  18. Wilmes, A.; Hornberger, K. Influence of fiber orientation and multiaxiality on the fatigue strength of unnotched specimens—Lifetime estimation. Procedia Eng. 2015, 133, 148–160. [Google Scholar] [CrossRef]
  19. Movahedi-Rad, A.V.; Keller, T.; Vassilopoulos, A.P. Fatigue damage in angle-ply GFRP laminates under tension-tension fatigue. Int. J. Fatigue 2018, 109, 60–69. [Google Scholar] [CrossRef]
  20. Cater, C.R.; Xiao, X.; Goldberg, R.K.; Gong, X. Multiscale investigation of micro-scale stresses at composite laminate free edge. Compos. Struct. 2018, 189, 545–552. [Google Scholar] [CrossRef]
  21. Lorriot, T.; Marion, G.; Harry, R.; Wargnier, H. Onset of free-edge delamination in composite laminates under tensile loading. Compos. Part B Eng. 2003, 34, 459–471. [Google Scholar] [CrossRef]
  22. Chandarana, N.; Sanchez, D.M.; Soutis, C.; Gresil, M. Early damage detection in composites during fabrication and mechanical testing. Materials 2017, 10, 685. [Google Scholar] [CrossRef] [PubMed]
  23. Bohse, J. Acoustic emission examination of polymer-matrix composites. J. Acoust. Emiss. 2004, 22, 208–223. [Google Scholar]
  24. Godin, N.; Huguet, S.; Gaertner, R.; Salmon, L. Clustering of acoustic emission signals collected during tensile tests on unidirectional glass/polyester composite using supervised and unsupervised classifiers. NDT E Int. 2004, 37, 253–264. [Google Scholar] [CrossRef]
  25. Aggelis, D.G.; Barkoula, N.M.; Matikas, T.E.; Paipetis, S.A. Acoustic emission monitoring of degradation of cross ply laminates. J. Acoust. Soc. Am. 2010, 127, 246–251. [Google Scholar] [CrossRef] [PubMed]
  26. Mizutani, Y.; Nagashima, K.; Takemoto, M.; Ono, K. Fracture mechanism characterization of cross-ply carbon-fiber composites using acoustic emission analysis. NDT E Int. 2000, 33, 101–110. [Google Scholar] [CrossRef]
  27. De Sutter, S.; Verbruggen, S.; Tysmans, T.; Aggelis, D.G. Fracture monitoring of lightweight composite-concrete beams. Compos. Struct. 2017, 167, 11–19. [Google Scholar] [CrossRef]
  28. Lacidogna, G.; Borla, O.; Niccolini, G.; Carpinteri, A. Correlation between acoustic and other forms of energy emissions from fracture phenomena. In Acoustic, Electromagnetic, Neutron Emissions from Fracture and Earthquakes; Carpinteri, A., Lacidogna, G., Manuello, A., Eds.; Springer: Cham, Switzerland, 2015; ISBN 978-3-319-16954-5. [Google Scholar]
  29. Kalteremidou, K.A.; Pourkazemi, A.; El Idrissi, Y.; Morabet, Y.; He, G.; Stiens, J.; Pyl, L.; Van Hemelrijck, D. The combined use of millimetre wave imaging and acoustic emission for the damage investigation of glass fibre reinforced polymer composites. In Proceedings of the 12th European Conference on Non-Destructive Testing, Gothenburg, Sweden, 11–15 June 2018. [Google Scholar]
  30. ASTM D3039/D3039M-17. Standard Test Method for Tensile Properties of Polymer Matrix Composite Materials; ASTM International: West Conshohocken, PA, USA, 2017; Available online: www.astm.org (accessed on 1 January 2016).
  31. Philippidis, T.P.; Assimakopoulou, T.T. Strength degradation due to fatigue-induced matrix cracking in FRP composites: An acoustic emission predictive model. Compos. Sci. Technol. 2008, 68, 3272–3277. [Google Scholar] [CrossRef]
  32. Karl, J.O. Filtering of Acoustic Emission Data through Principal Frequency Component Extraction. Master’s Thesis, Embry-Riddle Aeronautical University, Daytona Beach, FL, USA, 2006. [Google Scholar]
  33. Ohno, K.; Ohtsu, M. Crack classification in concrete based on acoustic emission. Constr. Build. Mater. 2010, 24, 2339–2346. [Google Scholar] [CrossRef]
Figure 1. Bi-axiality ratios, λ, for different angles, θ, of [0°/θ]2s laminates.
Applsci 08 02021 g001
Figure 2. Experimental set-up. DIC—digital image correlation; AE—acoustic emission.
Applsci 08 02021 g002
Figure 3. Stress-longitudinal strain curves of the angle-ply laminates.
Applsci 08 02021 g003
Figure 4. Damage state of [0°/30°]2s laminates at (a) 70%, (b) 80%, (c) 85%, and (d) 87% of σult.
Applsci 08 02021 g004
Figure 5. Damage state of [0°/60°]2s laminates at (a) 40%, (b) 65%, (c) 80%, and (d) 90% of σult.
Applsci 08 02021 g005
Figure 6. Damage process during the quasi-static tests for the [0°/30°]2s laminates.
Applsci 08 02021 g006
Figure 7. Damage process during the quasi-static tests for the [0°/60°]2s laminates.
Applsci 08 02021 g007
Figure 8. Stress–shear strain curves of the angle-ply laminates.
Applsci 08 02021 g008
Figure 9. Evolution of delamination length in the [0°/30°]2s laminates.
Applsci 08 02021 g009
Figure 10. Evolution of delamination length in the [0°/60°]2s laminates.
Applsci 08 02021 g010
Figure 11. Increase of matrix crack density in the [0°/30°]2s laminates.
Applsci 08 02021 g011
Figure 12. Increase of matrix crack density in the [0°/60°]2s laminates.
Applsci 08 02021 g012
Figure 13. DIC σ pattern for a [0°/30°]2s laminate (a) before and (b) after delamination.
Applsci 08 02021 g013
Figure 14. DIC σ pattern for a [0°/60°]2s laminate (a) before and (b) after delamination.
Applsci 08 02021 g014
Figure 15. Evolution of the Poisson’s ratio of the angle-ply laminates.
Applsci 08 02021 g015
Figure 16. Total AE events recorded for the two laminates during the static tests.
Applsci 08 02021 g016
Figure 17. AE events rate recorded for the two laminates during the static tests.
Applsci 08 02021 g017
Figure 18. Typical schematic of an AE waveform.
Applsci 08 02021 g018
Figure 19. Evolution of average rise time values for the angle-ply laminates.
Applsci 08 02021 g019
Figure 20. Evolution of average rise time versus the delamination length in the [0°/30°]2s laminates.
Applsci 08 02021 g020
Table 1. Experimentally measured material properties. σ1,ult—longitudinal strength; σ2,ult—transverse strength; σ6,ult—shear strength; E1—longitudinal modulus; E2—transverse modulus; G12—shear modulus; ν12—Poisson’s ratio.
Engineering PropertyUnitsValue
σ1,ult(MPa)2272.43 ± 88.73
σ2,ult(MPa)52.50 ± 2.00
σ6,ult(MPa)52.27 ± 1.06
Ε1(GPa)125.83 ± 3.93
Ε2(GPa)9.40 ± 0.25
G12(GPa)4.06 ± 0.13
ν12-0.335 ± 0.014
Table 2. Mechanical properties of the off-axis laminates acquired from the quasi-static tests.
Ultimate Strength
(MPa)
E-Modulus
(GPa)
Strain to Failure
(−)
[0°/30°]2s1375 ± 2378.2 ± 2.70.0157 ± 0.0007
[0°/60°]2s1318 ± 1574.1 ± 0.80.0171 ± 0.0003

