Optimization Scheme for Construction Ventilation in Large-Scale Underground Oil Storage Caverns

1
Key Laboratory of Transportation Tunnel Engineering, Ministry of Education, Southwest Jiaotong University, Chengdu 610031, China
2
School of Engineering, University of Warwick, Coventry CV4 7AL, UK
3
National Engineering Laboratory for Green & Safe Construction Technology in Urban Rail Transit, Beijing 100037, China
4
China Railway No. 2 Engineering Group Co. Ltd., Chengdu 610032, China
*
Author to whom correspondence should be addressed.
Appl. Sci. 2018, 8(10), 1952; https://doi.org/10.3390/app8101952
Submission received: 5 September 2018
/
Revised: 3 October 2018
/
Accepted: 8 October 2018
/
Published: 17 October 2018
(This article belongs to the Special Issue Monitoring and Modeling: Air Quality Evaluation Studies)
Abstract
:The ventilation effect has a direct influence on the efficiency and security of the construction of an underground cavern group. Traditional forced ventilation schemes may be ineffective and result in resource wastage. Based on the construction ventilation of the Jinzhou underground oil storage project, an axial flow gallery ventilation mode using shafts as the fresh air inlet was proposed. A 3D steady RANS (Reynolds Averaged Navier-Stokes) approach with the RNG (Renormalization-group) k-ε turbulence model was used to study airflow behavior and hazardous gas dispersion when different ventilation schemes were employed. Field test values of the air velocity and CO concentration in the main cavern and construction roadway were also adopted to validate the RNG k-ε turbulence model. The results showed that the axial flow gallery ventilation mode can ensure that the direction of air flow is the same as that of heavy trucks, fresh air is always near the excavation face, and the disturbance of the construction process is greatly reduced. The scheme is suitable for large-scale caverns with a ventilation distance less than 2 km, and an intermediate construction shaft is not needed. When the ventilation distance exceeds 2 km, it is possible to use jet fans to assist the axial flow gallery ventilation mode or to completely adopt jet-flow gallery ventilation.
1. Introduction
The large water sealing cavern is an underground space system for storing crude oil, gasoline, diesel and other energy sources under the stable groundwater level [1]. Compared with the traditional way of storing crude oil, the underground water sealing cavern has the advantages of less investment, less land occupation, minor pollution, little wastage, high safety performance, low cost of operation and management, fast loading and unloading. It has been widely used to store petroleum and petrochemical products [2]. The drilling and blasting method, a traditional and cost-effective construction method, has been widely used in the excavation of underground caverns [3]. Ventilation is the only means of air exchange inside and outside the cavern, and it is an indispensable key technology during the construction process [4]. Ventilation effect not only restricts the whole construction process, but also relates to the quality of construction and the efficiency of mechanical equipment and affects the health of the construction workers [5,6]. However, the construction ventilation of large-scale underground engineering is often characterized by large sections, variable cross-sections, multiple caverns, internal combustion operations, trackless transportation, and a large amount of pollution, and there is no systematic method to solve these construction ventilation problems [7]. Forced ventilation or new-built vertical shafts are mainly used to solve ventilation problems in large underground cavern groups. However, it is impossible to increase the air supply due to the size restrictions of the construction channel, resulting in ventilation deterioration [8,9]. The design of the shaft is not scientific, it relies on experience or site conditions to set up in a shallow depth of the underground cavern, and also, the ventilation path is difficult.
With the rapid development of computational fluid dynamics (CFD) and computing technology, the CFD technique is used to simulate the ventilation of underground engineering during the construction period [10,11,12,13]. The air flow organization and the change characteristics of harmful gas in the underground cavern group are studied to solve the ventilation problems in the construction process and to optimize the ventilation scheme. Wang et al. [14] proposed 3D unsteady quasi-single-phase models to optimize the ventilation time with different tunneling lengths. The effect of buoyancy is considered in the momentum equation of the CO transport model while the effects of inter-phase drag, lift force, and virtual mass force are considered in the momentum source of the dust transport model. Torno et al. [15] developed a model of gas dilution after blasting and the conditions in which workers can return to the blasted area based on CFD. They validated the correctness of the k-ε turbulence model based on Reynolds-Averaged Navier-Stokes (RANS) equations by experimental measurements and found that the CFD results were in satisfactory agreement with the experimental data. Shao et al. [16] used the RANS approach and the standard k-ε turbulence model to simulate the fluid dynamics in tunnel groups when different ventilation schemes are employed. The study revealed that flow vortices appear in the tunnels with a long axis length ranging from 5 m to 20 m. Xia et al. [17] adopted a RANS approach to study the characteristics of the ventilation and dust suppression system for open-type TBM tunneling work area in a Ø8.53 m diversion project. When the main vent was located 70–80 m away from the working face, the ventilation in the TBM tunneling work area was optimal; when the air baffle is as long as the main beam, the dust collection efficiency was highest. Nan et al. [18] employed RANS approach and the RNG k-ε turbulence model to investigate the flow pattern of air backflow in ventilated tunnels. Semi-empirical equations of the mean velocity distribution law of air backflow were derived based on the numerical results. Hargreaves et al. [19] constructed a series of steady-state models by using a RANS approach and the standard k-ε turbulence model to replicate the ventilation flow patterns at the head end of a drivage. Klemens et al. [20] established a two-dimensional laminar model and adopted a RANS approach to simulate the dust deposition in a rectangular coal mine roadway with upper obstacles. Toraño et al. [21] used a RANS approach and the standard k-ε turbulence model to perform a two-phase numerical simulation of airflow and dust in mining roadways with the Euler-Lagrange method. Diego et al. [22] proposed some semi-empirical equations to calculate the effective length of the airflow impacting (Le) by means of CFD. Previous works show that the RANS approach and the k-ε turbulence model are most used to simulate airflow and pollutants in tunnels and roadways.
However, fewer studies have focused on construction ventilation in underground storage cavern group, especially those with an excavation area more than 400 m2. This paper aims to optimize construction ventilation schemes for large-scale underground oil storage caverns. Based on the analysis of the distribution of air velocity and the CO concentration with time under forced ventilation, the axial flow gallery ventilation scheme by using shafts as air inlet is proposed. The effectiveness of the optimized ventilation scheme is validated by field test values of the air velocity and CO concentration in the main cavern and construction roadway. The results provide a useful reference for construction ventilation in large-scale underground storage caverns.
This paper is organized as follows. Section 1 describes some previous works related to CFD study on construction ventilation. Section 2 displays the cavern layout in the oil storage project and the two ventilation schemes in different construction periods. Section 3 and Section 4 explain the methods used in the current study. Section 5 discusses the findings on air velocity and CO concentration. Finally, Section 6 concludes the current study.
2. Project Description
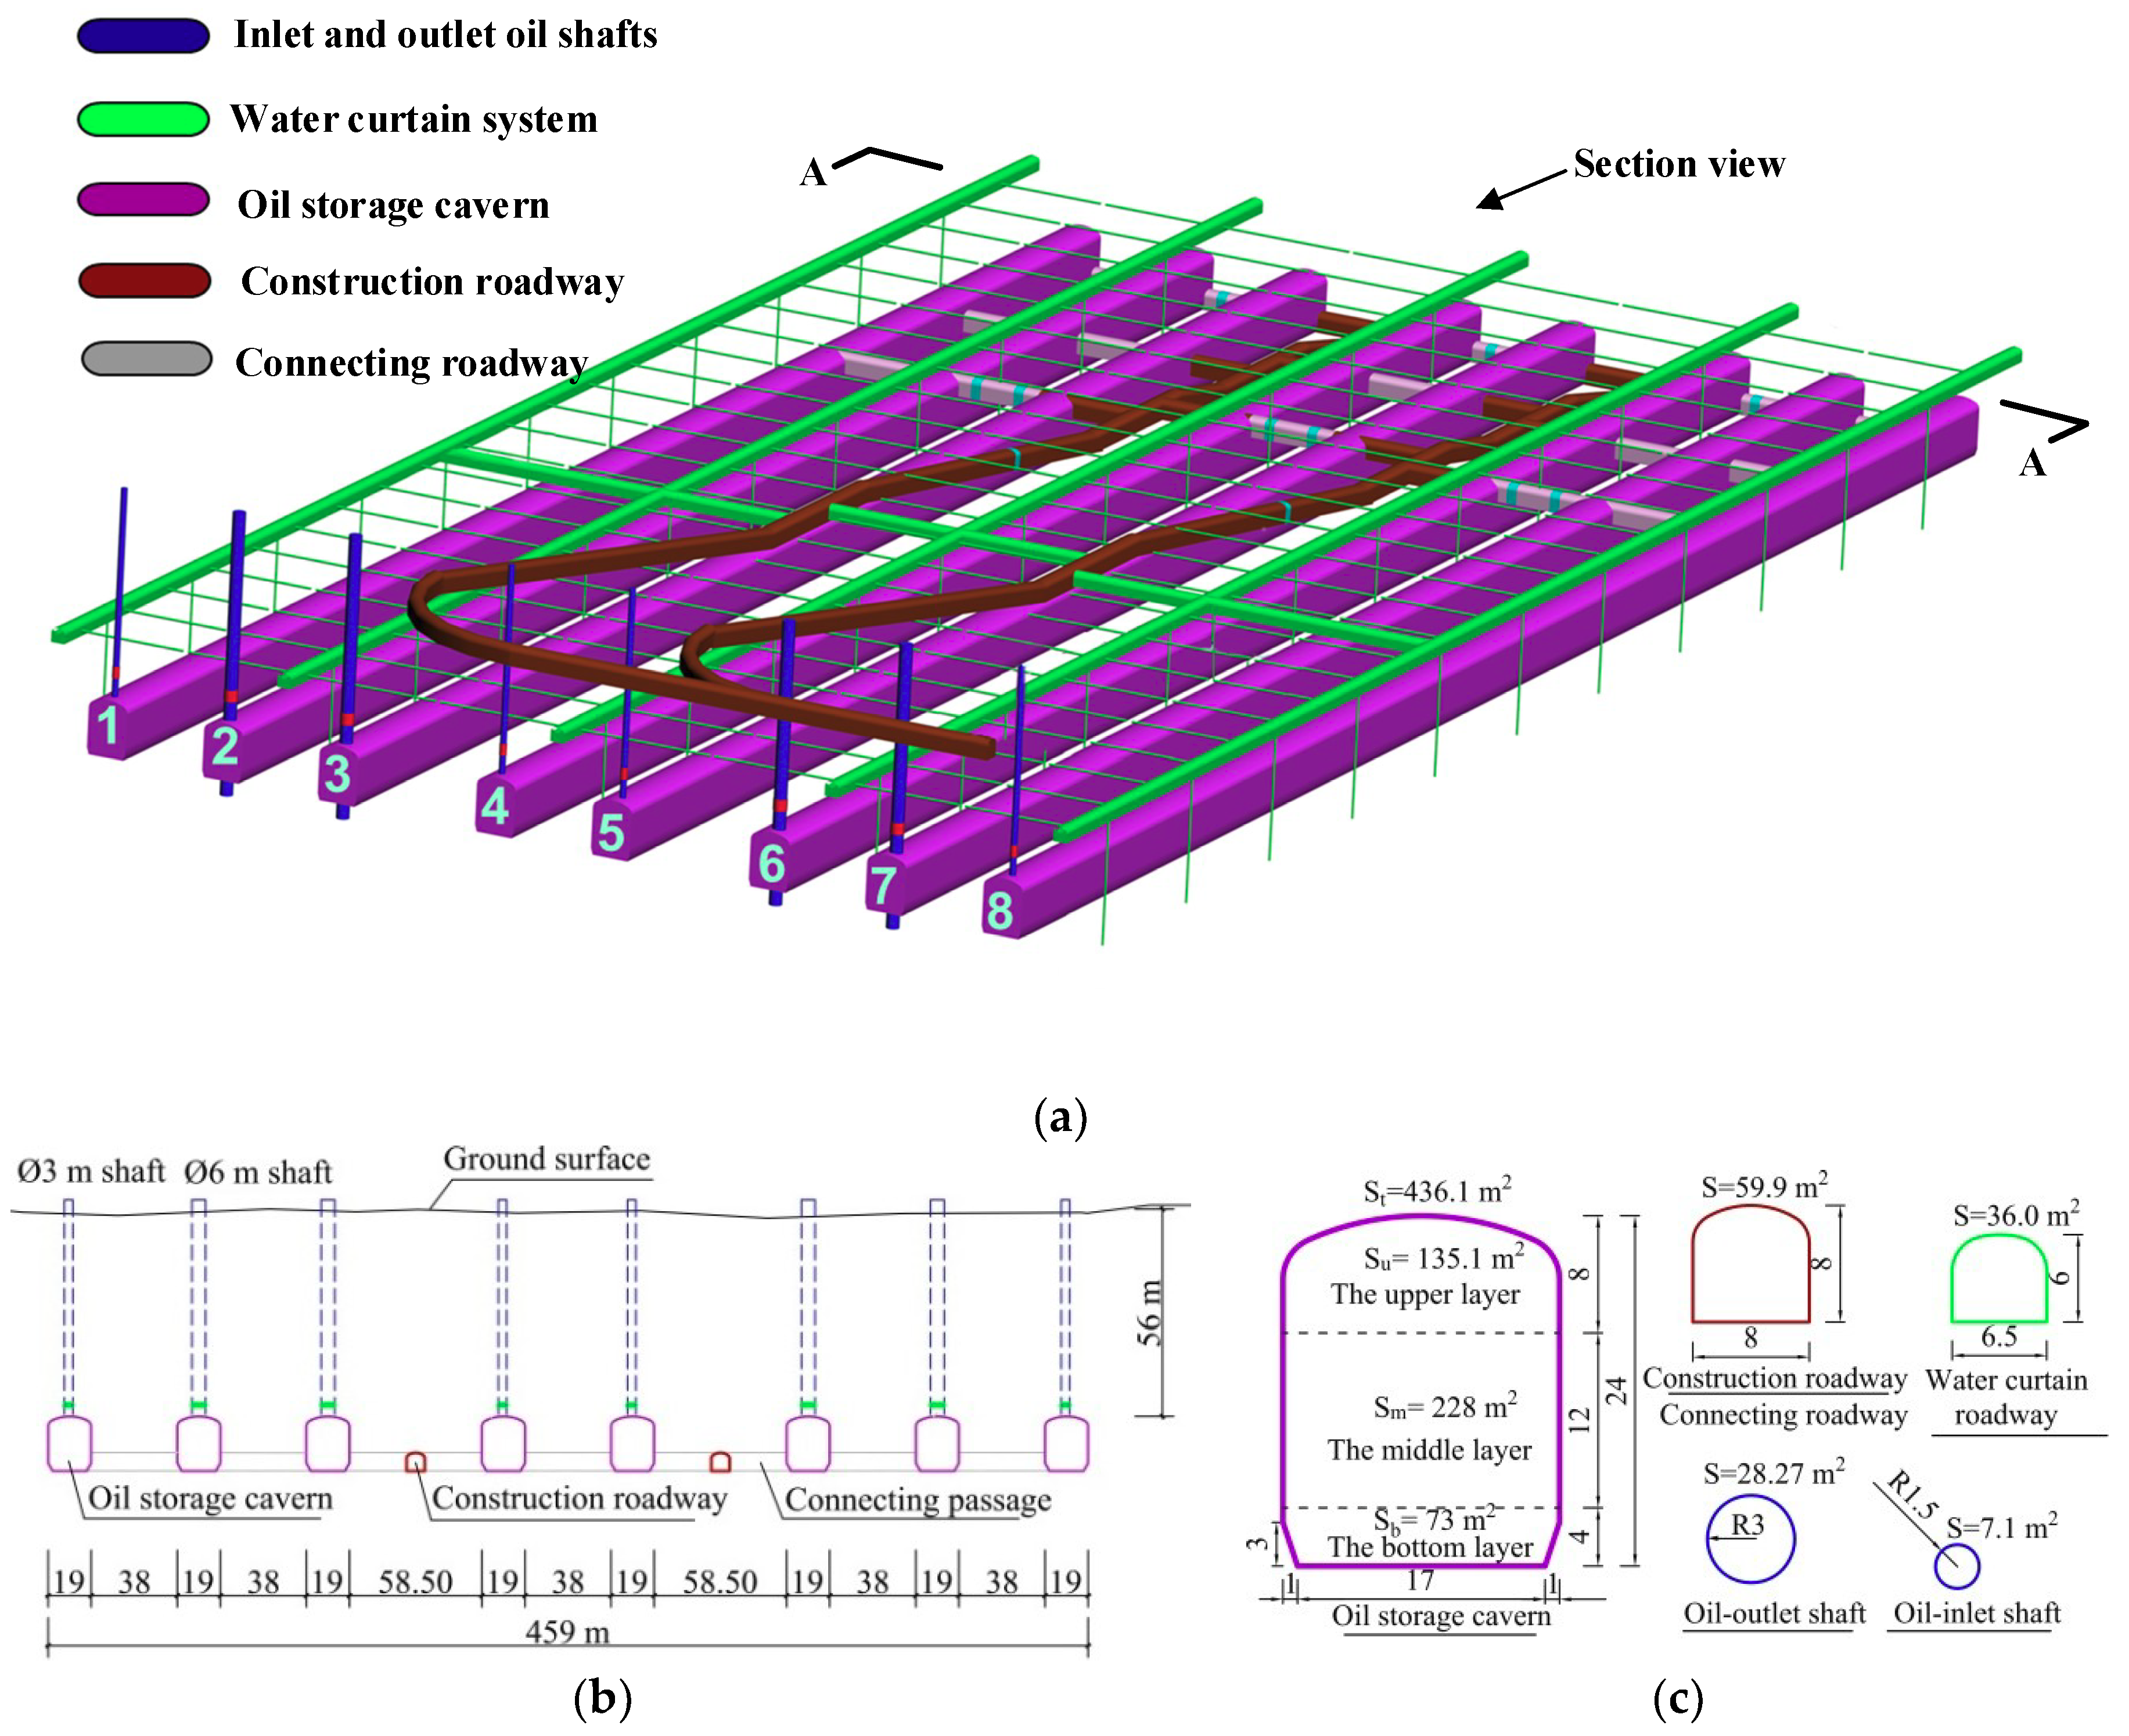
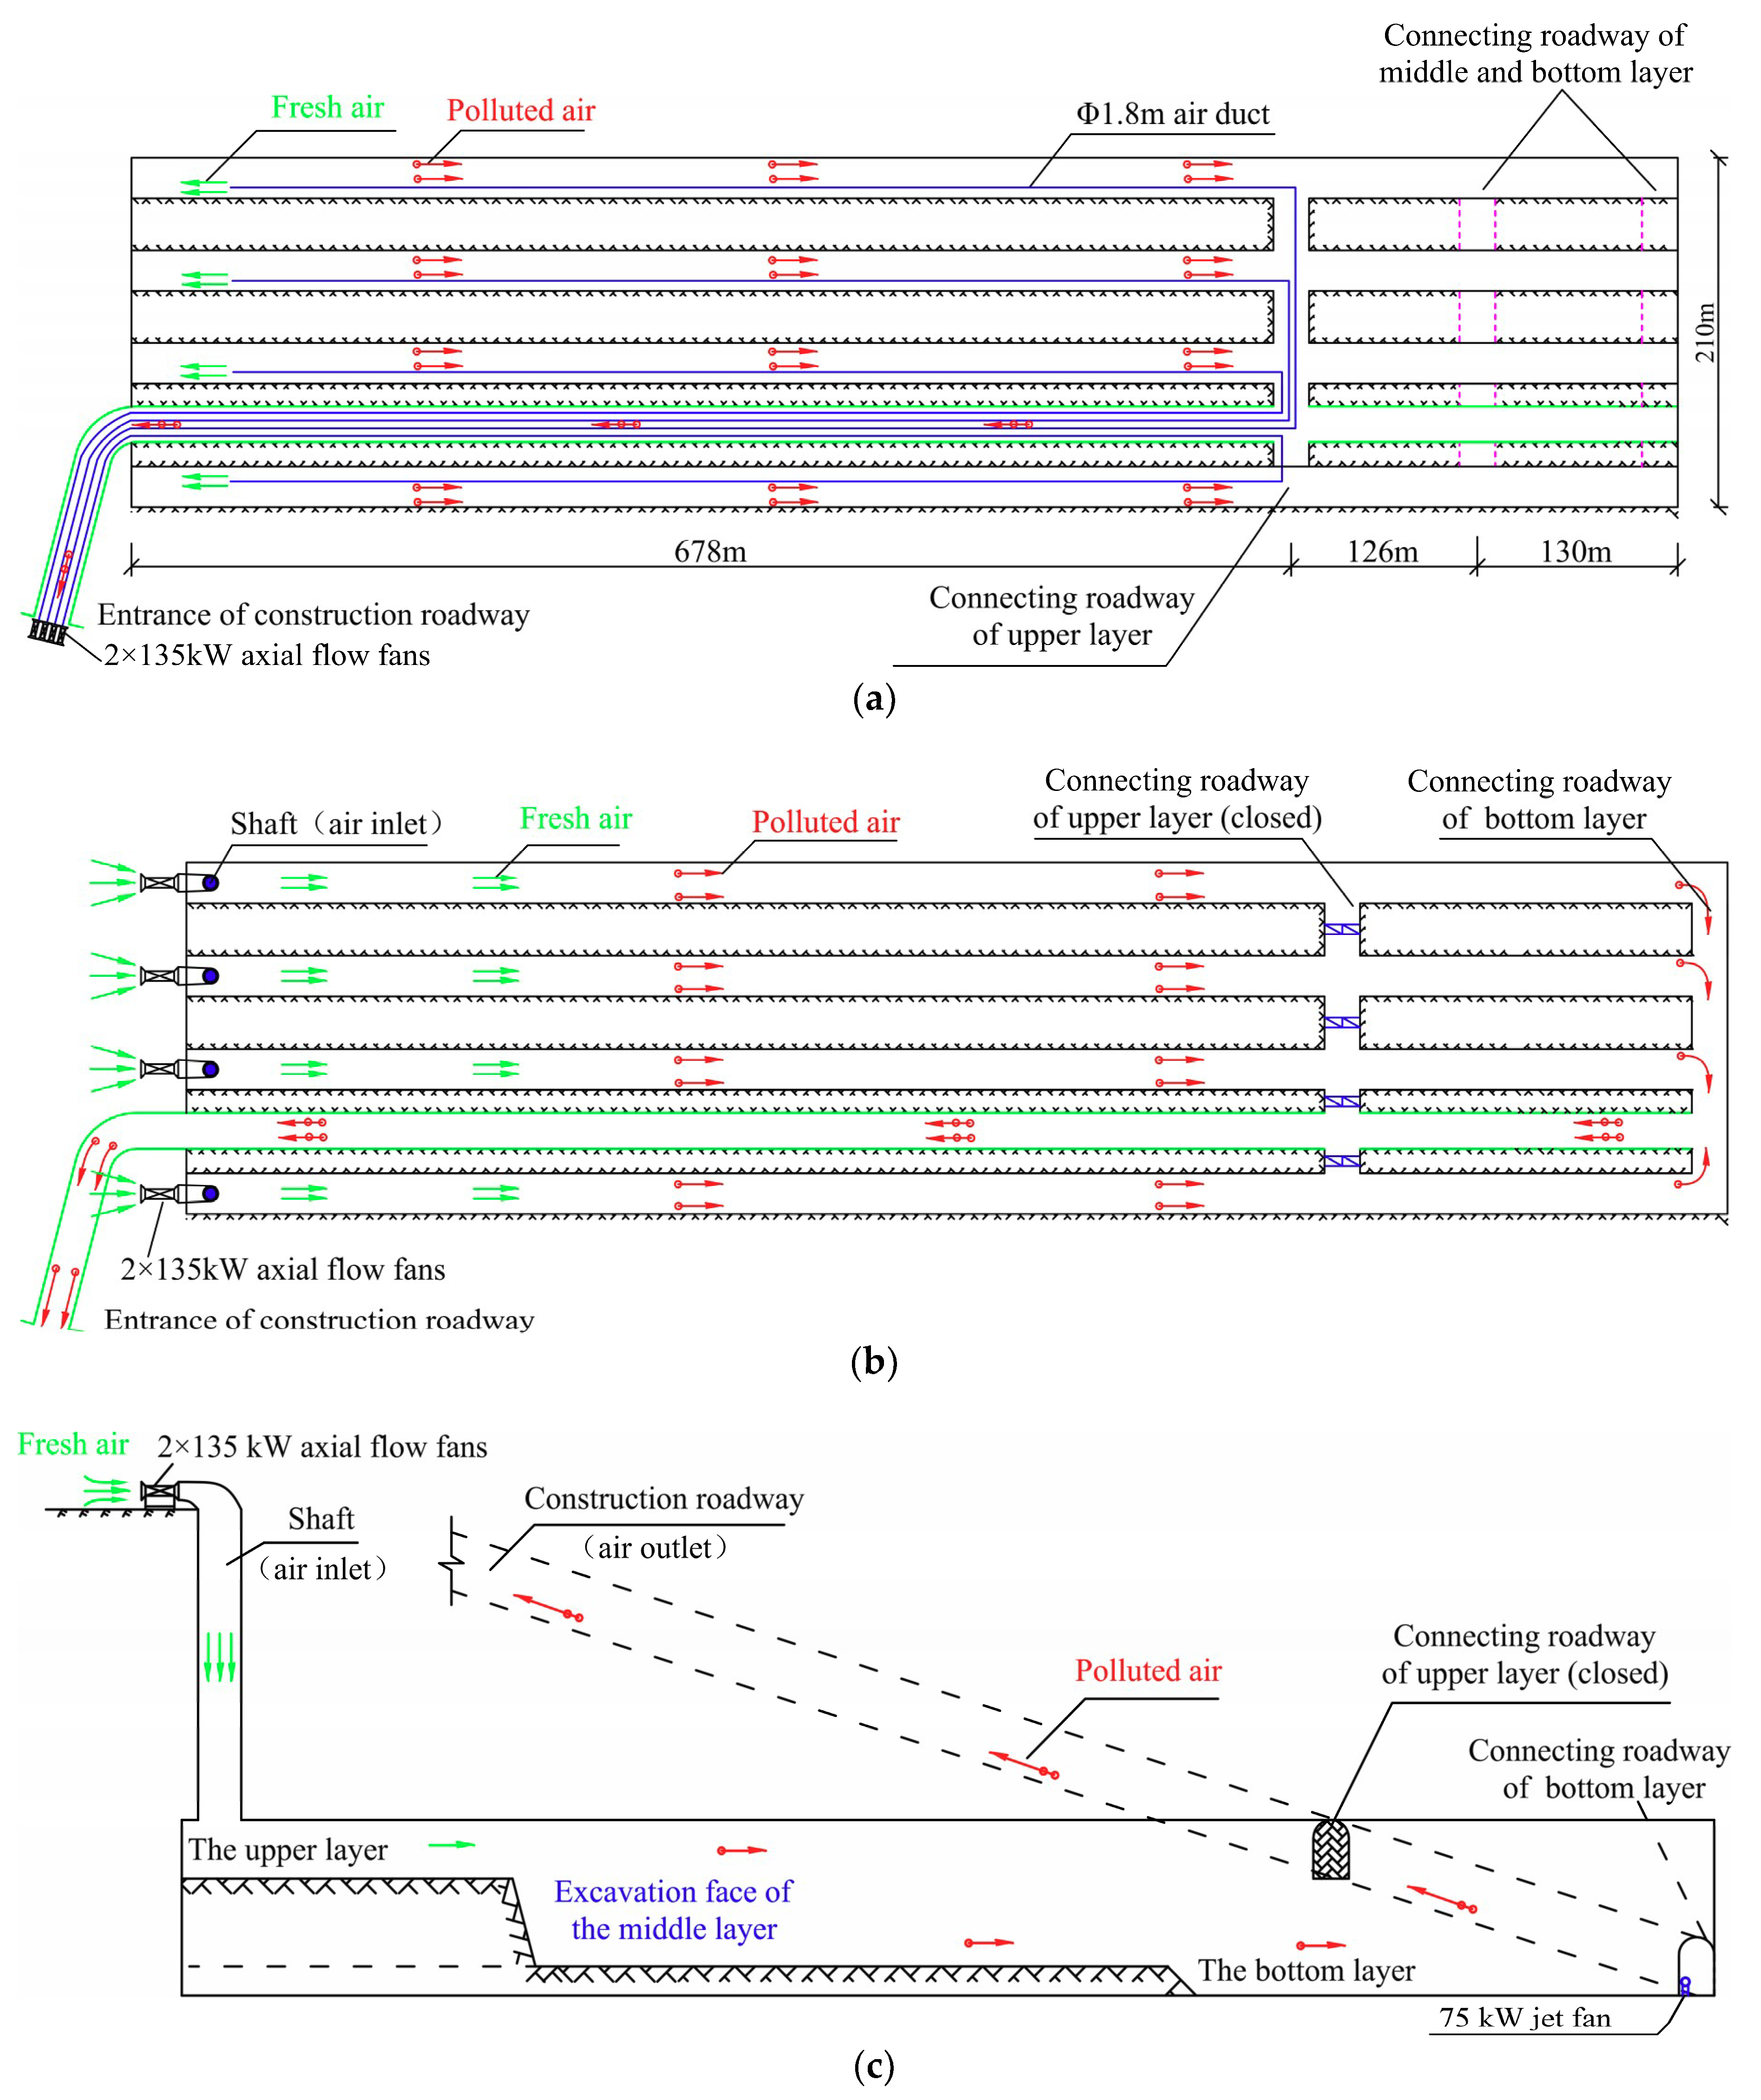
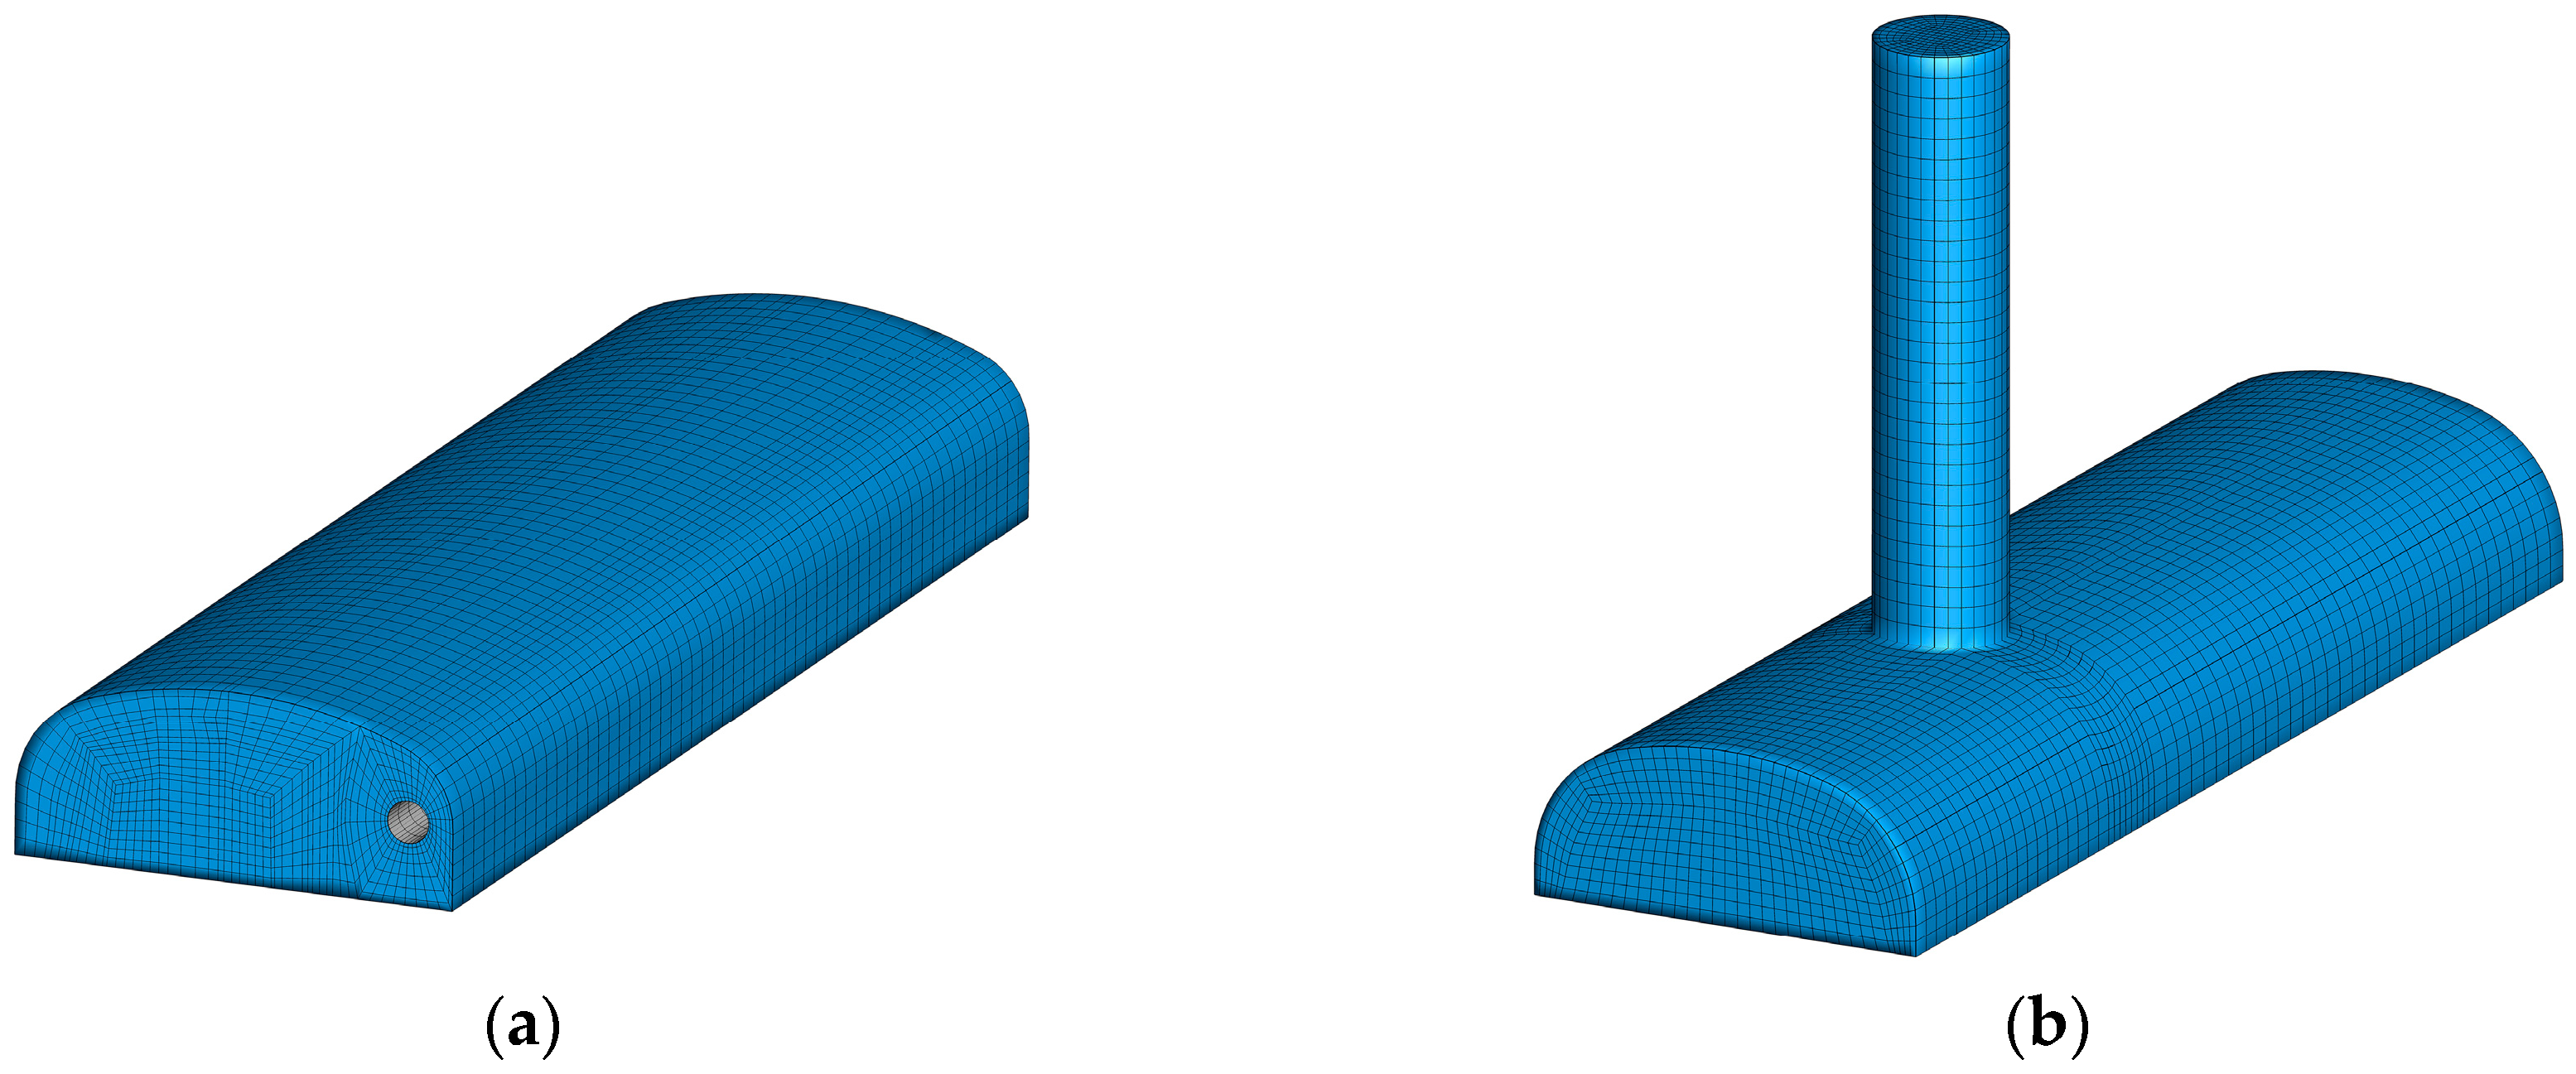
The Jinzhou oil storage cavern is located in Liaoning province, the northeast area of China. Underground water-sealing technology is used to store oil in this project, the designed storage capacity is 300 × 104 m3, which is mainly divided into two parts: underground engineering and ground engineering. The underground engineering is mainly composed of the oil storage cavern, water curtain system, connecting roadway, construction roadway, sealing plug, shaft and pump pit as shown in Figure 1a. Eight east-west direction and parallel-arranged oil storage caverns with a length of 934 m are connected by connecting roadways. The span and height of the cross-section is 19 m and 24 m, respectively, a three-center arch straight wall type is adopted in the section design, and the bottom is provided with a chamfer of 1m wide and 3 m high. The section area is 436.2 m2, the bottom elevation of the cavern is −80 m, the top elevation is −56 m, and the ground elevation is 0 m. There are four oil-inlet shafts with 3 m in diameter and four oil-outlet shafts with a diameter of 6 m. The water curtain system is arranged above the caverns, two construction roadways are set up to enter the main caverns, the profile of the oil storage caverns is shown in Figure 1b. The oil storage cavern is divided into three layers for construction, the excavation height of each layer is 8 m, 12 m and 4 m respectively, as shown in Figure 1c. Before the completion of the upper layer construction, SDZ-12.5 axial flow fans with Φ1.8 m duct arranged at the entrance of the construction roadway are used for forced ventilation as shown in Figure 2a.
During the excavation of the middle and bottom layer, the pollution sources such as blasting dust and internal combustion engine waste are generally larger than the upper layer excavation due to the increase in the amount of excavation and the increase in the working face. It is necessary to increase air duct diameter and air volume to maintain forced ventilation. However, due to the size of the construction roadway and the clearance requirements for transportation, the duct diameter and air volume cannot be increased, resulting in the deterioration of ventilation effect. Therefore, it is crucial to optimize and adjust the existing ventilation method. We present the axial-flow gallery ventilation scheme after the upper layer excavation of the cavern is completed and connected with the shaft. This scheme utilizes the shafts as the fresh air inlet and the construction roadway as the polluted air outlet to form the gallery ventilation as shown in Figure 2b,c.
3. Field Test
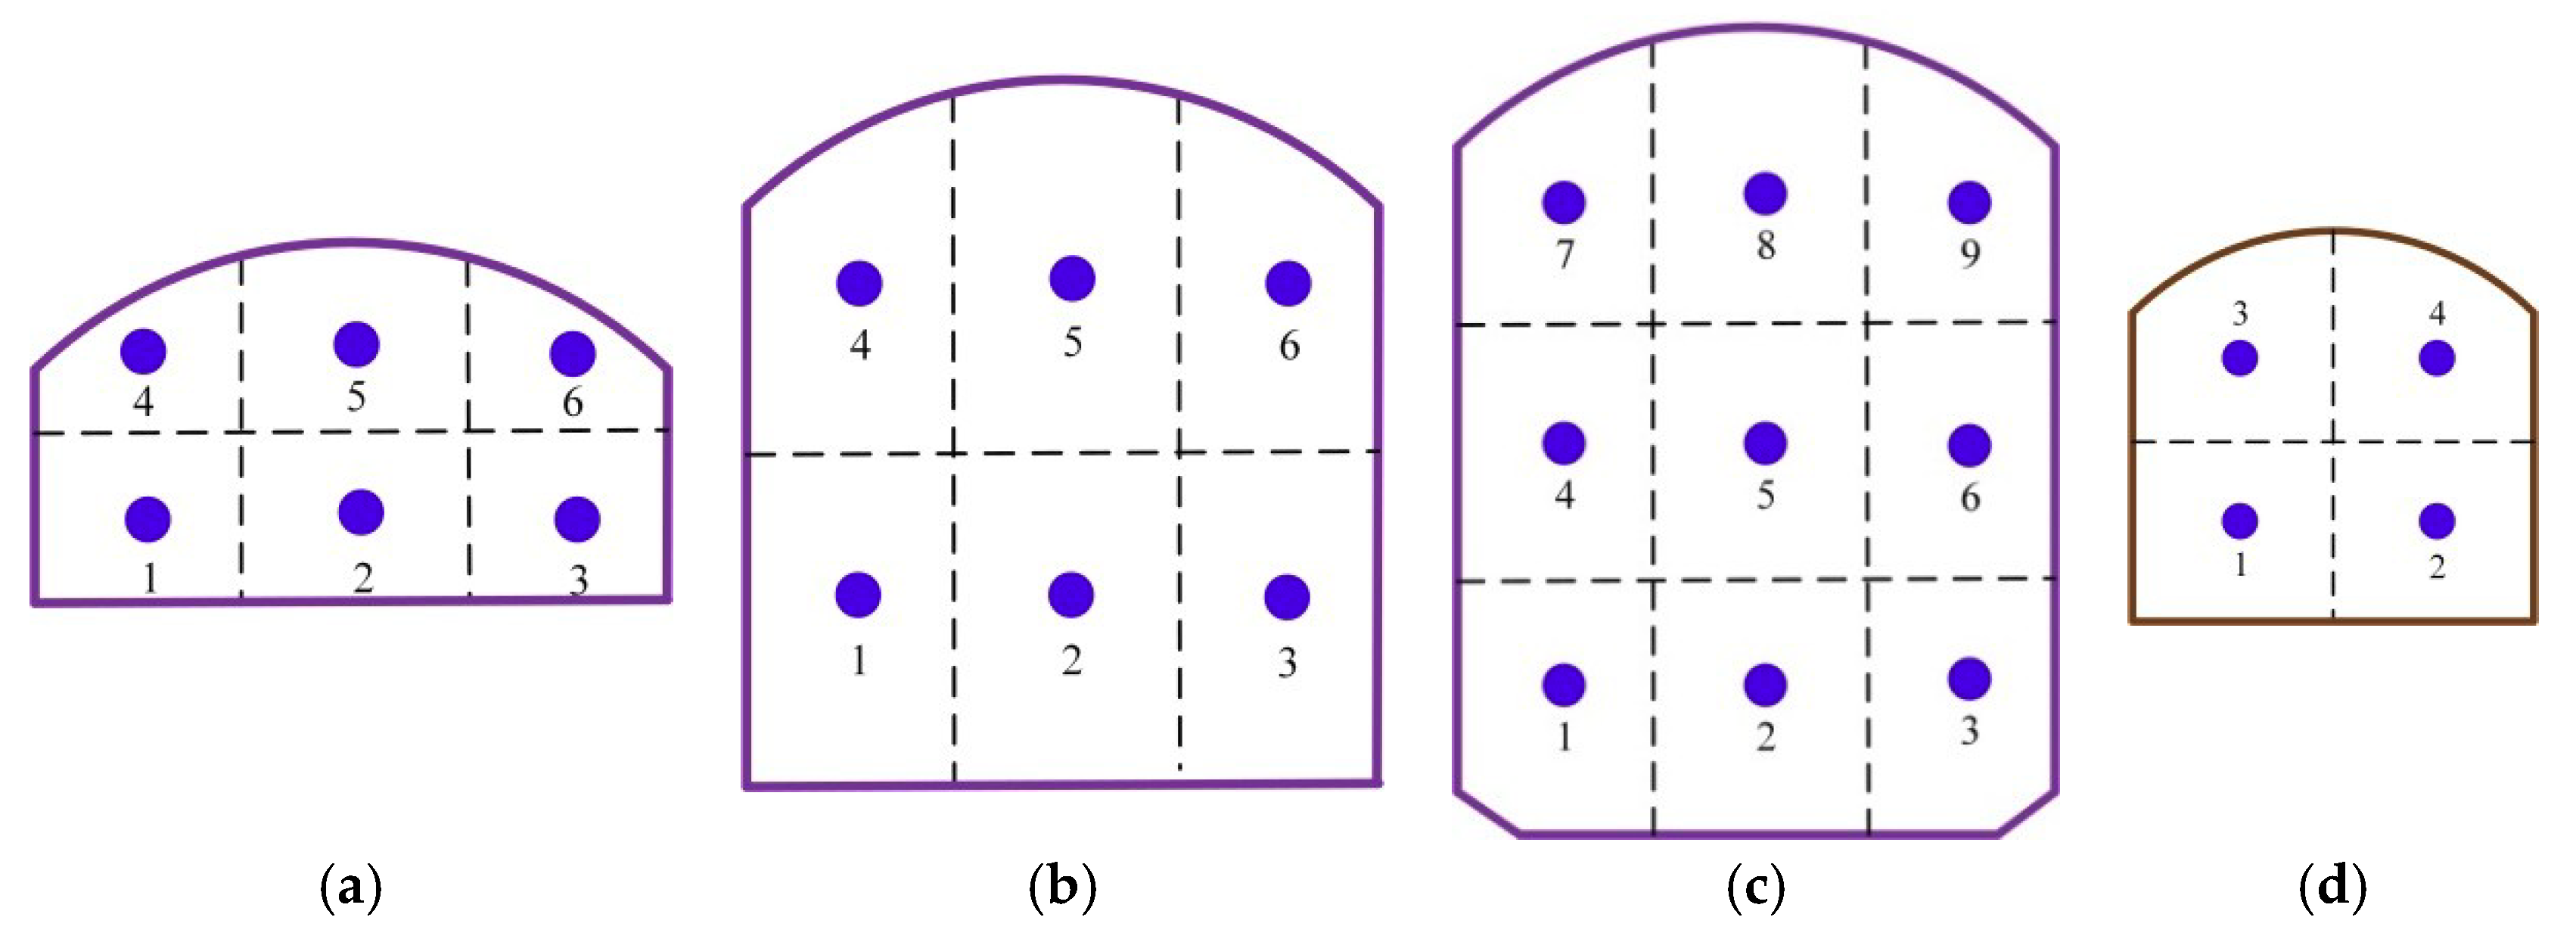
In order to evaluate air quality and ventilation performance in the caverns, a field test of the air velocity, dust, and poisonous gas (methane, CO, SO2, H2S) in the main cavern and the construction roadway was carried out. The main cavern was organized with a test cross-section every 100 m in the longitudinal direction, with a total of 9 test cross-sections. The test instruments and related parameters of air velocity and harmful gas are shown in Table 1. As the air velocity and harmful gas concentration vary with the location, it is important to increase the number of measuring positions to obtain the average air velocity and harmful gas concentration of the cross-section (the average values only refer to the space). Consequently, the cross-section of the main cavern is divided into nine parts, and the cross-section of the construction roadway is divided into four parts as shown in Figure 3. The air velocity and harmful gas concentration in each part are averaged to be Va and Ca separately. Hence, the value of Va and Ca can be calculated by the flowing equation:
where i = 1, …, 6 for the section of the upper layer and middle layer, i = 1, …, 9 for the full section of the cavern, and i = 1, …, 4 for the construction roadway, and Ai is the area of part i in the cross-section.
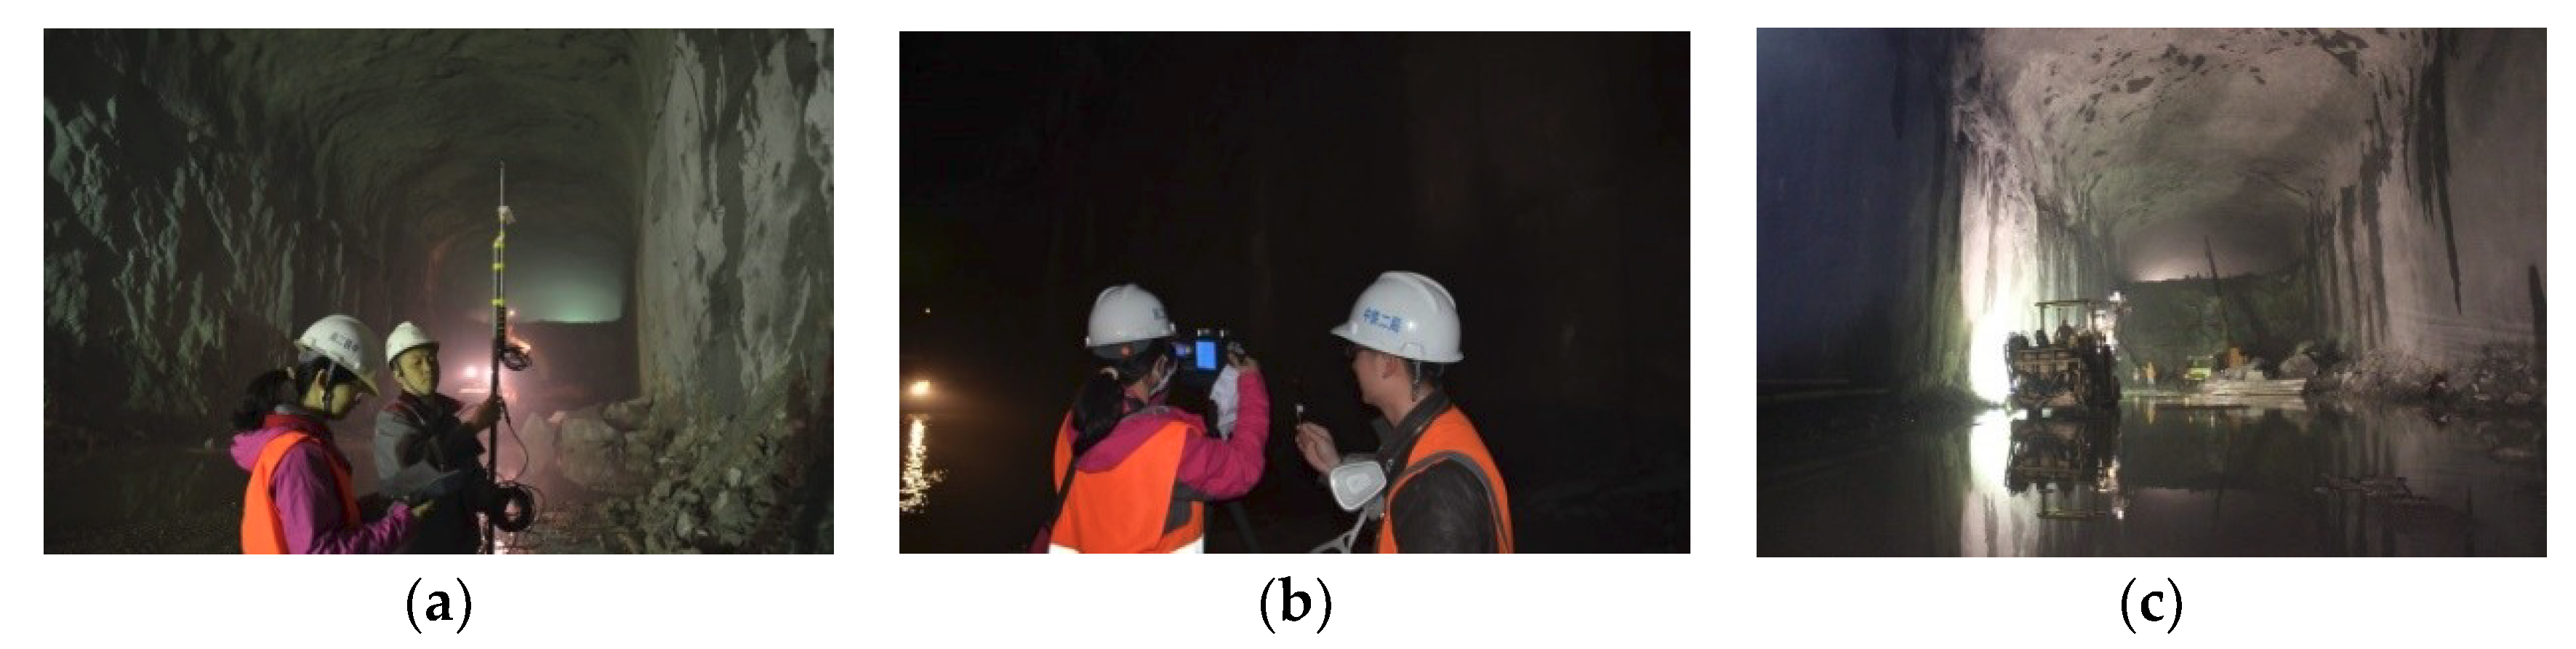
Figure 4 depicts the field test of the ventilation environment in the caverns. It can be seen that the air quality is satisfactory after 20 min of axial-flow gallery ventilation. The excavation face is clearly visible in the range of 200 m, and the visibility in the cavern is more than 300 m when mucking.
4. CFD Simulations
4.1. Computational Domain and Grid
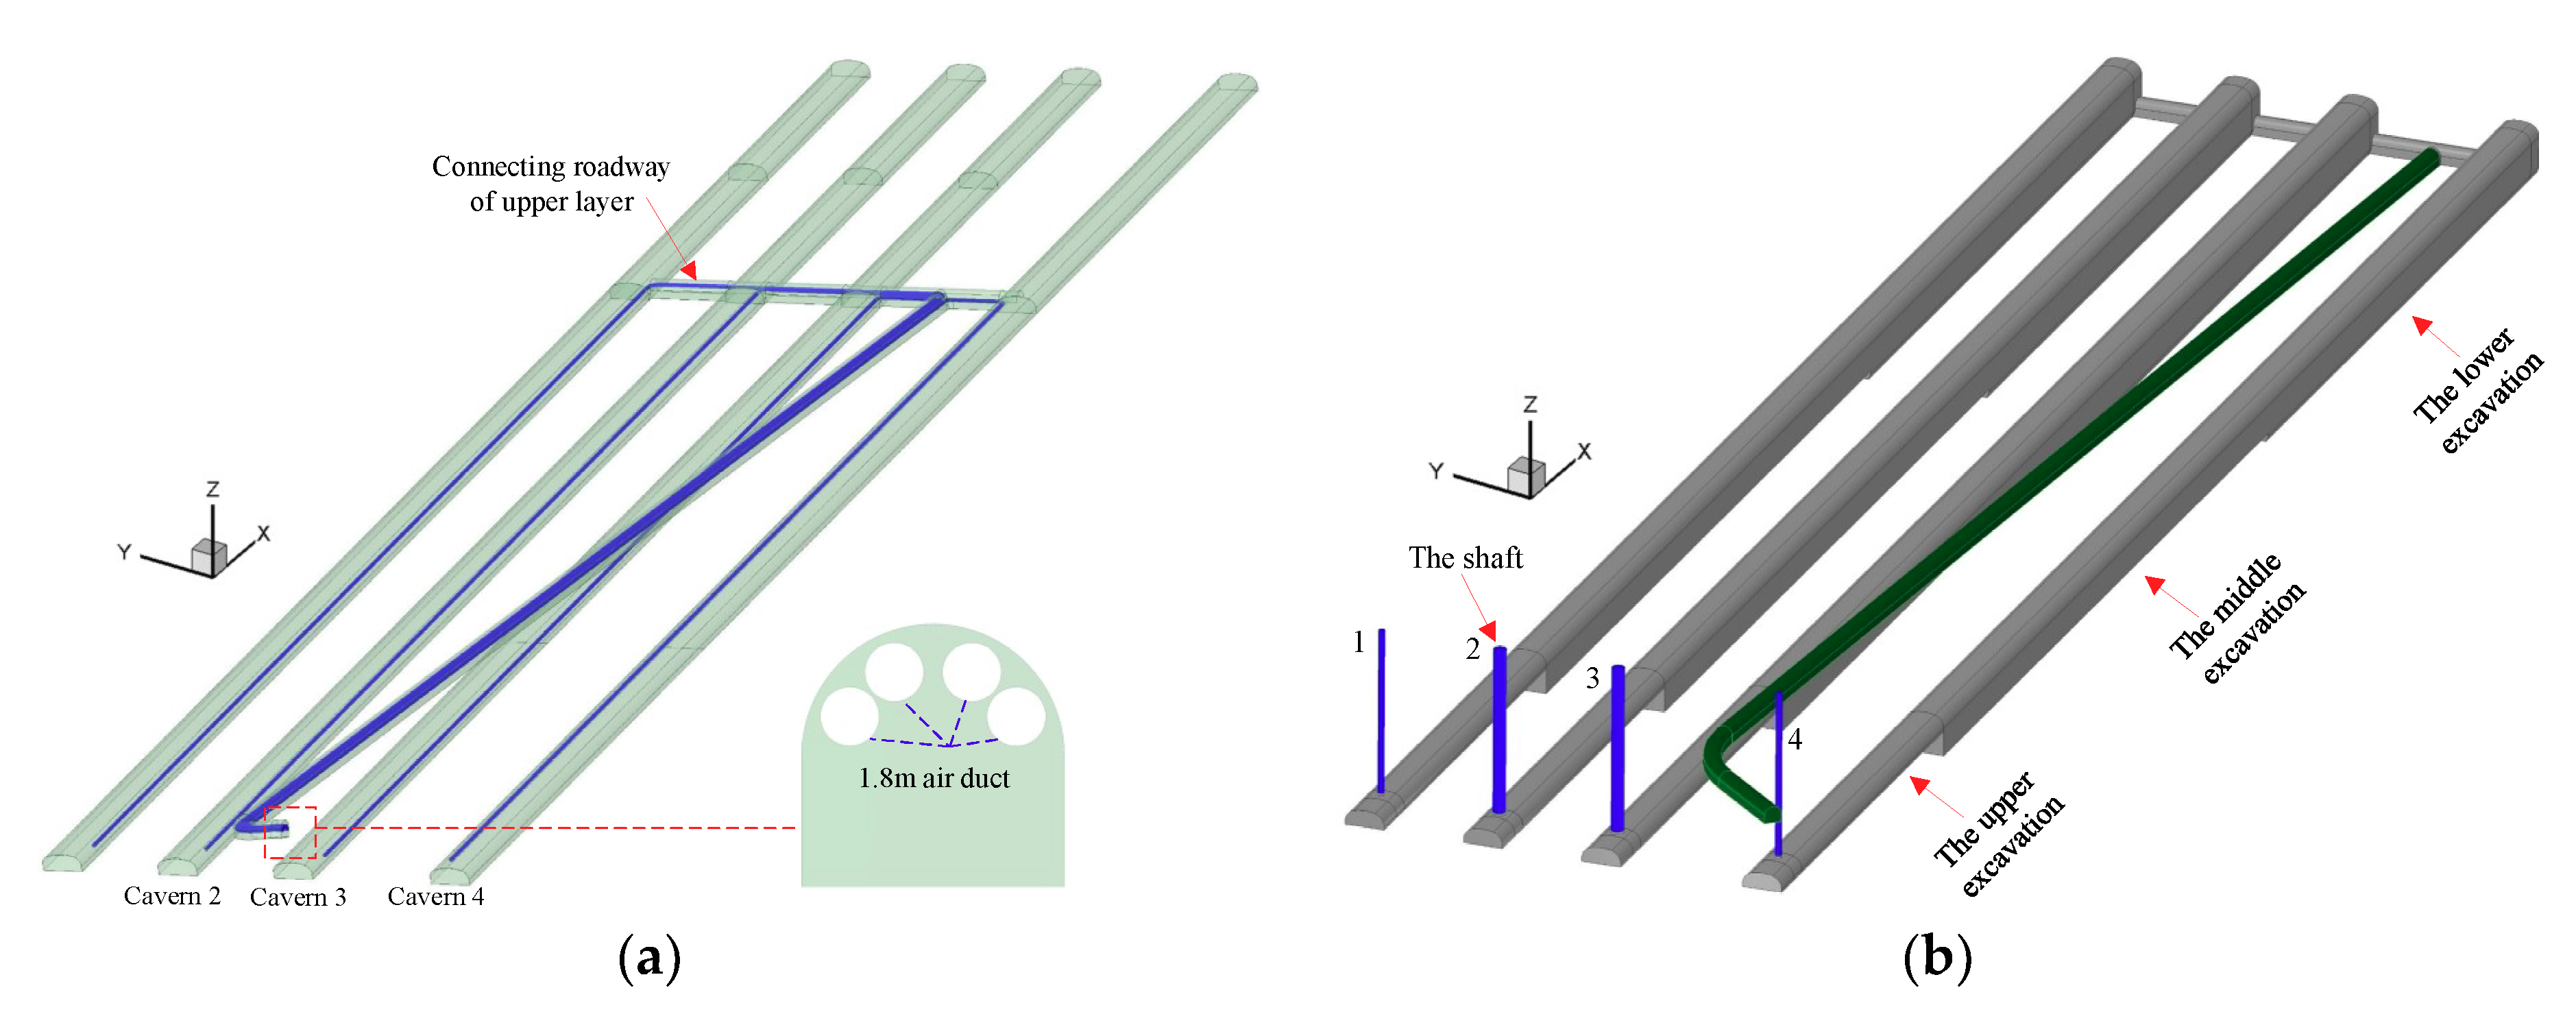
Since the construction of the cavern group is divided into two contract sections, the computational domain of this paper is the first section, including cavern 1 to cavern 4, shafts, the construction roadway, and the connecting roadway. In order to compare the air quality between the original ventilation scheme and the improved ventilation scheme, the 3D modelling software Space Claim 17.0 was first used to establish the geometry of forced ventilation and axial-flow gallery ventilation by using the shaft as shown in the Figure 5. The X direction is the axis direction, the Y direction is the width direction, the Z direction is the height direction of the cavern, and the three-dimensional dimension is exactly the same as the actual project.
Then, the ICEM 17.0 was employed to generate the grids of the geometry. In consideration of the computing scale, stability and convergence of the simulation, a regular hexahedron grid with a quality of 0.5 and 0.52 was used in the geometrical model meshing. In general, quality values above 0.3 are acceptable for most solvers [23]. The grid density near the outlet of the air duct was properly increased due to its large airflow velocity and pressure gradient. Figure 6 shows the meshing details of the local geometrical model of the two ventilation schemes. In the forced ventilation scheme, the mesh size of the longitudinal direction (X direction) is 1.15 m, and in the cross section (Y direction), it ranges from 0.2 m to 0.6 m, with a total of 1,755,658 elements. In the axial-flow gallery ventilation scheme, a longitudinal mesh size from 0.5 m to 1 m and cross mesh size from 0.3 m to 0.6 m were selected, which includes 2,645,122 elements.
4.2. Boundary Conditions
In general, air flow in an underground cavern is a complex three-dimensional turbulent flow [17,24,25]. However, the length of most caverns is much larger than their hydraulic diameter. It can be considered that the wind flow parameters are approximately evenly distributed in the cavern section, that is, the parameters such as the pressure, flow velocity and density of the wind flow are regarded as constants in the same section 26. During construction ventilation, the air velocity in the cavern is under 7 m/s, and the air velocity in the ventilation duct is no more than 30 m/s. The diffusion of harmful gas caused by drilling and blasting is an unsteady process over time. Therefore, the following basic assumptions are used in the numerical calculation. (1) The air airflow field in the cavern is assumed as a three-dimensional, viscous and incompressible Newtonian fluid. (2) The air leakage rate of the duct and the pressure loss of the airflow in the duct are not considered. (3) The heat exchange between the airflow and the cavern wall is not considered and the heat dissipation caused by viscous fluid work is ignored. (4) The disturbance of the flow field induced by the equipment and obstacles in the cavern is not considered.
According to the actual project situation, there are three types of boundary conditions in the simulations: wall, inlet and outlet [27,28,29]. (1) A non-slip stationary wall boundary is applied to the cavern surface, heading face and air duct surface, and the standard wall function method is used. The roughness constant (Cs) is set as 0.57 and the equivalent sand-grain roughness height (Ks) is used for roughness height, Ks = 0.07 m [30]. The distance from point P in the first near-wall cell to the wall (yp) is 0.52 m. (2) The outlet of the air duct is considered to be a velocity-inlet with an airflow velocity of 15 m/s in Figure 5a. There are four velocity-inlets located at the entrance of the shaft in Figure 5b, the value is 5 m/s in the oil-inlet shaft and 10 m/s in the oil-outlet shaft. (3) The pressure outlet boundary is adopted at the entrance of the construction roadway in the two schemes.
A large amount of gas is generated after blasting, and carbon monoxide (CO) and oxides of nitrogen are highly toxic. Because of the superior stability of chemical and physical properties of CO compared to nitrogen oxide, CO was used as an evaluation index in ventilation calculation. The amount of nitrogen oxide was converted to the equivalent carbon monoxide at a ratio of 1:6.5 [31]. The initial throwing length and average CO concentration were calculated by the following equation and are shown in Table 2.
(1) The CO throwing length:
(2) The initial average CO concentration:
where, C0 is the initial CO concentration (mg/m3), G is the amount of explosive (kg), LOT is the throwing length (m), b is toxic gas produced per kilogram of explosive (m3/kg), b is generally valued at 0.04, and A is the excavation area (m2).
4.3. Others Computational Settings
The finite volume method (FVM) was used to discretize the incompressible RANS equations. The RNG k-ε turbulence model was adopted in this study. The CFD code ANSYS FLUENT 17.0 was employed to solve the continuity, the momentum and the energy equations, together with the turbulence model in the present work. The time-dependent terms were handled through an implicit second-order backward differentiation in time. The second-order upwind scheme was used to approximate the convective terms at the faces of the control volumes. The pressure implicit with splitting of operators (PISO) algorithm was employed as the pressure velocity coupling method [32]. The convergence criterion is 10−6 for the energy equation and 10-4 for other equations [33]. The computer with Core i7-8700 CUP and 32 G memory was used to perform all the simulations. The governing equations solved in FLUENT for the present problem can be found in the FLUENT manual [34].
4.4. Validation
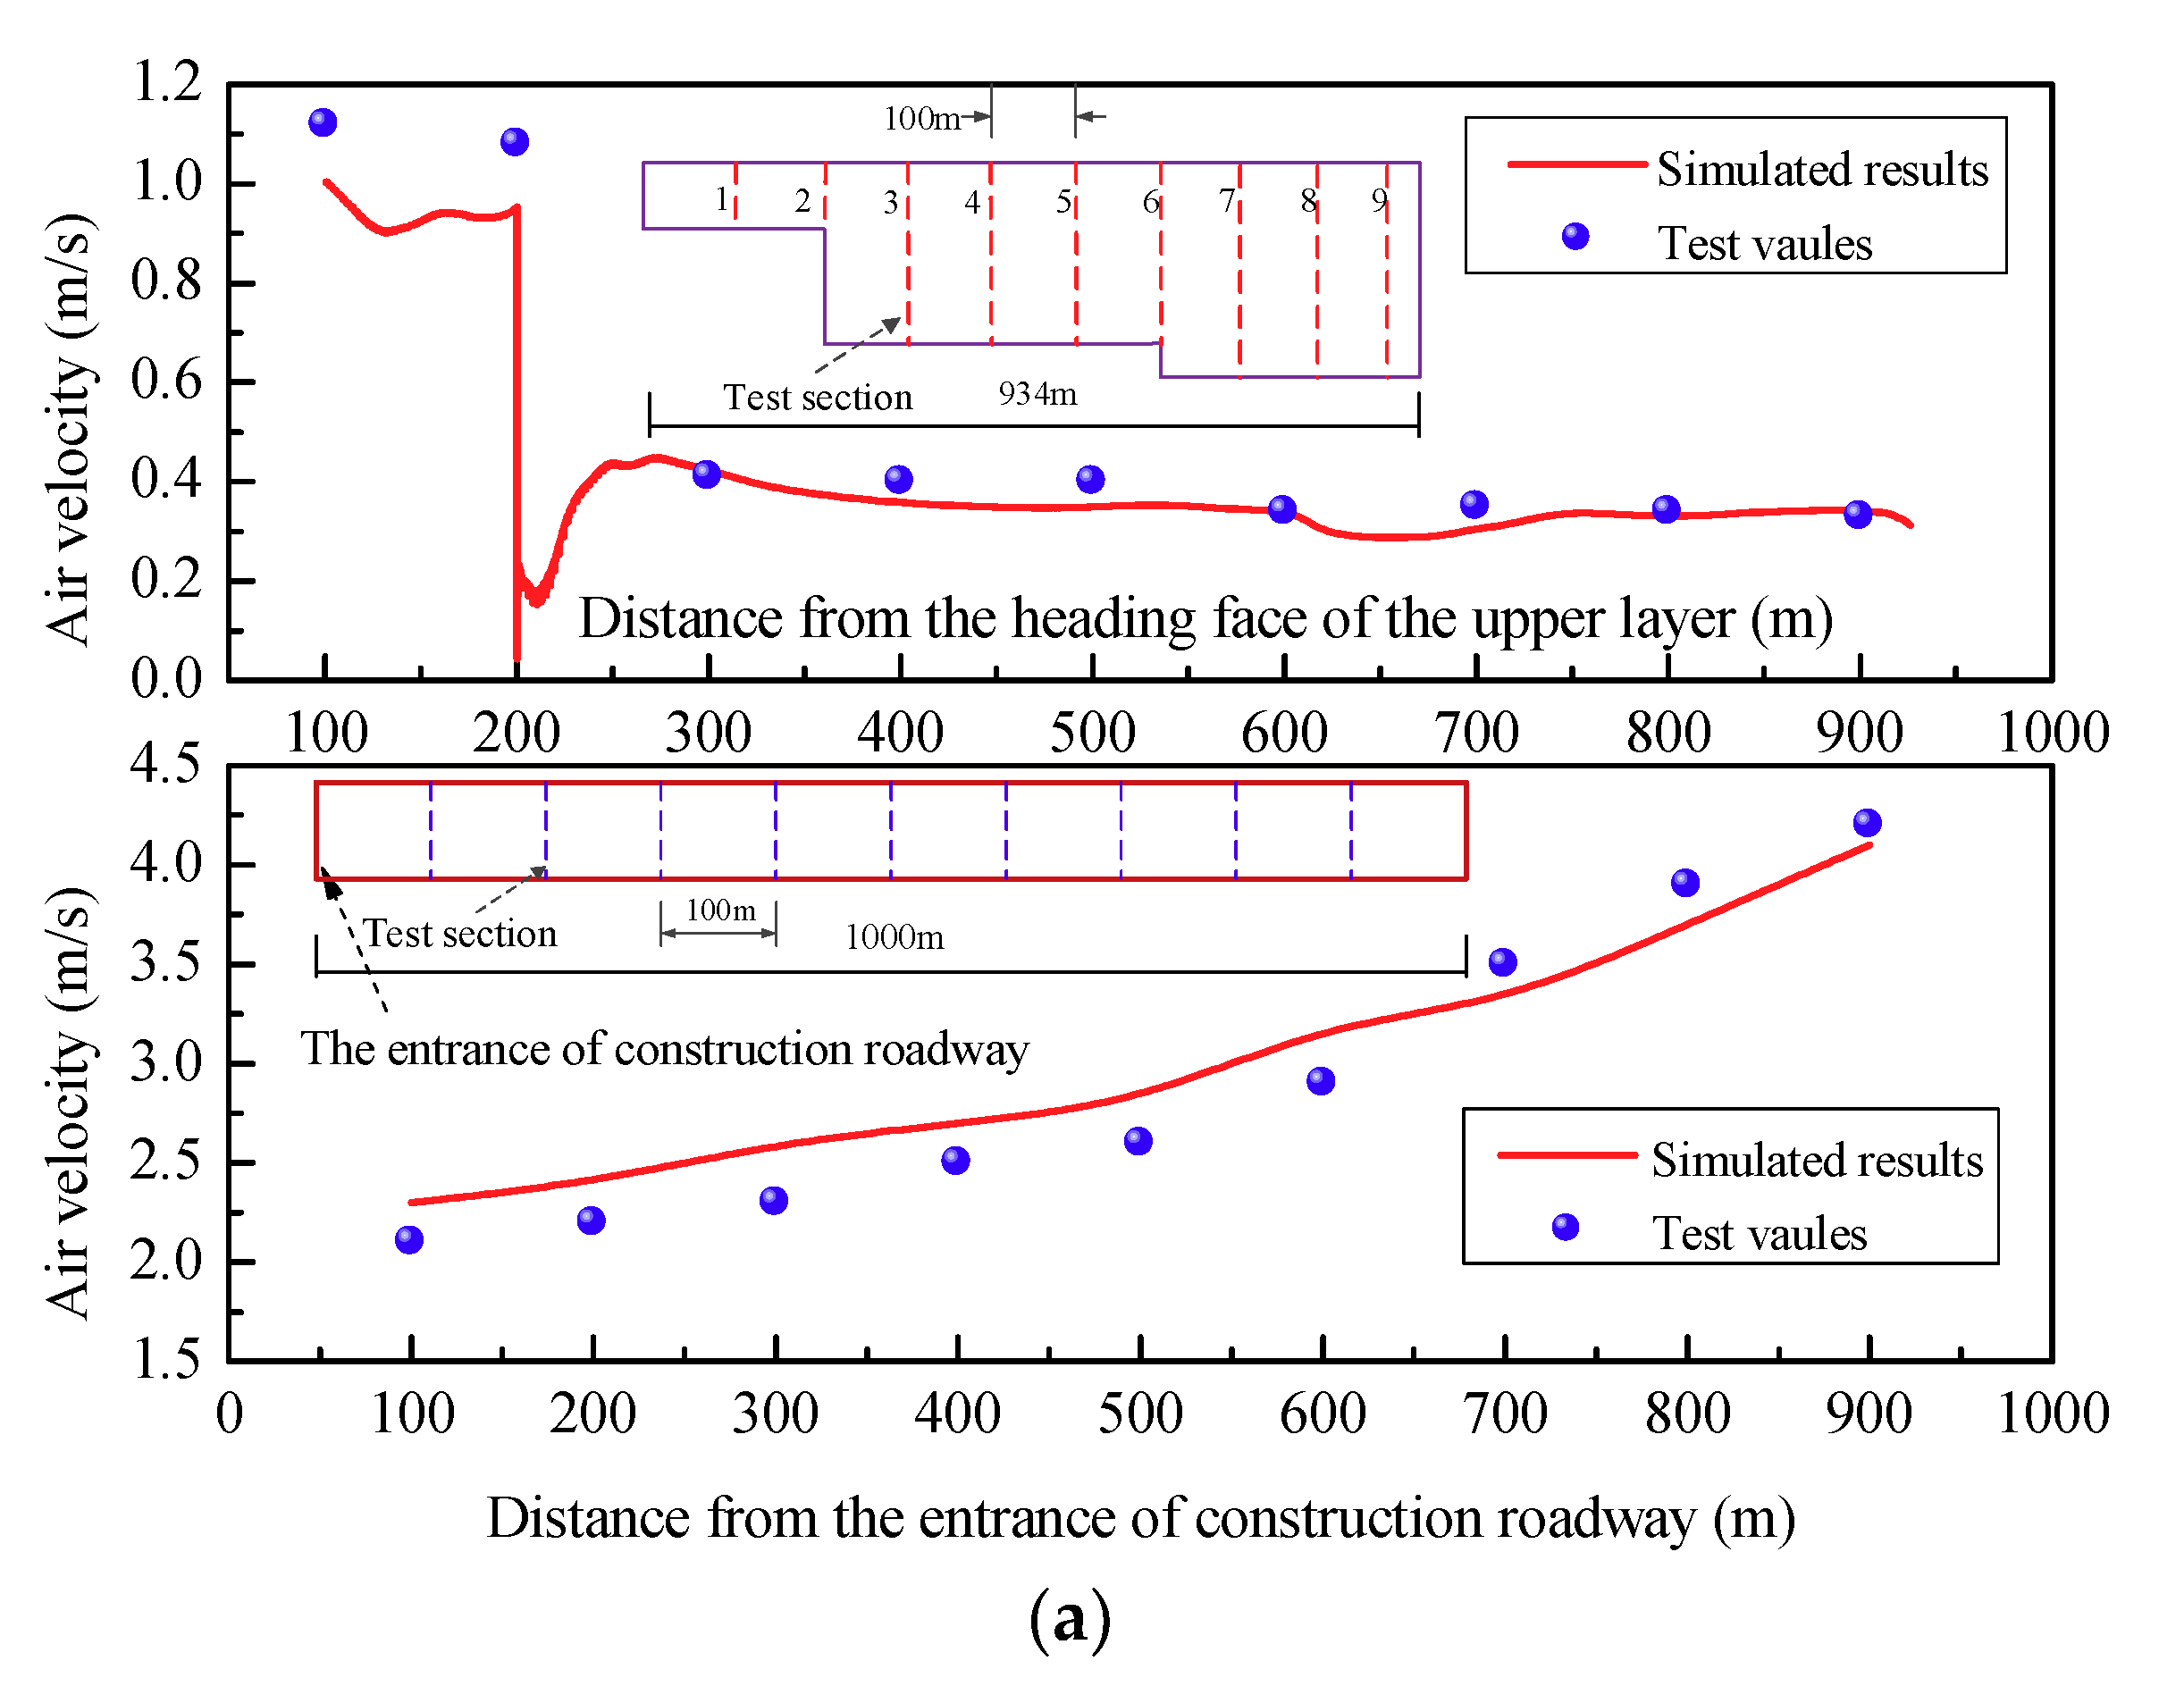
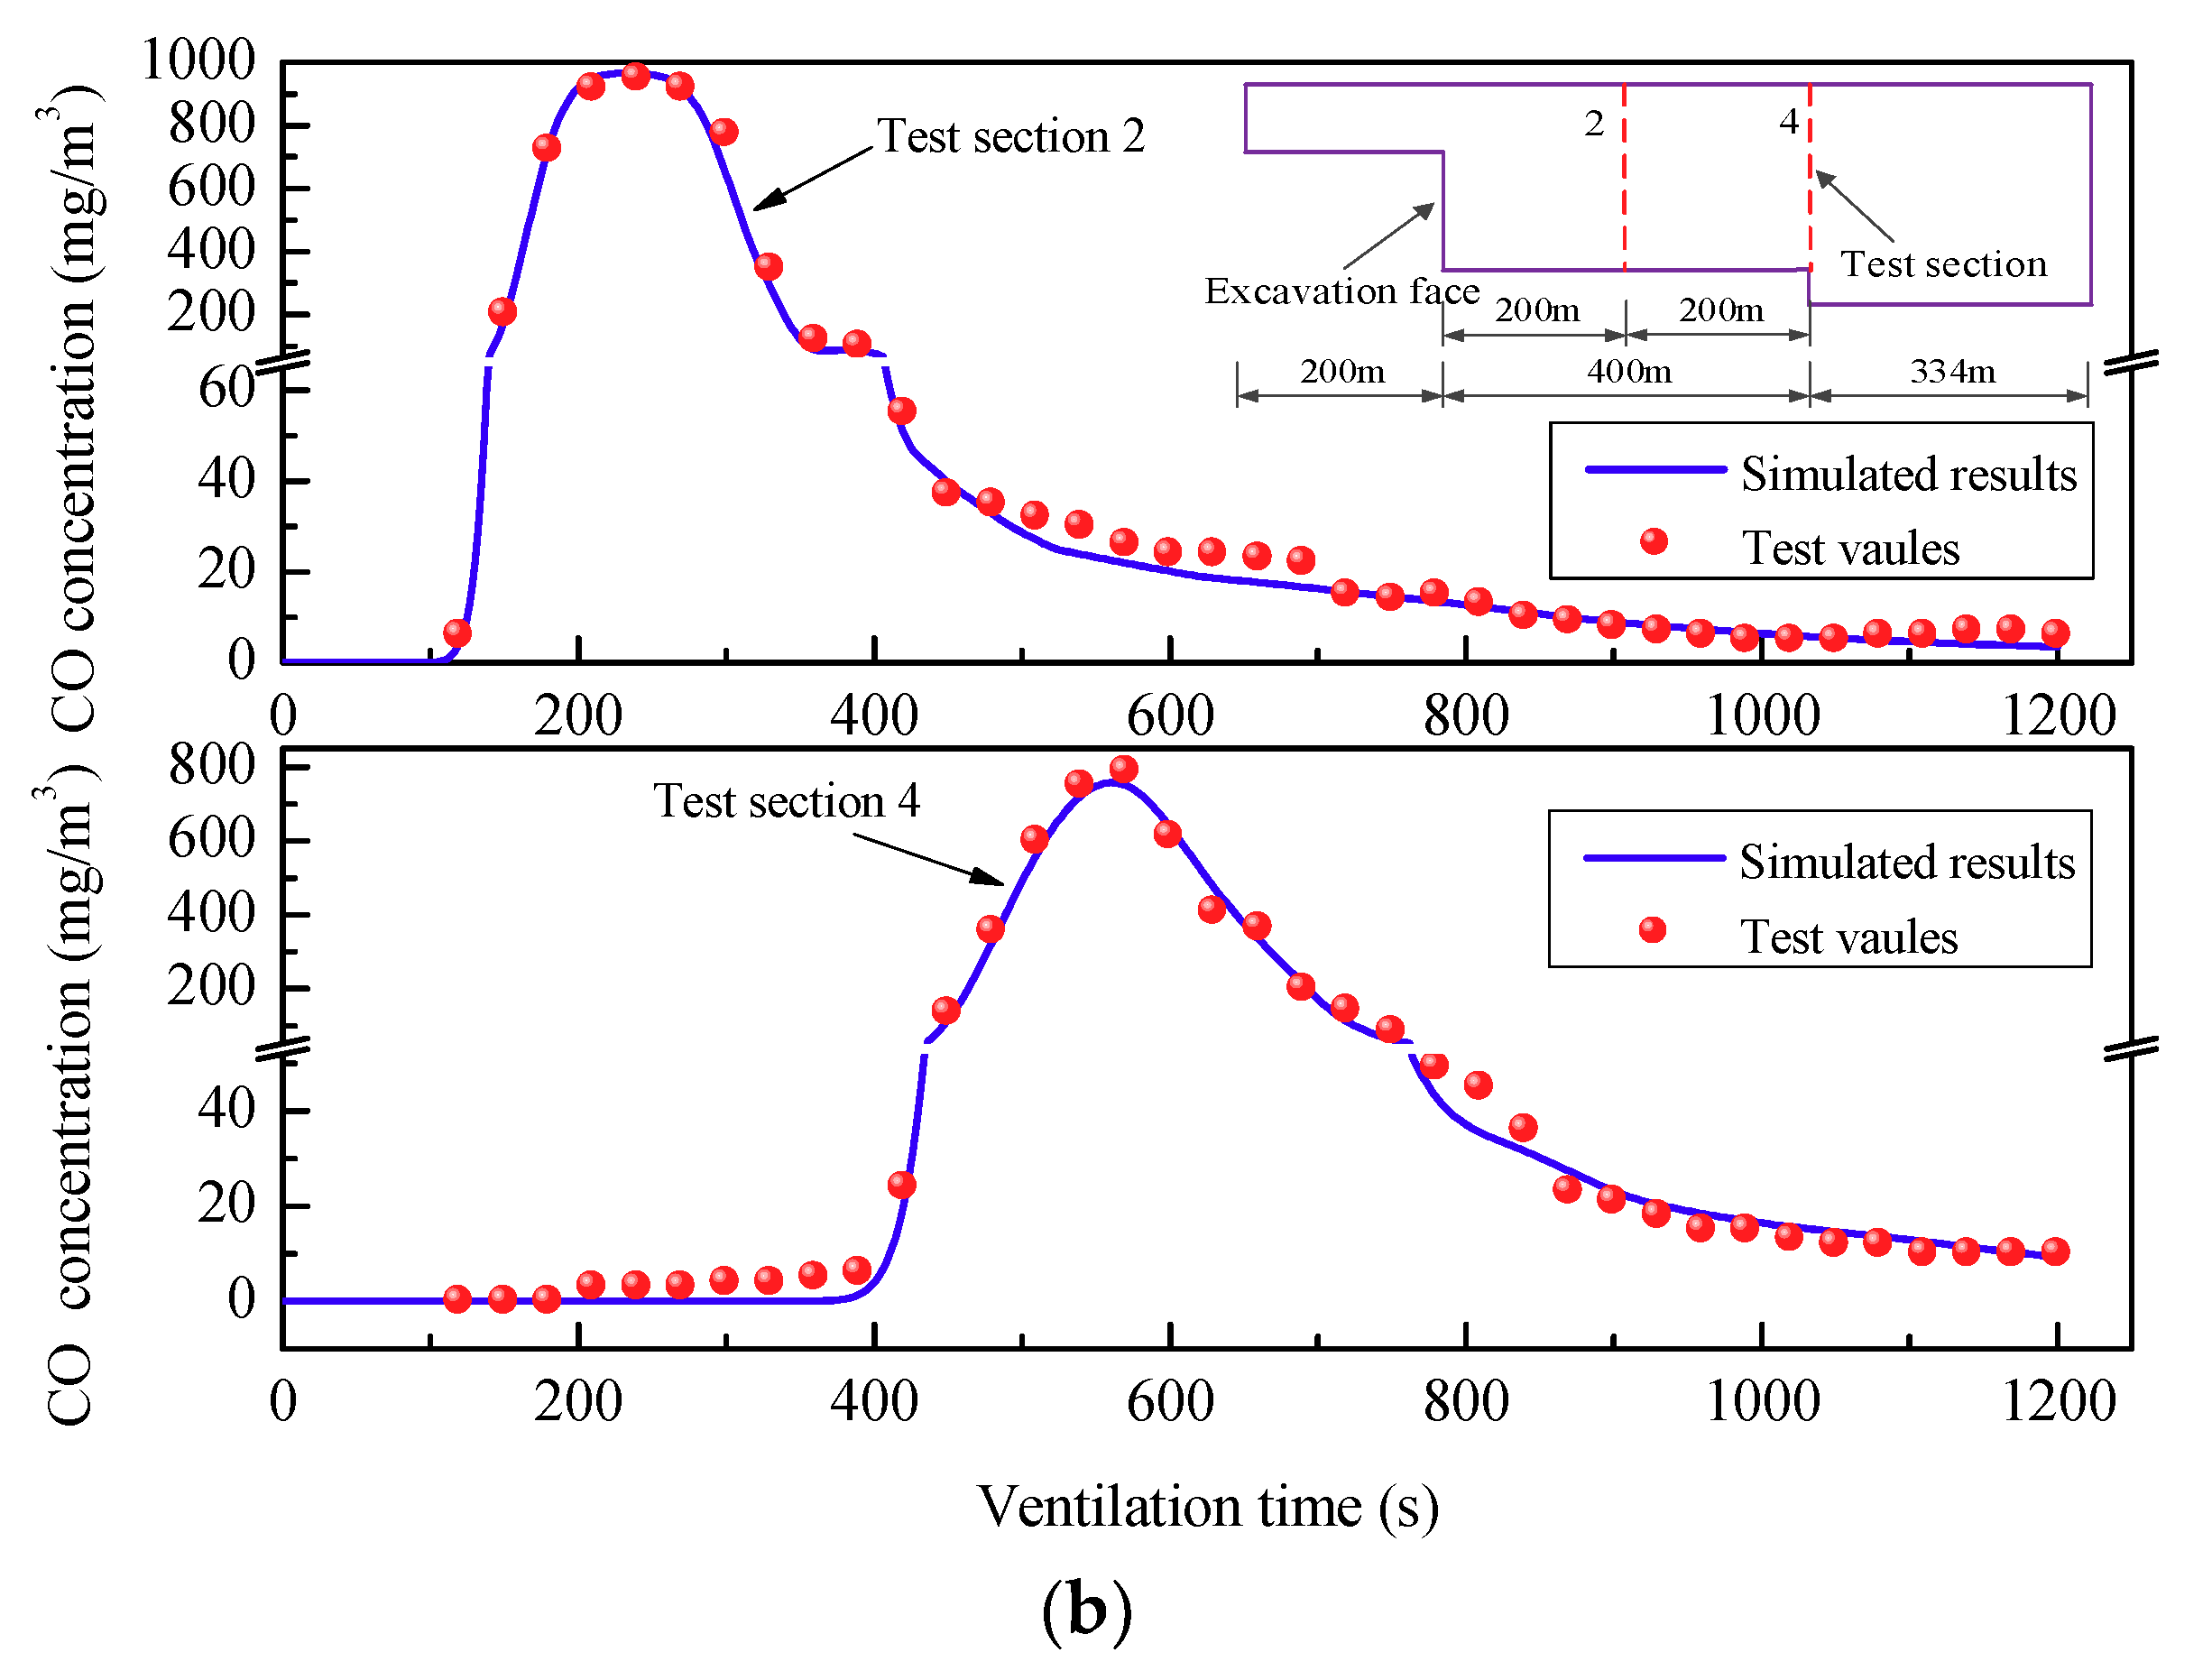
The field test values for air velocity and CO concentration in the Jinzhou oil storage cavern were used to validate the CFD results. The simulated values were compared to the measured values as shown in Figure 7. It can be seen that the air velocity in the main cavern and construction roadway obtained by the CFD simulation fit the field test well. The average errors in the main cavern and construction roadway are 7.4% and 8.3%, respectively. Moreover, the simulation results of the average CO concentration in 2 test sections are in good agreement with the measured values. The average relative errors of the CO concentration in Section 2 and Section 4 are 9.5% and 13.2% respectively. The validation results indicate that the 3D steady RANS coupled with the RNG k-ε turbulence model can give a satisfactory prediction of the flow ventilation in the Jinzhou oil storage caverns.
5. Results and Discussion
5.1. Original Scheme of Forced Ventilation
5.1.1. Air Velocity Field
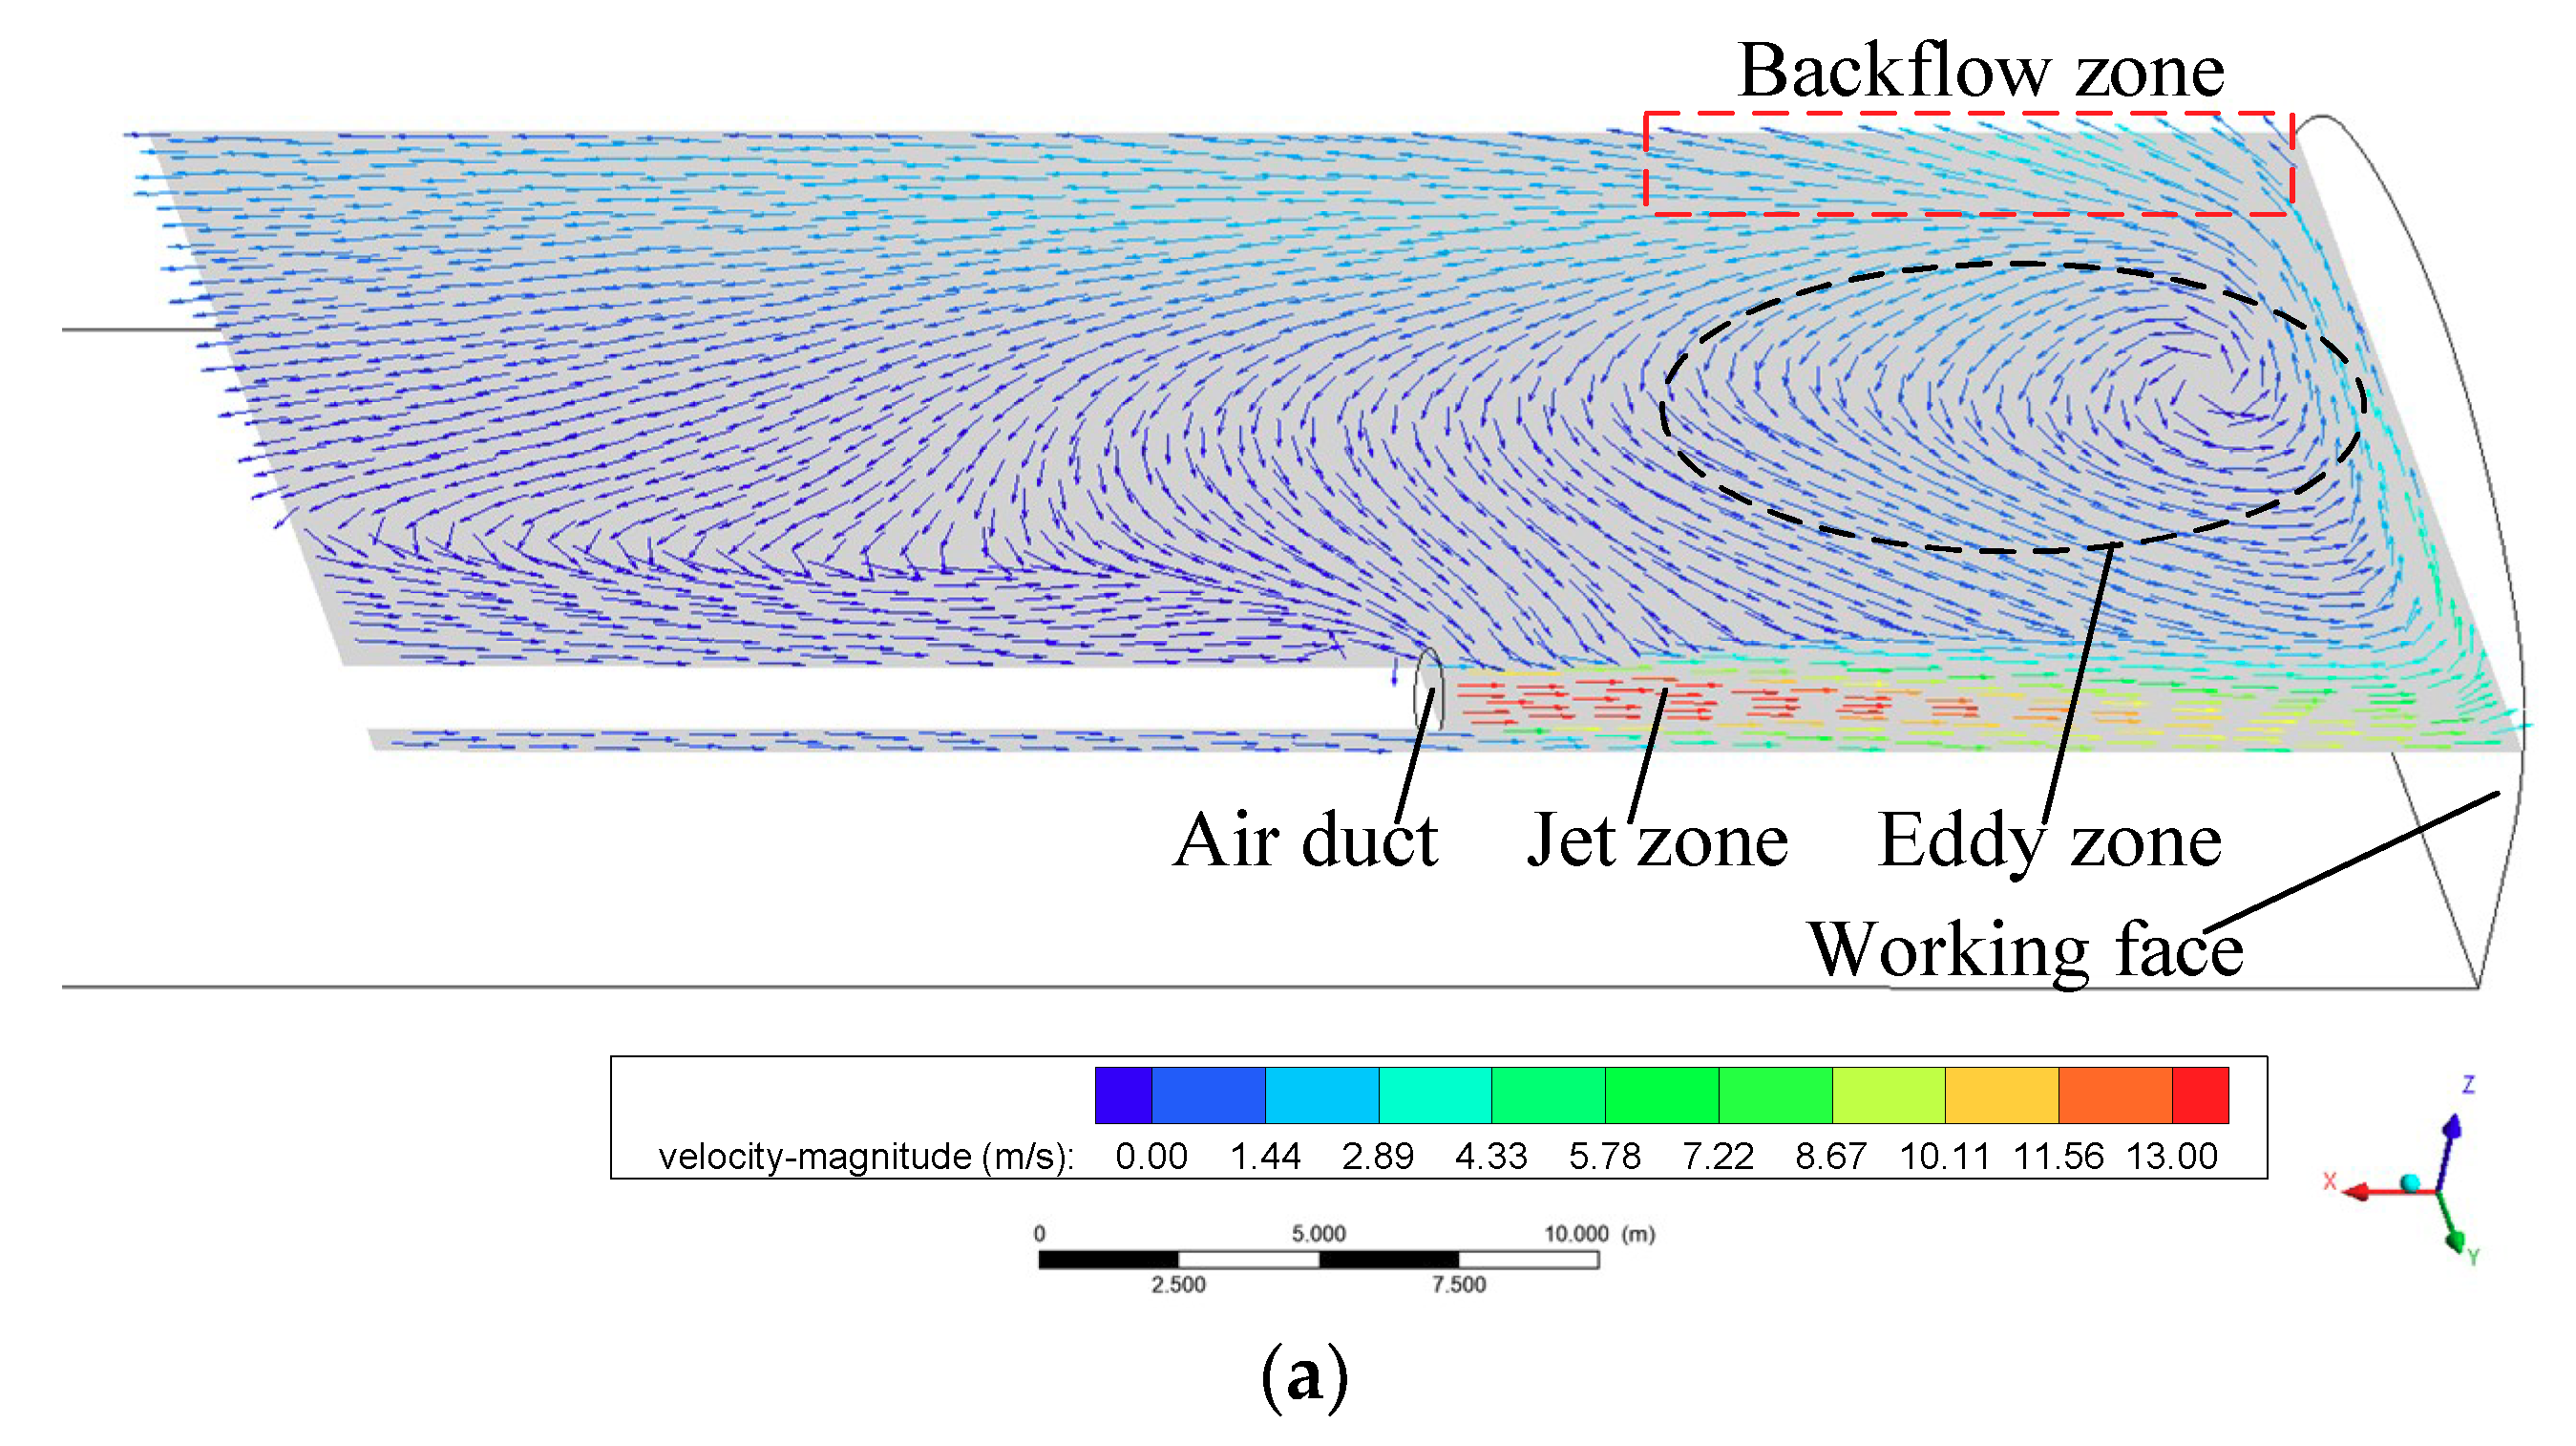
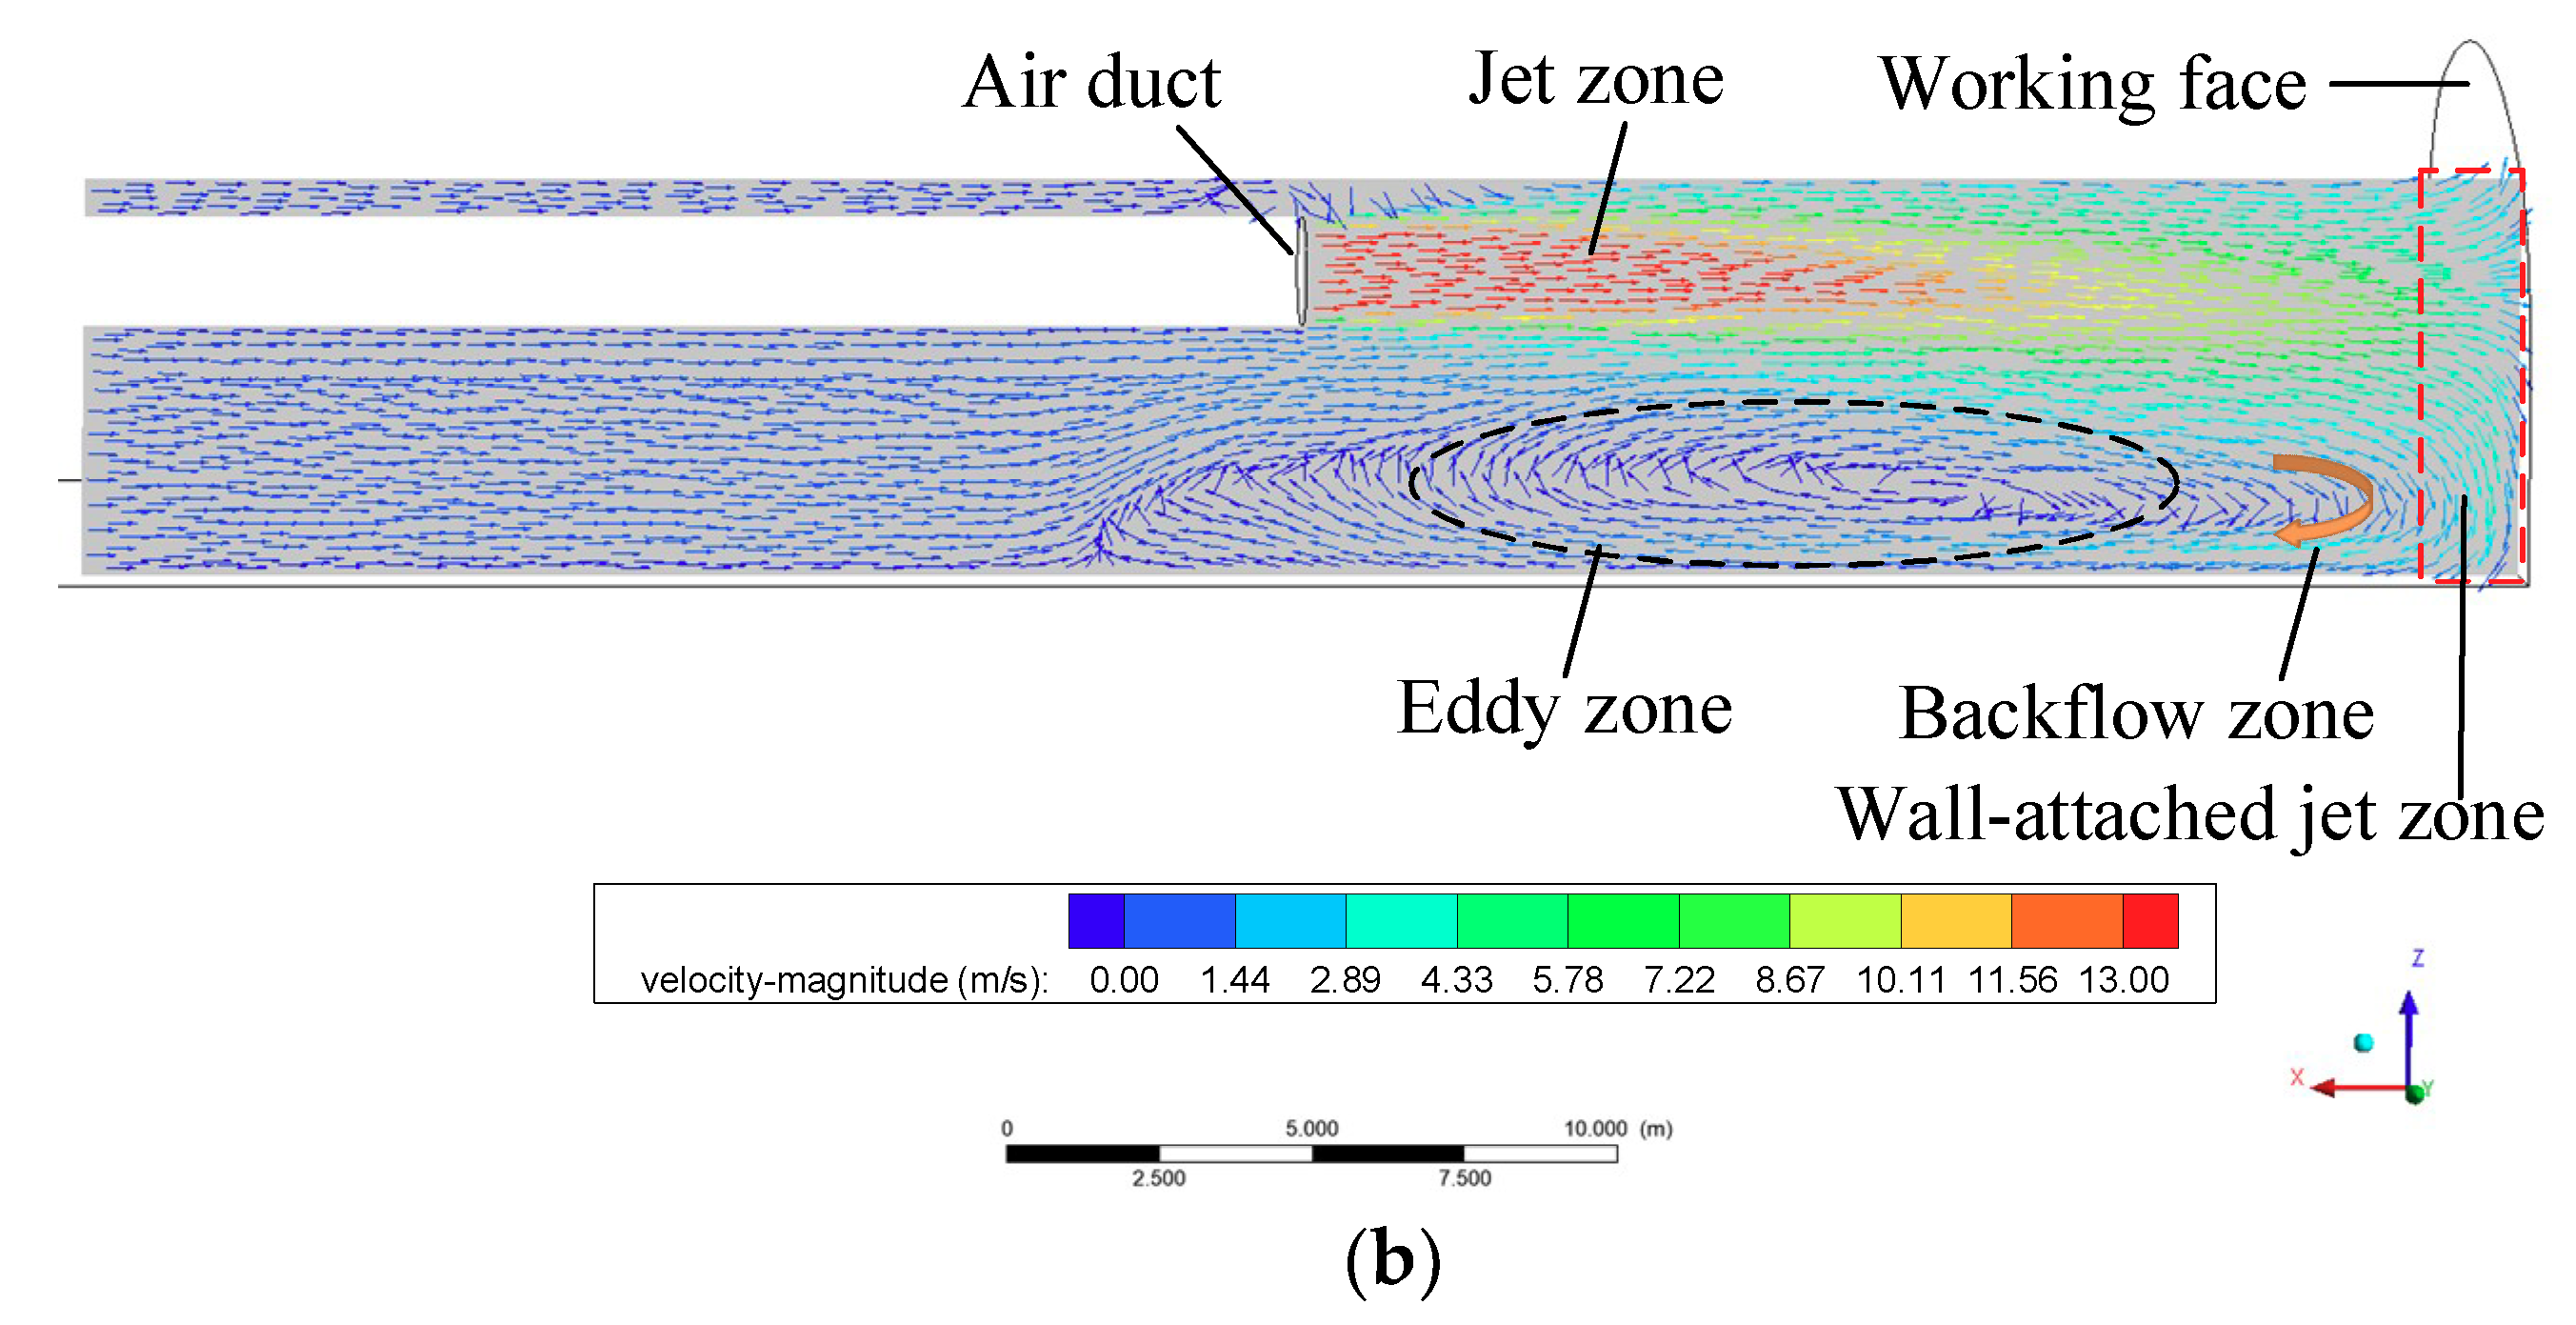
During forced ventilation in a cavern, the jet flow and backflow exist at the same time, which plays a role in the dilution and discharge of harmful gases generated during construction; hence, the airflow distribution near the heading face is more complicated. In order to show the characteristics of the jet flow and backflow more clearly and intuitively, the velocity vector at profile y = 18 m and horizontal section z = 5.5 m were analyzed. It can be seen from Figure 8 that there are several obvious zones in the duct jet flow field, namely, the wall-attached jet zone, impinging jet zone, eddy zone, backflow zone. In the process of airflow from the air duct, the surrounding air is continuously entrained by the jet flow, and the jet distance and range are increased. However, due to the limited space of a blind heading cavern and the continuity of airflow, the backflow is formed at the working face, and the zone is larger than the jet area. The backflow interacts with the jet flow to form the eddy zone in the middle zone. The eddy zone has adverse effects on the discharge of harmful gas near the heading face, and some harmful gas circulates in the eddy zone and needs to be diluted and discharged for a long time, which also can be observed in Wang et al.’s study [35].
Figure 9 shows the axial air velocity distribution at different locations in the cavern. There is a large fluctuation in air velocity near the heading face and the velocity is basically stable after more than 150 m from the heading face. In the stable airflow zone, the air velocity in the middle of the cavern section is high and the velocity in the area closer to the tunnel wall is smaller, which is completely consistent with the basic theory of fluid mechanics.
5.1.2. CO Concentration Field
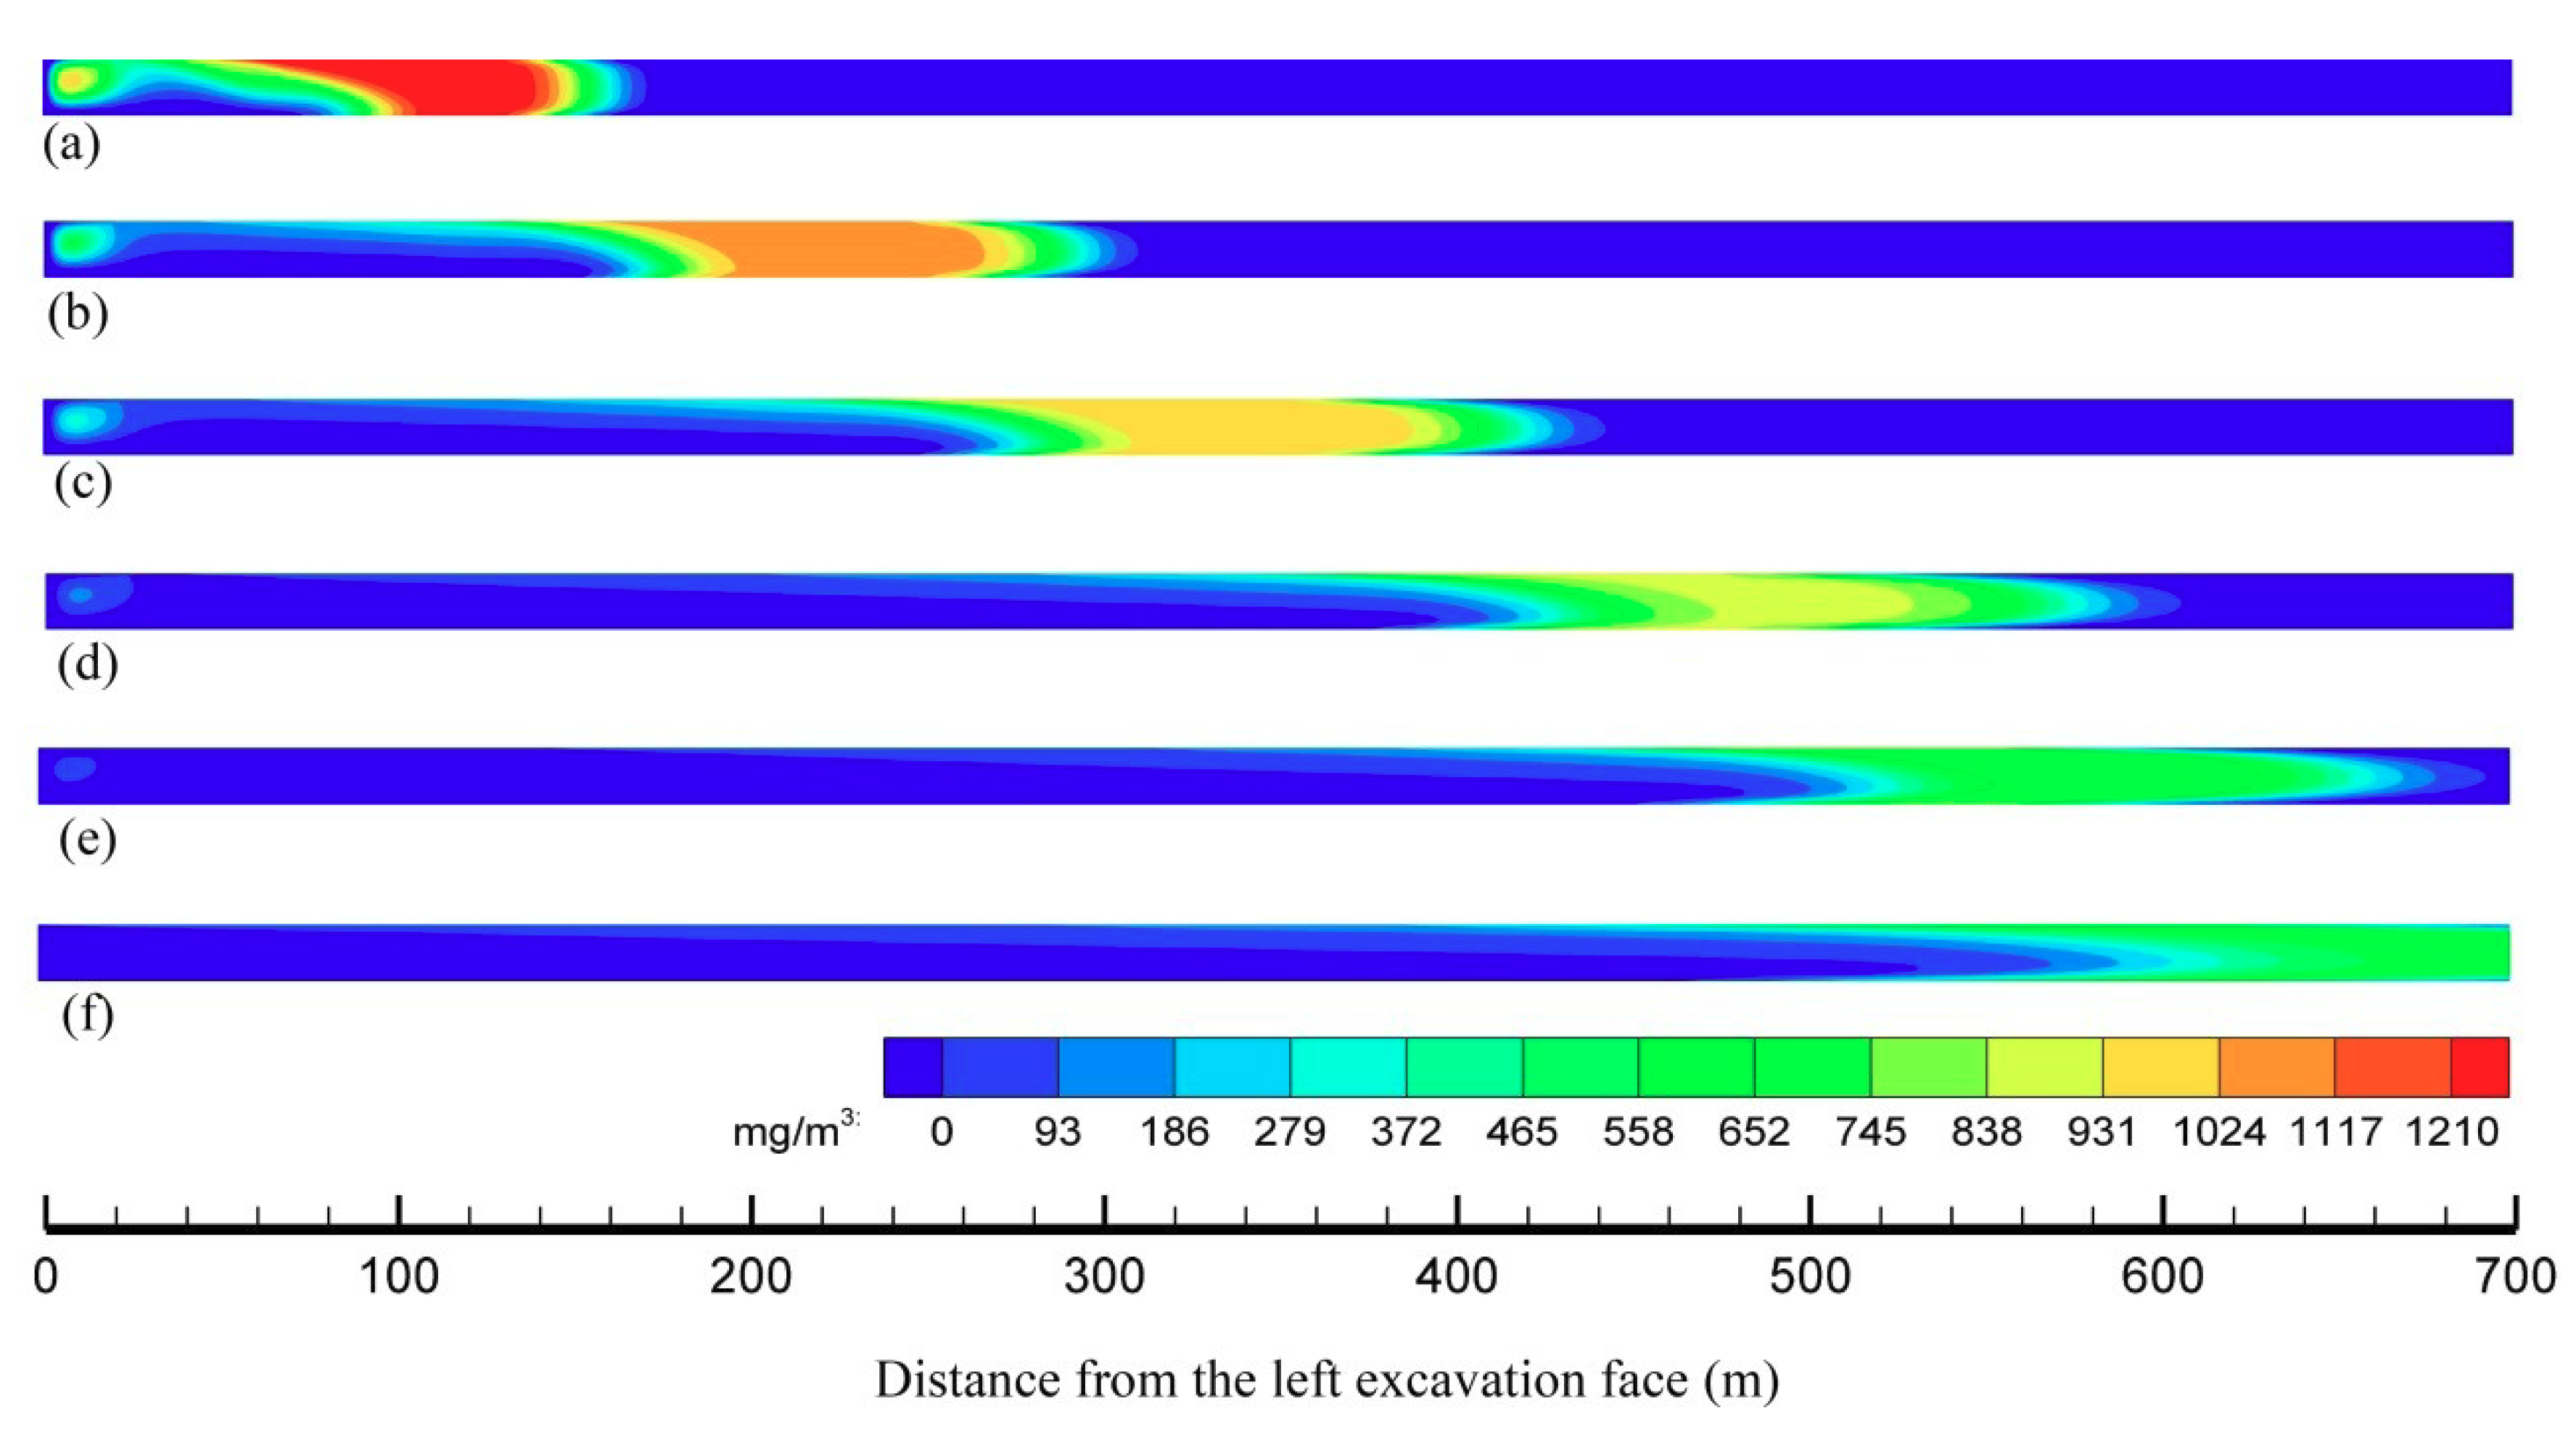
The distribution of CO mass concentration in the central axial plane within 30 min of ventilation after blasting is shown in Figure 10. It can be seen that in the early stage of ventilation, the CO near the excavation face cannot be moved to the connecting roadway in time due to the eddy zone in this area. The connecting roadway is located 678 m away from the left excavation face as shown in Figure 2a. With the increase in ventilation time, CO is continuously diluted and moving towards the connecting roadway. The maximum mass concentration of CO in the cavern decreases and the air volume containing CO expands continuously. The CO migration velocity in the middle of the cavern is faster and near the wall surface, it is slower, showing a U-shaped distribution in the cavern.
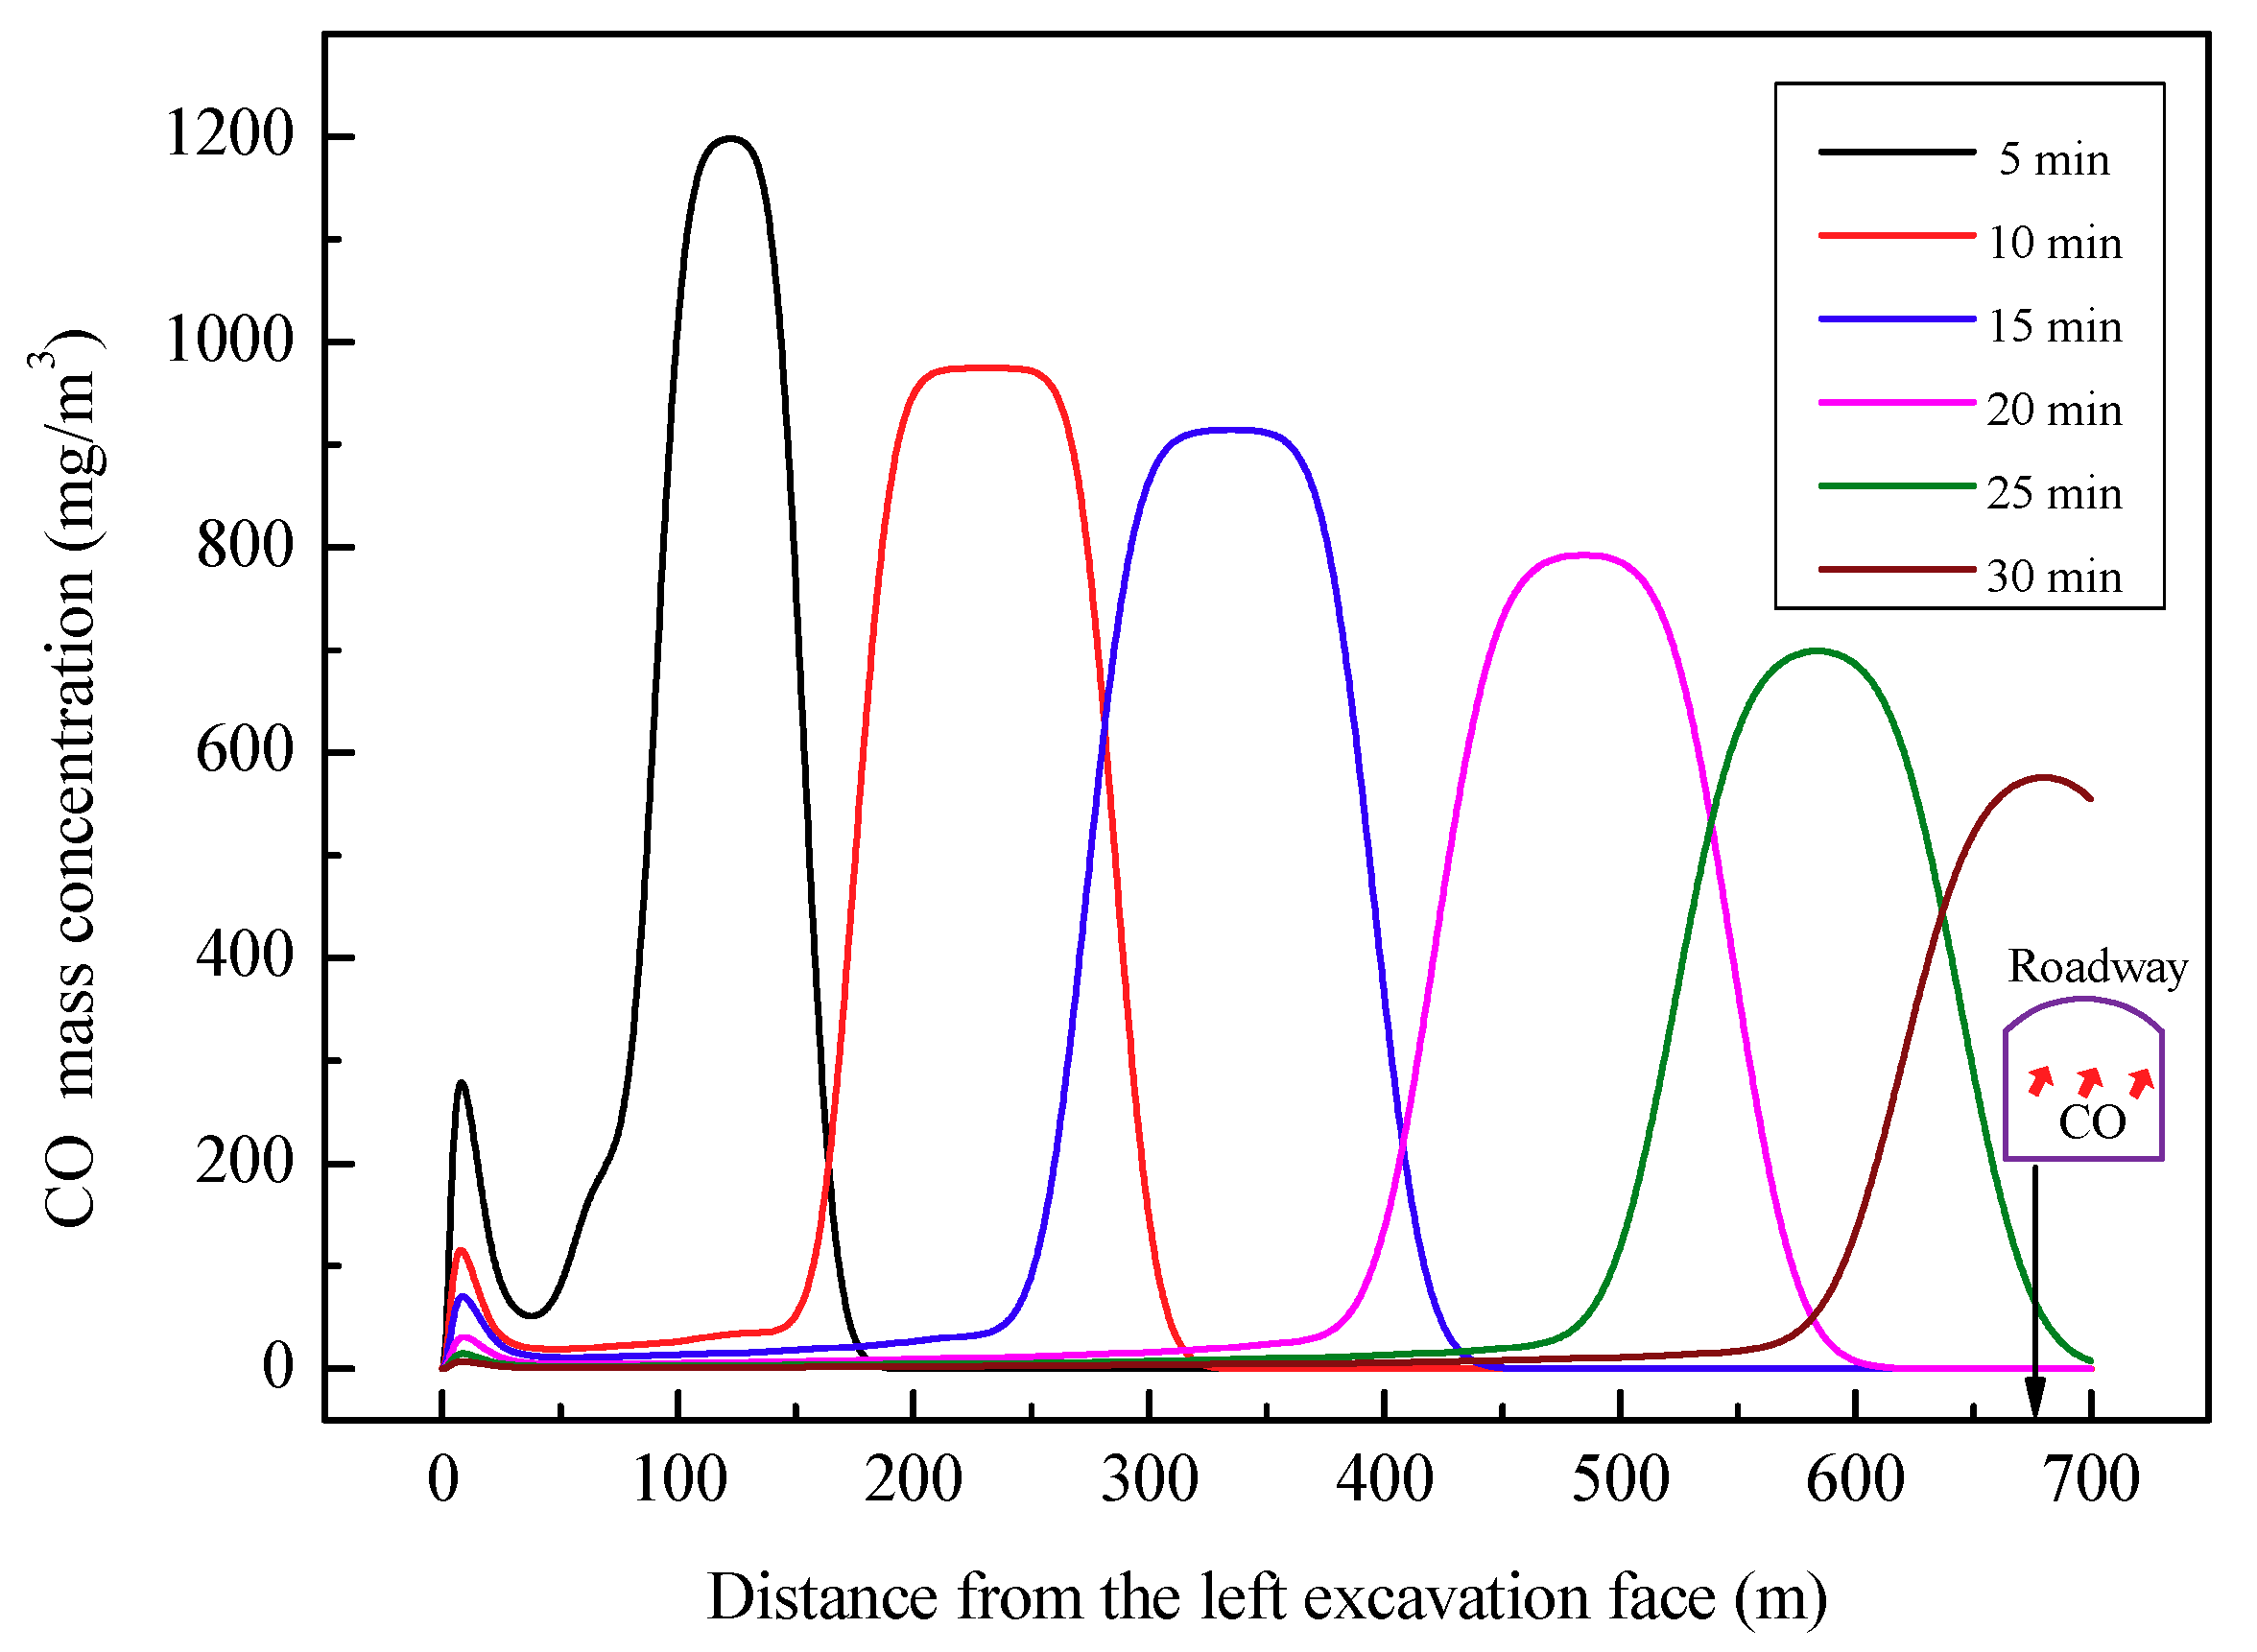
In order to investigate the air quality at the breathing height of field workers in the cavern, the CO mass concentration distribution at a height of 1.6 m from the ground was studied as shown in Figure 11. The CO near the excavation face and the maximum CO concentration in the cavern decrease with the ventilation time, and the distribution span of CO air mass increases gradually. Ventilation time has a great impact on construction ventilation effect. Although the “Safety Operation Regulations for Tunnel Drilling and Blasting” stipulates that the ventilation time after blasting should not be less than 15 min [36], the specific ventilation time is not clearly defined in the code and the industry usually takes 30 min into account. If the ventilation time is too short, the air volume and ventilation equipment configuration capability need to be increased, resulting in an increase in ventilation costs; if it is too long, it will affect the subsequent working procedures. It can be seen from Figure 11 that the CO only moves to the vicinity of the connecting roadway after 30 min of forced ventilation, and its concentration value is much higher than the safety standard value of 30 mg/m3.
5.2. Axial-Flow Gallery Ventilation Scheme
5.2.1. Air Velocity Field
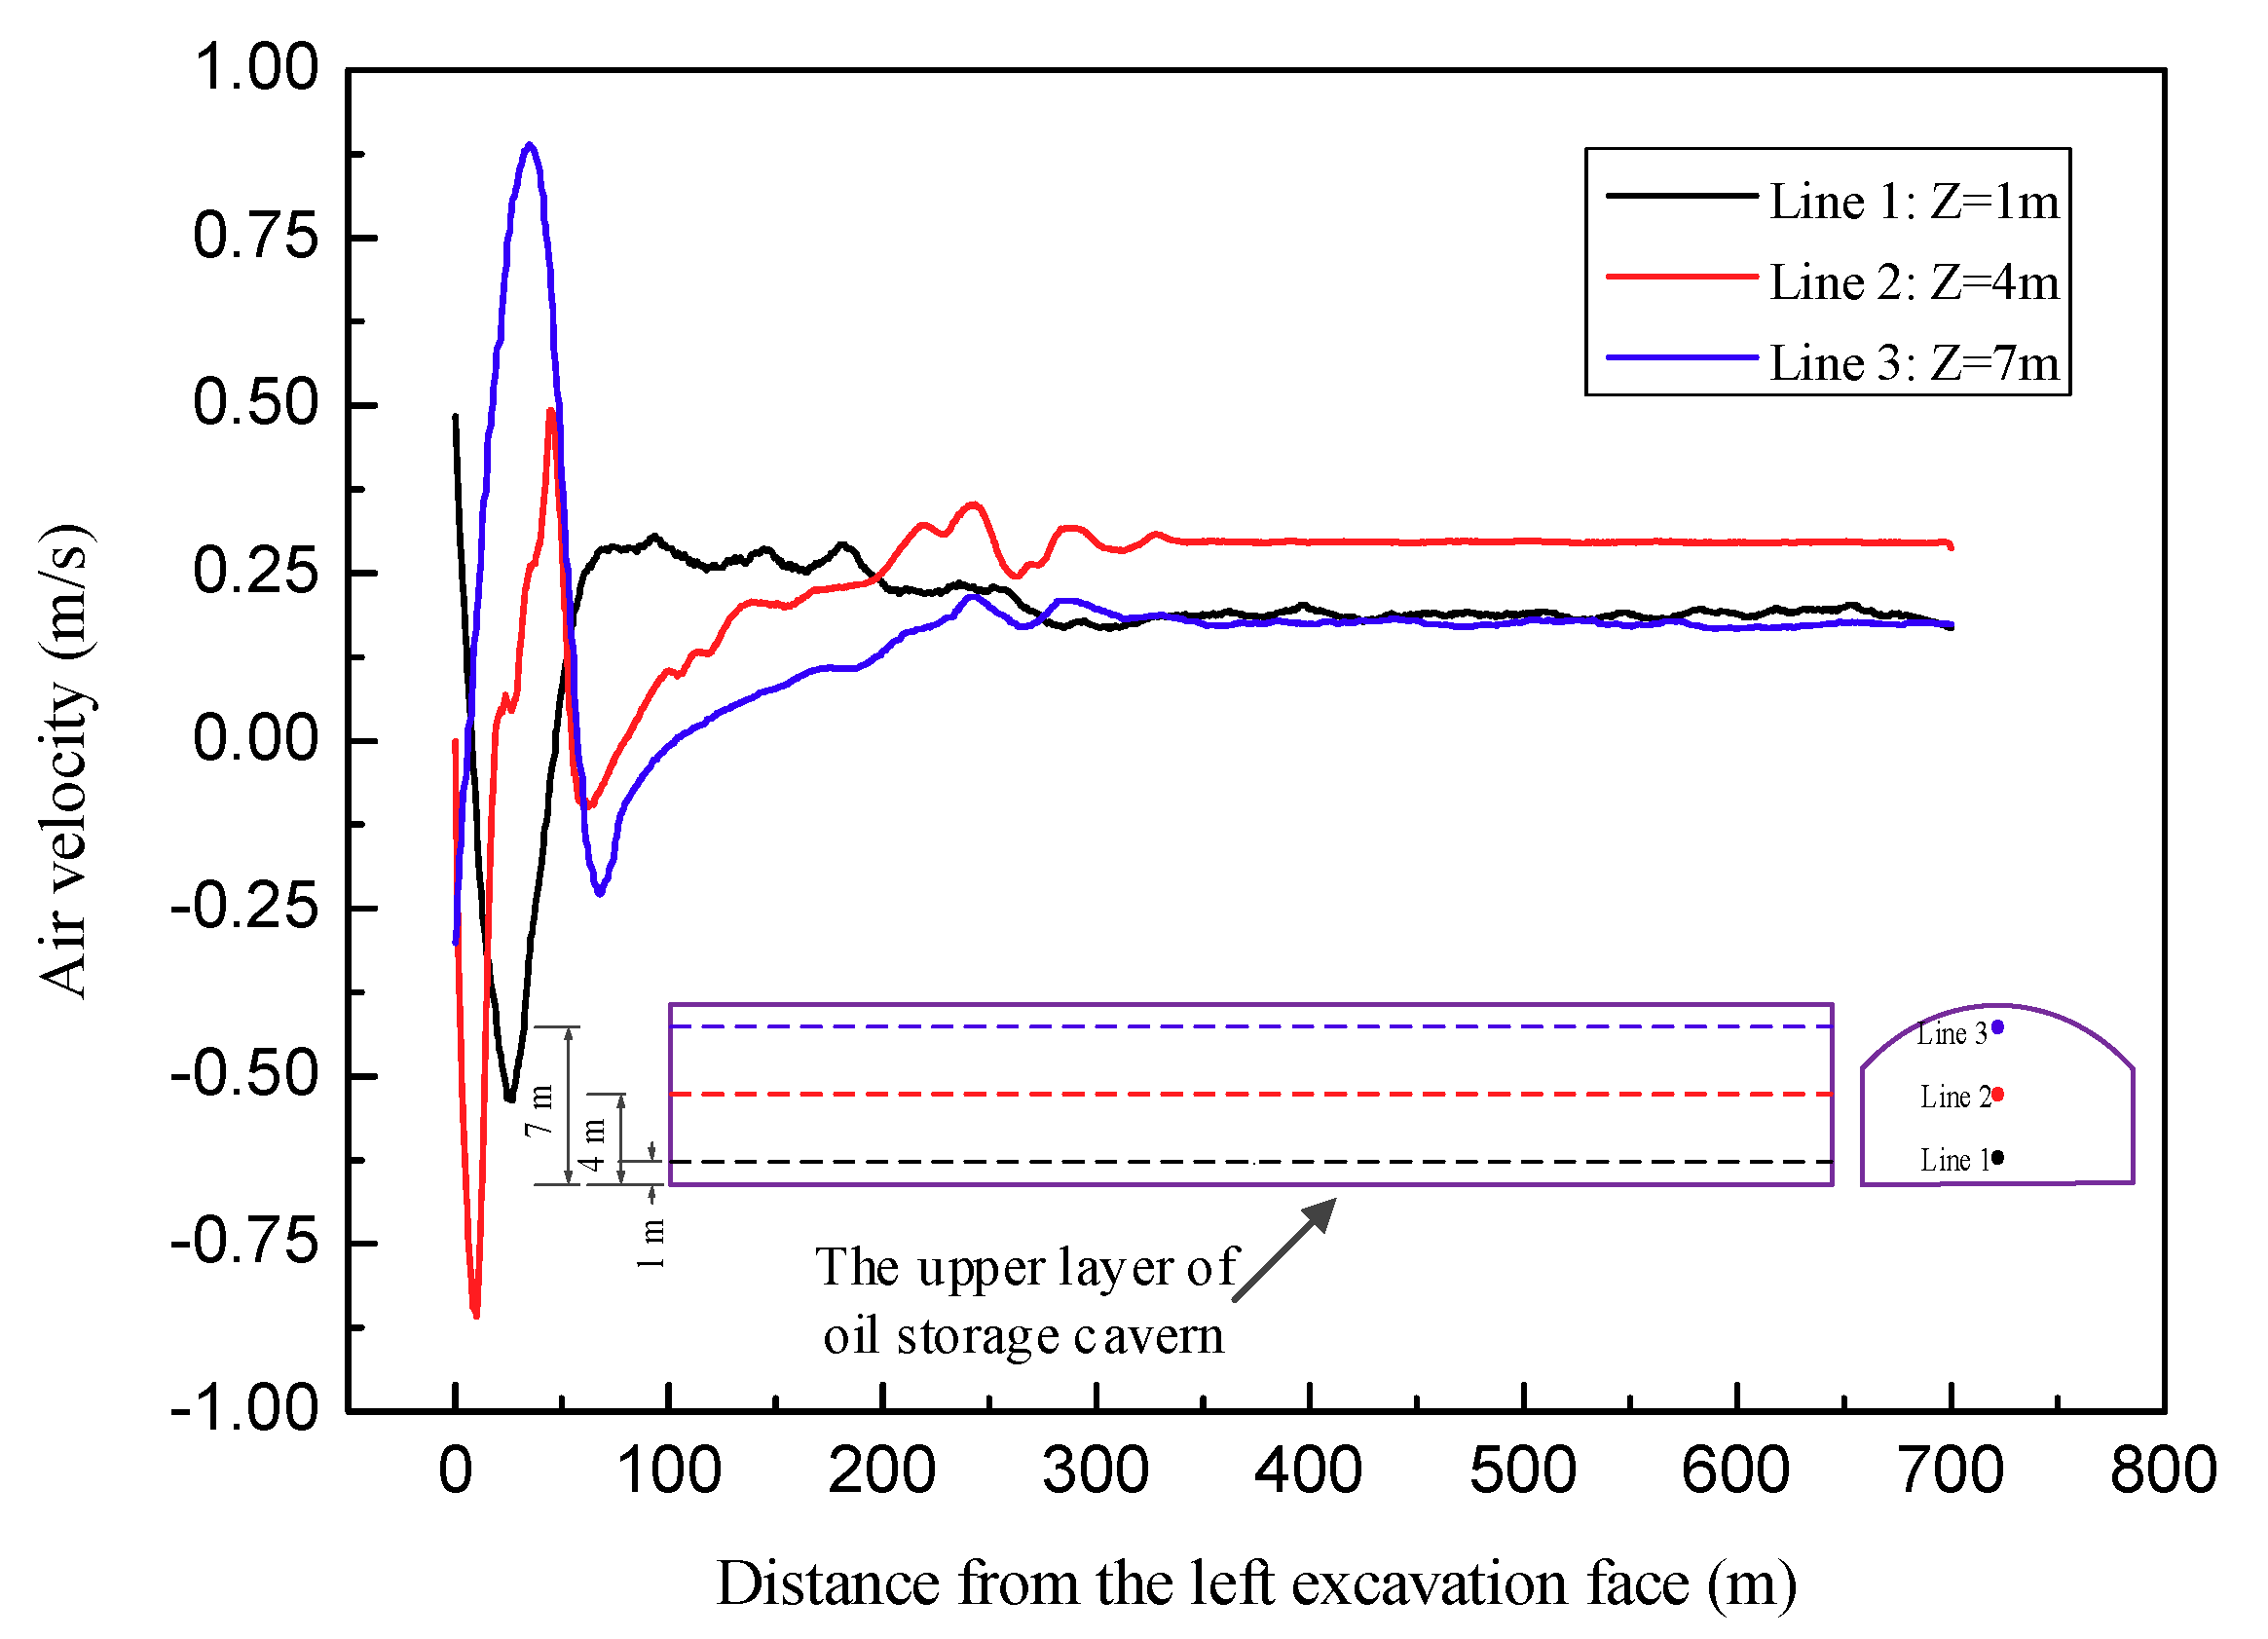
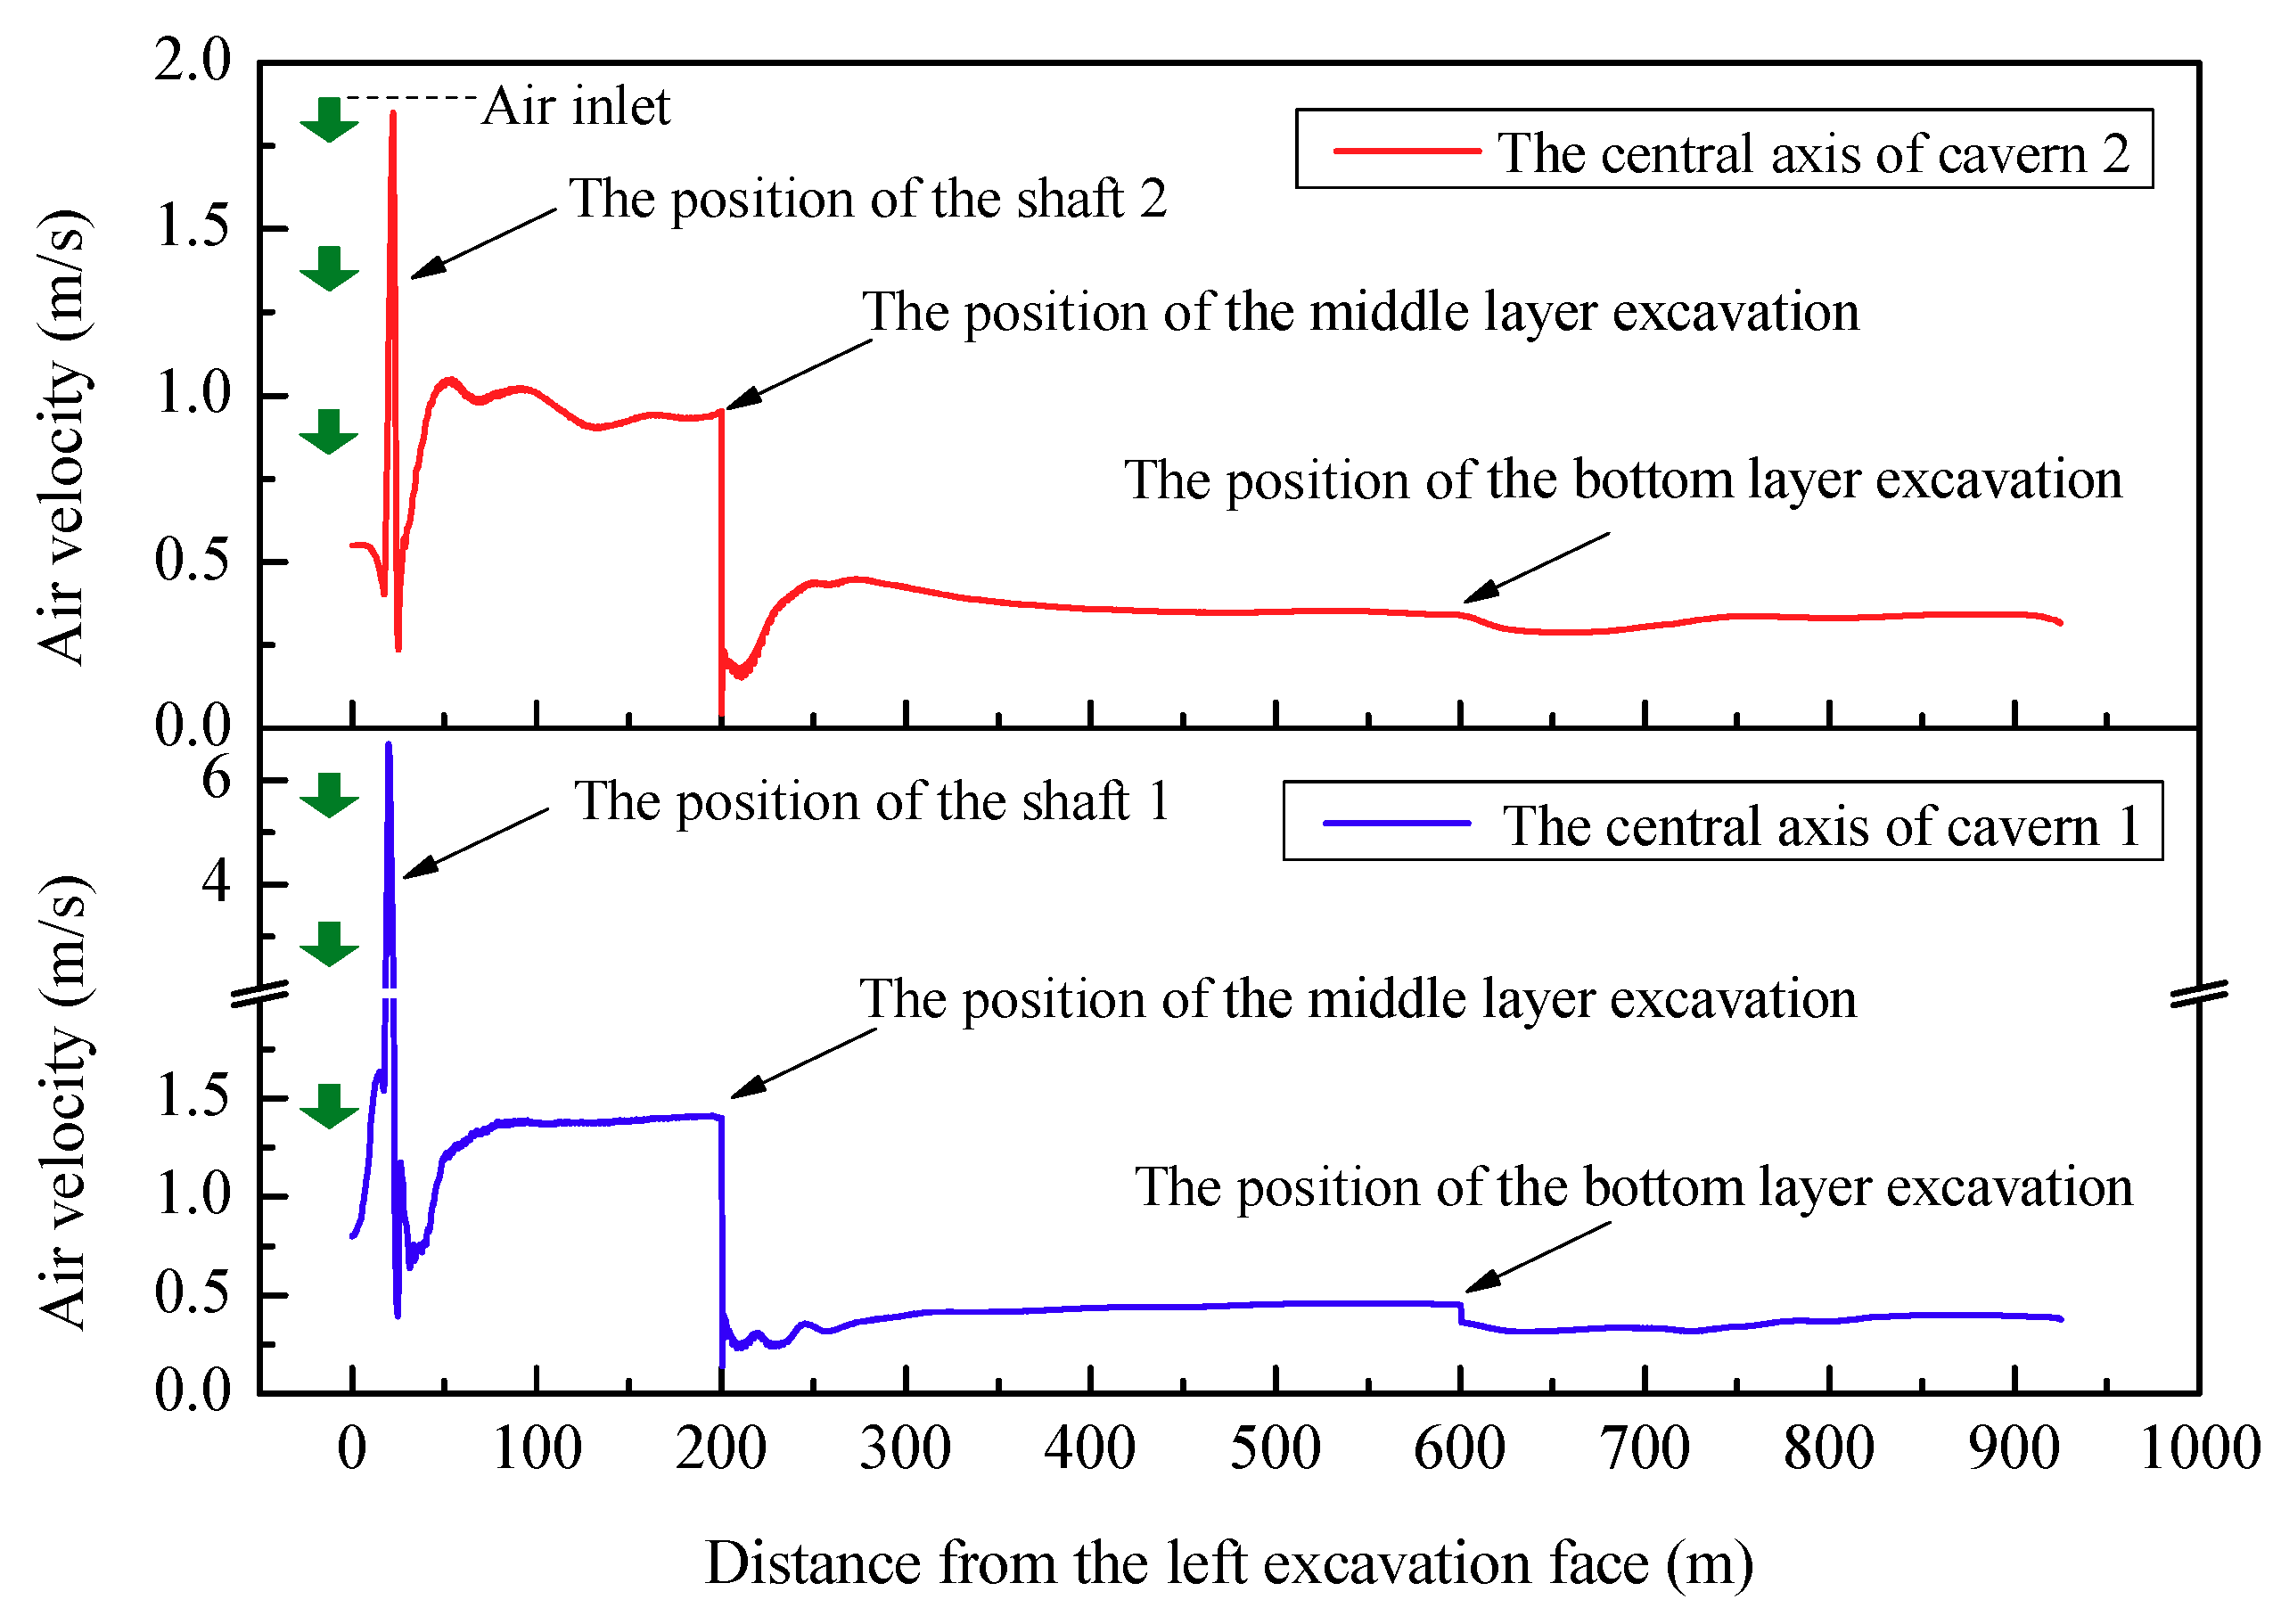
Although the type and power of the axial-flow fans arranged at the shaft inlet are the same, the difference in diameter between shaft 1 and shaft 2 will cause different air velocity in the shaft and within a certain range of the cavern. Therefore, the average air velocity on the central lines of cavern 1 and cavern 2 were monitored in the CFD simulations, and the velocity distribution in the cavern is shown in Figure 12. There is a large velocity fluctuation at the intersection of the shaft in the two caverns, and the velocity in the upper excavation area is basically stable after 50 m. The values for cavern 1 and cavern 2 are 1.4 m/s and 1.0 m/s, respectively.
The cross-section area increases from 135 m2 to 363 m2 after entering the middle layer excavation, causing a sharp drop in the air velocity. The value near the middle bench is approximate 0 m/s due to the height of the middle bench, and then it tends to be stable after about 50 m. The air velocity in the middle bench of the two caverns is not very different, about 0.4 m/s. The cross-section area further enlarges to 436 m2 after entering the bottom layer excavation and the steady air velocity of the two caverns further decreases to 0.35 m/s. Since large-scale caverns generally adopt the method of layered excavation, the air velocity presents a more obvious step-like distribution. The current “Technical Specifications for Construction of Highway Tunnel” (JTG F60-2009) [37] and “Safety Regulations for Coal Mines” [38] stipulate that the minimum air velocity in the cavern must reach 0.15 m/s. Thus, the axial-flow gallery ventilation scheme, by using shafts for the fresh air, can meet the air velocity requirements of the relevant regulations.
5.2.2. CO Concentration Field
Figure 13 displays the CO concentration distribution with time under the axial-flow gallery ventilation scheme. With an increase in ventilation time, the CO gas distributed near the middle bench moves continuously towards the connecting roadway. After 20 min of ventilation, it is transported to the vicinity of the connecting roadway and gradually discharged out of the cavern through the construction roadway. It can be seen that the overall CO concentration of the cavern has dropped below the safety standard value of 30 mg/m3 after 25 min of ventilation. The velocity of pollutant discharge in the construction roadway is greater than the main cavern due to its smaller section area and the airflow collection of four caverns, thus, the CO gas can be quickly discharged outside.
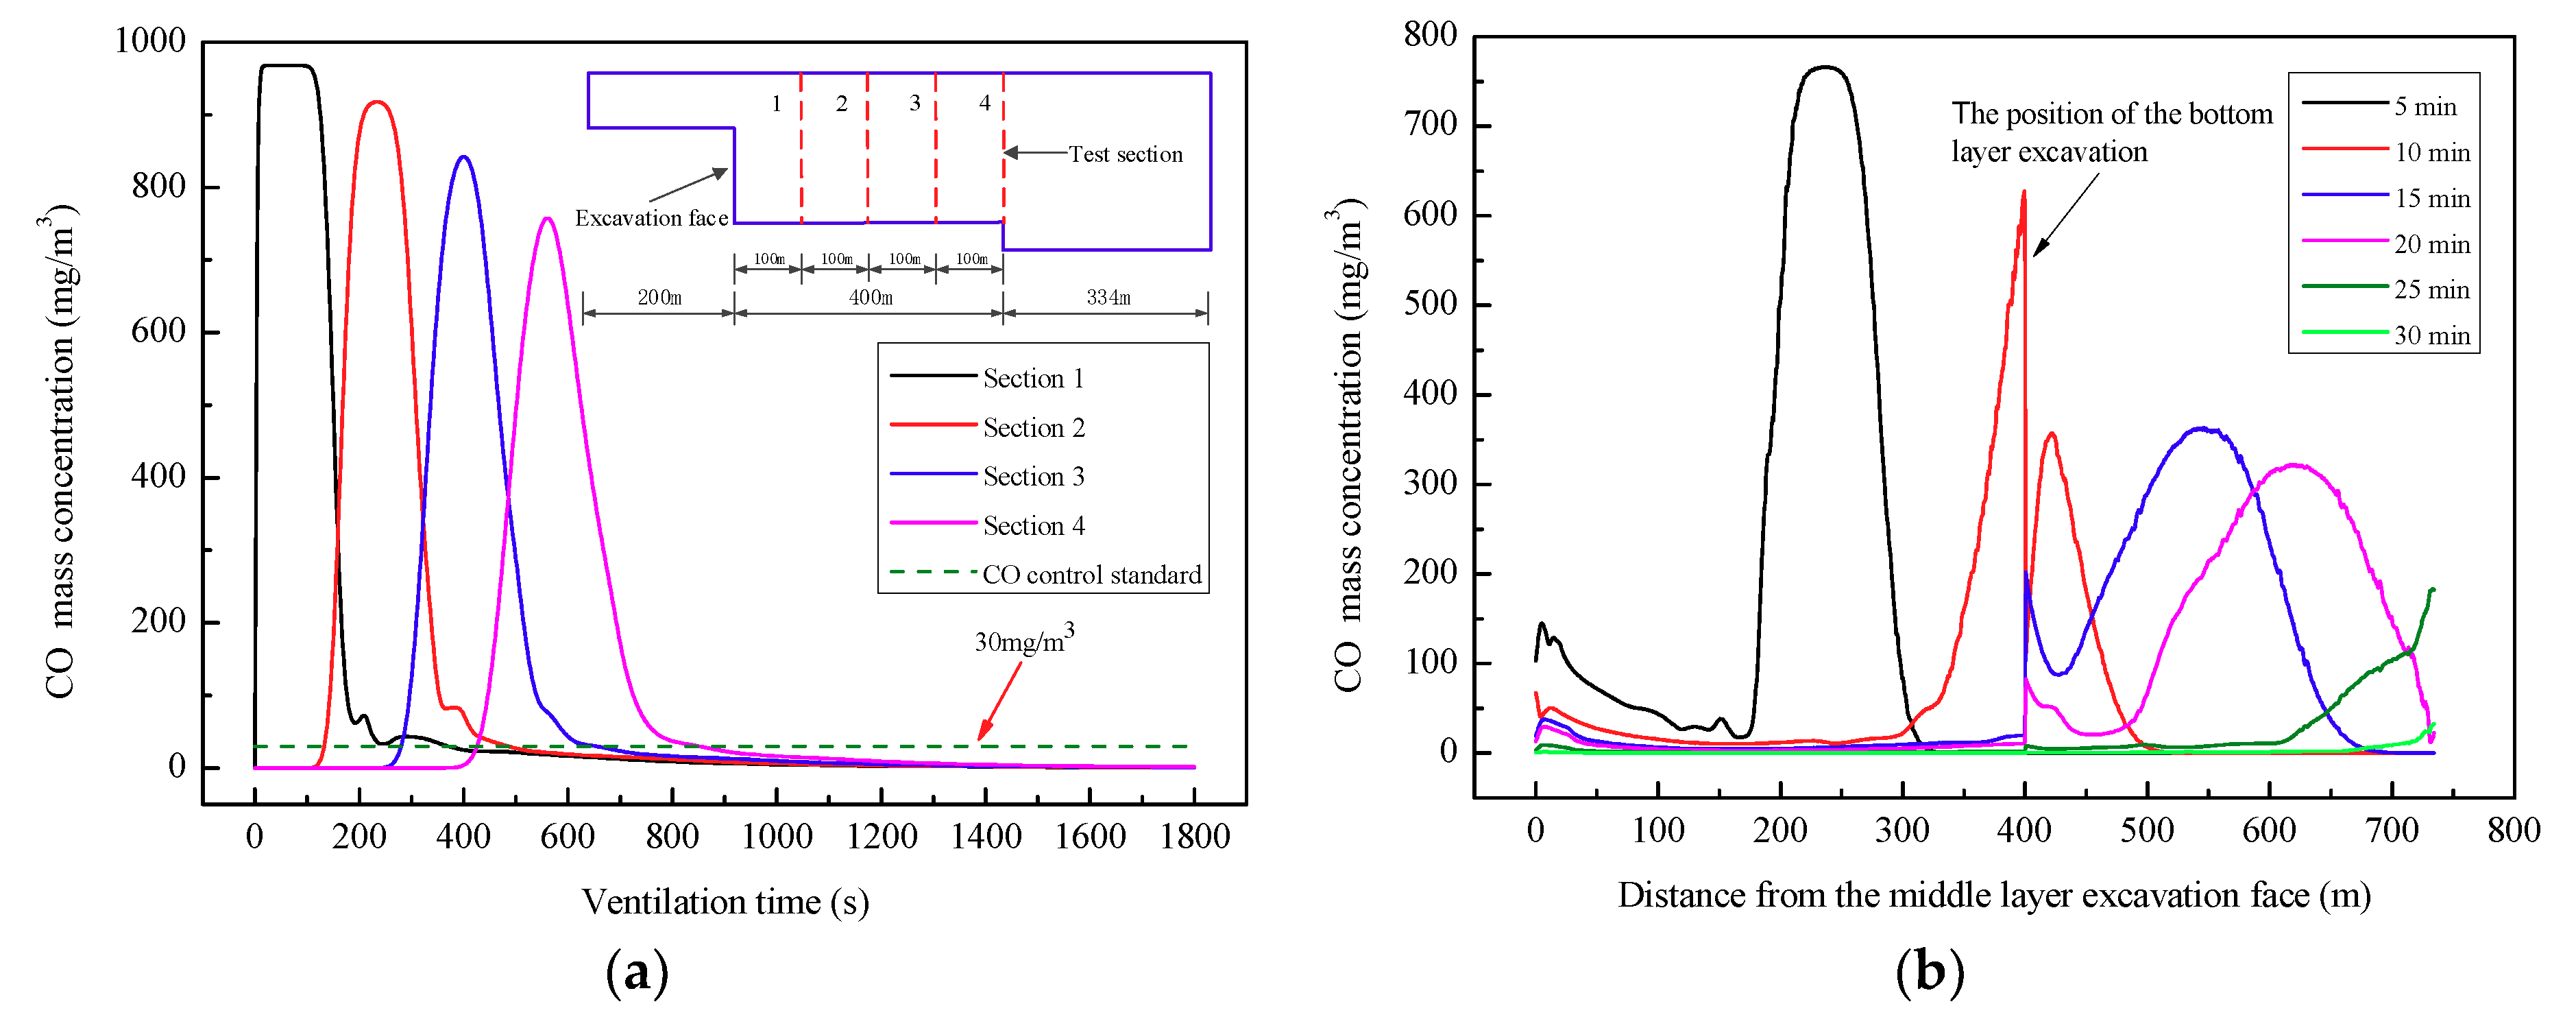
In order to inspect the variation in CO with ventilation time in the working area (about 300 m to 400 m away from the excavation face), four cross-sections with a spacing of 100 m in the middle bench were monitored in the numerical calculation, as shown in Figure 14a. The CO concentration in the working area was decreased below the safety standard value of 30 mg/m3 after 15 min of ventilation, which meets the requirements for safe and rapid construction. Figure 14b presents the CO concentration distribution at breathing height (1.6m from the ground) with ventilation time. It can be seen that the high concentration of CO in the cavern continues to migrate toward the connecting roadway with the increase of ventilation time, and the maximum CO concentration decreases gradually. The CO concentration of the whole cavern decreases below the safety standard value after 30 min of the axial-flow gallery ventilation scheme, which is much better than the effect of forced ventilation.
6. Conclusions
This paper proposed a new technology for construction ventilation in large-scale underground oil storage caverns using the shafts as the fresh air inlet. The RNG k-ε turbulence model was firstly validated with the field test values, and it was found that the simulated results agreed well with the test results. Then, the distribution of air velocity and the CO concentration in the forced ventilation scheme and axial-flow gallery ventilation scheme were investigated. The main results are as follows:
- (1)
- The construction of large underground caverns usually adopts layered excavation, and the forced ventilation method is mostly applied in the upper layer construction. Due to the restriction of the construction roadway size and the clearance requirements for transportation, the duct diameter and air volume cannot be increased Consequently, the ventilation quality cannot meet the requirements of the cavern environment. Because the ventilation distance exceeds 1500 m, the stable air velocity in the cavern is only 0.15 m/s, which is below the minimum air velocity requirement of the relevant standards. In addition, there is a very complicated eddy zone in the area of about 20 m from the heading face.
- (2)
- The axial-flow gallery ventilation scheme is carried out when the excavation of the cavern upper layer is completed and connected with the shaft. The scheme utilizes the shafts as the fresh air inlet and the construction roadway as the polluted air outlet to create the gallery ventilation. It can ensure that the direction of the airflow is the same as that of heavy trucks, fresh air is always near the excavation face, and the disturbance of the process is greatly reduced. It reduces energy consumption and has good prospects for popularization and application.
- (3)
- There is no need to set up the air duct in the axial-flow gallery ventilation scheme, which greatly facilitates the cavern construction and avoids duct damage caused by blasting. The scheme is suitable for the large-scale caverns with a ventilation distance less than 2 km, each channel is effectively used, and the intermediate construction shaft is not needed. If the ventilation distance exceeds than 2 km, it is possible to use jet fans to assist the axial flow gallery ventilation mode or to completely adopt jet-flow gallery ventilation.
- (4)
- The power of the axial fan and the jet fan should be no less than 135 kW and 75 kW, respectively. The jet fan should be arranged at the airflow steering place. The axial fan placed at the top and bottom of the shaft has little impact on the field ventilation effect, so the position can be selected independently according to the convenience of the fan installation.
Author Contributions
H.Z. analyzed of calculation results and wrote the article; J.S. carried out the numerical simulation; F.L. collected the data; S.C. offered useful suggestions for the preparation and writing the paper; and J.Y. provided the information of construction site.
Funding
This research received no external funding.
Acknowledgments
The study is supported by the National Natural Science Foundation of China (NSFC) under Grant No. 51508477 and the Fundamental Research Funds for the Central Universities (Grant No. 2682016 CX012). The authors also would like to thank the anonymous reviewers and handling editors for their constructive comments.
Conflicts of Interest
The authors declare no conflict of interest.
References
- Hong, K.R. Development and Prospects of Tunnels and Underground Works in China in Recent Two Years. Tunn. Constr. 2017, 37, 123–134. [Google Scholar] [CrossRef]
- Lin, F.; Ren, F.; Luan, H.B.; Ma, G.W.; Chen, S.G. Effectiveness Analysis of Water-sealing for Underground LPG Storage. Tunn. Undergr. Space Technol. 2016, 51, 270–290. [Google Scholar] [CrossRef]
- Wang, L.; Xie, X.P.; He, S.W.; Li, X.L. Effect Analysis on Application of Large-diameter Ducts in Ventilation of Underground Caverns. Tunn. Constr. 2008, 28, 19–21. [Google Scholar]
- Niu, X.K.; Zhang, D.L.; Su, J.; Guo, H. Parameter Optimization on the Forced Ventilation of Symmetric Tunnel Construction Based on the Super-Short Bench-Cut Method. Symmetry 2018, 10, 49. [Google Scholar] [CrossRef]
- Li, Y.L.; Yin, Q.; Mo, Z.Y.; Tang, C.Z.; Chen, X.; Yang, X.G. Optimization of Construction Ventilation Scheme for Large-scale Underground Cavern Group of Xiangjiaba Hydropower Station Based on Numerical Simulation. J. Sichuan Univ. (Eng. Sci. Ed.) 2010, 42, 1–6. [Google Scholar] [CrossRef]
- Zhang, H.; Sun, J.C.; Lin, F.; Wang, L. Optimization on Energy Saving Ventilation of Gallery-type Combined Construction Shaft Exhaust in Extra Long Tunnel. Procedia Eng. 2017, 205, 1777–1784. [Google Scholar] [CrossRef]
- Zhang, H.; Chen, S.G.; Yang, J.S. Ventilation Technology in Super Long Group Tunnelling with Trackless Transportation and No Outcrop. J. Saf. Environ. 2013, 13, 229–231. [Google Scholar] [CrossRef]
- Zhao, X.; Wang, R.K.; Zhang, W.H. Measures of Improving Ventilation Efficiency during Construction in Complex Caverns. J. Yangtze River Sci. Res. Inst. 2014, 8, 117–121. [Google Scholar] [CrossRef]
- Zhang, H.; Lin, F.; Zhang, K.; Yang, J.S.; Chen, S.G. Establishment of a Ventilation Network and the Shaft Ventilation Effect in a Large Underground Cavern Group. Mod. Tunn. Technol. 2018, 55, 203–209. [Google Scholar] [CrossRef]
- Parra, M.T.; Villafruela, J.M.; Castro, F.; Méndez, C. Numerical and Experimental Analysis of Different Ventilation Systems in Deep Mines. Build. Environ. 2006, 41, 87–93. [Google Scholar] [CrossRef]
- Fang, Y.; Fan, J.; Kenneally, B.; Mooney, M. Air Flow Behavior and Gas Dispersion in the Recirculation Ventilation System of a Twin-tunnel Construction. Tunn. Undergr. Space Technol. 2016, 58, 30–39. [Google Scholar] [CrossRef]
- Liu, Z.; Wang, X.L.; Cheng, Z.F.; Sun, R.R.; Zhang, A.L. Simulation of Construction Ventilation in Deep Diversion Tunnels Using Euler–Lagrange Method. Comput. Fluids 2014, 105, 28–38. [Google Scholar] [CrossRef]
- Kurnia, J.C.; Sasmito, A.P.; Mujumdar, A.S. Simulation of a Novel Intermittent Ventilation System for Underground Mines. Tunn. Undergr. Space Technol. 2014, 42, 206–215. [Google Scholar] [CrossRef]
- Wang, X.L.; Liu, X.P.; Sun, Y.F.; An, J.; Zhang, J.; Chen, H.C. Construction Schedule Simulation of a Diversion Tunnel Based on the Optimized Ventilation Time. J. Hazard. Mater. 2009, 165, 933–943. [Google Scholar] [CrossRef] [PubMed]
- Torno, S.; Toraño, J.; Ulecia, M.; Allende, C. Conventional and Numerical Models of Blasting Gas Behaviour in Auxiliary Ventilation of Mining Headings. Tunn. Undergr. Space Technol. 2013, 34, 73–81. [Google Scholar] [CrossRef]
- Shao, S.; Yang, X.G.; Zhou, J.W. Numerical Analysis of Different Ventilation Schemes During the Construction Process of Inclined Tunnel Groups at the Changheba Hydropower Station, China. Tunn. Undergr. Space Technol. 2016, 59, 157–169. [Google Scholar] [CrossRef]
- Xia, Y.M.; Yang, D.; Hu, C.H.; Wu, C.Z.; Han, J.L. Numerical Simulation of Ventilation and Dust Suppression System for Open-type TBM Tunneling Work Area. Tunn. Undergr. Space Technol. 2016, 56, 70–78. [Google Scholar] [CrossRef]
- Nan, C.Z.; Ma, J.M.; Luo, Z.; Zheng, S.L.; Wang, Z.W. Numerical Study on the Mean Velocity Distribution Law of Air Backflow and the Effective Interaction Length of Airflow in Forced Ventilated Tunnels. Tunn. Undergr. Space Technol. 2015, 46, 104–110. [Google Scholar] [CrossRef]
- Hargreaves, D.M.; Lowndes, I.S. The Computational Modeling of the Ventilation Flows within a Rapid Development Drivage. Tunn. Undergr. Space Technol. 2007, 22, 150–160. [Google Scholar] [CrossRef]
- Klemens, R.; Kosinski, P.; Wolanski, P.; Korobeinikov, V.P.; Markov, V.V.; Menshov, I.S.; Semenov, I.V. Numerical Study of Dust Lifting in a Channel with Vertical Obstacles. J. Loss Prev. Process Ind. 2001, 14, 469–473. [Google Scholar] [CrossRef]
- Toraño, J.; Torno, S.; Menéndez, M.; Gent, M. Auxiliary Ventilation in Mining Roadways Driven with Road Headers: Validated CFD modelling of dust behavior. Tunn. Undergr. Space Technol. 2011, 26, 201–210. [Google Scholar] [CrossRef]
- Diego, I.; Torno, S.; Toraño, J.; Menéndez, M.; Gent, M. A Practical Use of CFD for Ventilation of Underground Works. Tunn. Undergr. Space Technol. 2011, 26, 189–200. [Google Scholar] [CrossRef]
- ANSYS ICEM CFD 17.0. User Manual, Hexa; ANSYS, Inc.: Canonsburg, PA, USA, 2016; pp. 37–47. [Google Scholar]
- Yang, L.X.; Hong, K.R.; Liu, Z.W.; Luo, Z.F. Modern Tunneling Ventilation Technology, 1st ed.; China Communications Press: Beijing, China, 2012; pp. 201–205. ISBN 978-7-114-09621-1. [Google Scholar]
- Launder, B.E.; Spalding, D.B. The Numerical Computation of Turbulent Flows. Comput. Methods Appl. Mech. Eng. 1974, 3, 269–289. [Google Scholar] [CrossRef]
- Zhang, Z.Q.; Zhang, H.; Tan, Y.J.; Yang, H.Y. Natural wind utilization in the vertical shaft of a super-long highway tunnel and its energy saving effect. Build. Environ. 2018, 145, 140–152. [Google Scholar] [CrossRef]
- Wang, F.; Wang, M.N.; He, S.; Deng, Y.Y. Computational Study of Effects of Traffic Force on the Ventilation in Highway Curved Tunnels. Tunn. Undergr. Space Technol. 2011, 26, 481–489. [Google Scholar] [CrossRef]
- Wang, F.; Wang, M.N.; He, S.; Zhang, J.S.; Deng, Y.Y. Computational Study of Effects of Jet Fans on the Ventilation of a Highway Curved Tunnel. Tunn. Undergr. Space Technol. 2010, 25, 382–390. [Google Scholar] [CrossRef]
- Liu, Y.C.; Wang, S.C.; Deng, Y.B.; Ma, W.W.; Ma, Y. Numerical simulation and experimental study on ventilation system for powerhouses of deep underground hydropower stations. Appl. Therm. Eng. 2016, 105, 151–158. [Google Scholar] [CrossRef]
- Zhang, H.; Fang, L.; Sun, J.C.; Zhou, Z.L. CFD Analysis of Tunnel Construction Ventilation Effect Based on Typical Wall Roughness Model. China Railw. Sci. 2016, 37, 58–65. [Google Scholar] [CrossRef]
- Wu, Z.L. Ventilation in Heading Face after Blasting, 1st ed.; Metallurgical Industry Press: Beijing, China, 1959; pp. 1–3. [Google Scholar]
- Issa, R. Solution of Implicitly Discretized Fluid Flow Equations by Operator Splitting. J. Comput. Phys. 1986, 62, 40–65. [Google Scholar] [CrossRef]
- Mukhtar, A.; Ng, K.C.; Yusoff, M.Z. Design Optimization for Ventilation Shafts of Naturally-Ventilated Underground Shelters for Improvement of Ventilation Rate and Thermal Comfort. Renew. Energy 2018, 115, 183–198. [Google Scholar] [CrossRef]
- Fluent Inc. Fluent 6.3 User’s Guide; Fluent Inc.: Lebanon, NH, USA, 2006. [Google Scholar]
- Wang, M.; Wu, C.; Wang, C.L. Digital Simulation of Smoke-fume Discharge from Large-scale Underground Chambers under the Construction and the Calculation Method of the Air Volume Needed. J. Saf. Environ. 2014, 14, 209–213. [Google Scholar] [CrossRef]
- Safety Operation Regulations for Tunnel Drilling and Blasting. Available online: http://www.safehoo.com/Rules/Traffic/201011/155705.shtml (accessed on 1 November 2010).
- Ministry of Communications of PRC. Technical Specifications for Construction of Highway Tunnel (JTG F60-2009); China Communications Press: Beijing, China, 2009. [Google Scholar]
- State Administration of Work Safety of PRC. Safety Regulations for Coal Mines; China Coal Industry Publishing House: Beijing, China, 2016. [Google Scholar]
Figure 1.
(a) Three-dimensional layout of underground structures; (b) The profile of oil storage caverns; (c) The shape and size of each cavern section.
Figure 1.
(a) Three-dimensional layout of underground structures; (b) The profile of oil storage caverns; (c) The shape and size of each cavern section.
Figure 2.
(a) The plan for the forced ventilation scheme; (b) The plan for axial-flow gallery ventilation scheme; (c) The profile of the axial-flow gallery ventilation scheme.
Figure 2.
(a) The plan for the forced ventilation scheme; (b) The plan for axial-flow gallery ventilation scheme; (c) The profile of the axial-flow gallery ventilation scheme.
Figure 3.
Layout of test points in each section: (a) Section of the upper layer; (b) Section of the middle layer; (c) Full section of the cavern; (d) Construction roadway.
Figure 3.
Layout of test points in each section: (a) Section of the upper layer; (b) Section of the middle layer; (c) Full section of the cavern; (d) Construction roadway.
Figure 4.
Field test of ventilation environment in the caverns: (a) Test of air velocity; (b) Test of dust; (c) Air quality after ventilation.
Figure 4.
Field test of ventilation environment in the caverns: (a) Test of air velocity; (b) Test of dust; (c) Air quality after ventilation.
Figure 5.
Three-dimensional geometrical model: (a) Forced ventilation scheme; (b) Axial-flow gallery ventilation scheme.
Figure 5.
Three-dimensional geometrical model: (a) Forced ventilation scheme; (b) Axial-flow gallery ventilation scheme.
Figure 6.
Local grids. (a) Forced ventilation scheme; (b) Axial-flow gallery ventilation scheme.
Figure 7.
The comparison between the simulated result and field test: (a) Air velocity in the main cavern and construction roadway; and (b) The change of CO concentration with time.
Figure 7.
The comparison between the simulated result and field test: (a) Air velocity in the main cavern and construction roadway; and (b) The change of CO concentration with time.
Figure 8.
Distribution of airflow field near the working face: (a) Velocity vector at z = 5.5 m; (b) Velocity vector at y = 18 m.
Figure 8.
Distribution of airflow field near the working face: (a) Velocity vector at z = 5.5 m; (b) Velocity vector at y = 18 m.
Figure 9.
Air velocity distribution along the cavern.
Figure 10.
CO mass concentration distribution in the central axial plane. (a) Ventilation for 5 min; (b) Ventilation for 10 min; (c) Ventilation for 15 min; (d) Ventilation for 20 min; (e) Ventilation for 25 min; (f) Ventilation for 30 min.
Figure 10.
CO mass concentration distribution in the central axial plane. (a) Ventilation for 5 min; (b) Ventilation for 10 min; (c) Ventilation for 15 min; (d) Ventilation for 20 min; (e) Ventilation for 25 min; (f) Ventilation for 30 min.
Figure 11.
CO mass concentration distribution at breathing height.
Figure 12.
Air velocity distribution in the central axis of the caverns.
Figure 13.
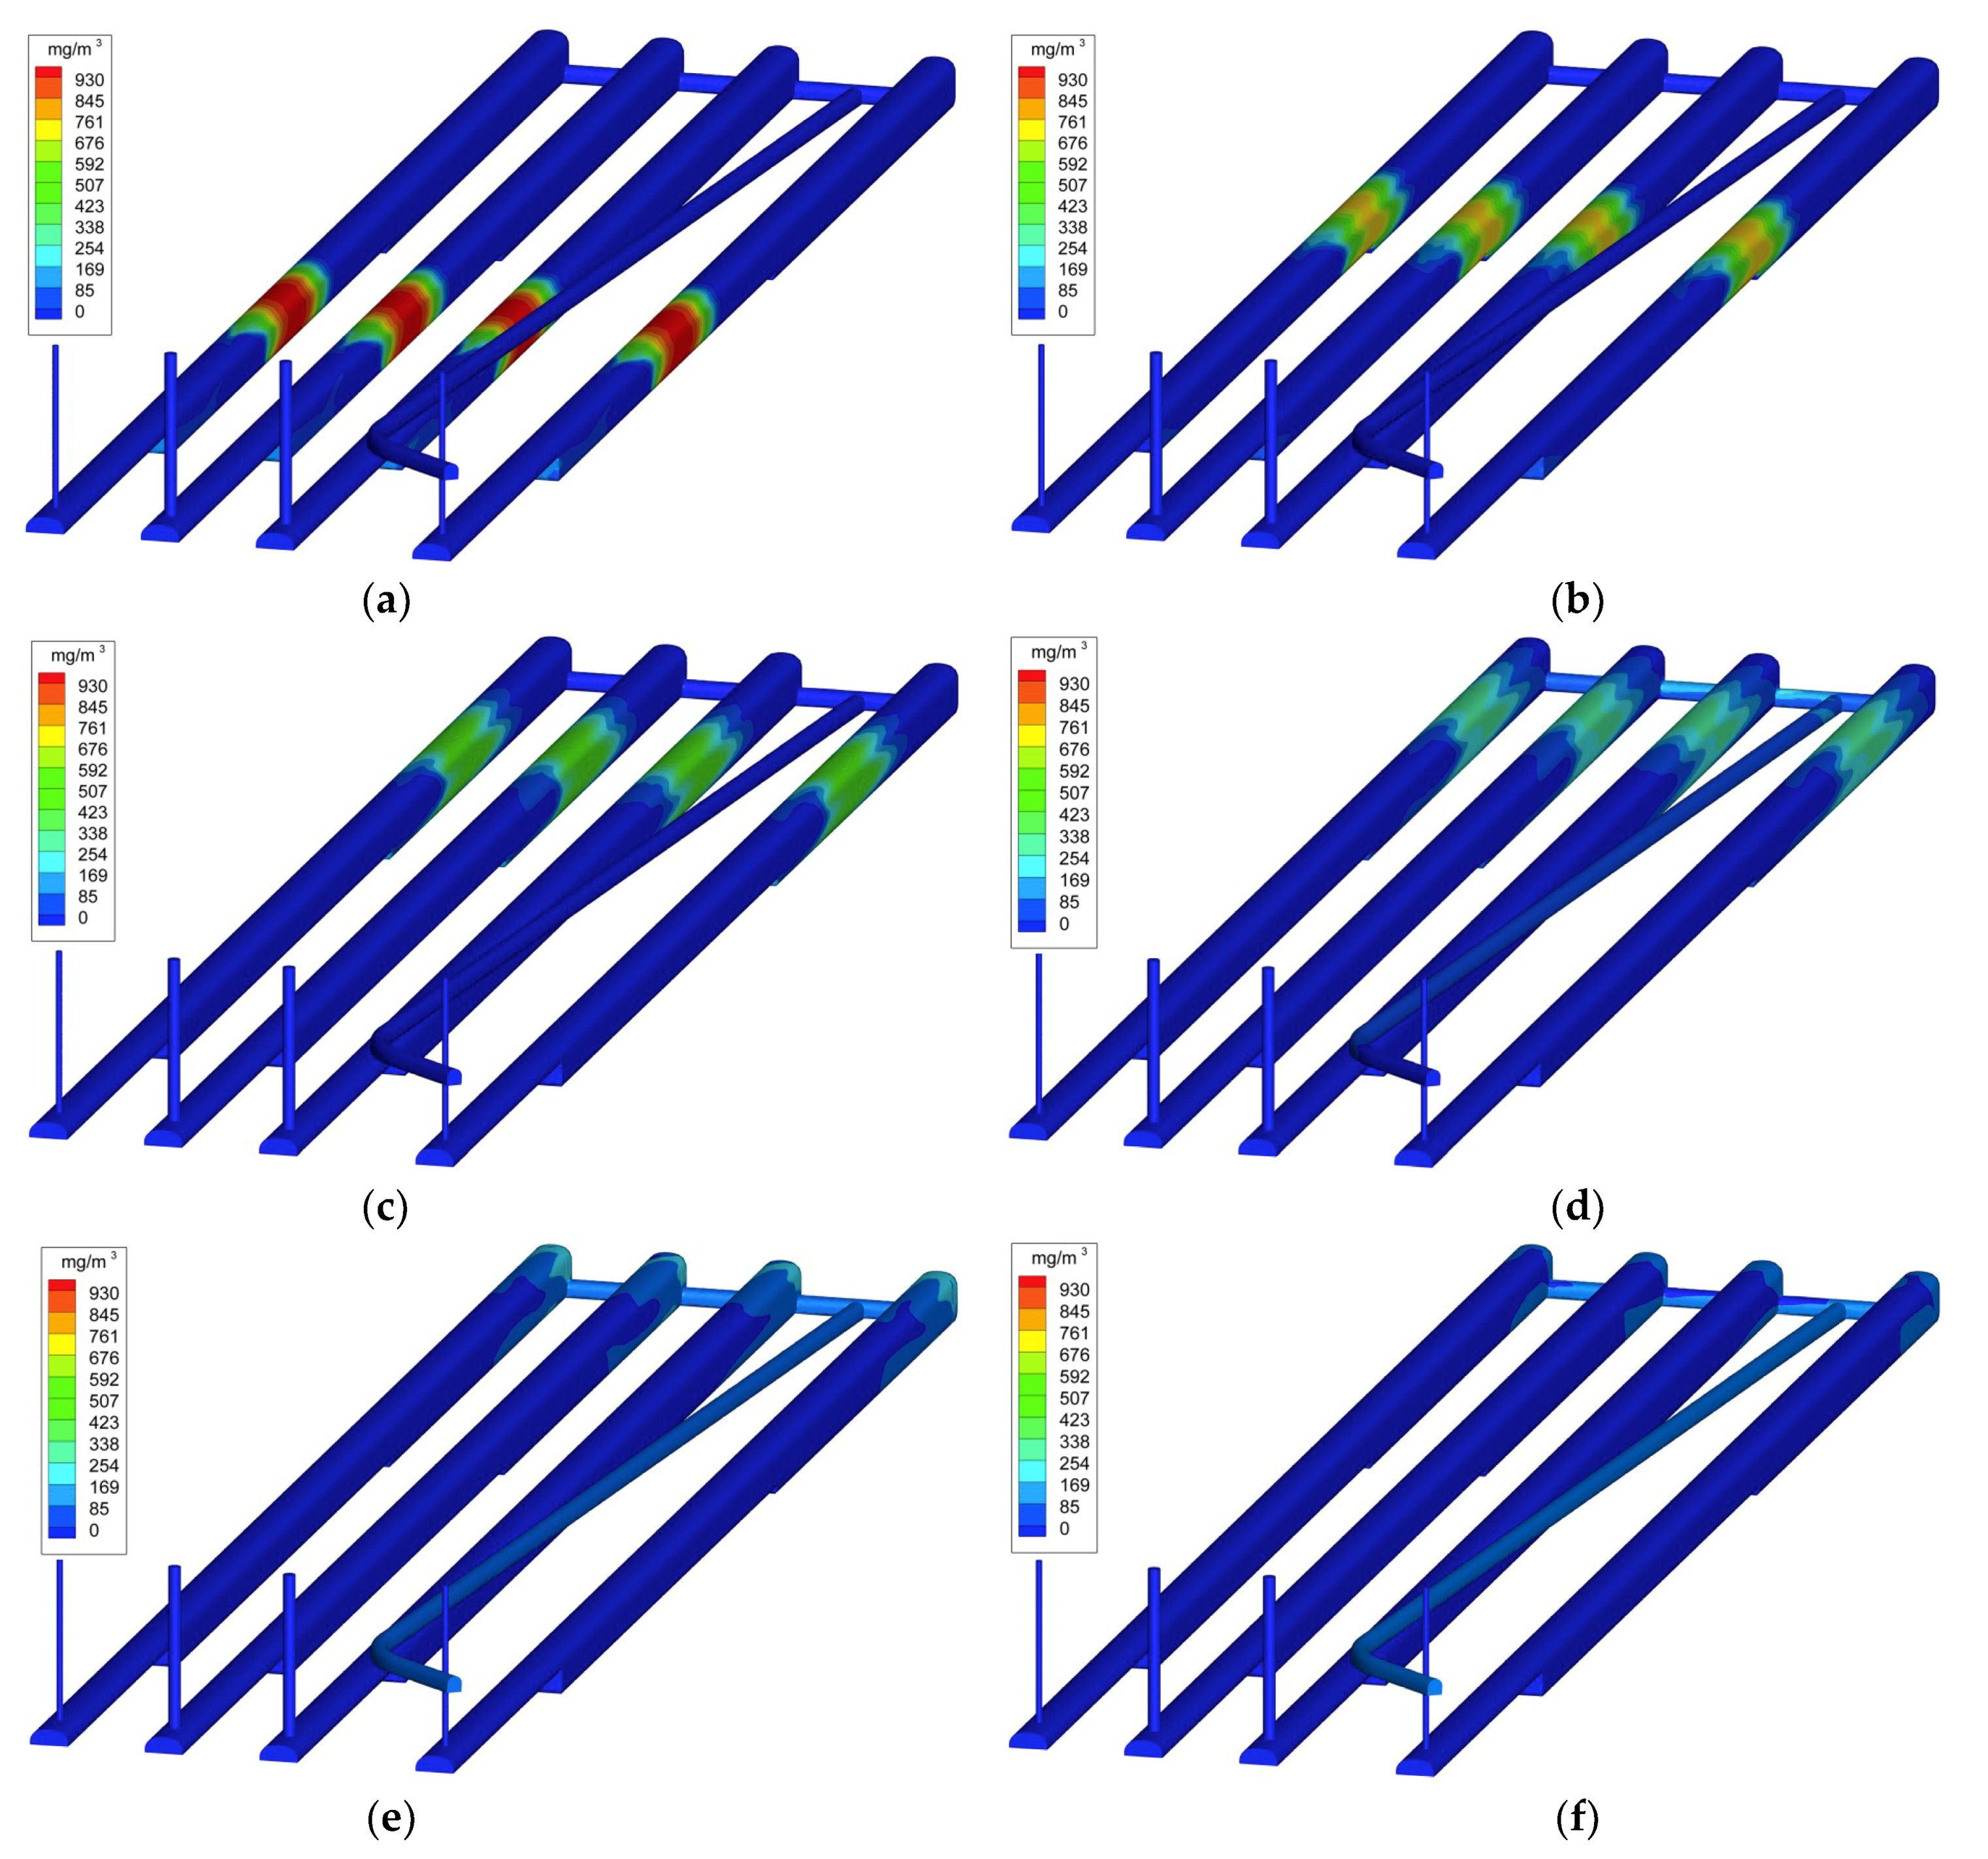
CO concentration distribution with time in caverns under the optimized ventilation scheme: (a) Ventilation for 5 min; (b) Ventilation for 10 min; (c) Ventilation for 15 min; (d) Ventilation for 20 min; (e) Ventilation for 25 min; (f) Ventilation for 30 min.
Figure 13.
CO concentration distribution with time in caverns under the optimized ventilation scheme: (a) Ventilation for 5 min; (b) Ventilation for 10 min; (c) Ventilation for 15 min; (d) Ventilation for 20 min; (e) Ventilation for 25 min; (f) Ventilation for 30 min.
Figure 14.
(a) CO concentration in monitoring section with ventilation time; (b) CO concentration distribution at the breathing height.
Figure 14.
(a) CO concentration in monitoring section with ventilation time; (b) CO concentration distribution at the breathing height.


Table 1.
Test content and related parameters.
| Test Content | Test Instrument | Test Resolution | Control Value |
|---|---|---|---|
| Air velocity | Hot wire anemometer | 0.01 m/s | / |
| CO | M4 gas detector | 0.1 ppm | ≤30 mg/m3 |
| SO2 | M4 gas detector | 0.1 ppm | ≤14.3 mg/m3 |
| H2S | M4 gas detector | 0.1 ppm | ≤10 mg/m3 |
| Above 10% free SiO2 dust | CCZ-1000 direct-reading dust detector | 0.1 mg/m3 | ≤2 mg/m3 |
| Below 10% free SiO2 dust | CCZ-1000 direct-reading dust detector | 0.1 mg/m3 | ≤4 mg/m3 |
Table 2.
The initial concentration of CO after cavern blasting.
| Section | A (m2) | G (kg) | LOT (m) | The Amount of CO (m3) | C0 (mg/m3) |
|---|---|---|---|---|---|
| Upper layer | 135.1 | 320 | 79 | 12.8 | 1499.1 |
| Middle layer | 228 | 420 | 99 | 16.8 | 930.4 |
© 2018 by the authors. Licensee MDPI, Basel, Switzerland. This article is an open access article distributed under the terms and conditions of the Creative Commons Attribution (CC BY) license (http://creativecommons.org/licenses/by/4.0/).
Share and Cite
MDPI and ACS Style
Zhang, H.; Sun, J.; Lin, F.; Chen, S.; Yang, J. Optimization Scheme for Construction Ventilation in Large-Scale Underground Oil Storage Caverns. Appl. Sci. 2018, 8, 1952. https://doi.org/10.3390/app8101952
AMA Style
Zhang H, Sun J, Lin F, Chen S, Yang J. Optimization Scheme for Construction Ventilation in Large-Scale Underground Oil Storage Caverns. Applied Sciences. 2018; 8(10):1952. https://doi.org/10.3390/app8101952
Chicago/Turabian StyleZhang, Heng, Jianchun Sun, Fang Lin, Shougen Chen, and Jiasong Yang. 2018. "Optimization Scheme for Construction Ventilation in Large-Scale Underground Oil Storage Caverns" Applied Sciences 8, no. 10: 1952. https://doi.org/10.3390/app8101952
Note that from the first issue of 2016, this journal uses article numbers instead of page numbers. See further details here.