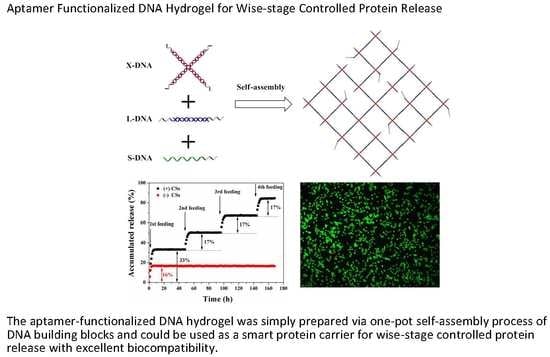
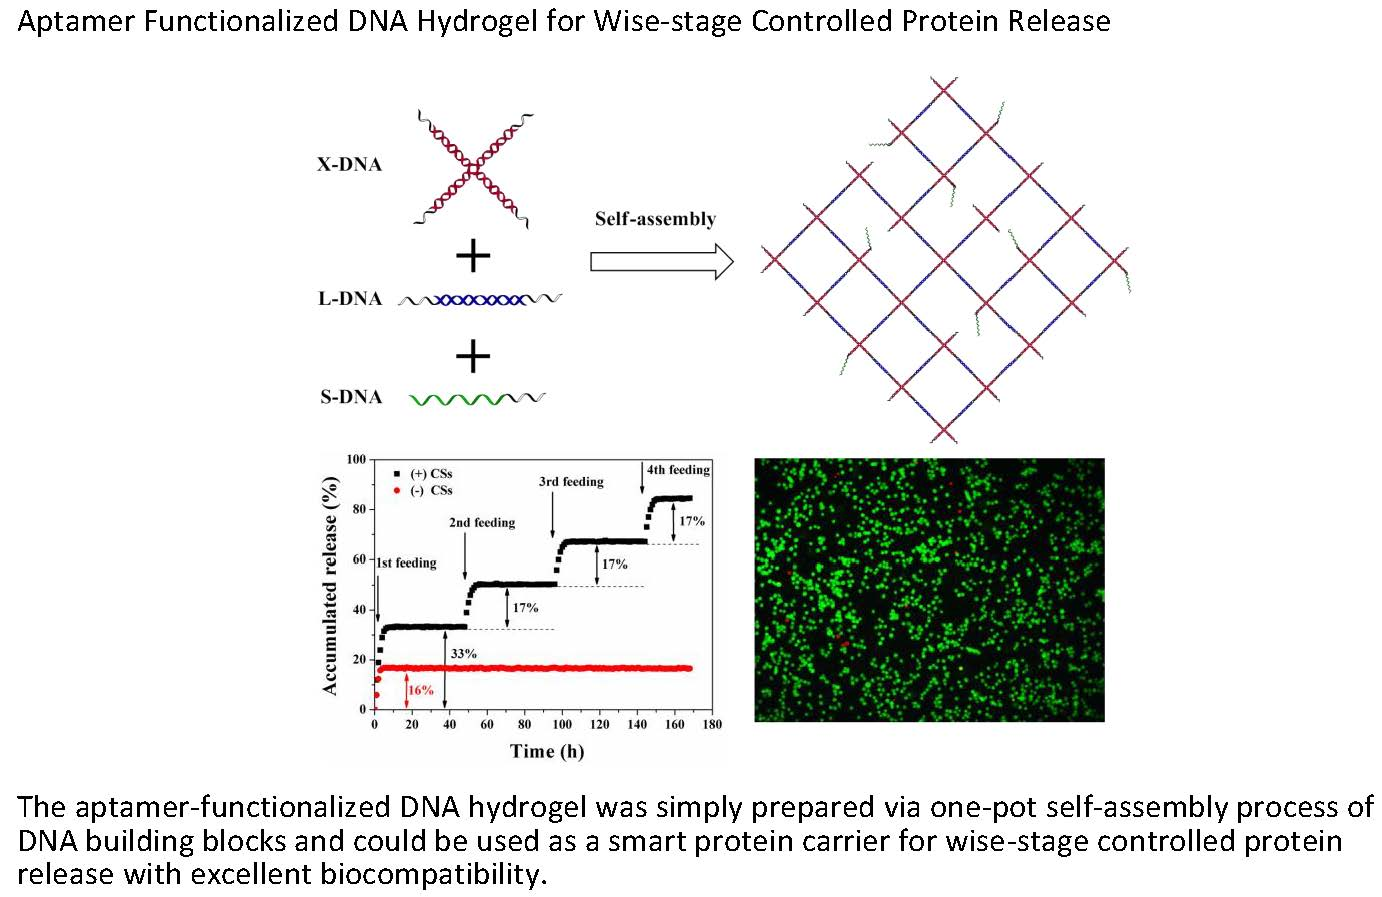
Aptamer Functionalized DNA Hydrogel for Wise-Stage Controlled Protein Release

State Key Laboratory of Marine Resource Utilization in South China Sea, College of materials and chemical engineering, Hainan University, Haikou 570228, China
*
Author to whom correspondence should be addressed.
†
C.L. and J.H. contributed equally to this paper.
Appl. Sci. 2018, 8(10), 1941; https://doi.org/10.3390/app8101941
Submission received: 30 August 2018
/
Revised: 1 October 2018
/
Accepted: 10 October 2018
/
Published: 16 October 2018
(This article belongs to the Special Issue Nanocomposite Hydrogels for Biomedical Applications)
Abstract
:Featured Application
The aptamer-functionalized DNA hydrogel will be a good candidate for controlled protein delivery.
Abstract
With the simple functionalization method and good biocompatibility, an aptamer-integrated DNA hydrogel is used as the protein delivery system with an adjustable release rate and time by using complementary sequences (CSs) as the biomolecular trigger. The aptamer-functionalized DNA hydrogel was prepared via a one-pot self-assembly process from two kinds of DNA building blocks (X-shaped and L-shaped DNA units) and a single-stranded aptamer. The gelling process was achieved under physiological conditions within one minute. In the absence of the triggering CSs, the aptamer grafted in the hydrogel exhibited a stable state for protein-specific capture. While hybridizing with the triggering CSs, the aptamer is turned into a double-stranded structure, resulting in the fast dissociation of protein with a wise-stage controlled release program. Further, the DNA hydrogel with excellent cytocompatibility has been successfully applied to human serum, forming a complex matrix. The whole process of protein capture and release were biocompatible and could not refer to any adverse factor of the protein or cells. Thus, the aptamer-functionalized DNA hydrogel will be a good candidate for controlled protein delivery.
1. Introduction
Protein drugs with uncontrolled dosage can usually cause severe side effects such as the incidence of complications in normal tissues and organs, despite their outstanding treating function in different types of human diseases [1]. To date, the localized and controlled release of protein drugs has been achieved in many research studies. In the drug and gene release systems, hydrogels were widely used as stimuli-responsive materials because of their responsiveness to external stimuli such as light, temperature, pH, metal ions, or other molecules [2,3,4,5]. However, the big obstacle of hydrogel as a drug release carrier is the fast and burst release of drugs due to its high permeability, which would give rise to adverse influence in vivo [6].
Therefore, hydrogel functionalization has been extensively studied to improve the effectiveness of its sustained release. The incorporation of different affinity ligands such as metal ion chelating ligands [7], heparin or heparan sulfate [8,9,10], and streptavidin or biotin [11] into hydrogels have been widely used to improve the affinity of hydrogels with protein drugs and overcome burst release. For instance, Sakiyama–Elbert et al. have designed a heparin-based system to immobilize neurotrophin-3 in the fibrin gel by non-covalent interaction to rein in the diffusion-based release of neurotrophin-3 [9]. In addition, the combination of DNA with some nanostructures has also been getting a lot of attention [12,13,14,15,16,17,18]. Although those molecules can be used as a connector for many biologics, many problems still exist, such as low specificity, low affinity, and high toxicity. In recent decades, oligonucleotide aptamers, which are selected from DNA/RNA libraries by Systematic Evolution of Ligands by Exponential Enrichment (SELEX), have been proven to have the capacity to recognize any class of target molecules with high affinity and specificity [19]. Moreover, unlike other affinity ligands, aptamer can be hybridized with complementary sequences (CSs). Therefore, the reasonable design of CSs can adjust aptamer’s binding function, and induce the rapid dissociation of protein–aptamer complexes [20,21,22,23].
Hence, aptamers were usually incorporated into hydrogels as affinity ligands to expand the application of hydrogels in the field of controlled drug delivery [24,25,26]. For instance, a sustained- release polyacrylamide (PAA) hydrogel system was achieved through using platelet-derived growth factor–BB aptamer to reserve the protein drugs [20]. As reported in recent literatures, most aptamers were usually functionalized into synthetic polymeric hydrogels such as PAA or polyethylene glycol methacrylate (PEGMA) by radical polymerization [24,27,28,29]. The strict demands of the modified process for aptamer−polymer hybrids and the toxicity of all kinds of initiators limit their application in vivo in the biomedical fields. For instance, a hydrogel system that can release proteins via sequential photoreaction and hybridization in a self-programming manner has been reported recently [30]. This hydrogel system may be tuned to control the release of other fragile bioactive substances such as vaccines, viruses, or cells. However, the complicated and tedious synthesis steps of a photolabile linker, photoresponsive DNA, and hydrogel limit their application. In our previous work, in order to simplify the modification steps and control the spatial distribution of aptamers in hydrogel, an anti-thrombin aptamer was functionalized into polyethylene glycol (PEG) hydrogel via UV light-induced thiol–ene click chemistry [31], but the UV light may potential damage the cells or tissues.
In this work, we designed an aptamer-functionalized DNA hydrogel as the controlled protein release carrier to solve the above problems. The three-dimensional DNA hydrogels were cross-linked by the one-pot self-assembly of two kinds of DNA building blocks (X-shaped and L-shaped DNA units) and a single-stranded DNA aptamer (S-DNA) via the hybridization of the respective “sticky ends”. These pure DNA hydrogels were biocompatible, biodegradable, and easily fabricated via an efficient Watson–Crick base pairing reaction [32,33,34,35]. The highlights of this work are that the gelation process can be completed rapidly and accurately under physiological conditions, and the encapsulation can be achieved in situ drugs; even living cells can be encapsulated in the gel. We expected that this aptamer-functionalized DNA hydrogel could be used as a good controlled protein release carrier, even in the presence of encapsulated live cells.
2. Materials and Methods
2.1. Materials
GoldView I nucleic acid dye was obtained from the Solarbio Science & Technology Co., Ltd (Beijing, China). Graphite oxide was obtained from XF Nano (Nanjing, China). All of the oligonucleotides were supplied by FASMAC Co., Ltd (Midorigaoka, Atsugi, Kanagawa, Japan). The sequence of the aptamer modified with FAM used in this study is as follows: 5′-FAM-GGTTGGTGTGGTTGG-3′ [36]. Thrombin (TB) was obtained from Sigma-Aldrich (Shanghai, China). Murine macrophage cells (RAW 264.7 cells), a Live/Dead Assay Kit, and a Cell Counting Kit-8 were obtained from Sangon Biotech Co., Ltd (Shanghai, China). All of the other reagents were obtained from Sigma-Aldrich (Shanghai, China). The TB buffer, which was used to dissolve TB, contained 30 mM of Tris-HCl (pH 7.2), 20 mM of KCl, 50 mM of NaCl, 3 mM of MgCl2, and 3 mM ofCaCl2. The DNA buffer that was used to dissolve DNA contained Tris-HCl (10 mM, pH 7.4), 1 mM of ethylenediaminetetraacetic acid (EDTA), and 50 mM of NaCl. The absorption medium and release medium contained Tris-HCl (50 mM, pH 7.2) and 50 mM of KCl. Proteins and aptamers were stored at −20 °C prior to experimentation.
2.2. Preparation and Characterization of X and L-Shaped DNA Building Units
In the typical experiment, an equimolar amount of a DNA strand of an X-shaped unit (X1, X2, X3, and X4) and an L-shaped unit (L1 and L2) was separately solved into DNA buffer to obtain final concentrations of 30 μM for all of the DNA strands. The final mixture was incubated at 95 °C for 10 min, and then placed at room temperature for 2 h, resulting in the X and L-shaped DNA structures. Then, gel electrophoresis was utilized to detect the formation of DNA building units. A DNA sample (7 μL) was mixed with 6 × loading buffer (2 μL) and analyzed with 3% agarose gel at 90 V for approximately 40 min in 0.35 × TAE buffer [14 mM of tris (hydroxymethyl) aminomethane, 0.45 mM of ethylenediaminetetraacetic acid, and 7 mM of acetic acid, pH 8.0]. The bands were stained with GoldView I nucleic acid dye, and then imaged with a GelDoc XR+ system (Bio-Rad, Hercules, CA, USA).
2.3. One-Pot Self-Assembly of Aptamer-Functionalized DNA Hydrogel
For the preparation of aptamer-functionalized DNA hydrogels, a stock solution of the X and L-shaped building units were used to prepare the DNA hydrogel. The molar ratio of X-DNA to L-DNA was kept at 1:2. X-DNA (10 μL) at different concentrations of (400 μM, 500 μM, 600 μM, 700 μM, and 800 μM), L-DNA (10 μL) at different concentrations of (800 μM, 1000 μM, 1200 μM, 1400 μM, and 1600 μM) and S-DNA (1 μL) at different concentrations of (0 μM, 200 μM, 400 μM, 600 μM, 800 μM, and 1000 μM) were mixed at room temperature to rapidly form the aptamer-functionalized DNA hydrogels within one minute. The tubes containing the mixtures were then inverted for 30 min. The “sticky ends” (black lines) of X-DNA were complementary to those of L-DNA and S-DNA. The details of the DNA sequences are shown in Table S1. The green part is the thrombin aptamer. Here, FAM-labeled S-DNA was used to demonstrate the successful self-assembly process of S-DNA with X-DNA. S-DNA with scrambled “sticky ends” was used as the control group. Then, the obtained hydrogels were washed extensively by using DNA buffer and centrifuged (1500 rpm, 10 min) to wash out the unreacted S-DNA. Finally, DNA hydrogel was observed by fluorescent microscope (Olympus IX73, Pittsburgh, PA, USA).
2.4. Determination of Mechanical Properties of the DNA Hydrogel
The storage modulus and the loss modulus were obtained by using a dynamic mechanical analyzer (DMA Q800, TA Instruments, New Castle, DE, USA). The frequency was changed from 0.1 Hz to 10 Hz while keeping the amplitude at 25 mm. The hydrogel samples were cut into a cylinder with height of 5 mm and a diameter of 10 mm for the determination of mechanical properties.
2.5. Aptamer-Functionalized DNA Hydrogel for Protein Capture
Hydrogel sample was incubated in 100 μL of absorption medium with protein to investigate the ability of the DNA hydrogel to capture protein. Here, we used the TB aptamer as a model to capture and release TB. The approach for detecting the concentrations of protein that were captured and released was based on a graphene oxide-based fluorescence aptasensor [37]. The detection theory was showed in Figures S1 and S2. This approach allowed the accurate characterization of the capture and release properties of the aptamer-functionalized DNA hydrogels.
2.6. Aptamer-Functionalized DNA Hydrogel for Protein Release
The burst release experiments were detected in the absence of CSs. The hydrogel samples were labeled as hydrogel with S-DNA, hydrogel with controlled S-DNA, and hydrogel without S-DNA. Here, the controlled S-DNA should not bind to TB due to the different sequences with aptamer. The release of thrombin was triggered through adding complementary sequences of aptamers (CSs). The hydrogel samples that captured TB were incubated in 100 µL of release medium with different concentrations of CSs (0 μM, 0.4 μM, 0.8 μM, 1.2 μM, 1.6 μM, and 2 μM). At predetermined time points, 1 μL of release medium was taken to detect the released thrombin concentration in the medium. Except for the concentration of CSs, the strand length of CSs and the adding times of CSs, which also had a significant influence on the ability of TB release, were carefully discussed in this work.
2.7. Cell Culture
Cell culture tests were performed with commercial murine macrophage cells (RAW 264.7 cells). The DNA hydrogel (X-DNA 400 μM, L-DNA 800 μM, and S-DNA 200 μM) was placed in a 24-well plate and then sterilized in 75% (v/v) ethanol for 150 min, followed by three rinses with sterilized phosphate-buffered saline (PBS). Subsequently, the hydrogel was prewetted with culture mediums for 120 min. After removing the culture mediums, 500 μL of a suspension of the RAW 264.7 cells (1 × 10⁵ cells well−1) was seeded on the hydrogel or culture plates directly as the control and cultured under standard conditions. After incubation for 24 h, the cells on hydrogels or culture plates were stained with the Live/Dead Assay Kit and then observed by using fluorescence microscopy. The Cell Counting Kit-8 (CCK-8) was used to evaluate the cell proliferation on the hydrogels or culture plates (control group) after culturing for one day, three days, five days, and seven days. Briefly, at each time point, the culture mediums were removed, and the CCK-8 working solutions were added at 37 °C for 120 min. Finally, the supernatant mediums were extracted to determine the cell quantity using a Thermo scientific microplate reader (Thermo Fisher Scientific, Waltham, MA, USA).
2.8. Statistical Analysis
Data were expressed as the mean ± standard deviation of five samples. Statistical significance was determined by analysis of variance (single factor) with p < 0.05.
3. Results and Discussion
3.1. The Preparation of DNA Building Units
As illustrated in Figure 1, the X-DNA served as a building unit, which was assembled from four single-stranded DNAs (ssDNAs), and each strand had a “sticky end” portion (marked in black). The L-DNA was a linear duplex assembled through two ssDNAs that contained two “sticky ends”, which were complementary to those of X-DNA. The S-DNA was an ssDNA, of which one side was a “sticky end” (marked in black) and another side was a thrombin aptamer (marked in green). The “sticky ends” of the S-DNA were also complementary to those of the X-DNA.
Agarose gel electrophoresis was used to testify the formation of the X-DNA and L-DNA structure. In Figure S3, X-DNA (lane 5) did not move as far as X1, X2, X3, and X4 (lanes 1, 2, 3, and 4, respectively). Similarly, the L-DNA (lane 8) did not move as far as L1 and L2 (lanes 6 and 7, respectively). The results indicated that X-DNA and L-DNA indeed formed as designed, and the pure single band that was shown in lanes 5 and 8 demonstrated that the assembly processes were highly efficienct.
3.2. Fabrication of Aptamer-Functionalized DNA Hydrogel
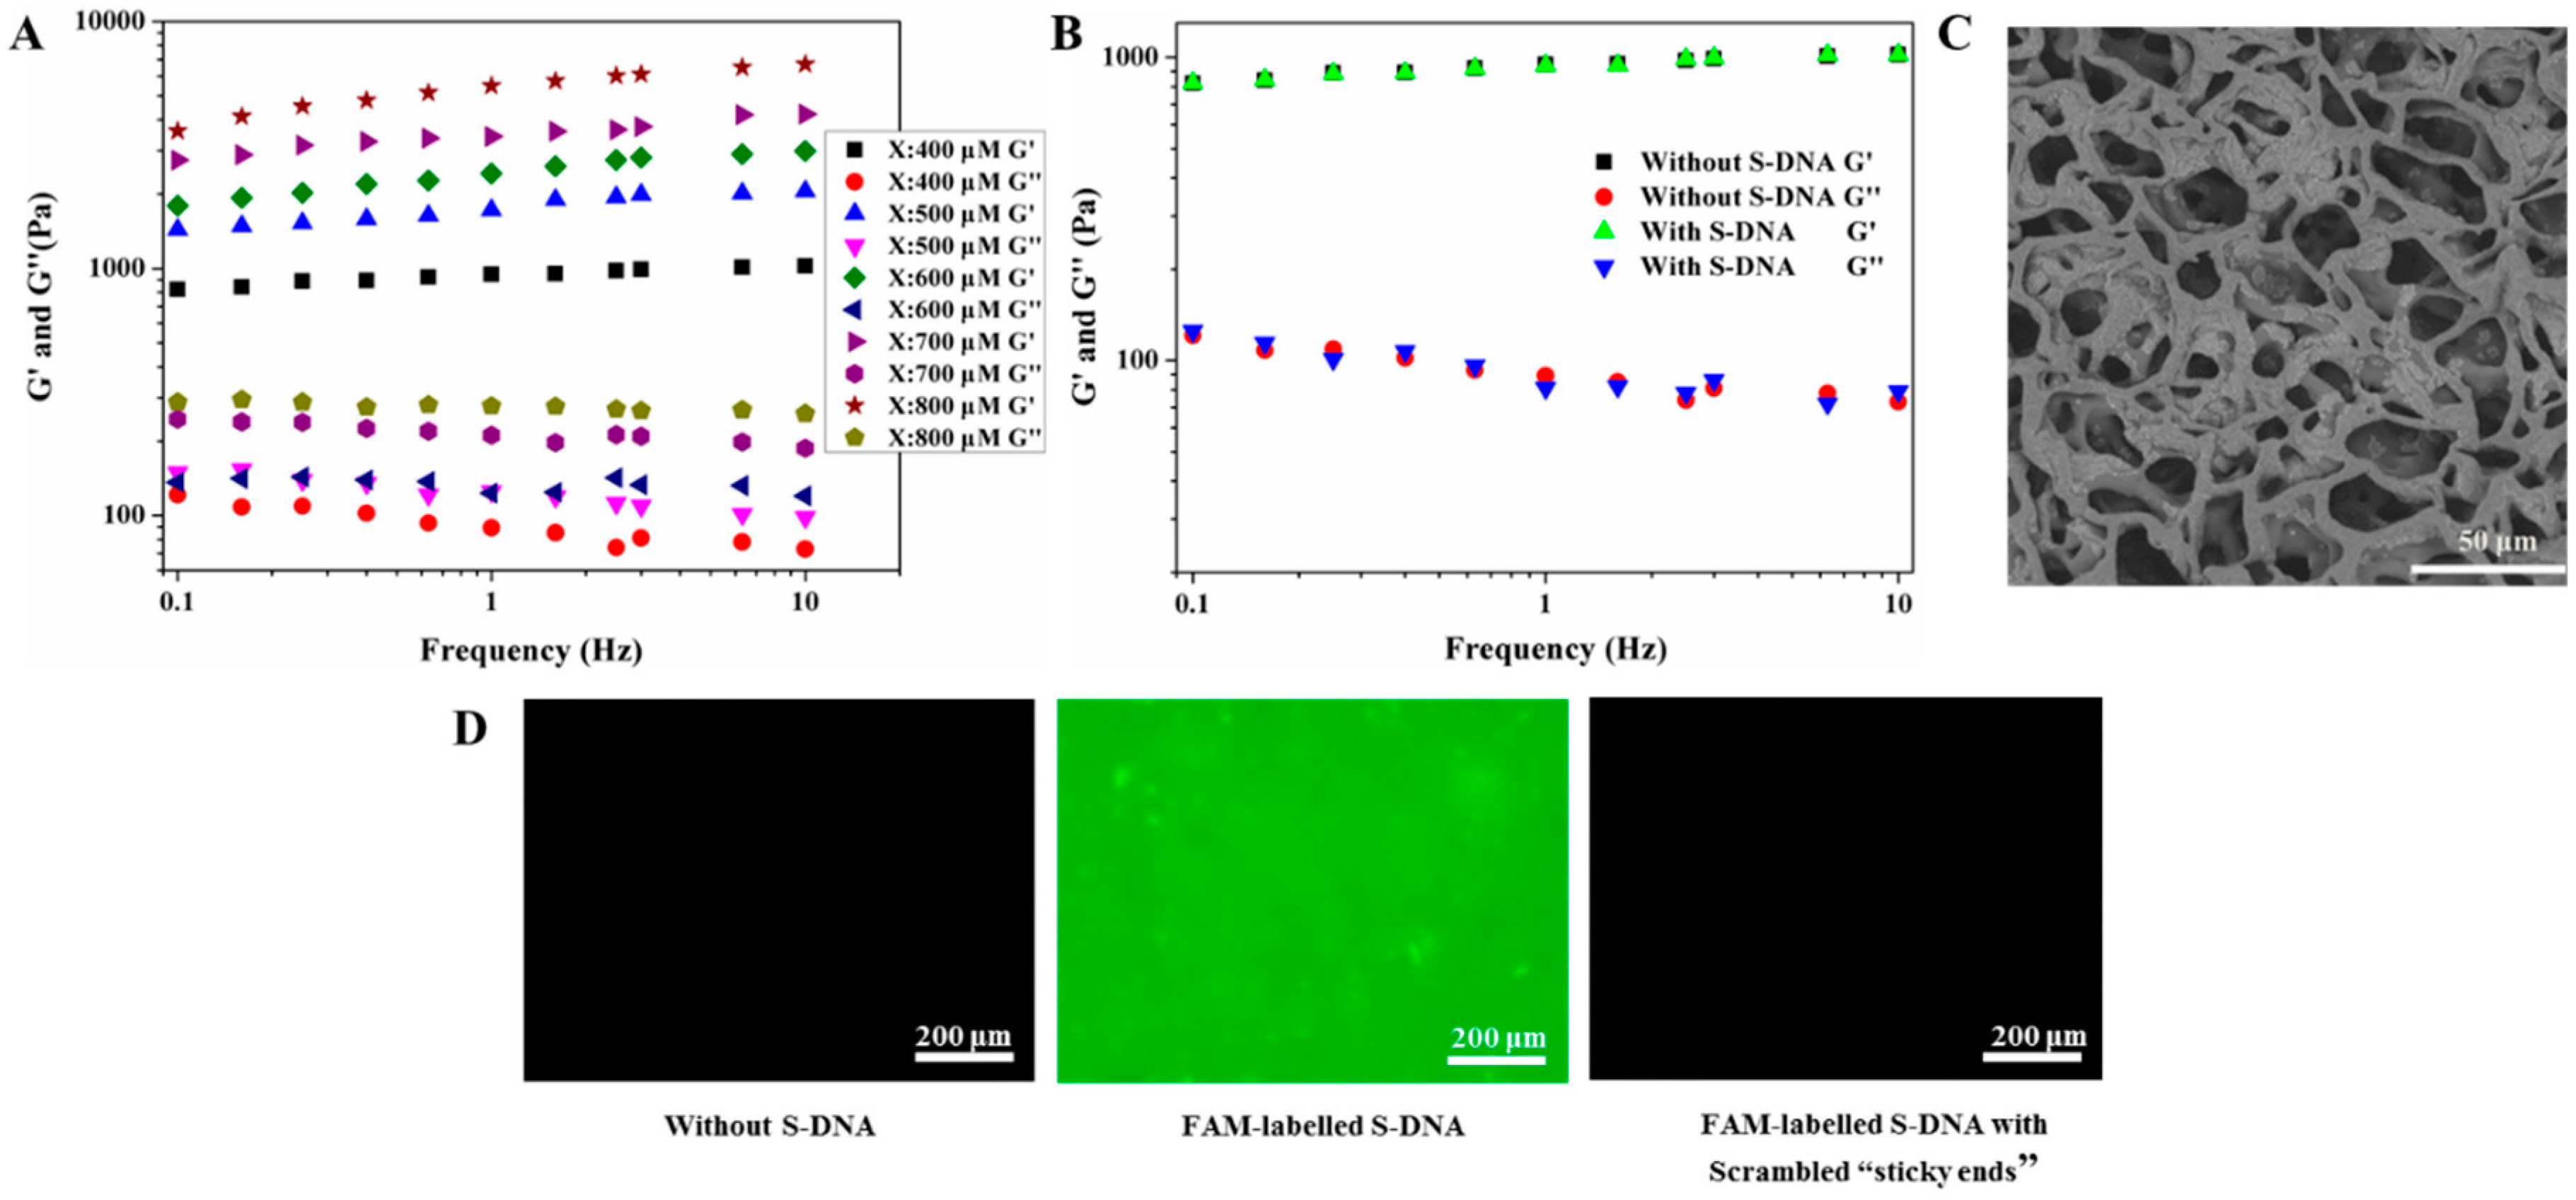
The ideal molar ratio of the L-DNA to X-DNA was 2:1, where the initial DNAs were entirely cross-linked and formed the most indurative network [38,39]. Next, 10 μL of X-DNA and 10 μL of L-DNA with different concentrations were mixed with 1 μL and 200 μM of S-DNA to form aptamer-functionalized DNA hydrogels. As shown in Figure S4, the solutions with different concentrations of X and L-DNA have lost all their fluidity in a minute and seemed to be reaching a gel state, which turned out to be the transformation of the sol-to-gel. Besides, the frequency-scanning test was used to examine the mechanical properties of DNA hydrogels to further confirm the formation of DNA hydrogels. As shown in Figure 2A, the loss modulus (G”) was significantly smaller than the storage modulus (G’) in the whole process, which provided the obvious signal for the formation of gel. The result indicated that pure DNA hydrogels assuredly came into being, which were self-assembled from the DNA building blocks. The mechanical strength of the DNA hydrogel was enhanced along with the enhancing concentration of the DNA building units. The rheological properties of the DNA hydrogel with grafted S-DNA and without S-DNA that were shown in Figure 2B proved that there was no significant difference between the hydrogel with S-DNA and the hydrogel without S-DNA.
In this work, the concentration of S-DNA was very low relative to that of X-DNA. The grafting degree of S-DNA into hydrogel was calculated in Figure S5 and Table S2. It demonstrated that only a few “sticky ends” of X-DNA had been consumed by S-DNA. Thus, the effect of S-DNA on the mechanical properties of the hydrogel could be ignored. The inner morphology of the hydrogel was characterized by SEM and provided here. The DNA hydrogel samples were freeze-dried as shown in Figure 2C; the freeze-dried hydrogel owned the interconnected pore structures, and the pore size was about 10 μm to 50 μm, so that the protein could easily diffuse into or out of the hydrogel.
In order to examine whether the S-DNA could be assembled into a hydrogel, the FAM (carboxyfluorescein)-labeled S-DNA and FAM-labeled S-DNA with a scrambled “sticky end” was mixed with X-DNA and L-DNA. The formed DNA hydrogels were washed in DNA buffer to eliminate non-cross-linked S-DNA, and observed by a fluorescent microscope. As shown in Figure 2D, the blank control group formed a hydrogel only by X-DNA and L-DNA without adding S-DNA, and no fluorescence was detected. The hydrogel with FAM-labeled S-DNA exhibited strong fluorescence intensity. However, if the hydrogel was assembled from FAM-labeled S-DNA with the scrambled “sticky ends”, no fluorescence was detected, too. This could be explained by the S-DNA with the scrambled sticky ends not being complementary to that of the X-DNA. The results suggested that the S-DNA with a complementary “sticky end” to X-DNA could be successfully assembled into the hydrogel network through the base complementation pairing rule.
3.3. Examination of Thrombin Load by Aptamer-Functionalized DNA Hydrogel
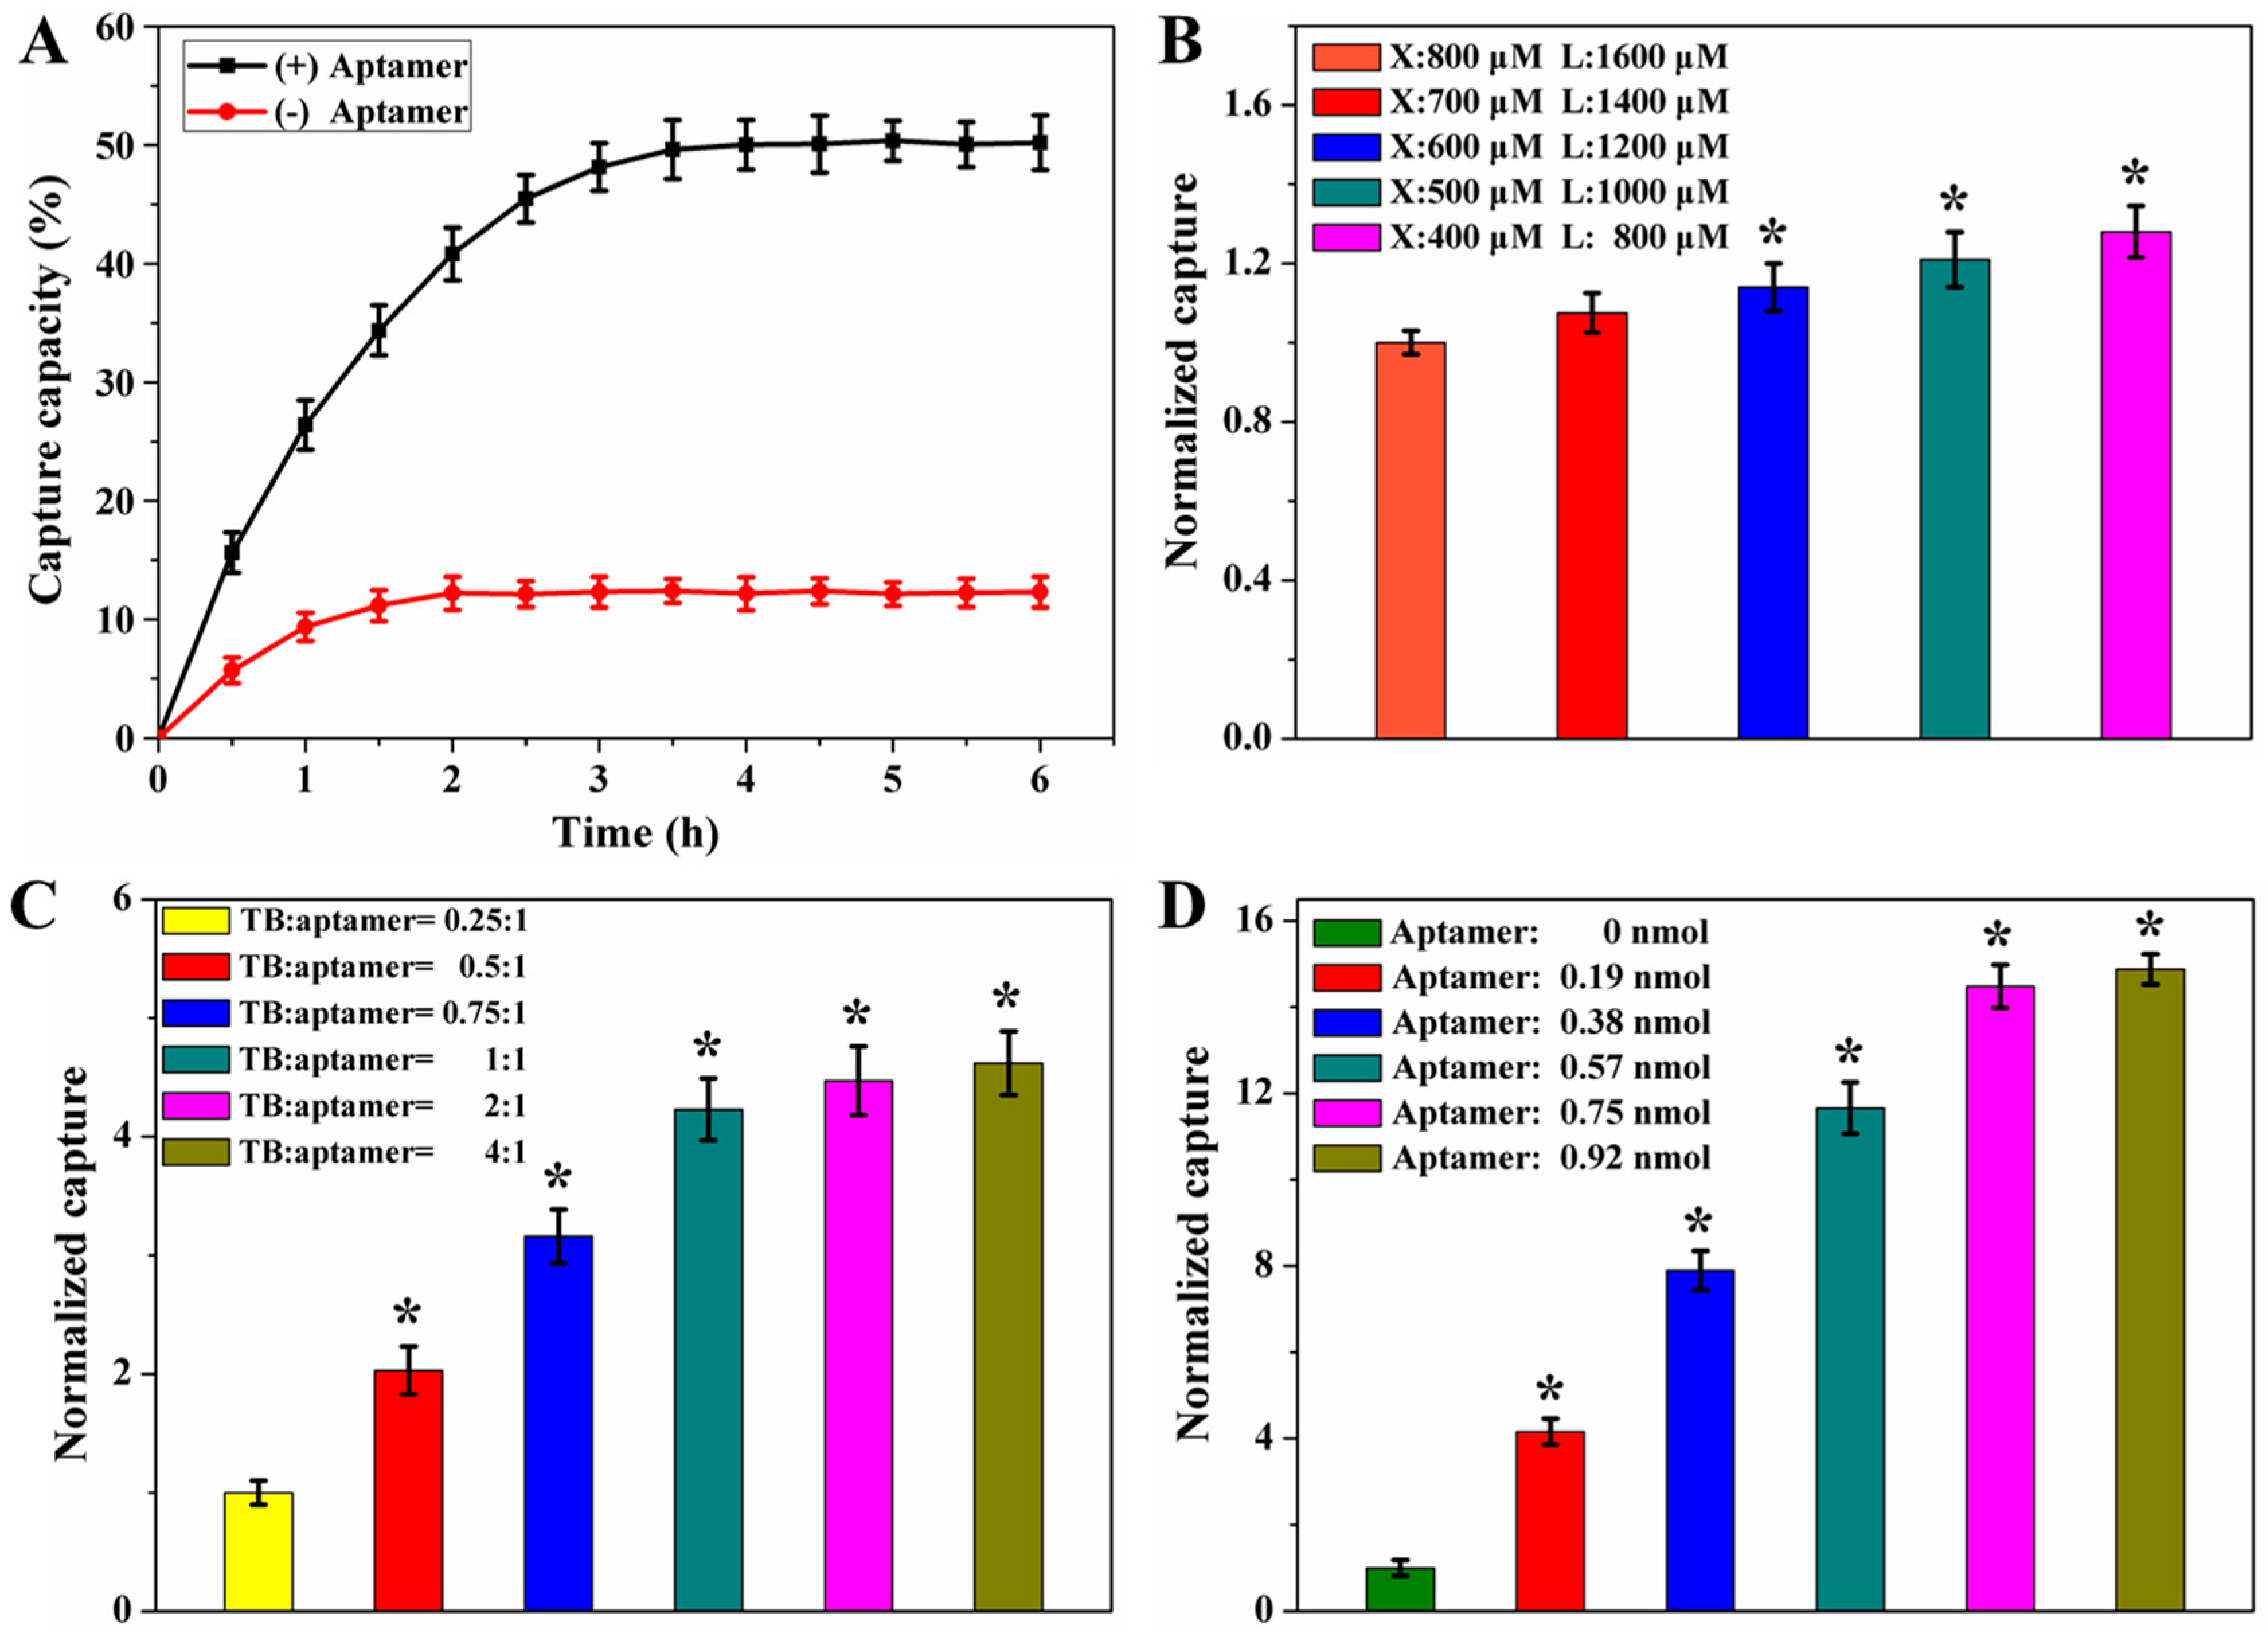
To capture thrombin, the hydrogels were washed extensively using DNA buffer to eliminate non-cross-linked S-DNA, and then immersed in the absorption medium. As the incubation time increased, the TB molecules would penetrate into the hydrogel network and lead to the concentration decreasing of TB in buffer solution. The protein capture capability of the hydrogels could be obtained though detecting the change of TB concentrations in the absorption medium. As shown in Figure 3A, after 6 h of incubation, the DNA hydrogels with aptamers had an obviously higher thrombin capture capability (approximately 51%) than the DNA hydrogels without aptamers (approximately 13%) due to the specific bind of thrombin to the aptamer in the hydrogel. These results demonstrated that the hydrogels without aptamers had a very low protein capture capacity just because of the physical diffusion effect. As for the hydrogel assembled with aptamers, the capture capacity was determined mainly by the specific affinity between the aptamers and proteins, and secondly by the physical diffusion effect. This suggests that aptamers play a crucial role in capturing protein in the DNA hydrogels.
Although the hydrogels without aptamers had a very low protein-capture capacity, the ability of the DNA hydrogel to capture thrombin by the physical diffusion effect is still very important. Since aptamers are integrated into hydrogel matrixes, TB has to firstly permeate through the DNA hydrogel networks, and then bind the aptamer embedded in the matrixes. In order to further understand the ability of the DNA hydrogel to capture thrombin, the two building blocks were investigated at different concentrations of X-DNA at 400 μM and L-DNA at 800 μM, X-DNA at 500 μM and L-DNA at 1000 μM, X-DNA at 600 μM and L-DNA at 1200 μM, X-DNA at 700 μM and L-DNA at 1400 μM, and X-DNA at 800 μM and L-DNA at 1600 μM, respectively. The concentration of S-DNA was kept at 200 μM. As shown in Figure 3B, the higher concentration of DNA building units (X-DNA at 800 μM and L-DNA at 1600 μM) had a lower protein capture capacity. This could be explained by the higher concentrations of DNA units resulting in the more closely knit and higher cross-linked networks, which limited the diffusion of thrombin into hydrogel. As the concentration of DNA building units decreased, the TB loading amount of the hydrogel increased gradually. We performed p-value calculations for each pair, and showed that the last two data (X:500-L:1000 and X:400-L:800) are significantly different. Therefore, the hydrogel samples that were formed by 400 μM of X-DNA and 800 μM of L-DNA had the highest protein-capture capacity. In addition, in order to avoid wasting more protein, this concentration was chosen for the next experiments in the following sections.
Except for the concentration of the DNA building units, the concentration of TB in the absorption medium also affected the capture capability of the hydrogel. The hydrogel samples (assembled from 400 μM of X-DNA, 800 μM of L-DNA, and 200 μM of S-DNA) were respectively immersed into 100 μL of buffer solution with different concentration of thrombin (0.5 μM, 1 μM, 1.5 μM, 2 μM, 4 μM, and 8 μM). After calculating, the molar ratio of TB to aptamers was respectively 0.25:1, 0.5:1, 0.75:1, 1:1, 2:1, and 4:1. The results were shown in Figure 3C; the normalized capture was raised from 1 ± 0.11 to 4.23 ± 0.26, and the molar ratio of TB to aptamers increased from 0.25:1 to 1:1. We performed p-value calculations for each pair, and found that when the thrombin concentration was raised continuously from 2 μM to 8 μM (namely the molar ratio of TB to aptamers was raised continuously from 1:1 to 4:1), there was no obvious change in the normalized capture of hydrogel. It could be explained when the content of TB exceeded that of the aptamer, the aptamers in the hydrogel were consumed completely. The results showed that when the molar ratio of TB to aptamers was kept at 1:1, the hydrogels reached saturation capture and capture equilibrium. In addition, an obvious change in the normalized capture with the different concentrations of thrombin was found in the range of 8 nM to 1 μM in both the buffer and human urine-spiked samples. The limit of detection is as low as 80 pM. It is anticipated that our thrombin capture system could be a promising tool for the clinical diagnosis of thrombin in human urine.
Another important factor that influenced the capture capacity of the hydrogel was the S-DNA concentration. As shown in Figure 3D, with the increase of the aptamer assembling into the hydrogel, the protein-capture capability was raised obviously. The normalized capture of the hydrogel without aptamers was regard as one. As the aptamers concentration increased from 0.19 nmol to 0.75 nmol, the normalized capture was enhanced from 4.16 ± 0.31 to 14.48 ± 0.52. Since the amount of TB was fixed at 0.75 nmol, with the amount of aptamer continuously increasing from 0.75 nmol to 0.92 nmol, the normalized capture of the hydrogel was basically changeless. The thrombin in the loading medium had been entirely loaded into the hydrogel. The results suggest that the specific bind of the aptamers and thrombin was the primary impetus for thrombin capture.
3.4. Examination of Thrombin Release from Aptamer-Functionalized DNA Hydrogel
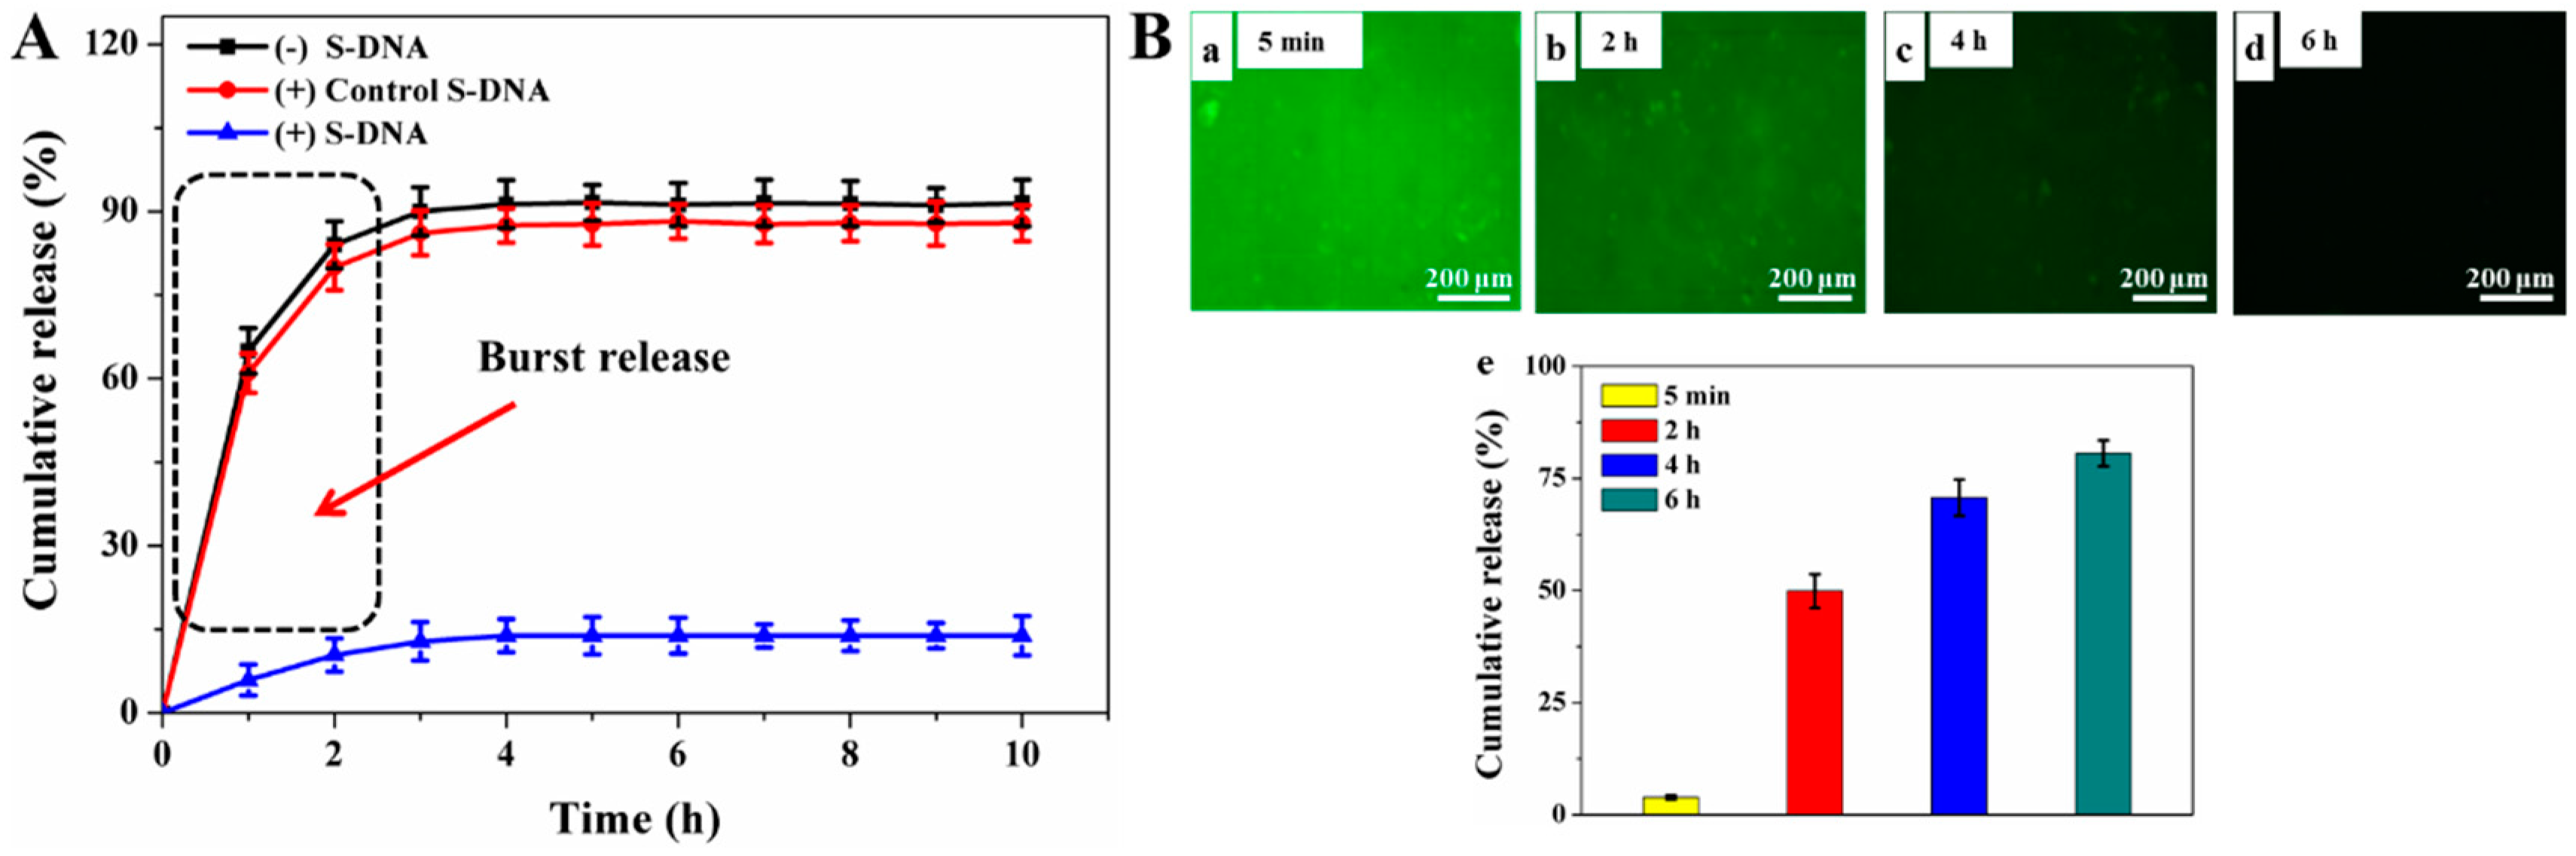
The hydrogel underwent thrombin release tests in the absence of CSs to examine the binding ability between the aptamer and thrombin in the hydrogels. As shown in Figure 4A, more than 80% of the thrombin was released from the hydrogel without S-DNA within 2 h. Similarly, the hydrogel with controlled S-DNA also had the burst release phenomena in the first two hours. In contrast, only 10% of thrombin was released from the S-DNA-functionalized hydrogels in 10 h. These results suggest that aptamers dramatically reduce the burst release and result in the effective sequestration of thrombin in the hydrogel.
The controlled thrombin release property of hydrogel was detected in the existence of CSs. A comparison of the interaction force between the aptamer–TB complex and the aptamer–CS duplex was shown in Figure S6. The results showed that CS12 and CS15 could trigger the release of TB, while CS8 could not. In order to prove the ability of the hydrogel to hybridize with the CSs, the DABCYL ((4′-(4-dimethylaminophenylazo) benzoic acid)-labeled CS15 was designed as shown in Table S1. When the CSs diffused into hydrogel network and hybridized with the FAM-labeled S-DNA, the emission of FAM was quenched through DABCYL on account of the Forster resonance energy transfer (FRET) effect [42,43]. Therefore, along with the hybridization of aptamers and CSs, the intensity of fluorescence decreased with the increasing incubation time, as shown in Figure 4B(a–d). At the same time, the dissociated TB from aptamers increasingly diffused out of the hydrogels, which resulted in the concentrations of TB in the release medium increasing, as shown in Figure 4B(e). These results demonstrate that CSs are able to penetrate rapidly into the DNA hydrogel to hybridize with aptamers and lead to TB release.
The dissociation rate of thrombin triggered by CS15 can be fitted to a theoretical dynamic model in accordance with the relation between triggering time and thrombin concentrations. The fitting formula is listed as follows:
where C0 is the initial concentrations of thrombin without CSs, Ct is that at time t, and C∞ is that when the reaction reaches equilibrium with CSs. Here, k is a rate constant that corresponds to the dissociation rate of thrombin triggered through CSs. The effect of the concentrations of CSs on the rate constants k of thrombin dissociation was researched. According to the fitting formula, the dissociation rate corresponded to the slopes of the linear curves. The different concentration of CSs resulted in different dissociation rate constants k. As shown in Figure 5A, when the molar ratio of CSs to aptamers was 1:5, k was −0.2971. When the molar ratio of CSs to aptamers was raised to 1:1, k was reduced to −0.8082, as shown in Figure 5E. Comparing the slopes of the curve (Figure 5F), we can conclude that higher concentrations of CSs in the same release time will lead to a lower rate constant (i.e., higher release capability).
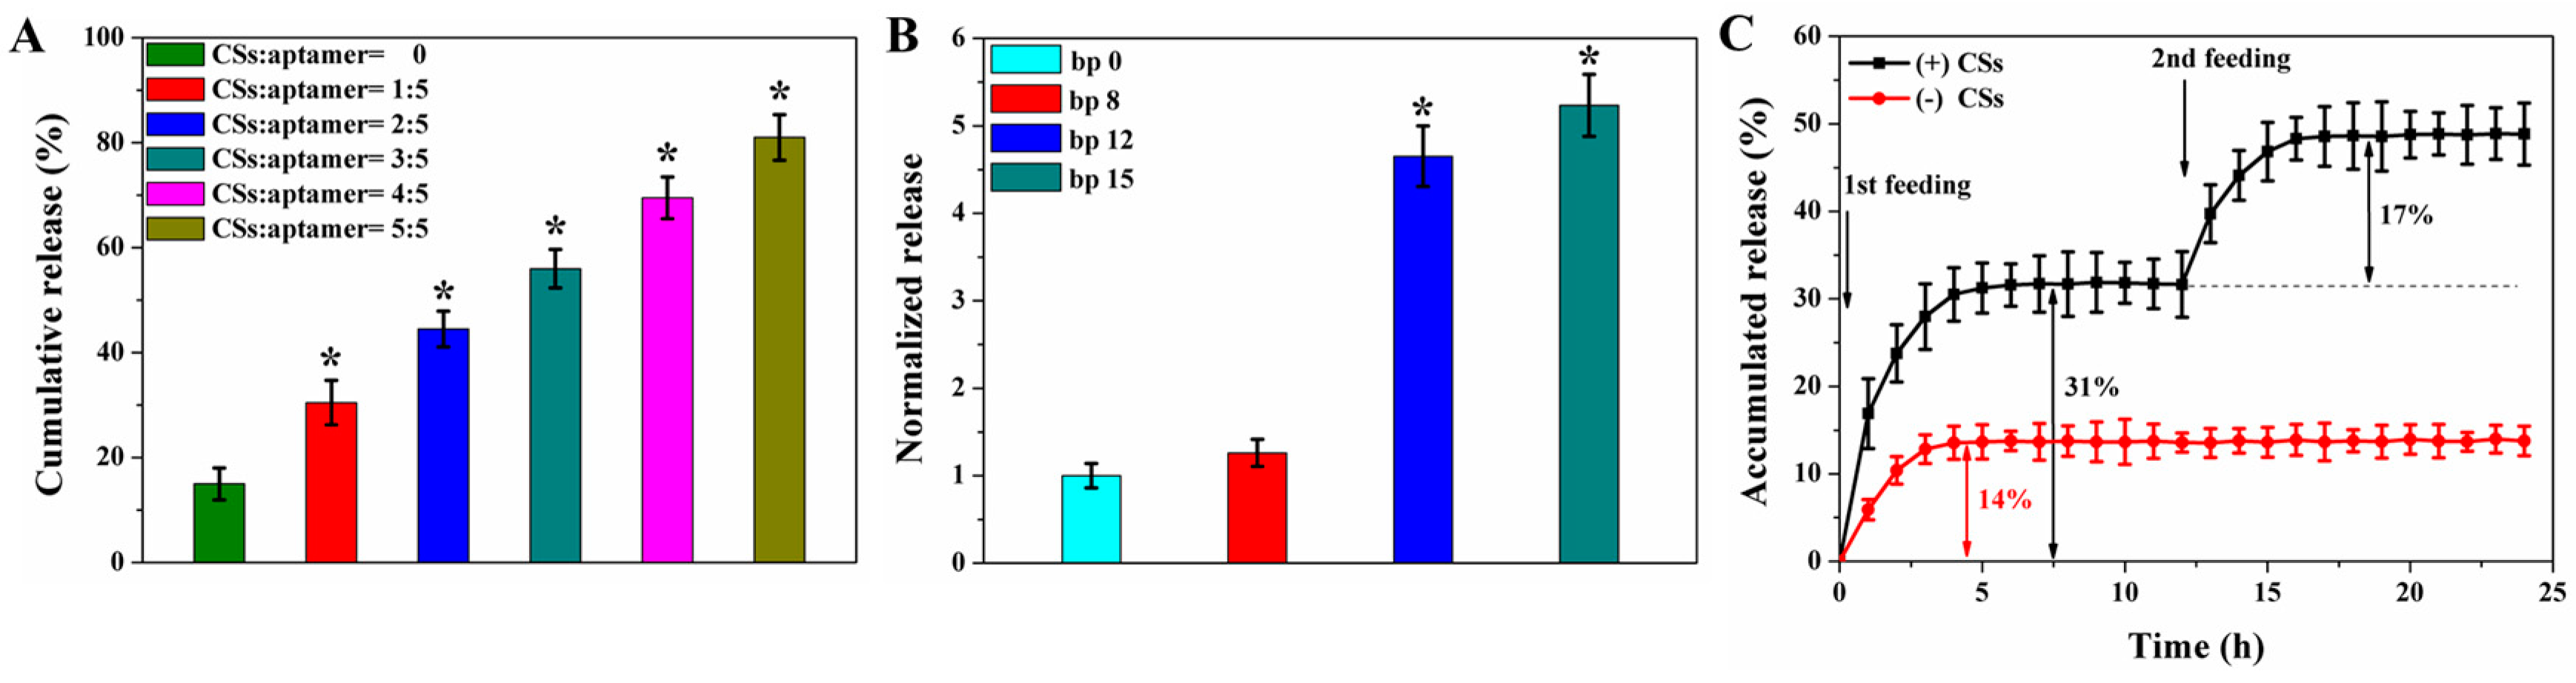
To further understand the protein-releasing law regulated by CSs, the molar ratio of CSs to aptamer, the length of CSs, and the time of CSs adding were carefully discussed in this work. As shown in Figure 6A, through adjusting concentrations of the CS15, the release amount of the TB could be controlled. The percentage of CSs that was diffused into the hydrogel was shown in Figure S7 and Table S3. Along with the increasing CSs concentration (the molar ratio of CSs to aptamers was adjusted from 1:5, 2:5, 3:5, 4:5, and 5:5), cumulative TB release increased from 30% to 81%. The thrombin binding on an aptamer couldn’t be dissociated without the CSs (CSs = 0). As a result, thrombin could be released only by the physical diffusion, and the cumulative release was approximately 15%. The results were similar to those shown in Figure 5.
The amount of base pair obviously influenced the strength of DNA hybridization [44]. Therefore, longer CSs resulted in stronger competition ability. As shown in Figure 6B, when the length of the CSs was eight nucleotides, there was no significant difference compared to the control. It suggested that the short CSs with only eight nucleotides couldn’t trigger the thrombin releasing from the aptamer. When the chain length of CSs changed from eight to 12 nucleotides, the thrombin release amount was enhanced fourfold. When the length of CSs was completely complementary with the thrombin aptamer (15 nucleotides), the thrombin release amount was increased approximately five times. These results demonstrated that increasing the length of complementation DNA can promote thrombin separation from aptamer–thrombin complexes.
In addition to the reasonable design of the CSs length, triggered release can be adjusted by other factors (for example, the triggering time). As shown in Figure 6C, we applied CS15 to treat the DNA hydrogel at hours 0 and 12. The total amount of the released thrombin over 0 h and 12 h were approximately 31% and 51% (the molar ratio of added CSs to aptamers was fixed at 1:4 at each adding time). The hydrogels without CS15 released approximately 14%. The accumulated release of thrombin was approximately 31% for the first triggering (0 h), and approximately 17% for the second triggering (12 h). It could be explained that the first release included two processes, namely the normal physical diffusion of thrombin (14%) and triggered release by CSs (17%). However, for the second release, the release process was only triggered by CSs. This was because most of the TB was bonded to aptamers due to the TB–aptamer interaction force, and only a few TB was free to diffuse out of hydrogel. The physical diffusion process can get an equilibrium within 5 h, as shown in Figure 6C. That’s why we got the conclusion that the first triggering time contained 14% “normal physical diffusion” and 17% “CSs-triggered release”. Then, at subsequent triggering times, we attributed 17% of the release only to a CSs-triggered release.
Thus, the release amount rests with the feeding amount of CSs. These results indicate that the sequestration of thrombin can be a triggered release by CSs at a determined time point, and the release content can be precisely adjusted through changing the CSs concentrations.
3.5. Application in Complex Matrixes
A complex matrix, human serum, was investigated for the practical application of the hydrogel in the triggered release of thrombin. The hydrogel that captured the thrombin was immersed in the human serum solution. The serum solution had been diluted 50 times before each experiment. Then, we applied CSs to treat the DNA hydrogel at hours 0, 48, 96, and 144 with the molar ratio of CSs to aptamers being 1:4 at each adding time. As shown in Figure 7, the amount of the released thrombin in hours 0, 48, 96, and 144 were approximately 33%, 50%, 67%, and 84%, respectively. For the first triggering time (0 h), the accumulated release of thrombin was approximately 33%. For each of the remaining three trigger times (48 h, 96 h, and 144 h), the release amount of thrombin was approximately 17% for each adding time. These results imply that this hydrogel shows a promising feature for practical applications in complex matrixes.
3.6. Cytocompatibility of the DNA Hydrogel
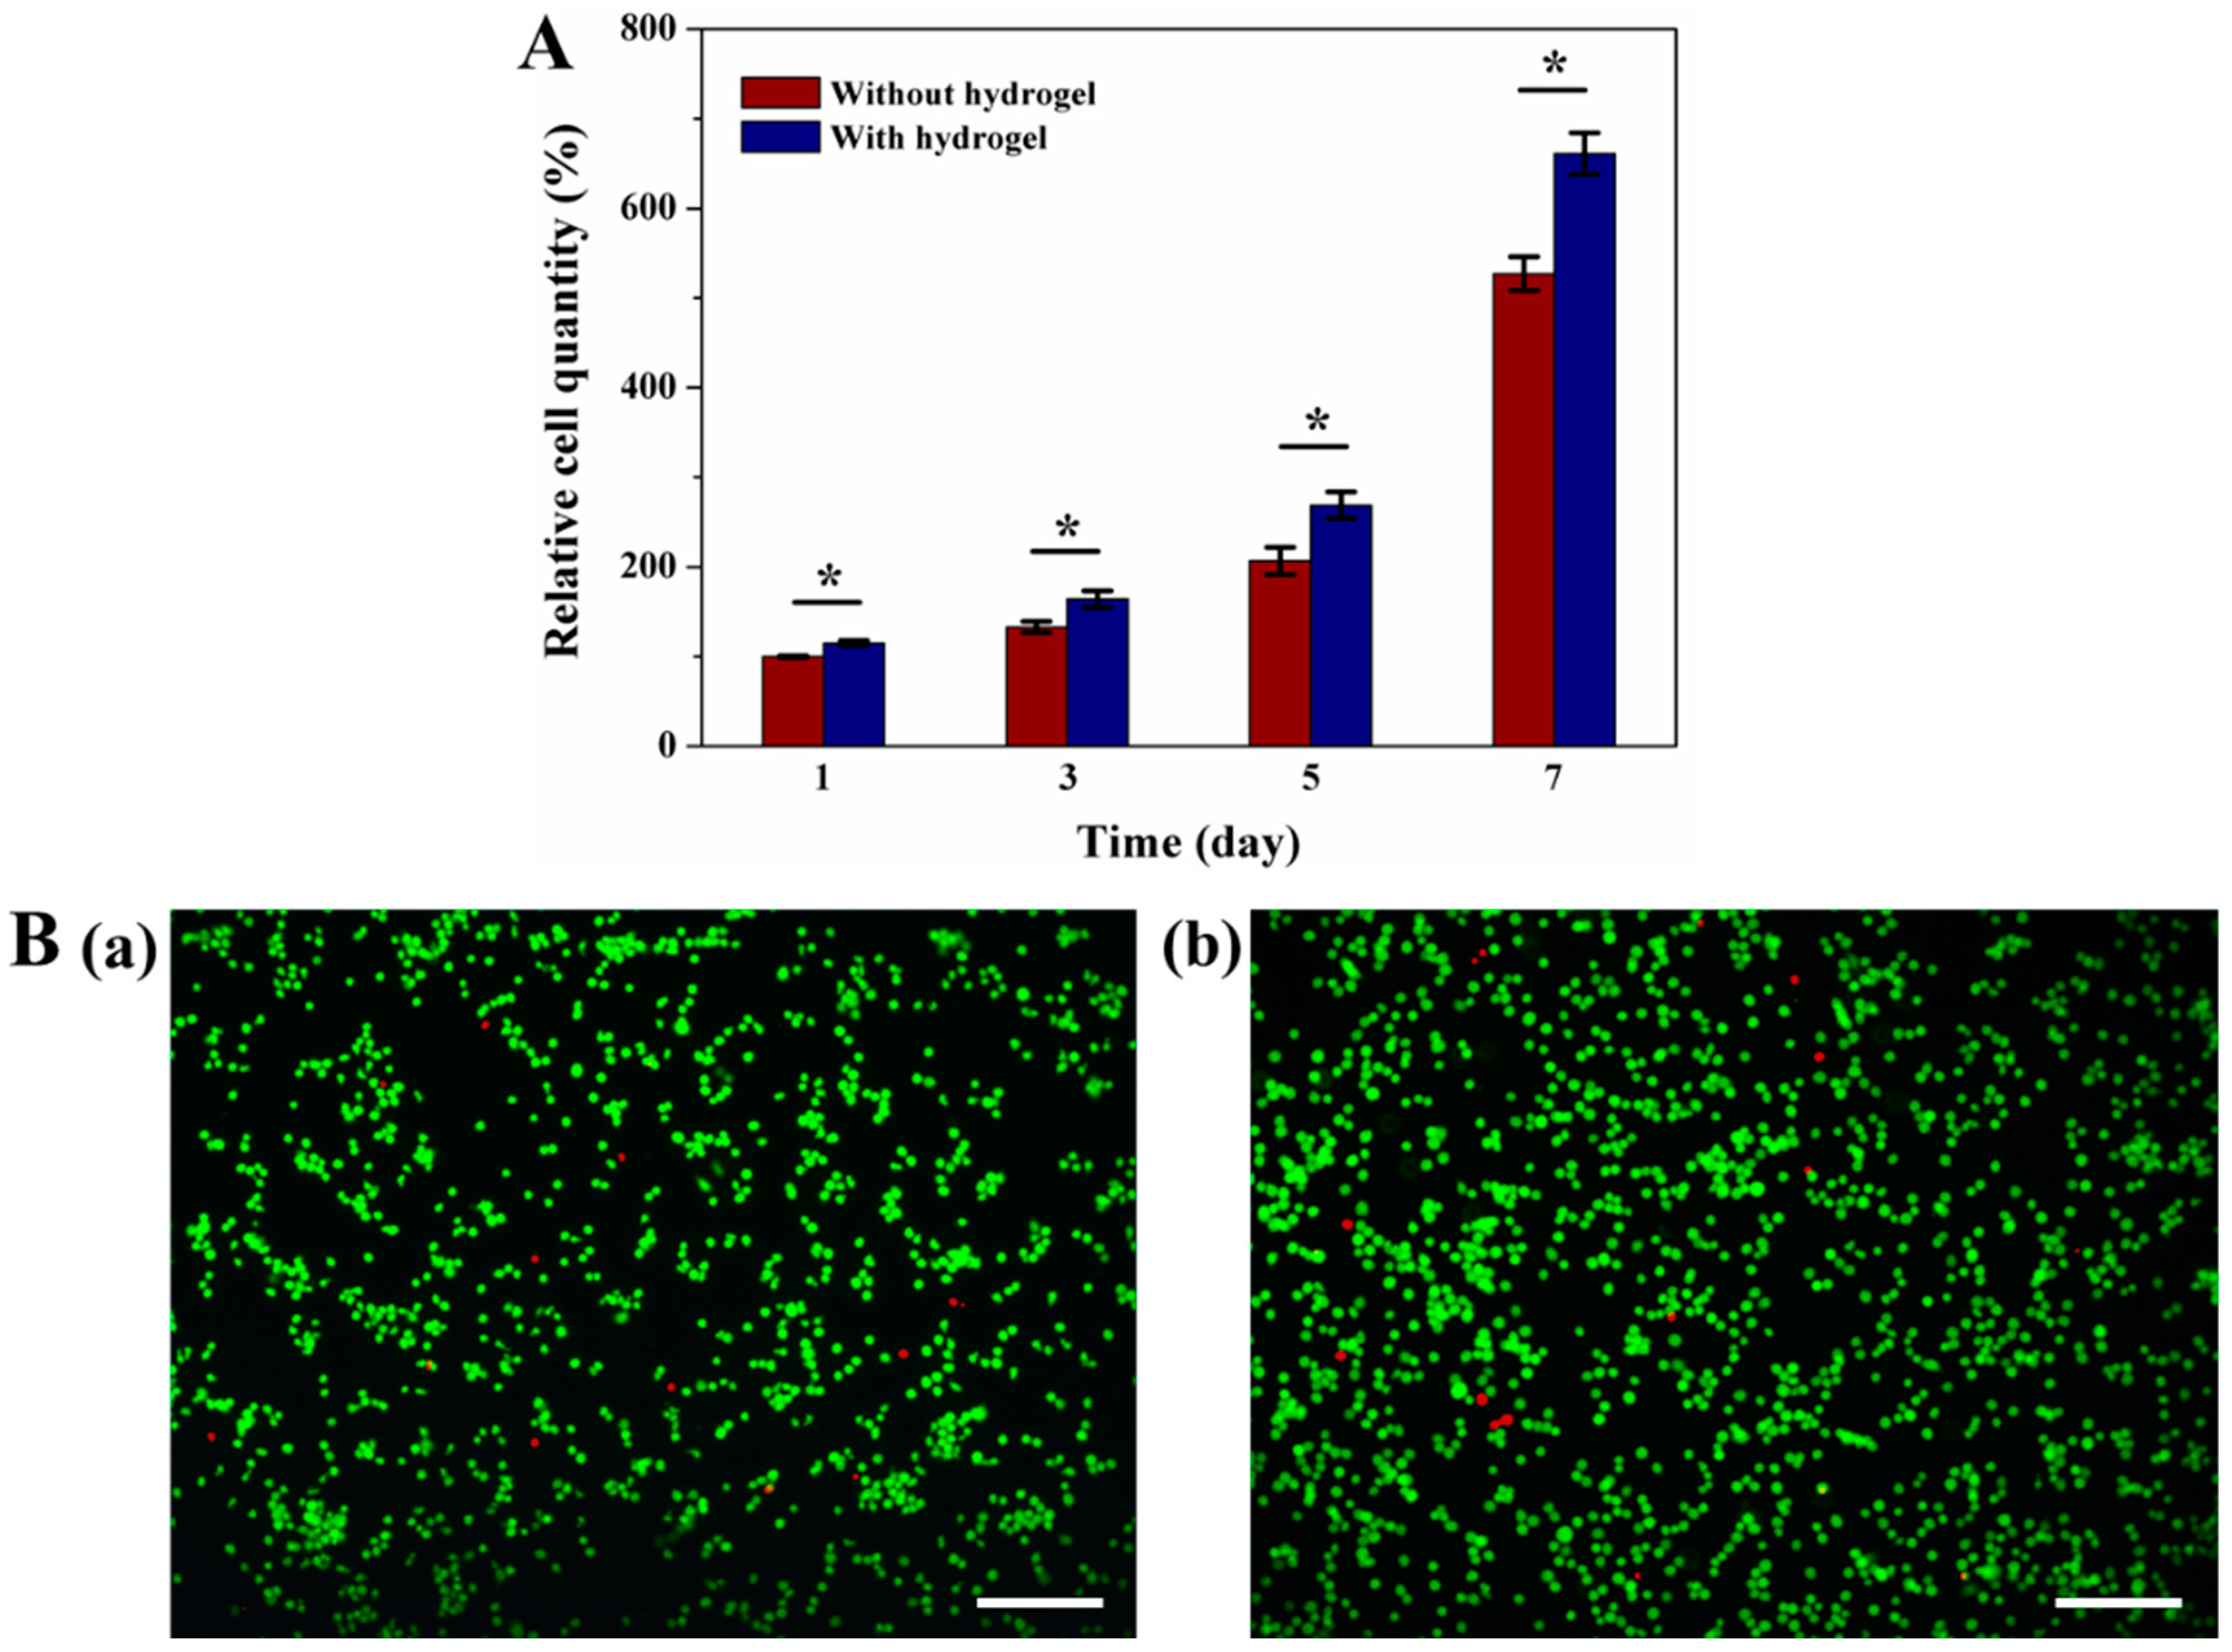
The proliferation and viability of the RAW 264.7 cells cultured on the hydrogel were researched in vitro. With increasing culture time (Figure 8A), the RAW 264.7 cells gradually proliferated in the DNA hydrogels and the culture plates without hydrogels (control group). The proliferation rate of RAW264.7 cells on the surface of the DNA hydrogel was higher than that that of the control group. Cell viability was also examined using a Live/Dead Assay Kit. As shown in Figure 8B, high cell viability (green) was achieved on both the DNA hydrogel sample and the control group (without hydrogel), but more cells were visible on the DNA hydrogel, indicating increased cell proliferation, which was consistent with the cell proliferation results. Compared to the other synthetic polymer hydrogel [45,46], the DNA hydrogel showed less cytotoxicity and a higher cell proliferation rate. Thus, the DNA hydrogel that was constructed via the self-assembly of X-DNA, L-DNA and S-DNA has excellent cytocompatibility and potential application in cell study.
4. Conclusions
In conclusion, the aptamer-functionalized DNA hydrogel was simply self-assembled from X-shaped DNA, L-shaped DNA, and S-DNA, avoiding a tedious DNA−polymer hybrid modification process. This hydrogel not only had a high protein-capture capacity, it also had a high retention rate in the absence of triggering CSs. The big drawback (i.e., initial burst release) of traditional hydrogel as a protein drug carrier could be resolved by using this aptamer-functionalized DNA hydrogel. Meanwhile, CSs can be used for controlling the wise-stage release of thrombin in the desired time from the hydrogels with designed concentration and dosage. The hydrogel was also workable in complex matrixes such as human serum. Furthermore, in vitro studies showed that RAW 264.7 cells cultured on the DNA hydrogel exhibited good proliferation and viability. This hydrogel will become a potential platform for the controlled release of protein drugs, which can regulate the release rate at a predetermined time point with excellent biocompatibility, and will facilitate the treatment of a mass of human diseases.
Supplementary Materials
The following are available online at https://www.mdpi.com/2076-3417/8/10/1941/s1. Figure S1: The detection mechanism of graphene oxide-based fluorescent aptasensor for thrombin protein. Figure S2: The recovered fluorescence intensity influenced by adding TB with concentrations of (2, 4, 6, 8 and 10 nM) and the linear relationship between TB concentration (nmol L−1) and relative fluorescence value. Figure S3: 3% agarose gel electrophoresis analysis. Lane 1, 2, 3 and 4 were the single-stranded DNAs, X1, X2, X3 and X4, respectively. Lane 5 was the X-DNA; lane 6 and 7 were the single-stranded DNAs, L1 and L2. Lane 8 was the L-DNA. Table S1: The sequences and the strand length of all oligonucleotides. Figure S4: The DNA hydrogel with different concentrations of X-DNA and L-DNA. (a) X: 400 μM, L: 800 μM; (b) X: 500 μM, L: 1000 μM; (c) X: 600 μM, L: 1200 μM; (d) X: 700 μM, L: 1400 μM; (e) X: 800 μM, L: 1600 μM, respectively. The concentration of S-DNA was fixed at 200 μM. Figure S5: Determination of the grafting amount of S-DNA by fluorescence spectroscopy. The initial amount of added S-DNA was respectively at (A) 0.2 nmol, (B) 0.4 nmol, (C) 0.6 nmol, (D) 0.8 nmol, (E) 1.0 nmol. Their fluorescence values were detected at 522 nm and the amount of grafted S-DNA was calculated through the difference of fluorescence intensity between the supernatant and blank solution. Table S2: The grafting degree of S-DNA. Figure S6: Comparison of the interaction force between the aptamer-TB complex and aptamer-CS duplex. Figure S7: The percentage of CS15 diffused into hydrogel. The initial amount of added CSs was at (A) CSs:S-DNA = 1/5, (B) CSs:S-DNA = 2/5, (C) CSs:S-DNA = 3/5, (D) CSs:S-DNA = 4/5, (E) CSs:S-DNA = 1. The amount of S-DNA was kept at 0.2 nmol. Their fluorescence values were detected at 522 nm and the percentage of CSs diffused into hydrogel was calculated through the difference of fluorescence intensities between the supernatant and blank solution. Table S3: The percentage of CS15 that diffused into hydrogel.
Author Contributions
J.D. conceived and designed the experiments; C.L. and J.H. performed the experiments and wrote the paper, J.H. and Y.P. measured the characterizations and analyzed the data.
Funding
This work was financially supported by the National Natural Science Foundation of China (Grant No. 21763009, 21404028), and Graduate Students Innovation Research Project of Hainan Province (Hys2018-59, Hys2018-60).
Conflicts of Interest
The authors declare no conflict of interest.
References
- Sullivan, D.H.; Carter, W.J.; Warr, W.R.; Williams, L.H. Side effects resulting from the use of growth hormone and insulin-like growth factor-I as combined therapy to frail elderly patients. J. Gerontol. A Biol. Sci. Med. Sci. 1998, 7, 175–194. [Google Scholar] [CrossRef]
- Wang, D.; Hu, Y.; Liu, P.F.; Luo, D. Bioresponsive DNA hydrogels: Beyond the conventional stimuli responsiveness. Acc. Chem. Res. 2017, 50, 733–739. [Google Scholar] [CrossRef] [PubMed]
- Xu, K.; Lee, F.; Gao, S.J.; Chung, J.E.; Yano, H.; Kurisawa, M. Injectable hyaluronic acid-tyramine hydrogels incorporating interferon-α2a for liver cancer therapy. J. Control. Release 2013, 166, 203–210. [Google Scholar] [CrossRef] [PubMed]
- Lee, H.M.; Larson, D.R.; Lawrence, D.S. Illuminating the chemistry of life: Design, synthesis, and applications of “Caged” and related photoresponsive compounds. ACS Chem. Biol. 2009, 4, 409–427. [Google Scholar] [CrossRef] [PubMed]
- Kirschner, C.M.; Anseth, K.S. Hydrogels in healthcare: From static to dynamic material microenvironments. Acta Mater. 2013, 61, 931–944. [Google Scholar] [CrossRef] [PubMed] [Green Version]
- Hoare, T.R.; Kohane, D.S. Hydrogels in drug delivery: Progress and challenges. Polymer 2008, 49, 1993–2007. [Google Scholar] [CrossRef] [Green Version]
- Lin, C.C.; Metters, A.T. Metal-chelating affinity hydrogels for sustained protein release. J. Biomed. Mater. Res. A 2007, 83, 954–964. [Google Scholar] [CrossRef] [PubMed]
- Johnson, N.R.; Wang, Y. Controlled delivery of heparin-binding EGF-like growth factor yields fast and comprehensive wound healing. J. Control. Release 2013, 166, 124–129. [Google Scholar] [CrossRef] [PubMed] [Green Version]
- Taylor, S.J.; McDonald, J.W., 3rd; Sakiyama-Elbert, S.E. Controlled release of neurotrophin-3 from fibrin gels for spinal cord injury. J. Control. Release 2004, 98, 281–294. [Google Scholar] [CrossRef] [PubMed]
- Jha, A.K.; Yang, W.; Kirn-Safran, C.B.; Farach-Carson, M.C.; Jia, X. Perlecan domain I-conjugated, hyaluronic acid-based hydrogel particles for enhanced chondrogenic differentiation via BMP-2 release. Biomaterials 2009, 30, 6964–6975. [Google Scholar] [CrossRef] [PubMed] [Green Version]
- Tian, B.; Liu, J.; Dvir, T.; Jin, L.; Tsui, J.H.; Qing, Q.; Suo, Z.; Langer, R.; Kohane, D.S.; Lieber, C.M. Macroporous nanowire nanoelectronic scaffolds for synthetic tissues. Nat. Mater. 2012, 11, 986–994. [Google Scholar] [CrossRef] [PubMed] [Green Version]
- Riley, M.K.; Vermerris, W. Recent advances in nanomaterials for gene delivery-A review. Nanomaterials 2017, 7, 94. [Google Scholar] [CrossRef] [PubMed]
- Rahman, M.; Neff, D.; Green, N.; Norton, M.L. DNA origami reorganizes upon interaction with graphite: implications for high-resolution DNA directed protein patterning. Nanomaterials 2016, 6, 196. [Google Scholar] [CrossRef] [PubMed]
- Shen, B.; Tapio, K.; Linko, V.; Kostiainen, M.A.; Toppari, J.J. Metallic nanostructures based on DNA nanoshapes. Nanomaterials 2016, 6, 146. [Google Scholar] [CrossRef] [PubMed]
- Finch, A.S.; Anton, C.M.; Jacob, C.M.; Proctor, T.J.; Stratis-Cullum, D.N. Assembly of DNA architectures in a non-aqueous solution. Nanomaterials 2012, 2, 275–285. [Google Scholar] [CrossRef] [PubMed]
- Liu, H.Y.; Cao, T.Y.; Xu, Y.; Dong, Y.C.; Liu, D.S. Tuning the mechanical properties of a DNA hydrogel in three phases based on ATP aptamer. Int. J. Mol. Sci. 2018, 19, 1633. [Google Scholar] [CrossRef] [PubMed]
- Shao, Y.; Jia, H.Y.; Cao, T.Y.; Liu, D.S. Supramolecular hydrogels based on DNA self-assembly. Acc. Chem. Res. 2017, 50, 659–668. [Google Scholar] [CrossRef] [PubMed]
- Rinker, S.; Ke, Y.G.; Liu, Y.; Chhabra, R.; Yan, H. Self-assembled DNA nanostructures for distance-dependent multivalent ligand-protein binding. Nature Nanotechnol. 2008, 3, 418–422. [Google Scholar] [CrossRef] [PubMed]
- Jayasena, S.D. Aptamers: An emerging class of molecules that rival antibodies in diagnostics. Clin. Chem. 1999, 45, 1628–1650. [Google Scholar] [PubMed]
- Soontornworajit, B.; Zhou, J.; Shaw, M.T.; Fan, T.H.; Wang, Y. Hydrogel functionalization with DNA aptamers for sustained PDGF-BB release. Chem. Commun. 2010, 46, 1857–1859. [Google Scholar] [CrossRef] [PubMed]
- Soontornworajit, B.; Zhou, J.; Snipes, M.P.; Battig, M.R.; Wang, Y. Affinity hydrogels for controlled protein release using nucleic acid aptamers and complementary oligonucleotides. Biomaterials 2011, 32, 6839–6849. [Google Scholar] [CrossRef] [PubMed]
- Battig, M.R.; Soontornworajit, B.; Wang, Y. Programmable release of multiple protein drugs from aptamer-functionalized hydrogels via nucleic acid hybridization. J. Am. Chem. Soc. 2012, 134, 12410–12413. [Google Scholar] [CrossRef] [PubMed]
- Soontornworajit, B.; Zhou, J.; Wang, Y. A hybrid particle–hydrogel composite for oligonucleotide-mediated pulsatile protein release. Soft Matter 2010, 6, 4255–4261. [Google Scholar] [CrossRef]
- Wang, Z.; Xia, J.; Cai, F.; Zhang, F.; Yang, M.; Bi, S.; Gui, R.; Li, Y.; Xia, Y. Aptamer-functionalized hydrogel as effective anti-cancer drugs delivery agents. Colloid. Surface B. 2015, 134, 40–46. [Google Scholar] [CrossRef] [PubMed]
- Nishida, Y.; Ohtsuki, S.; Araie, Y.; Umeki, Y.; Endo, M.; Emura, T.; Hidaka, K.; Sugiyama, H.; Takahashi, Y.; Takakura, Y.; et al. Self-assembling DNA hydrogel-based delivery of immunoinhibitory nucleic acids to immune cells. Nanomed. Nanotechnol. Biol. Med. 2016, 12, 123–130. [Google Scholar] [CrossRef] [PubMed]
- Ren, J.; Hu, Y.; Lu, C.-H.; Guo, W.; Aleman-Garcia, M.A.; Ricci, F.; Willner, I. pH-responsive and switchable triplex-based DNA hydrogels. Chem. Sci. 2015, 6, 4190–4195. [Google Scholar] [CrossRef] [PubMed] [Green Version]
- Wei, B.; Cheng, I.; Luo, K.Q.; Mi, Y. Capture and release of protein by a reversible DNA-induced sol-gel transition system. Angew. Chem. Int. Ed. Engl. 2008, 47, 331–333. [Google Scholar] [CrossRef] [PubMed]
- Chen, N.; Zhang, Z.; Soontornworajit, B.; Zhou, J.; Wang, Y. Cell adhesion on an artificial extracellular matrix using aptamer-functionalized PEG hydrogels. Biomaterials 2012, 33, 1353–1362. [Google Scholar] [CrossRef] [PubMed]
- Li, S.; Chen, N.; Zhang, Z.; Wang, Y. Endonuclease-responsive aptamer-functionalized hydrogel coating for sequential catch and release of cancer cells. Biomaterials 2013, 34, 460–469. [Google Scholar] [CrossRef] [PubMed]
- Lai, J.; Jiang, P.; Gaddes, E.R.; Zhao, N.; Abune, L.; Wang, Y. Aptamer-functionalized hydrogel for self-programmed protein release via sequential photoreaction and hybridization. Chem. Mater. 2017, 29, 5850–5857. [Google Scholar] [CrossRef] [PubMed]
- Zhang, Z.; Du, J.; Li, Y.; Wu, J.; Yu, F.; Chen, Y. An aptamer-patterned hydrogel for the controlled capture and release of proteins via biorthogonal click chemistry and DNA hybridization. J. Mater. Chem. B 2017, 5, 5974–5982. [Google Scholar] [CrossRef]
- Jin, C.; Zheng, J.; Li, C.; Qiu, L.; Zhang, X.; Tan, W. Aptamers selected by cell-SELEX for molecular imaging. J. Mol. Evol. 2015, 81, 162–171. [Google Scholar] [CrossRef] [PubMed]
- Um, S.H.; Lee, J.B.; Park, N.; Kwon, S.Y.; Umbach, C.C.; Luo, D. Enzyme-catalysed assembly of DNA hydrogel. Nat. Mater. 2006, 5, 797–801. [Google Scholar] [CrossRef] [PubMed]
- Nishikawa, M.; Ogawa, K.; Umeki, Y.; Mohri, K.; Kawasaki, Y.; Watanabe, H.; Takahashi, N.; Kusuki, E.; Takahashi, R.; et al. Injectable, self-gelling, biodegradable, and immunomodulatory DNA hydrogel for antigen delivery. J. Control. Release 2014, 180, 25–32. [Google Scholar] [CrossRef] [PubMed] [Green Version]
- Lee, J.B.; Peng, S.; Yang, D.; Roh, Y.H.; Funabashi, H.; Park, N.; Rice, E.J.; Chen, L.; Long, R.; Wu, M.; et al. A mechanical metamaterial made from a DNA hydrogel. Nat. Nanotechnol. 2012, 7, 816–820. [Google Scholar] [CrossRef] [PubMed]
- Bock, L.C.; Griffin, L.C.; Latham, J.A.; Vermaas, E.H.; Toole, J.J. Selection of single-stranded DNA molecules that bind and inhibit human thrombin. Nature 1992, 355, 564–566. [Google Scholar] [CrossRef] [PubMed]
- Zhang, Y.; Bai, Y.; Feng, F.; Shuang, S. A graphene oxide-based fluorescent aptasensor for alpha-fetoprotein detection. Anal. Methods 2016, 8, 6131–6134. [Google Scholar] [CrossRef]
- Cheng, E.; Xing, Y.; Chen, P.; Yang, Y.; Sun, Y.; Zhou, D.; Xu, L.; Fan, Q.; Liu, D. A pH-triggered, Fast-responding DNA hydrogel. Angew. Chem. Int. Ed. 2009, 48, 7796–7799. [Google Scholar] [CrossRef]
- Xing, Y.; Cheng, E.; Yang, Y.; Chen, P.; Zhang, T.; Sun, Y.; Yang, Z.; Liu, D. Self-assembled DNA hydrogels with designable thermal and enzymatic responsiveness. Adv. Mater. 2011, 23, 1117–1121. [Google Scholar] [CrossRef] [PubMed]
- Chung, H.-J.; Kim, J.-T.; Kim, H.-J.; Kyung, H.-W.; Katila, P.; Lee, J.-H.; Yang, T.-H.; Yang, Y.-I.; Lee, S.-J. Epicardial delivery of VEGF and cardiac stem cells guided by 3-dimensional PLLA mat enhancing cardiac regeneration and angiogenesis in acute myocardial infarction. J. Control. Release 2015, 205, 218–230. [Google Scholar] [CrossRef] [PubMed]
- Farhadi, M.R.; Capelle, H.H.; Erber, R.; Ullrich, A.; Vajkoczy, P. Combined inhibition of vascular endothelial growth factor and platelet-derived growth factor signaling: Effects on the angiogenesis, microcirculation, and growth of orthotopic malignant gliomas. J. Neurosurg. 2005, 102, 363–370. [Google Scholar] [CrossRef] [PubMed]
- He, X.; Wei, B.; Mi, Y. Aptamer based reversible DNA induced hydrogel system for molecular recognition and separation. Chem. Commun. 2010, 46, 6308–6310. [Google Scholar] [CrossRef] [PubMed]
- Strehlitz, B.; Nikolaus, N.; Stoltenburg, R. Protein detection with aptamer biosensors. Sensors 2008, 8, 4296–4307. [Google Scholar] [CrossRef] [PubMed]
- Delport, F.; Pollet, J.; Janssen, K.; Verbruggen, B.; Knez, K.; Spasic, D.; Lammertyn, J. Real-time monitoring of DNA hybridization and melting processes using a fiber optic sensor. Nanotechnology 2012, 23, 065503. [Google Scholar] [CrossRef] [PubMed]
- Fu, Y.; Xu, K.; Zheng, X.; Giacomin, A.J.; Mix, A.W.; Kao, W.J. 3D cell entrapment in crosslinked thiolated gelatin-poly (ethylene glycol) diacrylate hydrogels. Biomaterials 2012, 33, 48–58. [Google Scholar] [CrossRef] [PubMed]
- Nguyen, E.H.; Zanotelli, M.R.; Schwartz, M.P.; Murphy, W.L. Differential effects of cell adhesion, modulus and VEGFR-2 inhibition on capillary network formation in synthetic hydrogel arrays. Biomaterials 2014, 35, 2149–2161. [Google Scholar] [CrossRef] [PubMed] [Green Version]
Figure 1.
Principle diagram of aptamer-functionalized DNA hydrogel formation. The X-shaped DNA (X-DNA), L-shaped DNA (L-DNA), and single-stranded DNA aptamer (S-DNA) were cross-linked by hybridizing their “sticky ends” (marked in black). The “sticky ends” of the X-DNA were complementary to those of the L-DNA and S-DNA.
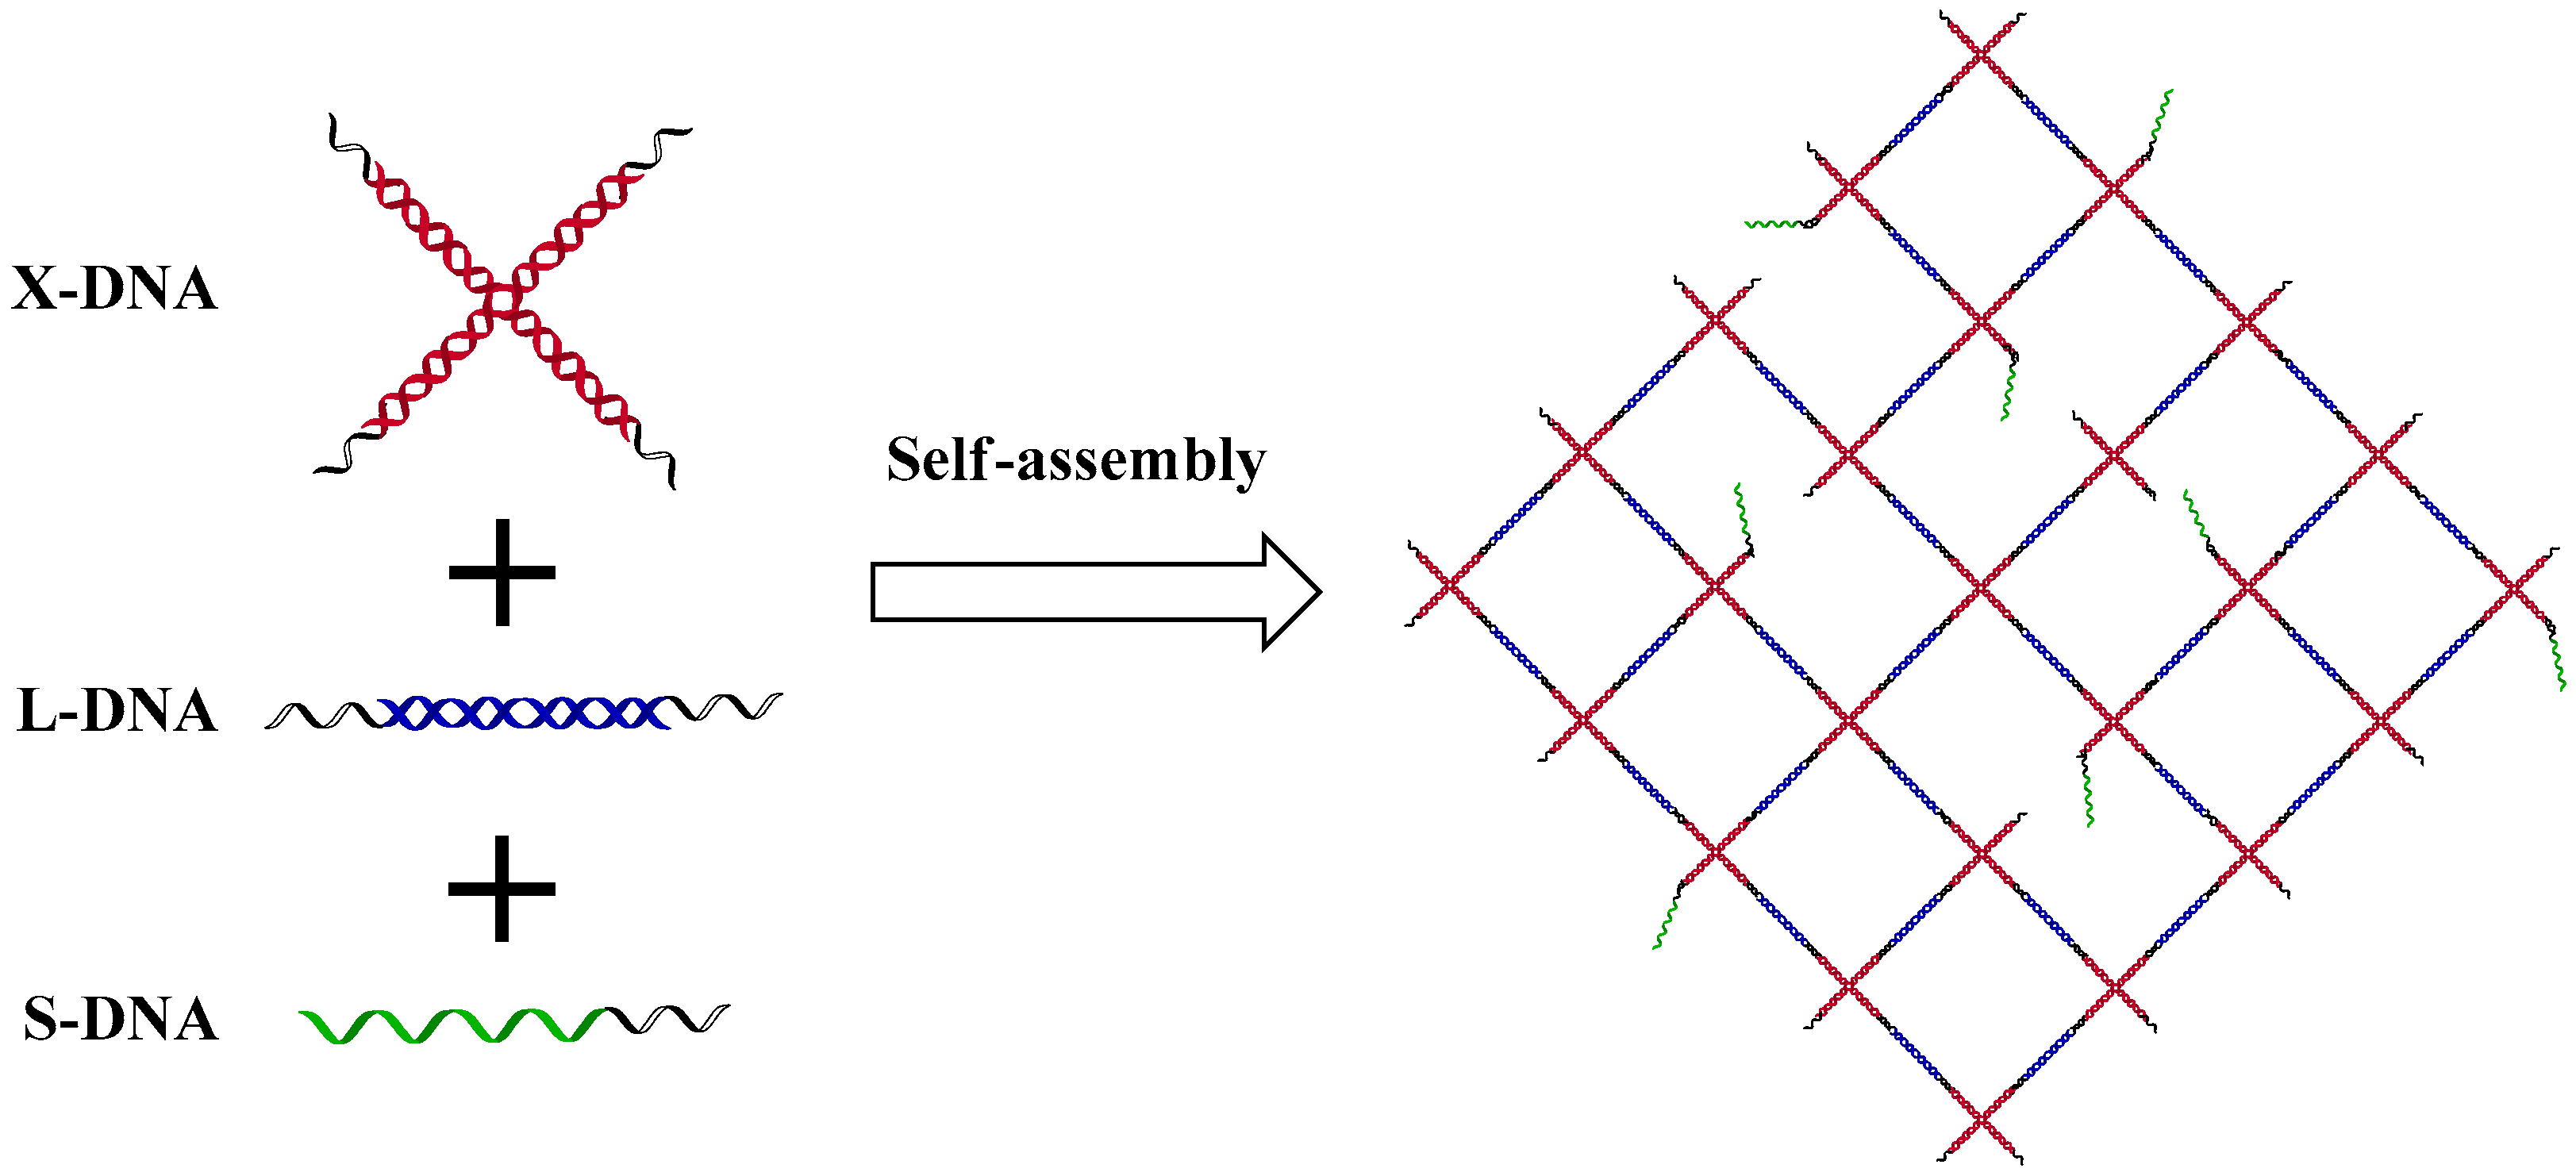
Figure 2.
(A) The rheological property of DNA hydrogels with different concentrations (400 μM, 500 μM, 600 μM, 700 μM, and 800 μM for X-DNA, the molar ratio of X-DNA and L-DNA is fixed at 1:2). (B) The storage and loss modulus of DNA hydrogel (X: 400 μM and L: 800 μM) with S-DNA or without S-DNA. (C) The SEM image of DNA hydrogel after freeze-drying (X: 400 μM and L: 800 μM). (D) Fluorescent images of hydrogels (X: 400 μM and L: 800 μM) without S-DNA, with carboxyfluorescein (FAM)-labeled S-DNA, and with FAM-labeled S-DNA with scrambled “sticky ends”.

Figure 3.
(A) The thrombin (TB) capture capabilities of hydrogels (X-DNA 400 μM, L-DNA 800 μM) with or without aptamers at different incubation time. The concentration of S-DNA was fixed at 200 μM (the volume is 1 μL). The molar ratio of TB to aptamers was kept at 2:1. (B) The capture capability of two building blocks at different concentrations. For normalization, the capture capability of 800 μM of X-DNA and 1600 μM of L-DNA (the control) is regarded as one. The concentration of S-DNA was fixed at 200 μM (the volume is 1 μL) in the hydrogel. The molar ratio of TB to aptamers was kept at 1:1. (C) The influence of the thrombin amount in the absorption medium on the TB capture capability of the hydrogel (X-DNA 400 μM, L-DNA 800 μM). When the molar ratio of TB to aptamers was 0.25:1, the capture capability was regarded as one. The concentration of S-DNA was fixed at 200 μM (the volume is 1 μL). (D) Relationship between the aptamer concentrations and the capture capability of the hydrogels. The hydrogel’s capture capability without an aptamer (aptamer 0 nmol) was represented as one (X-DNA 400 μM, L-DNA 800 μM). The concentration of TB was fixed at 7.5 μM (the volume is 100 μL). The samples with obviously higher normalized capture than the control group (the normalized capture = one) were noted with * (p < 0.05).

Figure 4.
(A) Thrombin release from different hydrogels in the absence of the CSs. (B) Fluorescent images of hydrogel (with FAM-labeled S-DNA) in the existence of 4′-(4-dimethylaminophenylazo) (DABCYL)-labeled CS15 at different reaction times: (a) 5 min, (b) 2 h, (c) 4 h, and (d) 6 h. (e) Cumulative release of TB at different reaction times. The molar ratio of complementary sequences (CSs) to S-DNA was fixed at 1:1.

Figure 5.
Dissociation dynamics of thrombin triggered by CS15 for different CSs to aptamer ratios: (A) CSs:Aptamer = 1:5, (B) CSs:Aptamer = 2:5, (C) CSs:Aptamer = 3:5, (D) CSs:Aptamer = 4:5 and (E) CSs:Aptamer = 1:1. (F) The concentrations of TB were calculated using the fitting formula (i.e., In(C∞ − Ct)/(C∞ − C0) = kt) to get the rate constants (the slopes of the linear curves) of thrombin dissociation.
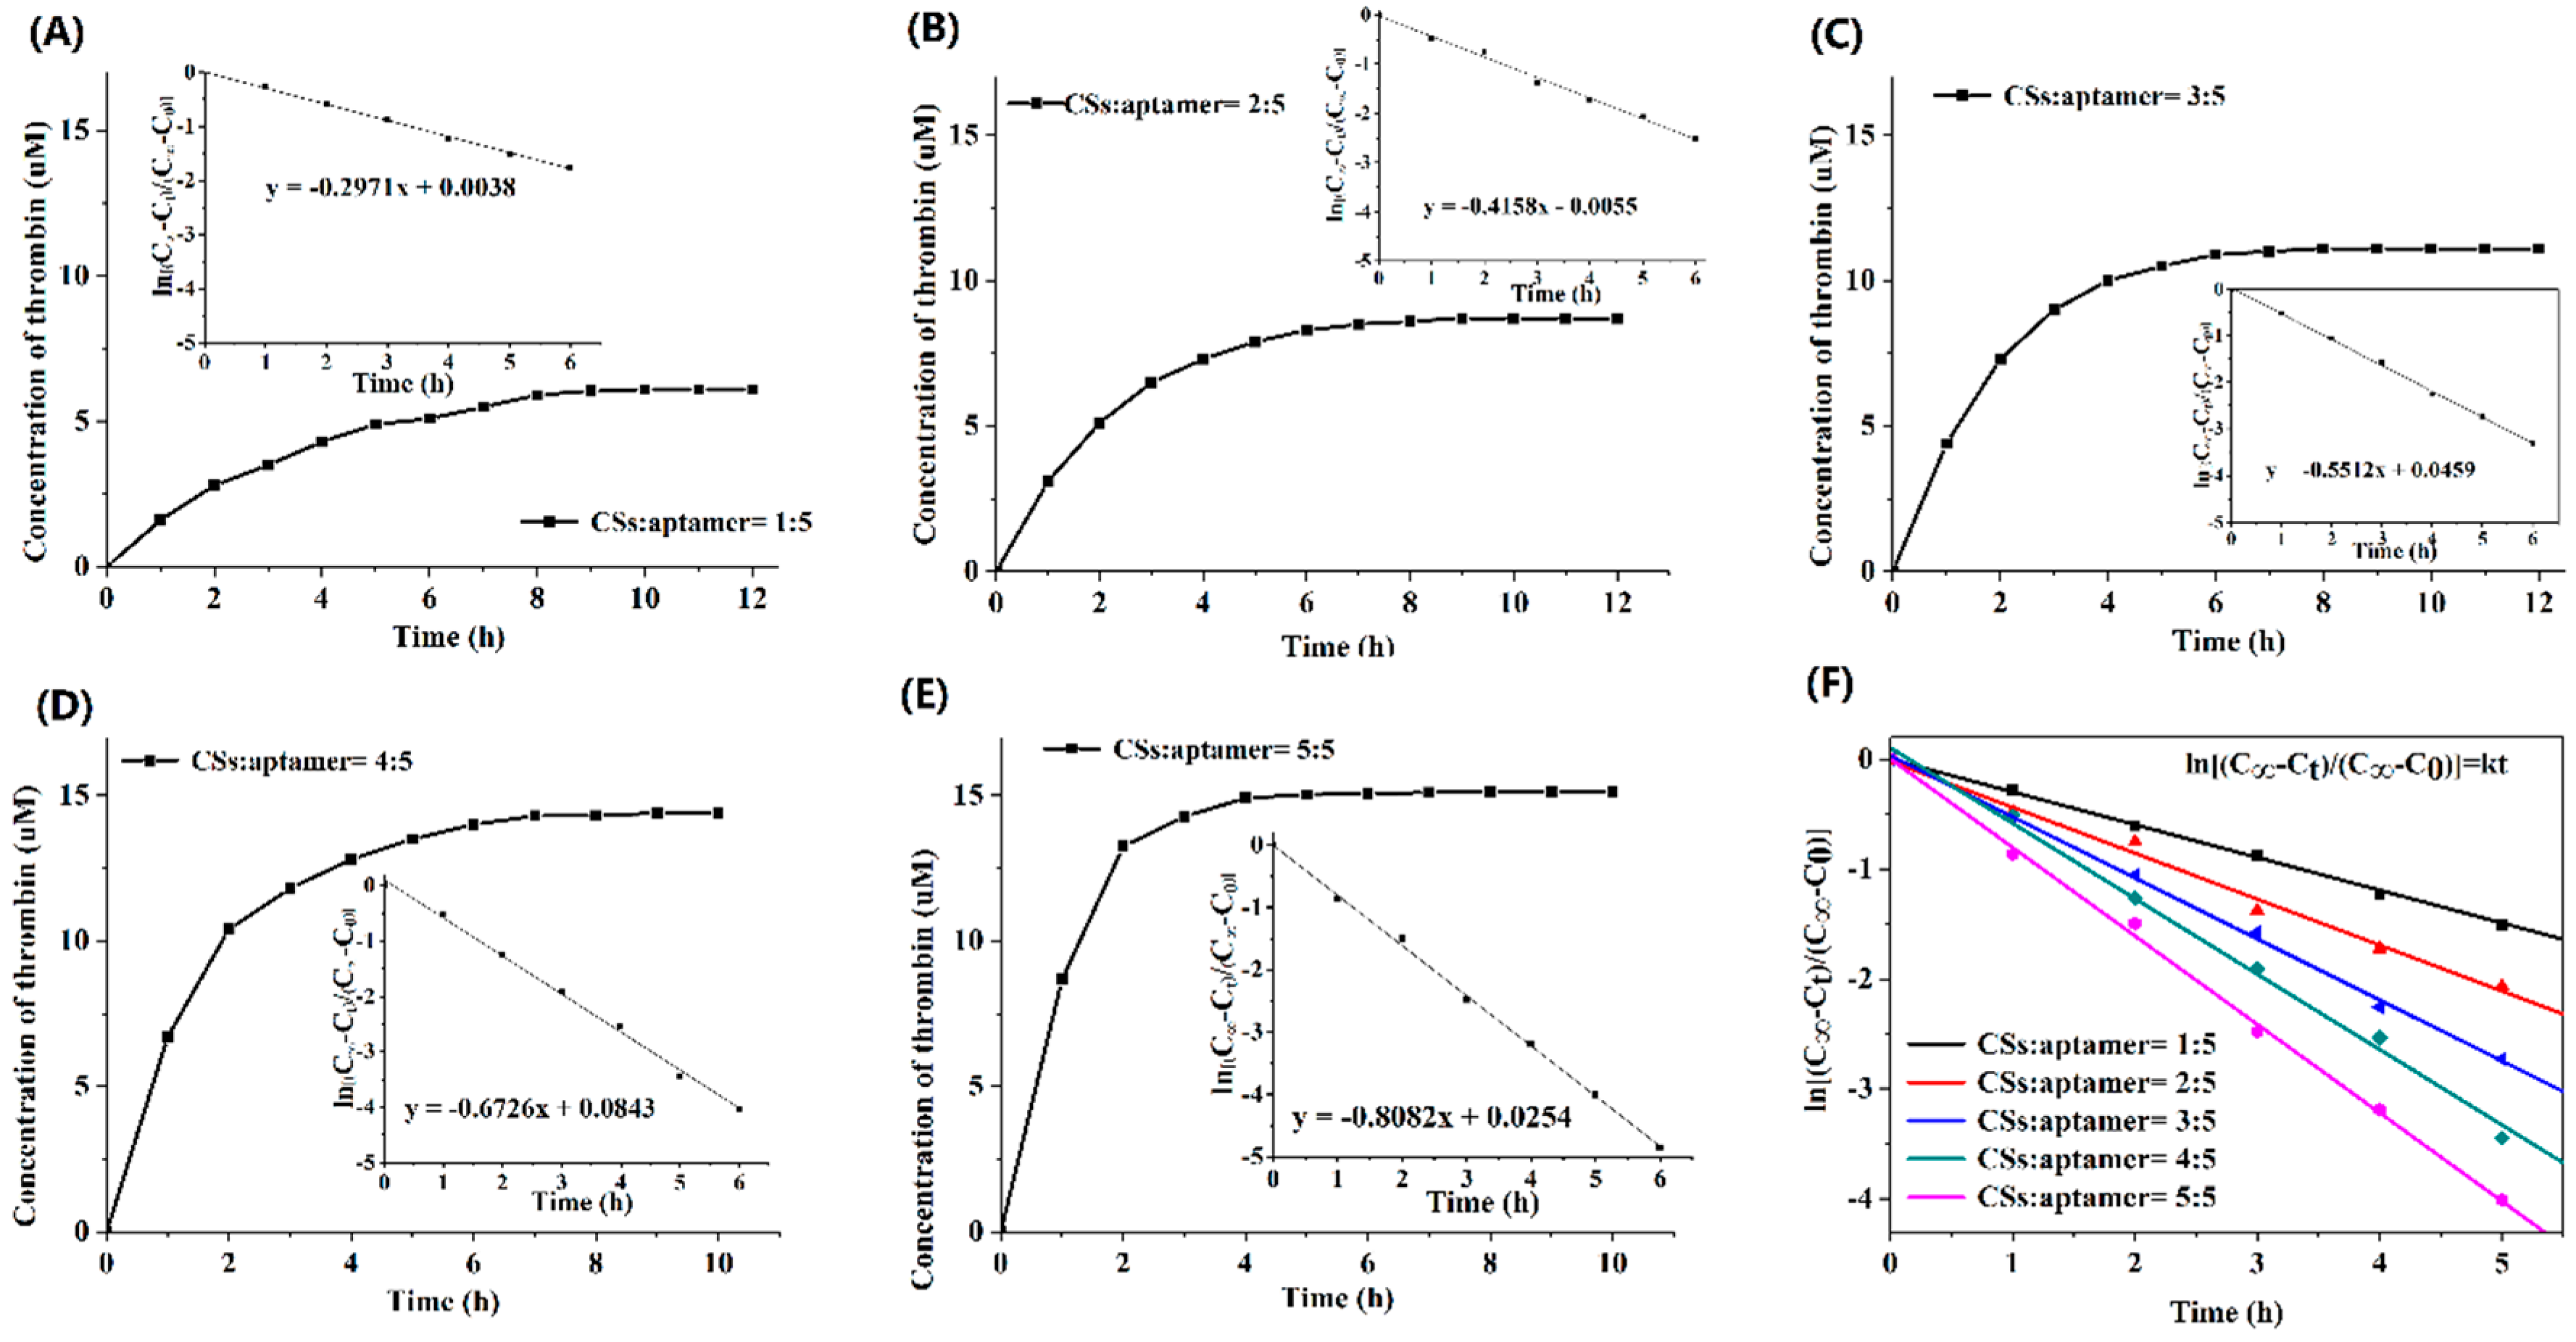
Figure 6.
(A) Effect of molar ratio of CS15 to aptamers on thrombin release. The concentration of aptamer is fixed at 200 μM (the volume is 1 μL). The total release time was 6 h. Here, CSs:aptamer = 0 was represented as the control group. The experimental group with significantly higher cumulative release than the control group is noted with *, (p < 0.05). (B) Effect of lengths of CSs on the release amount of thrombin. The normalized release of TB triggered by CSs (bp 0) is regarded as 1. The normalized release with obviously more than the CS (bp 0) is noted with *, (p < 0.05). (C) Profiles of thrombin wise-stage release in the release medium regulated with or without CS15 at different triggering times (0 h and 12 h).

Figure 7.
Profiles of hourly wise-stage release of thrombin in human serum with or without CS15 at different triggering times (0 h, 48 h, 96 h, and 144 h).
Figure 7.
Profiles of hourly wise-stage release of thrombin in human serum with or without CS15 at different triggering times (0 h, 48 h, 96 h, and 144 h).
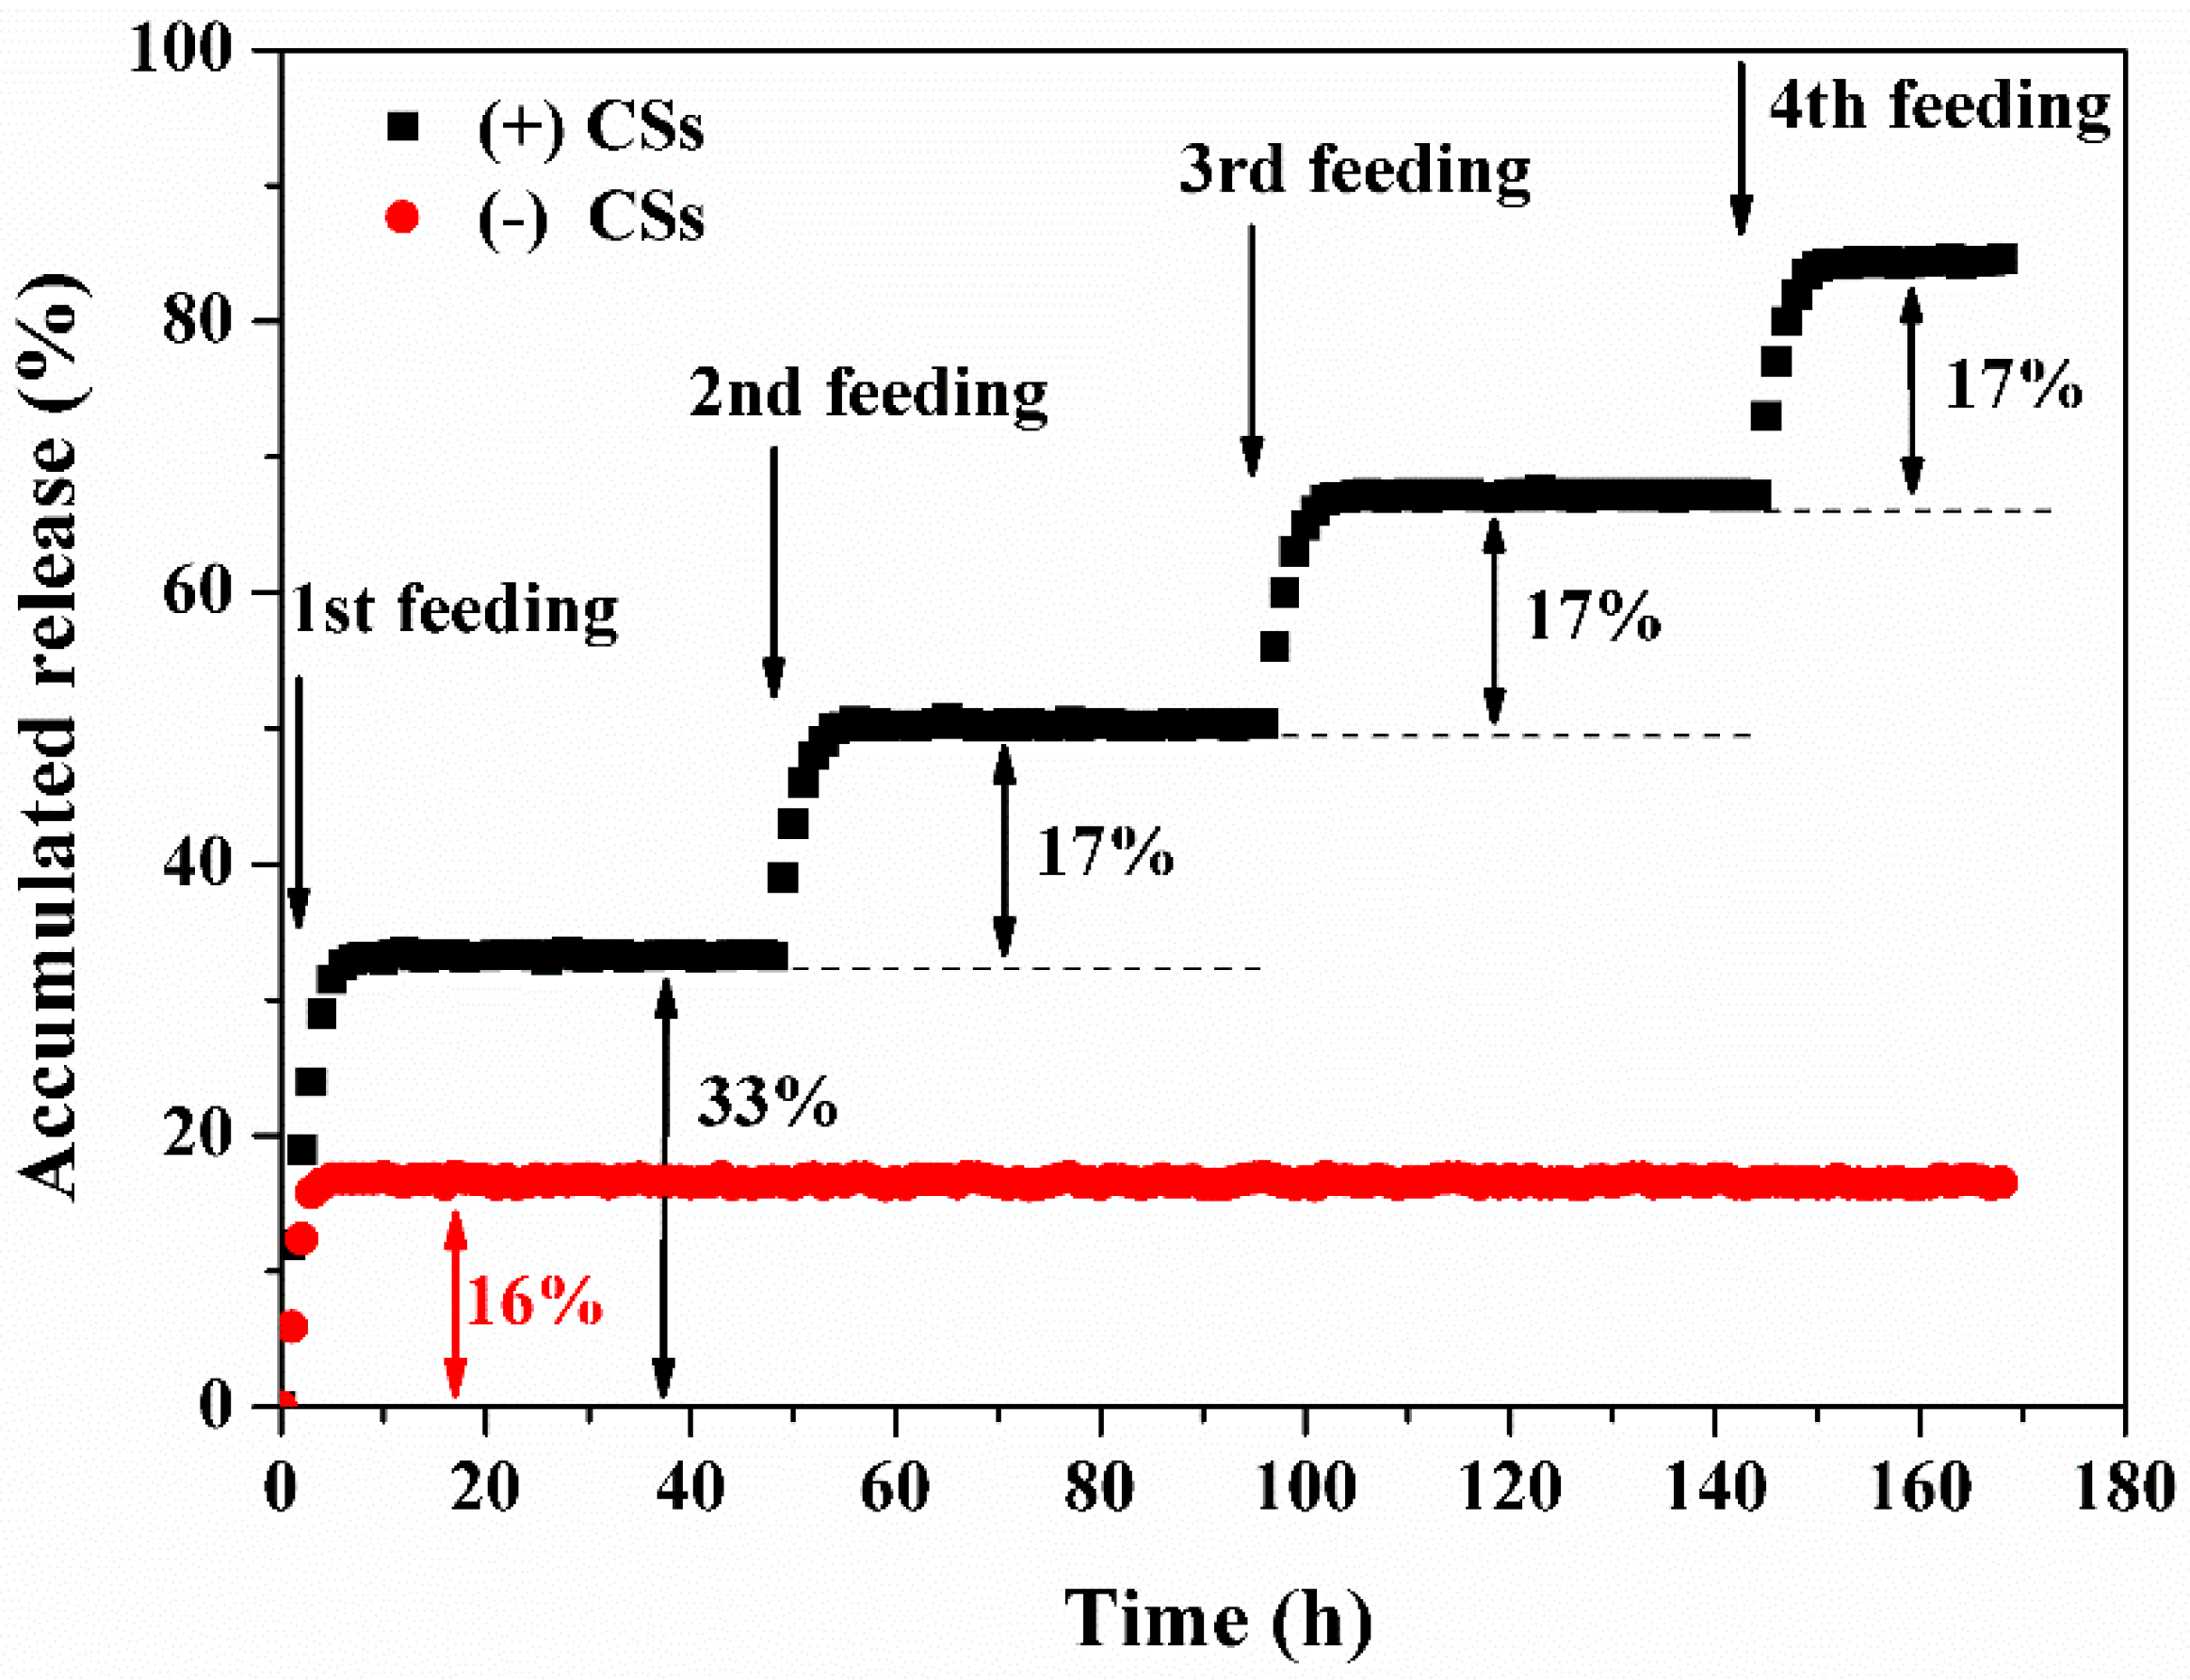
Figure 8.
(A) Proliferation of the RAW 264.7 cells cultured on the surfaces of the DNA hydrogels and the culture plates (without hydrogel). *p < 0.05. (B) Viability and morphology of the RAW264.7 cells cultured on the surfaces of the culture plates (a) and DNA hydrogels (b) for 24 h (green cells are live, and red cells are dead; the scale bar is 200 μm).

© 2018 by the authors. Licensee MDPI, Basel, Switzerland. This article is an open access article distributed under the terms and conditions of the Creative Commons Attribution (CC BY) license (http://creativecommons.org/licenses/by/4.0/).
Share and Cite
MDPI and ACS Style
Liu, C.; Han, J.; Pei, Y.; Du, J. Aptamer Functionalized DNA Hydrogel for Wise-Stage Controlled Protein Release. Appl. Sci. 2018, 8, 1941. https://doi.org/10.3390/app8101941
AMA Style
Liu C, Han J, Pei Y, Du J. Aptamer Functionalized DNA Hydrogel for Wise-Stage Controlled Protein Release. Applied Sciences. 2018; 8(10):1941. https://doi.org/10.3390/app8101941
Chicago/Turabian StyleLiu, Chen, Jialun Han, Yuxuan Pei, and Jie Du. 2018. "Aptamer Functionalized DNA Hydrogel for Wise-Stage Controlled Protein Release" Applied Sciences 8, no. 10: 1941. https://doi.org/10.3390/app8101941
Note that from the first issue of 2016, this journal uses article numbers instead of page numbers. See further details here.