Extraction Optimization of Phenolics and Antioxidants from Black Goji Berry by Accelerated Solvent Extractor Using Response Surface Methodology


1
Food Science and Technology Program, Division of Science and Technology, Beijing Normal University–Hong Kong Baptist University United International College, Zhuhai 519087, China
2
Analysis and Testing Center, Hebei Normal University of Science and Technology, Qinhuangdao 066600, China
*
Authors to whom correspondence should be addressed.
Appl. Sci. 2018, 8(10), 1905; https://doi.org/10.3390/app8101905
Submission received: 23 June 2018
/
Revised: 13 September 2018
/
Accepted: 28 September 2018
/
Published: 13 October 2018
(This article belongs to the Section Chemical and Molecular Sciences)
Abstract
:This study aims to provide fundamental knowledge for the use of black goji berry and determine the optimum process parameters that produce maximum phenolics from black goji berry through accelerated solvent extraction (ASE). The optimal extractions of phenolics and antioxidants from black goji were explored via the ASE techniques, applying the response surface methodology (RSM) design. After reaching the optimal conditions for single factors, the optimal ASE extraction conditions were found through a total of 17 runs following the Box-Behnken design (BBD) from RSM. The maximum yield of total phenolic content (TPC) was 17.92 mg GAE/g under the best extraction conditions: an extraction temperature of 89.38 °C, an ethanol concentration of 70% and an extraction time of 13 min. This study indicates that the optimal extraction conditions could serve as the scientific basis for scaled-up industrial production. Black goji berry could be a viable source of nutraceuticals due to the abundance of antioxidant and phenolic substances.
1. Introduction
Black goji berry from the Qinghai-Tibet Plateau is an abundant source of various nutrients—proteins, superoxide dismutase, vitamins, minerals, amino acids, polysaccharides [1]. Therefore, black goji berry brings immeasurable economic benefits and development value. Specifically, there is a large content of purple pigment (up to 3.88 mg/g in fresh fruits), which is a rare edible natural anthocyanin resource. It is expected to become a colorant for cosmetics, pharmaceuticals, beverages, and food [2]. In addition, it contains a variety of trace elements, confirming good medicinal plant resources. Meanwhile, black goji berry combines 18 essential amino acids and free amino acids. The amino acids accounted for about 50% of the total, making black goji berry a preferred high-quality protein [3]. More importantly, a natural wild fruit, black goji berry contains up to 5.04% of oligomeric proantho-cyanidins (OPC), which is 10 and 18 times higher than that in Chinese wolfberry and natural blueberry, respectively [4]. Black goji berry is an essential natural antioxidant because OPC enhances the immune system by 22 and 25 times compared to vitamins C and E, respectively [5]. Therefore, black goji berry is considered to be a novel source of nutraceuticals.
An antioxidant, as a molecule, prevents other molecules’ oxidation which is a chemical reaction that can generate free radicals, resulting in chain reactions that may impose harm to cells. However, antioxidants such as ascorbic acid or thiols can terminate these chain reactions [6]. Intake of antioxidants from fruit and vegetables protects humans from cancers. Phenolic compounds are among important antioxidants found in vegetable food and possess the major organoleptic characteristics (color and taste) of beverages and plant-derived food [7]. Our work will conduce to knowledge about the ideal conditions for obtaining the maximum yields of phenolics and antioxidants from black goji berry. The results may find applications in the development of industrial extraction processes.
Mathematical models for optimizing extraction processes of target compounds are crucial in the field of natural product chemistry to effectuate economical design of actual operation [8]. Currently, the response surface methodology (RSM), which solves both linear and non-linear multivariate regression problems, is a useful tool for establishing a model to mimic and optimize the whole extraction process [9,10].
For phenolics and antioxidant extraction, many methods have been applied, such as ultrasound-assisted extraction (UAE), microwave-assisted extraction (MAE), and reflux extraction. However, there is no report, to the best of our knowledge, on the phenolics and antioxidants extraction from black goji berry with the help of the accelerated solvent extraction (ASE) method. ASE can automatically extract solid and semisolid samples quickly by applying common solvents. The temperature of the ASE is far above the boiling point of most solvents, whereas the high pressure keeps a solvent in a liquid phase. Hence, the ASE technique possibly achieves automation, low solvent volume and reduced extraction properties [7].
The objective of the current study is to extract the maximum amount of total phenolics content (TPC) from black goji berry by means of the ASE technique. The RSM design was used to establish the model and optimize the extraction conditions. Under the optimal extraction conditions, antioxidant capacity tests of black goji berry were also performed with the 2,2′-azino-bis-(3-ethylbenzothiazoline-6-sulfonic acid) (ABTS) radical scavenging assay, the DPPH free radical scavenging capacity assay, and the ferric reducing antioxidant capacity assay.
2. Materials and Methods
2.1. Materials
Black goji berry (Lycium ruthenicum) was purchased from Qaidam Basin in Qinghai-Tibet Plateau in Qinghai Province, China.
2.2. Chemicals
The following chemicals of analytical grade were used in the experiments: methanol; ethanol; acetone; acetic acid; sodium acerate·3H2O; glacial acetic acid; 2,4,6-tri(2-pyridyl)-s-triazine (TPTZ); ferric chloride (FeCl3·6H2O); ferrous sulfate (FeSO4·7H2O); sodium nitrite (NaNO2); aluminum chloride hexahydrate (AlCl3·6H2O); catechin C15H14O6; 2-diphenyl-1-picryhydrazyl (DPPH); 6-hydroxy-2,5,7,8-tetramethlchroman-2-carboxylic acid (Trolox); Folin-Ciocalteu reagent; sodium carbonate; gallic acid; 2,2′-azino-bis-(3-ethylbenzothiazoline-6-sulfonic acid) (ABTS); potassium persulfate (K2S2O8); phosphate buffer saline (PBS).
2.3. Sample Preparation
The fruit stems of black goji berry were removed by hand and then cut into tiny pieces by a grinder. After that, all samples were put into sealed bags and then kept in a drying pot.
2.4. Accelerated Solvent Extraction
An ASE unit APLE-1000 (Beijing Titan Instrument Co. Ltd., Beijing, China) was used for phenolics and antioxidants extraction. Nitrogen was used to assist the pneumatic system and to purge the extraction cells. Pieces of limb-less black goji berry samples (1.0 g) were mixed with diatomite and submitted to extraction. The mixture was crammed with a 10 mL pressure-resistant stainless steel extraction cell and then was extracted with a given ethanol concentration that ranged from 50 to 90% under the extraction pressure of 10 MPa. The number of cycles was 2, and the extraction temperature was kept for a given value (ranging from 50 to 100 °C) for a set of extraction times (3 to 13 min). The extract was used for further study.
2.5. Determination of TPC
The phenolics substances in the extract were determined by applying the Folin-Ciocalteu phenol assay [11] with a slight modification [12], in which gallic acid played a role of a standard. The absorbance was measured at 765 nm by a spectrophotometer (UV160, Shimadzu, Kyoto, Japan). The TPC was presented as milligrams gallic acid equivalents per gram sample (mg GAE/g). The linearity range of the gallic acid standard curve was 10 to 500 μg/mL (R2 = 0.9998).
2.6. Determination of Total Flavonoids Content
In total flavonoids content (TFC) determination, (+)-catechin was applied as a standard, and the absorbance was measured at 510 nm by visible spectrophotometer [6]. TFC was presented as (+)-catechin equivalents (mg CAE/g) with the calibration curve of (+)-catechin which had a linearity range from 10 to 500 μg/mL (R2 = 0.9998).
2.7. Determination of Monomeric Anthocyanin Content
The pH differential colorimetric method was applied in the determination of monomeric anthocyanin content (MAC), which was presented as cyanidin-3-glucoside equivalents (CyE) in milligrams per gram of a sample [13]. Compared with other colorimetric methods, in this study the absorbance should be measured at both 520 nm and 700 nm [6]. Total anthocyanin was determined from the difference between absorbance at 520 and 700 nm using Equation below (1):
Absorbance = (A510 nm pH 1.0 − A700 nm pH 1.0) − (A510 nm pH 4.5 − A700 nm pH 4.5)
2.8. ABTS Radical Scavenging Assay
In the determination of ABTS, Trolox was a standard [14], while the extraction solvent was a negative control [6]. After 6 min of water incubation, the samples’ absorbance was measured at 734 nm by using a visible spectrophotometer. Besides, the free radical scavenging activity was presented as μmole of Trolox equivalents per gram of black goji berry (μmol TE/g) which had a linearity range from 5 to 100 μM (R2 = 0.9998). Thereby, the below equations were applied to explore the scavenging rate of the ABTS and ABTS values, as shown in Equation (2):
% scavenging rate = (Acontrol − Asample)/Acontrol × 100%
2.9. DPPH Free Radical Scavenging Capacity Assay
Similar to ABTS assay, in the DPPH free radical scavenging capacity analysis, Trolox was used as a standard, and a negative control was also an extraction solvent [6]. In addition, the absorbance was measured at 517 nm. The free radical scavenging activity was presented as μmole of Trolox equivalents per gram of black goji berry (μmol TE/g) which had a linearity range from 50 to 500 μM (R2 = 0.9989). After that, the scavenging rate of DPPH can be calculated from the following equations and the standard curve as offered below and shown in Equation (3):
% scavenging rate = (Acontrol − Asample)/Acontrol × 100%
2.10. Ferric Reducing Antioxidant Power (FRAP) Assay
In the FRAP assay, ferrous sulfate (FeSO4·7H2O) works as a standard, and the absorbance was measured at 593 nm [6]. FRAP was presented as ferrous sulfate (mmol of Fe2+E/100 g) with the calibration curve of ferrous sulfate which had a linearity range from 0.1 to 0.8 mM (R2 = 0.9998).
2.11. Experimental Design
The preliminary experiments (single factor-multiple levels) were performed to determine the range of the ASE variables. Firstly, the ethanol concentration (50–90%), the extraction time (3–13 min) and the extraction temperature (50–100 °C) were determined via a single test, and then the optimal extraction conditions of total phenolics from black goji were acquired through a three-variable-three-level Box-Behnken design (BBD) design. In this experiment, 17 runs were designed (Table 1), and each one was conducted in triplicate. To determine the average value of the TPC, the regression analysis was performed for the experimental data fitted into the empirical second-order polynomial model, as shown in the following Equation (4):
where Y is the dependent variable, A0 is a constant, and Ai, Aii, and Aij are coefficients estimated by the model. Xi and Xj are the levels of the independent variables [15].
After acquiring the optimal extraction conditions, extra experiments under these conditions were performed to explore phenolic compounds’ content and related antioxidant capacities which included determination of total flavonoids and monomeric anthocyanin, the ABTS radical scavenging assay, the DPPH free radical scavenging capacity assay, and the ferric reducing antioxidant capacity assay.
2.12. Statistical Analysis
Software Design-Expert 8.06 (Trial version, State-Ease Inc., Minneapolis, MN, USA) was used to get the coefficients of quadratic polynomial model. The determination coefficient (R2) indicated the quality of the model, and the F-test supports the statistical significance.
3. Results
3.1. Effect of Temperature on TPC
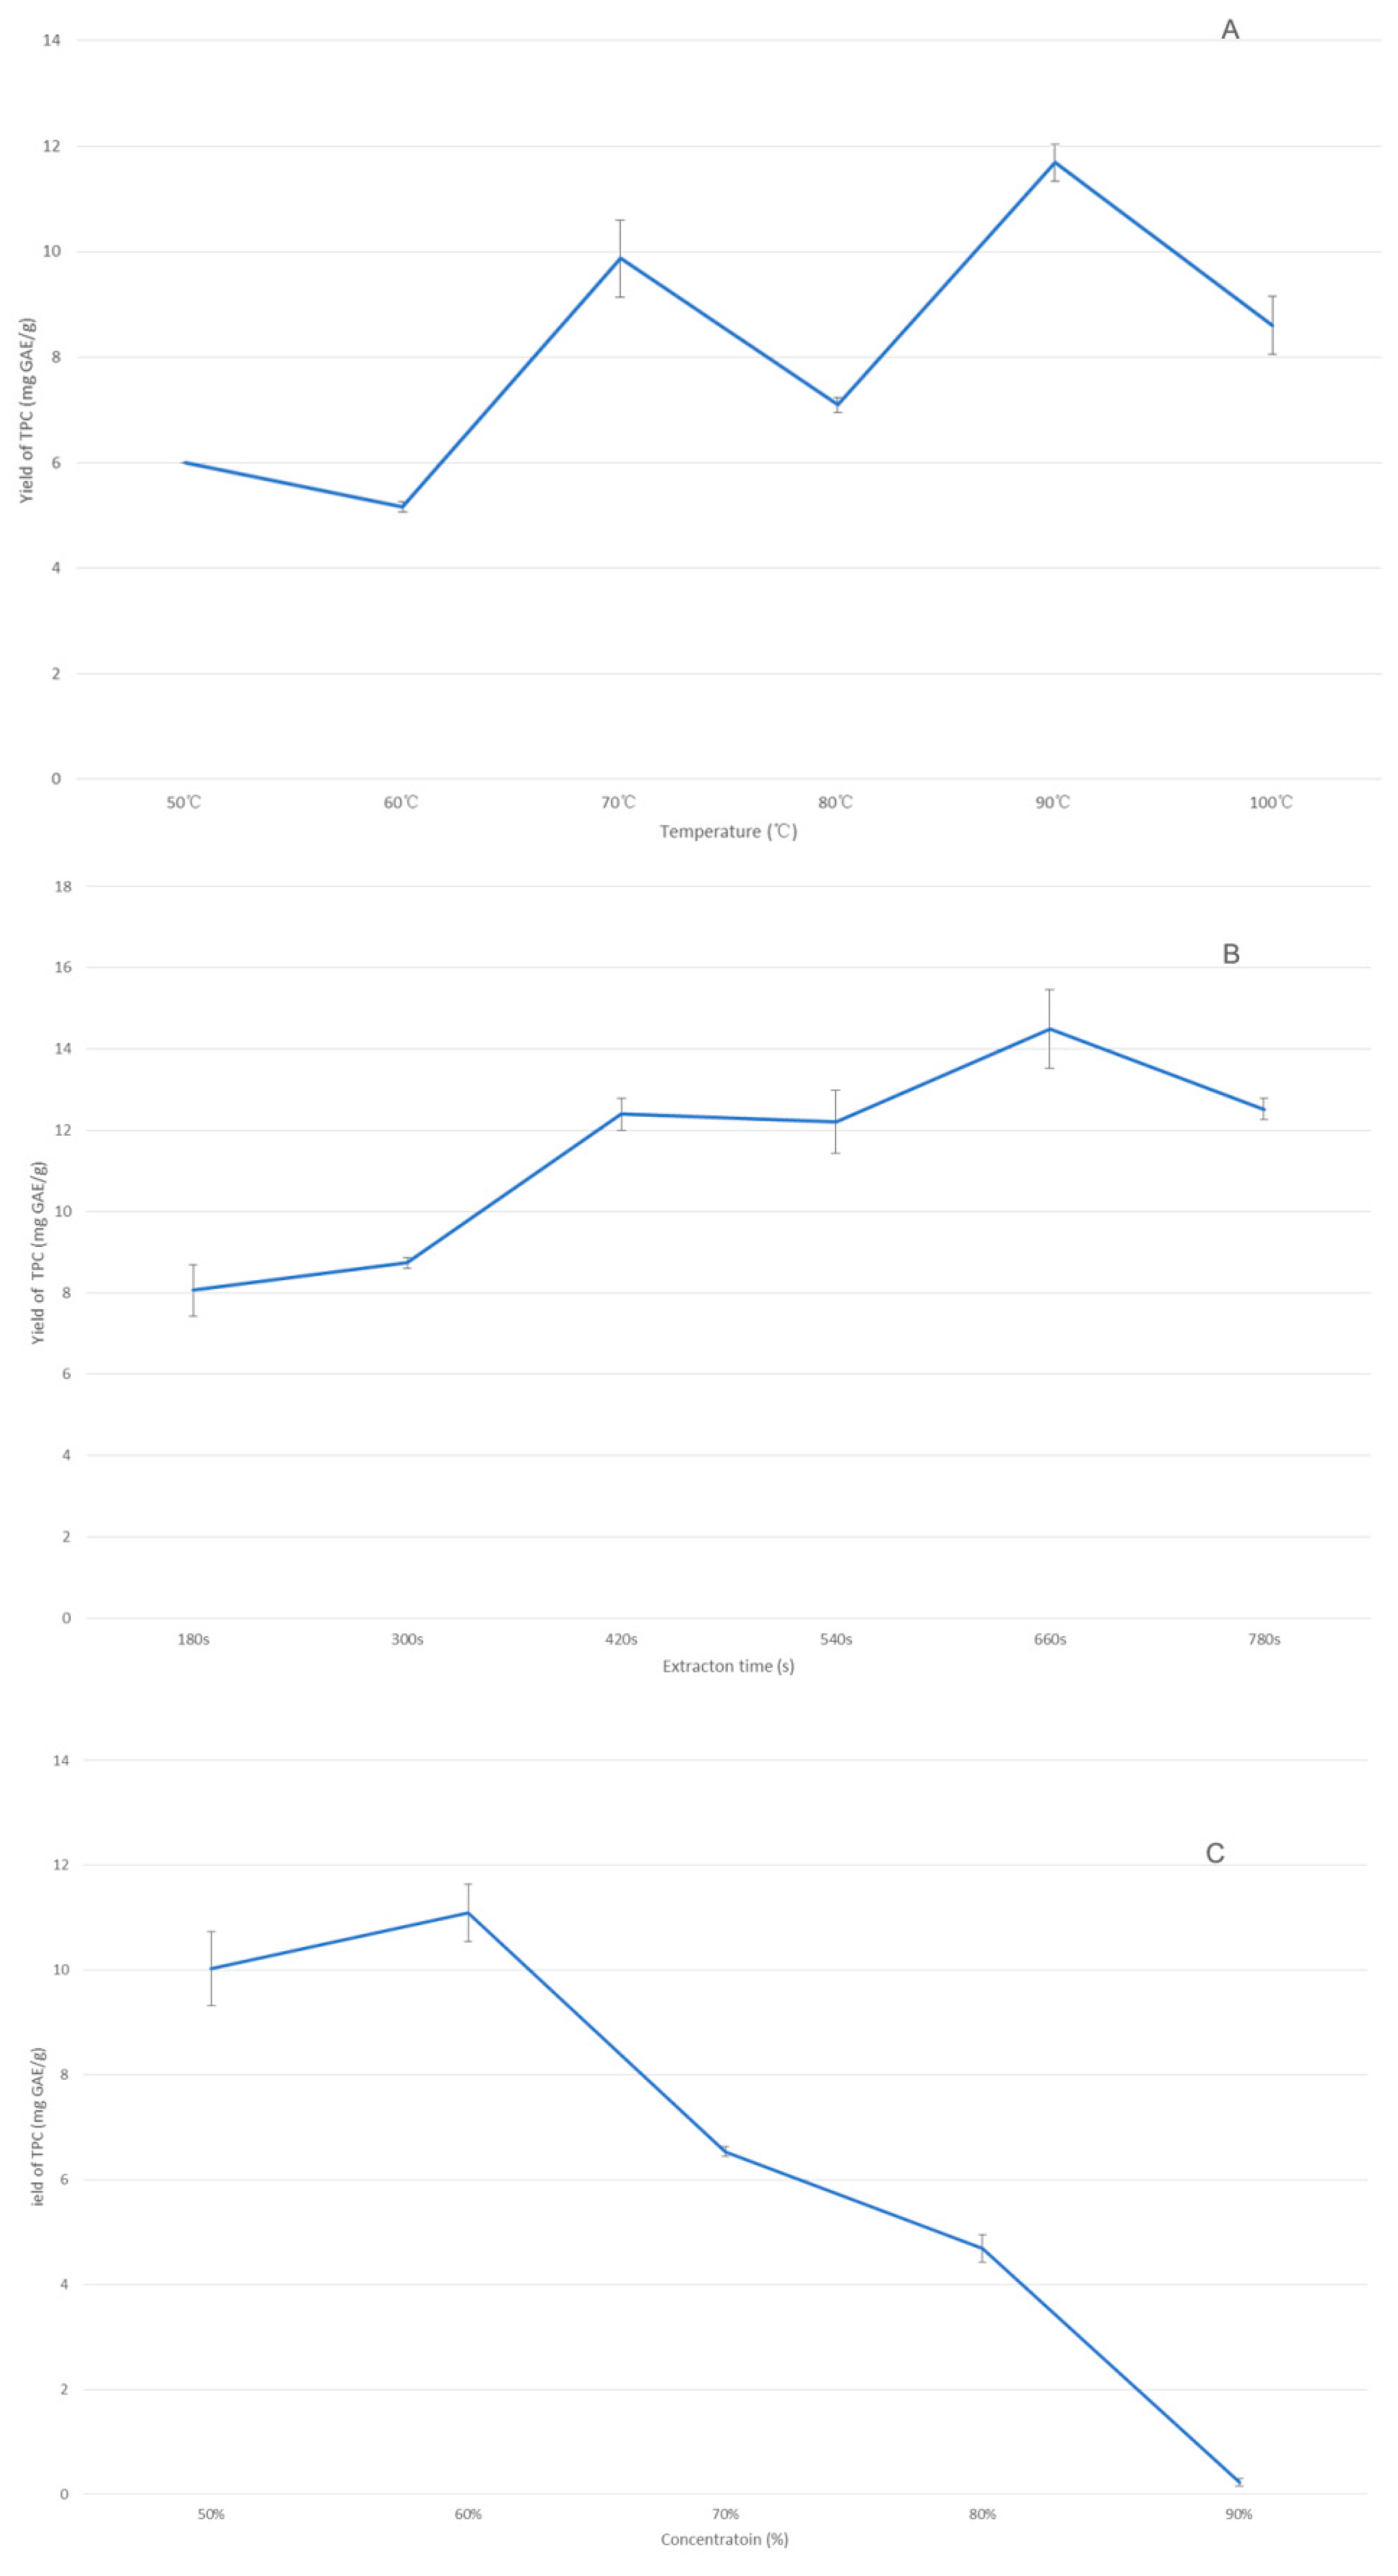
After setting other variables as follows the extraction time of 5 min, the concentration of extraction solvent of 80%, the extraction pressure of 10 MPa, and the number of cycles of 2, the extraction process was performed at different temperature conditions (50, 60, 70, 80, 90 and 100 °C). Based on Figure 1A, the TPC value increased, reached the peak when extraction temperature was 90 °C and then decreased.
3.2. Effect of Extraction Time on TPC
To explore how the extraction time affects the total phenolics value, the extraction process was conducted at varied extraction times (3, 5, 7, 9, 11, and 13 min) while, other variables (the extraction temperature of 50 °C the concentration of extraction solvent of 70%, the extraction pressure of 10 MPa and the number of cycles of 2) were kept constant. According to Figure 1B, the TPC value raised with the increasing extraction time to 11 min and then decreased.
3.3. Effect of Ethanol Concentration on TPC
Similar to the single factor tests, the extraction process was performed using the extraction solvent with different concentrations (50, 60, 70, 80, and 90%) while the extraction temperature (50 °C), time (5 min) and pressure (10 MPa) were keep constant, and number of cycles was set at 2. The Figure 1C suggests the TPC increased slightly with concentration up to 60% and then decreased. The maximum value was 11.10%when the concentration was 60%.
3.4. Model Building and Statistical Analysis
After determining the best conditions of a single factor, the BBD of 17 runs was applied to optimize these three independent factors and study the production of total phenolics from black goji. The design matrix and results of the RSM experiment are shown in Table 1.
After multiple regression analysis of the current experimental data, the relationship between the predicted response Y and the test variables can be explained invoking the following second-order polynomial equation:
Y = −206.14421 + 0.64148A + 4.32066B + 0.96920C − 0.010156AB + 0.099834AC − 0.014914BC − 7.07560E − 003A2 − 0.019326B2 − 0.24068C2
In this equation, Y represents the yield of TPC (mg GAE/g) A, B, and C are the ethanol concentration, the extraction temperature, and the extraction time, respectively. After analyzing the variance (ANOVA) of the quadratic polynomial model of extraction of TPC from black goji berry, the results were collected in Table 2. Specifically, for this model, the coefficient of determination (R2) was 0.9847, implying 98.47% results are based on the obtained quadratic polynomial model. The F-value for the lack of fit (0.9318 > 0.05) was not significant that proved the validity of this model. Meanwhile, the adjusted determination coefficient R2adj for this model was 0.9650, suggesting that there is a high mutuality between the observed and predicted values. Moreover, this model has a high F-value (F = 49.97) and an extremely low p-value (Prob > F; p < 0.0001) that obviously supports the significance of the model.
3.5. Optimization of Procedure
Having applied the Design-Expert software, we built the 3D response surface and 2D contour plots about this model to elucidate the relationship between the extraction time, the ethanol concentration, the extraction temperature, and the yield of TPC. As shown in Figure 2A and Figure 3A, the interaction influencing the TPC between the extraction solvent concentration and the extraction temperature were obtained. When the extraction time was set at zero, the TPC was improved with the ethanol concentration increased from 50 to 70%, on the other hand, with the extraction temperature increasing from 80 to almost 90 °C, the extraction of TPC reached the maximum value, and this value then decreased, followed by the continuous growth of the extraction temperature. Based on this observation, both the extraction temperature and the ethanol concentration imparted a positive effect on the extraction of TPC when the ranges of these two variables were 80–89.36 °C and 50–70%, respectively.
In addition, Figure 2B and Figure 3B reveal the effect of extraction time and temperature on the TPC. When the concentration of extraction solvent was zero, both the mutual interaction and quadratic effects of extraction time and temperature on the TPC extraction were exhibited. Maintaining the extraction temperature at 80 °C and increasing extraction time from 9 to 11 min raised the TPC value dramatically and then kept it steadily saturating. Besides, as the extraction time was kept at 9 min, the TPC value increased sharply, followed by the temperature increase from 80 to 90 °C similarly to finding in Figure 2B and Figure 3B.
Moreover, a general outline of those 3D response surface plots states is that when the extraction temperature was at a zero level, the yield of TPC was affected by the reciprocal interaction between the extraction time and the ethanol concentration. Both the extraction time and the ethanol concentration had a positive effect on the yield of TPC when another parameter was fixed.
3.6. Other Related Parameters Tests
Based on the optimal conditions of the TPC from black goji berry, additional experiments about the TFC, the MAC, the ABTS radical scavenging capacity, the in vitro DPPH free radical scavenging capacity and the FRAP of black goji berry were carried out. According to Table 2, under the optimal extraction conditions, the TPC value was 17.92 (mg GAE/g) as calculated from the standard curve y = 0.0012x + 0.0068, and the correlation coefficient (R2 = 0.9998). Compared to other extraction conditions (the experiments done before), this value was the maximum, suggesting the validity of the whole model. On the other hand, supported by the standard curve, the TFC was 9.62 (mg CAE/g). In addition, the MAC of black goji berry was 6.22 (CyE/g) due to the calculation equation offered before.
According to Table 3, when it comes to the antioxidant activity of black goji berry, the standard curve y = 0.0012x − 0.0085 (R2 = 0.9989) was applied to calculate the DPPH value which was 6.44 (mmol TE/g). Meanwhile, followed by the calibration equation of standard curve y = 0.0104x − 0.0444 and (R2 = 0.9998), the ABTS in black goji berry was 19.74 mmol TE/g. Furthermore, the FRAP value (270.94 mmol of Fe2+E/100 g) from black goji berry was obtained by using the related calibration equation: y = 0.6217x − 0.0545 (R2 = 0.9998). After testing all parameters related to antioxidants and phenolics, the results proved black goji berry was an abundant source of these nutrients.
4. Discussion
4.1. The Effect of Single Parameters on TPC
Based on results from preliminary experiments, all the experimental parameters (the ethanol concentration, the extraction temperature, and the extraction time) facilitated the extraction of a phenolic substance from black goji berry via the ASE in a certain parameter range. The extraction time and temperature were the dominant factors. The best conditions of these single factors were 90 °C and 11 min at 60% ethanol. For the extraction temperature, possible reasons for the TPC increase at 50 to 90 °C were the improved solubility and higher diffusion rates of the extracting solvent and other compounds [10]. The unique ability of ASE to maintain the extraction at a high temperature and a high pressure of 10 Mpa prevented the degradation of extract compounds [16]. In addition, the extraction was promoted due to better contact between analytes and a solvent because of reduced viscosity of solvent and decreased surface tension of a solvent, solute and a matrix at higher temperatures [17]. The following decrease of extraction efficiency may owe to the thermal degradation of TPC when the temperature is too high. On the other hand, the improved extraction time also promoted the extraction of TPC which was possibly owing to the required time of the process that the solute was exposed to the release medium where the liquid penetrated the sample, dissolved the solute and subsequently diffused out from the sample [18].
4.2. Analysis of Response Surface Plot
3D response surface and 2D contour plots established by the Design-Expert software were observed to explore the effects of parameters (the extraction time, the extraction temperature, and the ethanol concentration) and their interactions on the TPC. Figure 2A,B and Figure 3A,B suggest the significant interactions existed between the extraction temperature and the extraction time or the ethanol concentration on TPC extraction due to an elliptical contour plot indicated the significant interaction between these parameters [9]. However, there were some abnormal points existed in Figure 2C and Figure 3C that stunted the analysis of the relationship between the ethanol concentration and extraction time on the TPC extraction. The likely causes of this condition were; the inaccuracy of some instruments (balance or cylinder) that could distort the calculation of results. Also, during the sample preparation, cut black goji berry into pieces by shear or hand cannot produce exactly same sample and there existed some hollow berries, which were not abandoned, that would influence the results of experiments. Normally, if the requirements for sample homogeneity and sensitivity are met, the small sample size is preferred [19]. Besides, the amount of drying agent (diatomite) used in the extraction pool should be controlled at a basically same level. Otherwise, an insufficient amount of diatomite could not dry the sample completely and improve the dosage of extraction solvent in the whole process. Thereby, the volume of extract would be higher causing wrong results. Moreover, there was quite a high content of bound-water in black goji berry. In this situation, no matter what dry agent is used, the procedure that sodium sulfate should be added in a sample bottle and then passed through a dry column or drying silo to dry sample thoroughly. Although little problems existed in these 3D response surface plots, some conclusions could be inferred based on the results gathered from experiments. From these three figures, the optimal extraction conditions of TPC from black goji berry were the ethanol concentration of 70%, the extraction time of 13 min and the extraction temperature of 89.36 °C. Obviously, the TPC extraction was heavily affected by the extraction temperature and time.
4.3. Validation of Predictive Model
This study aimed to determine optimal extraction conditions that could maximize the yields of total phenolics from black goji berry. Thereby, the conditions (the ethanol concentration of 70%, the extraction temperature of 88.38 °C and the extraction time of 13 min) were able to produce the maximum of predicted value (17.81 mg GAE/g) of TPC as generated by the Design-Expert software. To compare with the predicted value, the extra experiment with modified conditions (the extraction temperature of 89 °C and -other parameters unchanged) was performed, producing the actual value of 17.92 (mg GAE/g). The similar results suggested the good correlation existed that confirmed the response model was adequate for reflecting the expected optimization [15]. Consequently, the optimization of this model was accurate and reliable.
4.4. Comparison of Phenolic Substances in Black Goji Berry with Other Food Products
The TPC and TFC value of black goji berry under optimal conditions was 17.92 mg GAE/g, and 9.62 mg CAE/g, respectively. Compared to other floras experimental yield of TPC and TFC, Ficus indica flowers sourced: 3.18 mg GAE/g and −1.48 mg CE/g [7], and the purple sweet potatoes gave 6.31 mg GAE/g and 0.28 mg QE/g [20]. Therefore, black goji berry was proved to serve as an abundant source of phenolic substances exceeding that of other plants. In addition, the MAC value of black goji berry, purple sweet potato and Ficus indica flowers were 6.22 mg CyE/g, 2.52 mg CGE/g and 0.07 mg CCE/g, respectively. The above values can be compared despite the different units used. As the results show, black goji berry also has a significant number of anthocyanins, which add outstanding bioactive effect and let black goji berry become an ideal source of healthy food.
4.5. Antioxidant Activity of Black Goji Berry Analysis
The antioxidant capacity of black goji berry was expressed through the DPPH free radical scavenging assay, the ABTS radical scavenging assay and the in vitro free reducing antioxidant capacity (FRAP) assay. The values of these parameters of black goji berry were 6.44 mmol TE/g, 19.74 mmol TE/g and 270.94 mmol of Fe2+E/100 g, respectively. Firstly, the antioxidant capacity of black current press residue including the seeds, skins and flesh of the barriers was around 2.0 mmol TE/100 g [18], which was far less than that of black goji berry. Besides, the ABT value, which is only 0.62 mmol TE/g [21] and 1.7 TE mmol/100 g [22], in sorghum brans and black currant seeds residue extract, respectively, constitutes only the small percentages of that in black goji berry. In addition, the FRAP value of rosemary, marjoram and oregano is 25.35, 18.56 and 19.25 g TE/100 g [15], which are were similar to the FRAP value of black goji berry. To summarize, all the comparisons suggest that black goji berry is a superior source of phenolic antioxidants.
4.6. ASE of Different Sources
ASE is an environmentally friendly and alternative green process to extract bioactive compounds from different sources. The studies involving the ASE process explored extraction of antiviral compounds from the edible seaweed Himanthalia elongata [23] and β-glucan from bran of hull-less barley [19]. In the latter case, the ASE method produced a much higher quantity of β-glucan compared with other techniques.
4.7. Phenolics Extraction with Other Methods
The industrial extraction of the phenolic compounds has been taking place with the conventional solvent extraction method, such as, UAE and MAE [24]. One study optimized the UAE of Lycium barbarum. The results showed that the UAE was a useful tool for producers of goji berry extracts to achieve an effective and economically viable extraction process as well as optimal composition and bioactivity in terms of antioxidant capacity [25]. In another study, an MAE procedure was optimized to isolate phenolic compounds from almond skin byproducts [26].
5. Conclusions
In this study, the interactive and individual effect from three experimental variables (the extraction time, the ethanol concentration, and the extraction temperature) on the TPC extracts from black goji berry were learned by applying the Box-Behnken design (three-variables-three-levels) of response surface methodology techniques. Meanwhile, the statistical analyses and numerical optimization established the optimal conditions for ASE. The optimized parameters are the following: an extraction time of 13 min, an extraction temperature of 89.36 °C and an ethanol concentration of 60%. The validity of the constructed model was verified by the determination coefficients (R2 = 0.9847, R2adj = 0.9650) and the F-value for the lack of fit (p > 0.05). After that, the related parameters test proved black goji berry was rich in antioxidants and phenolics which obviously could be an ideal resource for nutraceuticals. In conclusion, the knowledge this study obtained about black goji berry could be treated as the foundation for varied further research.
Author Contributions
Q.H. conducted the lab work and drafted the manuscript; B.D. made experimental design and conducted part of lab work; B.X. designed and supervised the project, provided the funding support, and polished manuscript.
Funding
The work is jointly supported by grant R201714 from Beijing Normal University-Hong Kong BaptistUniversity United International College and one research grant from Zhuhai Higher Education Construction Project (Zhuhai Key Laboratory of Agricultural Product Quality and Food Safety). The APC was funded by Beijing Normal University-Hong Kong Baptist University United International College.
Conflicts of Interest
The authors declare no conflict of interest.
References
- Ma, J.X. The fruit of Lycium ruthenicum the application of the research development and prospect of the development of Qinghai Province. J. Qinghai Normal Univ. 2012, 3, 1–2. [Google Scholar]
- Xin, G.; Zhu, F.M.; Du, B.; Xu, B.J. Antioxidants distribution in pulp and seeds of black and red goji berries as affected by boiling processing. J. Food Qual. 2017, 2017, 3145946. [Google Scholar] [CrossRef]
- Jiao, X.L.; Chi, X.F.; Dong, Q.; Xiao, Y.C.; Hu, F.Z. Analysis of the nutritional components of Lycium ruthenicum. Amino Acids Biot. Resour. 2011, 33, 60–62. [Google Scholar]
- Sun, N.; Du, L.P.; Sun, Y.N.; Wang, H.Y. Comparative study on content of proanthocyanidins from Lycium ruthenicum, Chinese wolfberry and black currant. Food Drug 2013, 15, 275–277. [Google Scholar]
- He, R.X. Research on wild black fruit Chinese wolf berry fruit anthocyanin technology of ultrasonic assisted extraction, Qinghai, China. J. Qinghai Normal Univ. 2015, 1, 49–55. [Google Scholar]
- Xu, B.J.; Chang, S.K.C. A comparative study on phenolic profiles and antioxidant activities of legumes as affected by extraction solvents. J. Food Sci. 2007, 72, S159–S166. [Google Scholar] [CrossRef] [PubMed]
- Benayad, Z.; Martinez-Villaluenga, C.; Frias, J.; Gomez-Cordoves, C.; Es-Safi, N.E. Phenolic composition, antioxidant and anti-inflammatory activities of extracts from Moroccan Opuntiaficus indica flowers obtained by different extraction methods. Ind. Crops Prod. 2014, 62, 412–420. [Google Scholar] [CrossRef]
- Khayet, M.; Cojocaru, C.; Essalhi, M. Artificial neural network modeling and response surface methodology of desalination by reverse osmosis. J. Membr. Sci. 2011, 368, 202–214. [Google Scholar] [CrossRef]
- Zhao, L.C.; He, Y.; Deng, X.; Yang, G.L.; Li, W.; Liang, J.; Tang, Q.L. Response surface modeling and optimization of accelerated solvent extraction of four lignans from Fructus schisandrae. Molecules 2012, 17, 3618–3629. [Google Scholar] [CrossRef] [PubMed]
- Kang, J.H.; Kim, S.; Moon, B.K. Optimization by response surface methodology of lutein recovery from paprika leaves using accelerated solvent extraction. Food Chem. 2016, 205, 140–145. [Google Scholar] [CrossRef] [PubMed]
- Singleton, V.L.; Rossi, J.A. Colorimetry of total phenolics with phosphomolybdic-phosphotungstic acid reagents. Am. J. Enol. Vitic. 1965, 16, 144–158. [Google Scholar]
- Xu, B.J.; Yuan, S.H.; Chang, S.K.C. Comparative analyses of phenolic composition, antioxidant capacity, and color of cool season legumes and other selected food legumes. J. Food Sci. 2007, 72, S167–S177. [Google Scholar] [CrossRef] [PubMed]
- Özgür, M.Ü.; Çimen, E. Ultrasound-assisted extraction of anthocyanins from red rose petals and new spectrophotometric methods for the determination of total monomeric anthocyanins. J. AOAC Int. 2017, 101, 967–980. [Google Scholar] [CrossRef] [PubMed]
- Irakli, M.; Kleisiaris, F.; Kadoglidou, K.; Katsantonis, D. Optimizing Extraction Conditions of Free and Bound Phenolic Compounds from Rice By-Products and Their Antioxidant Effects. Foods 2018, 7, 93. [Google Scholar] [CrossRef] [PubMed]
- Hossain, M.B.; Barry-Ryan, C.; Martin-Diana, A.B.; Brunton, N.P. Optimisation of accelerated solvent extraction of antioxidant compounds from rosemary (Rosmarinus officinalis L.), marjoram (Origanum majorana L.) and oregano (Origanum vulgare L.) using response surface methodology. Food Chem. 2011, 126, 339–346. [Google Scholar] [CrossRef]
- Zhu, M.; Zhao, H.; Xia, D.; Du, J.; Xie, H.; Chen, J. Determination of 21 antibiotics in sea cucumber using accelerated solvent extraction with in-cell clean-up coupled to ultra-performance liquid chromatography-tandem mass spectrometry. Food Chem. 2018, 258, 87–94. [Google Scholar] [CrossRef] [PubMed]
- Gan, C.Y.; Latiff, A.A. Optimization of the solvent extraction of bioactive compounds from Parkiaspeciosa pod using response surface methodology. Food Chem. 2011, 124, 1277–1283. [Google Scholar] [CrossRef]
- Ndungutse, V.; Mereddy, R.; Sultanbawa, Y. Assessment of bacterial activity and phenolic content of mushroom (Agaricus bisporus) stipe extracts. J. Food Process Preserv. 2015, 39, 2225–2233. [Google Scholar] [CrossRef]
- Du, B.; Zhu, F.M.; Xu, B.J. β-Glucan extraction from bran of hull-less barley by accelerated solvent extraction combined with response surface methodology. J. Cereal Sci. 2014, 59, 95–100. [Google Scholar] [CrossRef]
- Cai, Z.; Qu, Z.; Lan, Y.; Zhao, S.; Ma, X.; Wan, Q.; Jing, P.; Li, P. Conventional, ultrasound-assisted, and accelerated-solvent extractions of anthocyanins from purple sweet potatoes. Food Chem. 2016, 197, 266–272. [Google Scholar] [CrossRef] [PubMed]
- Barros, F.; Dykes, L.; Awika, J.M.; Rooney, L.W. Accelerated solvent extraction of phenolic compounds from sorghum brans. J. Cereal Sci. 2013, 58, 305–312. [Google Scholar] [CrossRef]
- Bakowska-Barczak, A.M.; Schieber, A.; Kolodziejczyk, P. Characterization of Canadian black currant (Ribes nigrum L.) seed oils and residues. J. Agric. Food Chem. 2009, 57, 11528–11536. [Google Scholar] [CrossRef] [PubMed]
- Santoyo, S.; Jaime, L.; Ibañez, E.; Reglero, G.; Señorans, J. Pressurized liquids as an alternative green process to extract antiviral agents from the edible seaweed Himanthalia elongata. J. Appl. Phycol. 2011, 23, 909–917. [Google Scholar] [CrossRef]
- Hidalgo, G.I.; Almajano, M.P. Red fruits: Extraction of antioxidants, phenolic content, and radical scavenging determination: A review. Antioxidant 2017, 6, 7. [Google Scholar] [CrossRef] [PubMed]
- Skenderidis, P.; Petrotos, K.; Giavasis, I.; Hadjichristodoulou, C.; Tsakalof, A. Optimization of ultrasound assisted extraction of goji berry (Lycium barbarum) fruits and evaluation of extracts’ bioactivity. J. Food Process Eng. 2016, 40, e12522. [Google Scholar] [CrossRef]
- Valdés, A.; Vidal, L.; Beltrán, A.; Canals, A.; Garrigós, M.C. Microwave-assisted extraction of phenolic compounds from almond skin byproducts (Prunus amygdalus): A multivariate analysis approach. J. Agric. Food Chem. 2015, 63, 5395–5402. [Google Scholar] [CrossRef] [PubMed] [Green Version]
Figure 1.
Effects of the independent variables on the total extracted phenolic content from black goji berry. (A) Extraction temperature; (B) Extraction time; (C) Ethanol concentration.
Figure 1.
Effects of the independent variables on the total extracted phenolic content from black goji berry. (A) Extraction temperature; (B) Extraction time; (C) Ethanol concentration.

Figure 2.
Response surface plots showing the effect of extraction temperature, ethanol concentration and extraction time on the total phenolics content (TPC) from black goji berry. (A) Interactive effects of extraction solvent concentration and extraction temperature on TPC; (B) interactive effects of extraction time and temperature on the TPC; (C) interactive effects of extraction time and extraction solvent concentration on the TPC.


Figure 3.
Contours plots showing the effect of extraction temperature, ethanol concentration and extraction time on the total phenolics content (TPC) from black goji berry. (A) Interactive effects of extraction solvent concentration and extraction temperature on TPC; (B) interactive effects of extraction time and temperature on the TPC; (C) interactive effects of extraction time and extraction solvent concentration on the TPC.


Table 1.
Box-Behnken design and the observed response.
| Runs | Independent Variables | Response | ||
|---|---|---|---|---|
| Concentration (%) | Temperature (°C) | Extraction Time (min) | TPC (mg GAE/g) ± STD (n = 3) | |
| 1 | 60 | 90 | 11 | 17.17 ± 0.056 |
| 2 | 50 | 80 | 11 | 13.04 ± 0.163 |
| 3 | 60 | 80 | 13 | 14.27 ± 1.097 |
| 4 | 70 | 90 | 13 | 17.84 ± 1.110 |
| 5 | 60 | 90 | 11 | 16.35 ± 0.072 |
| 6 | 70 | 100 | 11 | 13.69 ± 0.993 |
| 7 | 50 | 90 | 13 | 14.21 ± 0.292 |
| 8 | 60 | 90 | 11 | 17.12 ± 0.149 |
| 9 | 60 | 90 | 11 | 17.25 ± 1.118 |
| 10 | 60 | 80 | 9 | 12.45 ± 0.528 |
| 11 | 60 | 90 | 11 | 16.90 ± 0.743 |
| 12 | 60 | 100 | 9 | 14.57 ± 0.887 |
| 13 | 50 | 100 | 11 | 16.29 ± 0.409 |
| 14 | 50 | 90 | 9 | 16.85 ± 0.720 |
| 15 | 70 | 90 | 9 | 12.49 ± 0.589 |
| 16 | 60 | 100 | 13 | 15.20 ± 0.454 |
| 17 | 70 | 80 | 11 | 14.50 ± 0.408 |
Table 2.
ANOVA for the fitted quadratic polynomial model of the black goji berry extraction.
| Source | Sum of Squares | DF | Mean Square | F-Value | p-Value Prob > F |
|---|---|---|---|---|---|
| Model | 51.66 | 9 | 5.74 | 49.97 | <00001 |
| Residual | 8 | 7 | 0.11 | ||
| Lack of fit | 0.076 | 3 | 25 | 0.14 | 0.9318 |
| Pure error | 0.73 | 4 | 0.18 | ||
| Cor total | 52.46 | 16 | |||
| R2 = 0.9847 | R2adj = 0.9650 |
Table 3.
Phenolic substances content and antioxidant capacities of black goji berry under the optimal extraction condition (70%, 13 min, 89 °C).
Table 3.
Phenolic substances content and antioxidant capacities of black goji berry under the optimal extraction condition (70%, 13 min, 89 °C).
| Antioxidants | TPC (mg GAE/g) | TFC (mg CAE/g) | MAC (CyE/g) | DPPH (mmol TE/g) | ABTS (mmol TE/g) | FRAP (mmol of Fe2+E/100 g) |
|---|---|---|---|---|---|---|
| Mean ± STD (n = 3) | 17.92 ± 0.593 | 9.62 ± 0.133 | 6.22 ± 0.354 | 6.44 ± 0.066 | 19.74 ± 2.63 | 270.94 ± 3.45 |
© 2018 by the authors. Licensee MDPI, Basel, Switzerland. This article is an open access article distributed under the terms and conditions of the Creative Commons Attribution (CC BY) license (http://creativecommons.org/licenses/by/4.0/).
Share and Cite
MDPI and ACS Style
He, Q.; Du, B.; Xu, B. Extraction Optimization of Phenolics and Antioxidants from Black Goji Berry by Accelerated Solvent Extractor Using Response Surface Methodology. Appl. Sci. 2018, 8, 1905. https://doi.org/10.3390/app8101905
AMA Style
He Q, Du B, Xu B. Extraction Optimization of Phenolics and Antioxidants from Black Goji Berry by Accelerated Solvent Extractor Using Response Surface Methodology. Applied Sciences. 2018; 8(10):1905. https://doi.org/10.3390/app8101905
Chicago/Turabian StyleHe, Qinghua, Bin Du, and Baojun Xu. 2018. "Extraction Optimization of Phenolics and Antioxidants from Black Goji Berry by Accelerated Solvent Extractor Using Response Surface Methodology" Applied Sciences 8, no. 10: 1905. https://doi.org/10.3390/app8101905
Note that from the first issue of 2016, this journal uses article numbers instead of page numbers. See further details here.