Enzyme Assisted Extraction, Purification and Structure Analysis of the Polysaccharides from Naked Pumpkin Seeds

1
College of Science, Northeast Agricultural University, Harbin 150030, China
2
College of Agriculture, Northeast Agricultural University, Harbin 150030, China
*
Author to whom correspondence should be addressed.
Appl. Sci. 2018, 8(10), 1866; https://doi.org/10.3390/app8101866
Submission received: 19 September 2018
/
Revised: 4 October 2018
/
Accepted: 8 October 2018
/
Published: 10 October 2018
(This article belongs to the Section Chemical and Molecular Sciences)
Abstract
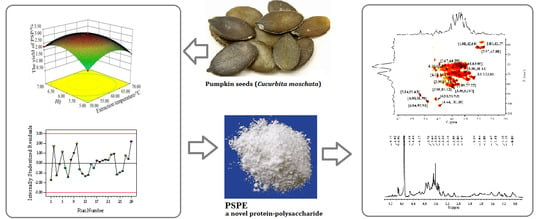
:Enzyme assisted extraction was used to extract the polysaccharides from pumpkin seeds (PSP) and the extraction parameters were optimized by response surface methodology (RSM). Under the optimum experimental parameters: Extraction temperature of 60 °C, extraction time of 43 min, enzyme concentration of 2.5%, and pH of 6.0, the yield of PSP was 3.22 ± 0.04%, which was in close agreement with the predicted value (3.24%). After further purification on anion exchange column and gelfiltration column, a novel purified polysaccharide (PSPE) with molecular weight of 16,700 g/mol was obtained. PSPE was mainly composed of mannose, galactose and glucose in the molar ratio of 1.00:3.84:1.62. NMR spectra analysis showed that the major backbone of PSPE consisted of →4)-α-d-Glcp-(1→, →4)-β-d-Manp-(1→, →3,6)-β-d-Glap-(1→, and β-d-galactose.
1. Introduction
In recent years, enzyme assisted extraction (EAE) has been widely used for the extraction of target compounds from different materials [1,2,3]. Compared with conventional methods, EAE improved the time efficiency, reduced the solvent consumption and operated at milder extraction temperature [4,5]. The positive effect of EAE is that the cell walls catalyzed by enzyme became thin and disorganized under optimum experimental conditions, then the intracellular components were released more completely, leading to the improved yield [6].
Some studies showed that EAE was an excellent method to extract polysaccharides from plants. Wang, et al. reported that the yield of polysacharides from Tricholoma mongolicum Imai (TMIPs) was 24.01% by enzyme-assisted extraction [7]. You, Yin, & Zhao also obtained higher yield of polysacharides from the fruit of Cornus officinalis than that of UAE and HWE [8]. In addition, Chen, Zhou, & Zhang proved that the polysaccharides from Astragalus membranaceus extracted by enzyme assisted extraction had better antioxidant activity (about 2 times higher) than none enzyme treated ones [2]. Moreover, EAE has been used to separate the polysaccharides from Malva sylvestris [9], Lentinus edodes [10], Panax ginseng [11], and Polygonatum odoratum [12], all these results further confirmed that EAE could be widely applied to the polysaccharide field.
In our earlier work, hot-water extraction (HWE) and ultrasound-assisted extraction (UAE) have been employed for the polysaccharides from pumpkin seeds [13,14]. After separation by two-step column chromatography, two purified polysaccharides (PSP-I and PSP-1) were obtained from pumpkin seeds, respectively [14,15]. PSP-1 extracted with UAE had a lower molecular weight of 3728 g/mol than PSP-I of 21,100 g/mol from HWE. This result showed using diverse methods obtained different polysaccharides from the same materials, matching well with the reported literature [16]. Therefore, it is necessary to develop the new extraction method for the novel polysaccharide.
The present work studied the application of enzyme-assisted extraction for the polysaccharides from naked pumpkin seeds. The influences of various parameters like extraction time, extraction temperature, enzyme concentration, and pH were investigated. The novel purified polysaccharide (PSPE) was gained and its structural character was determined by GC, FT-IR, and NMR.
2. Materials and Methods
2.1. Materials
Dextrans and seven monosaccharides including arabinose (Ara), xylose (Xyl), rhamnose (Rha), fucose (Fuc), Man (Man), glucose (Glc), and galactose (Gal) were obtained from Sigma-Aldrich (Shanghai, China). Q-Sepharose FF was purchased from Ferrer Biotechnology Co. (Hangzhou, China). Sephadex G-75 was obtained from Baierdi Biotechnology Co. (Beijing, China). Cellulase (Lot: 161120, activity ≥5000 U/g, optimal temperature: 50–60 °C) was purchased from Beijing Obo Star Biotechnology Co., Ltd. (Beijing, China). Dialysis bag (molecular weight cut off 3500 Da) was obtained from Union Carbide Co. (St. Louis, MO, USA). All other reagents used were analytical grade.
2.2. Enzyme-Assisted Extraction of Polysaccharides
Dry powder of naked pumpkin seeds (Cucurbita moschata) was obtained after degreasing according to the reported method [15]. 3.0 g of powder was mixed with 120 mL complex enzyme solution (cellulase:papain in the ratio of 1:1) in a beaker and extracted at the designated pH, temperature, time, and enzyme concentration. After extraction, the enzyme activity was inactivated in boiling water for 6 min and then centrifuged (3500 rpm) for 15 min. The extracts were filtered, concentrated and precipitated by the addition of ethanol to a final concentration of 80% (v/v), and kept overnight at 4 °C. The precipitant was collected after centrifugation (3500 rpm for 10 min) and dried to obtain the crude polysaccharides (PSP).
Single factor experiments were employed to investigate the influence of extraction temperature (30, 40, 50, 60, and 70 °C), complex enzyme concentration (1.5%, 2.0%, 2.5%, 3.0%, and 3.5%), extraction time (20, 30, 40, 50, and 60 min), and pH (3.0, 4.0, 5.0, 6.0, and 7.0) on the yield of PSP. During the single factor experiments, one parameter was altered while the other parameters remained unchanged in all experiments.
2.3. Optimization of EAE by RSM
Based on the results of single factor experiments, a Box-Behnken experimental design was employed to optimize the enzyme-assisted extraction conditions. A four-factor-three-level (A, extraction time; B, extraction temperature; C, enzyme concentration; D, pH) test was performed to evaluate their combined effect. As shown in Table 1, the ranges and center point values of four independent variables were based on the results of single factor experiments. The behavior of the polysaccharide extraction was expressed by second order polynomial equations as follows:
where Y is the dependent variable; β0, βi, βii, and βij the linear, quadratic and interactive coefficients, respectively; Xi and Xj are independent variables (i ≠ j).
Subsequently, three additional confirmation experiments were carried out to verify the validity of the predictive model with comparison to the predicted value.
2.4. Column Isolation of PSP
The crude polysaccharides solution (3 mg/mL) was deproteinized by Sevag reagent (trichloromethane:n-butyl alcohol = 4:1, v/v). The deproteinized water phase was dialyzed, concentrated by vacuum rotary evaporator and freeze-dried. Then the polysaccharide solution (1.0 mg/mL) was loaded into Q-Sepharose FF column (2.0 × 40 cm) and deionized water was used as eluant with a flow rate of 1.0 mL/min. One major polysaccharide fraction was monitored by phenol-sulfuric acid method [17]. The eluted sample was collected and further purified by Sephadex G-75 column (1.8 × 50 cm) with distilled water at a flow rate of 1.0 mL/min. The main fraction presented as a single and asymmetric peak, so the top fraction was gathered and named PSPE. The sugar content of PSPE was measured by phenol-sulfuric acid method and the protein content was determined by the Bradford method [18].
2.5. Characterization of PSPE
2.5.1. Determination of Molecular Weight and Monosaccharide Composition
The molecular weight (Mw) of PSPE were measured by high performance liquid chromatography (HPLC, LC-10AVP, Shimadzu Corporation, Kyoto, Japan). The monosaccharide composition was analyzed by gas chromatography (GC, GC-2010, Shimadzu Corporation, Kyoto, Japan). The operations were performed according to our earlier study [19].
2.5.2. UV and FT-IR Spectra
UV spectrum of PSPE solution (1.0 mg/mL) was recorded on a double beam UV spectrophotometer (TU-1901, Beijing Purkinje General Instrument Co., Ltd., Beijing, China) in the wavelengh range of 200 to 400 nm. 5.0 mg PSPE and KBr powder were mixed and then pressed into 1 mm pellets. FT-IR spectrum was measured on Fourier transform infrared spectrophotometer (ALPHA-T, BRUKER Co., Billerica, MA, USA) in the wave number region (4000–400 cm−1).
2.5.3. NMR Spectra
The structural analysis of PSPE (30 mg/mL, in D2O) was performed with NMR spectra (1H NMR, 13C NMR and HSQC) on a 400 MHz spectrometer (Bruker Corporation, Zurich, Switzerland).
2.6. Statistical Analysis
All experimental values were expressed as mean ± standard deviation of three replicates. Design-Expert software (8.6 Statease Inc., Minneapolis, MN, USA) was used for the one-way analysis of variance (ANOVA). p < 0.05 was considered to be statistically significant.
3. Results and Discussion
3.1. Effects of Different Extraction Conditions on the Yield of PSP
3.1.1. Extraction Time
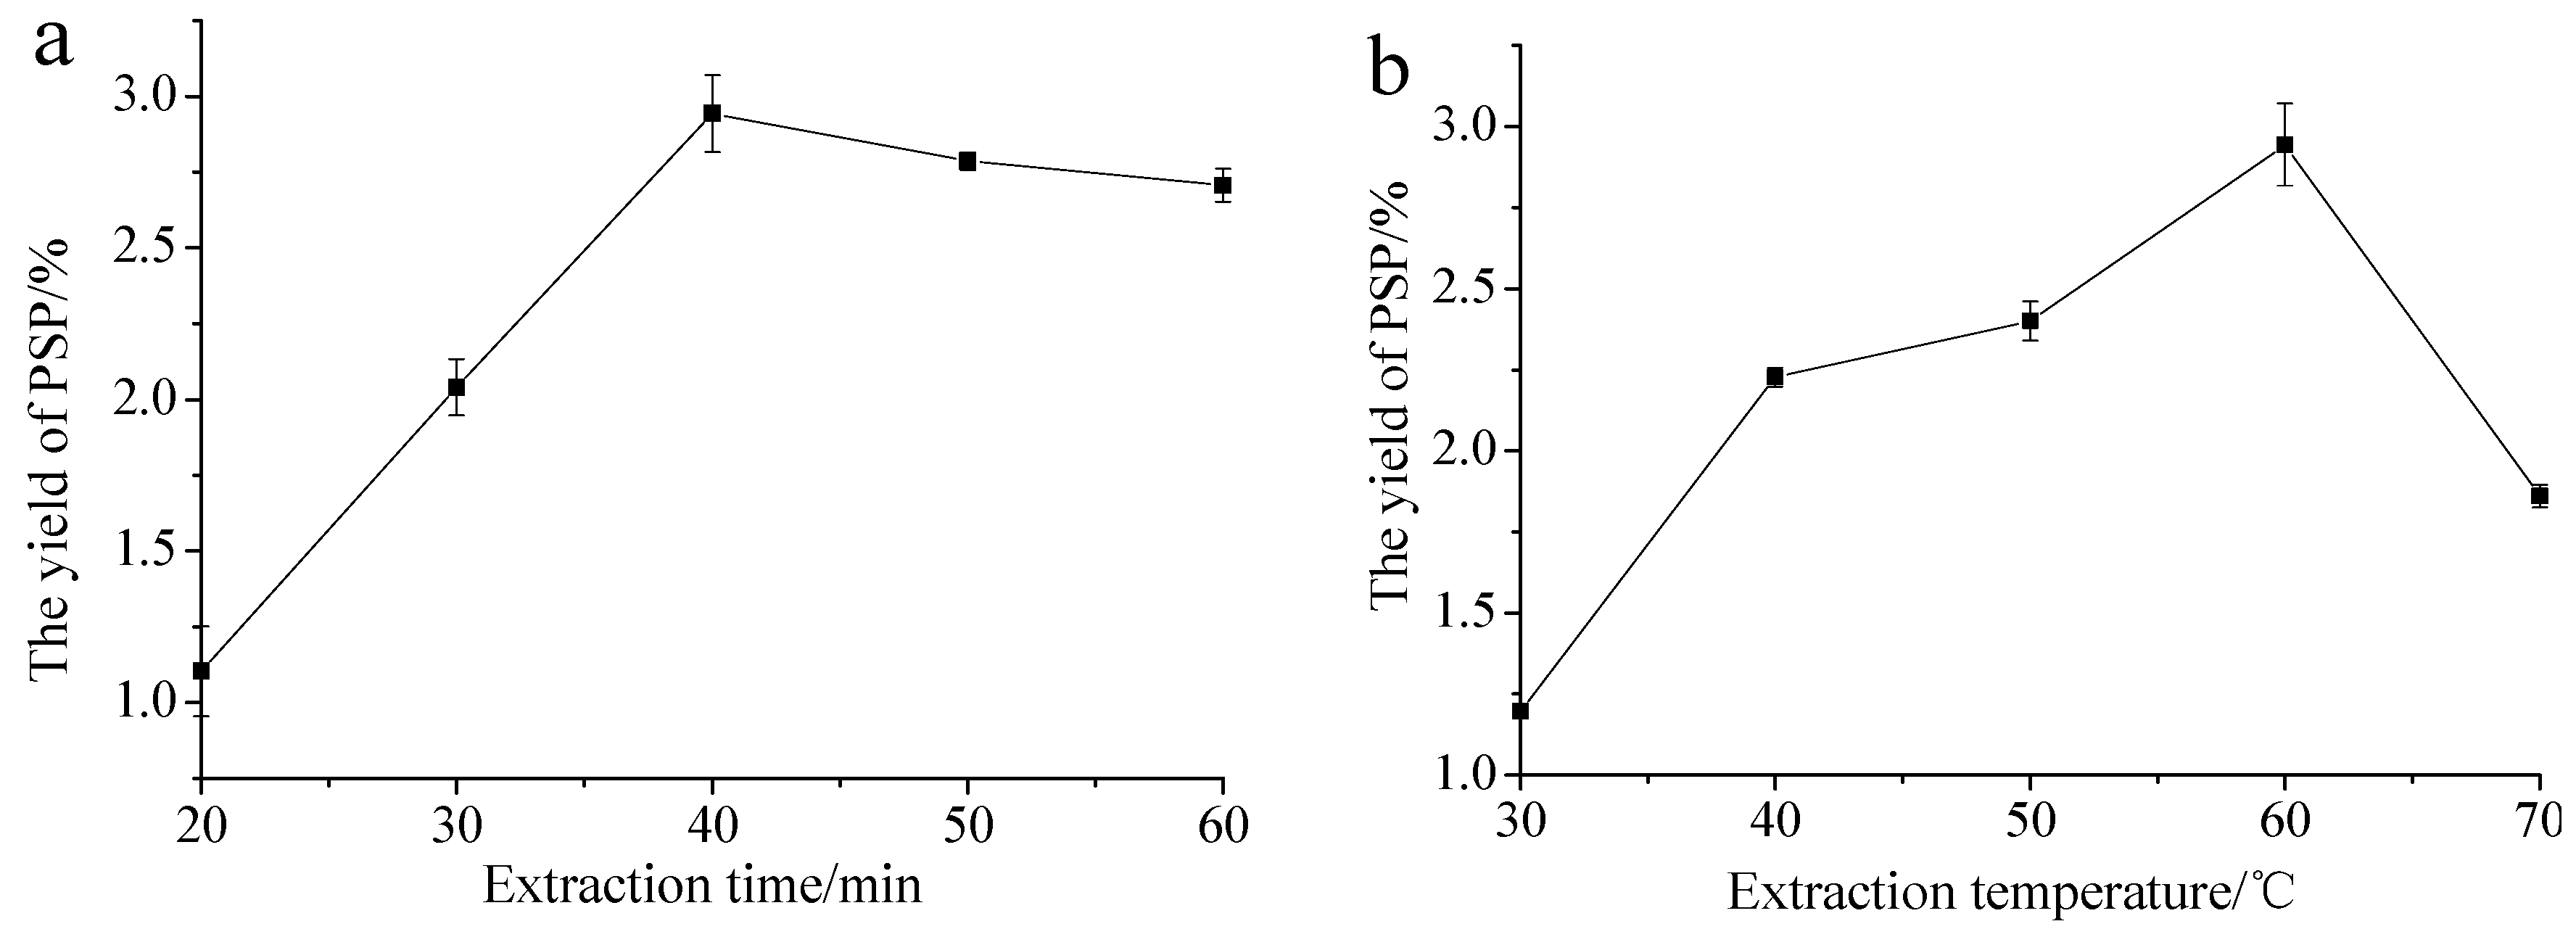
As shown in Figure 1a, the effect of time (ranging from 20 to 60 min) on the extraction yield was investigated when other parameters were as follows: Enzyme concentration 2.5%, temperature 60 °C, and pH 6.0. Result indicated that the yield of PSP reached the maximum when extraction time was 40 min. It is reported that under a long extraction time and high temperature, the hydrolysis of polysaccharides would happen [20]. Therefore, 40 min was a suitable extraction time for the EAE.
3.1.2. Extraction Temperature
The effects of different temperatures from 30 to 70 °C on the yield were studied and other extraction conditions were fixed as follows: Extraction time of 40 min, enzyme concentration of 2.5%, and pH of 6.0. Figure 1b showed that the yield of PSP continued to increase with the extraction temperature and was enhanced to a highest value 2.94 ± 0.13% at the temperature of 60 °C, then began to decline owning to the inactivation of enzyme at higher temperatures [21]. According to this result, 60 °C was chosen for the next extraction process.
3.1.3. Enzyme Concentration
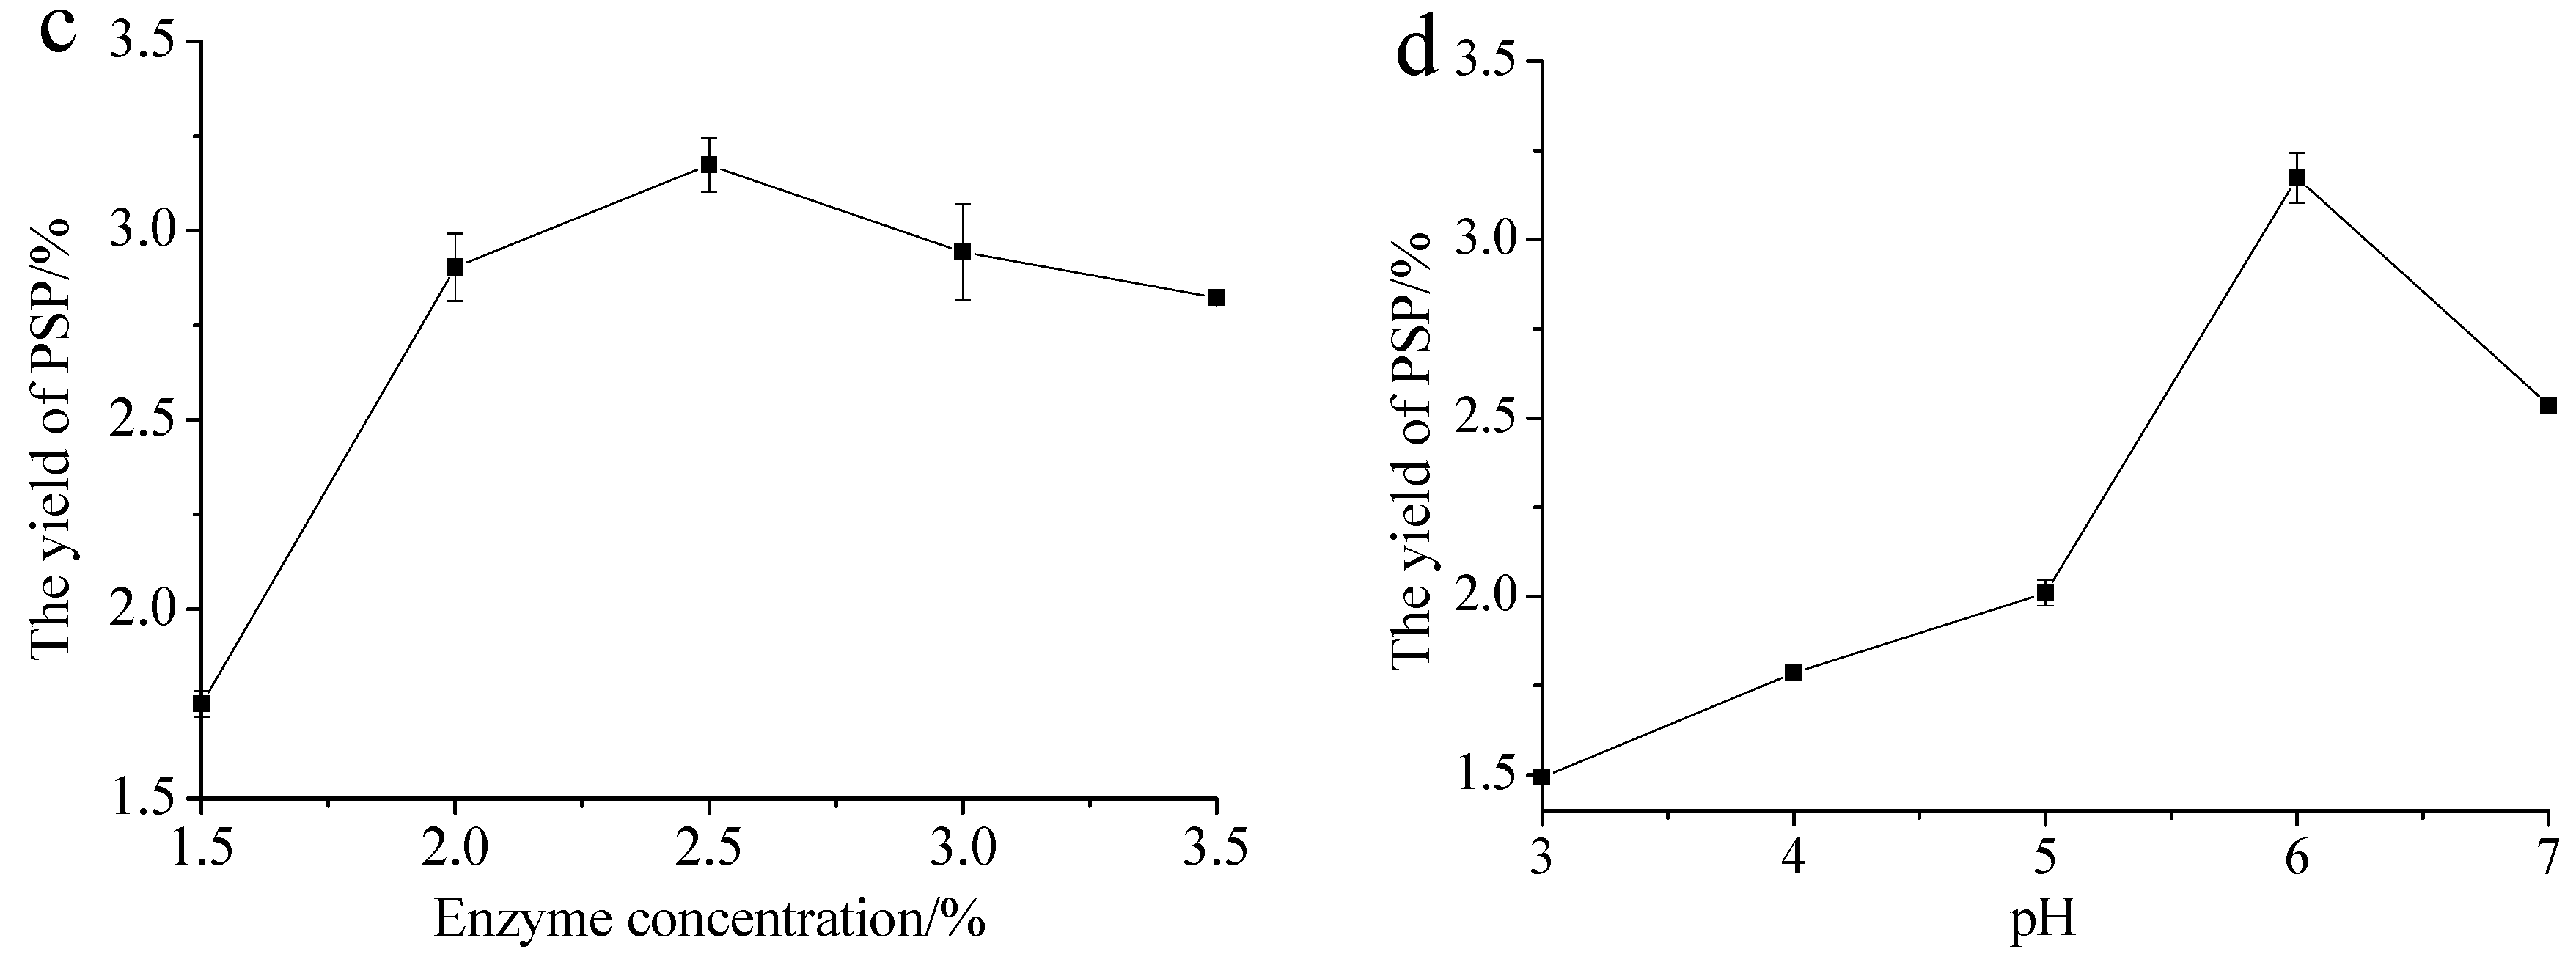
In this study, different enzyme concentrations (1.5%, 2.0%, 2.5%, 3.0%, and 3.5%) was selected to examine the influence on the yield of PSP. Other factors were set as follows: extraction temperature of 60 °C, extraction time of 40 min, and pH of 6.0. Figure 1c showed the yield of PSP increased with the enzyme concentration and reached a highest value of 3.17 ± 0.07% at the concentration of 2.5%. Therefore, 2.5% was considered to be optimal in present experiments.
3.1.4. The pH Values
The pH values could strongly affect the activity of enzymes, therefore, it was important to investigate the optimal pH. In present study, the pH values (3, 4, 5, 6, and 7) were performed when other parameters were as follows: Extraction time of 40 min, extraction temperature of 60 °C and enzyme concentration of 2.5%. As shown in Figure 1d, the pH values displayed a positive linear effect on the yield of polysaccharides when pH ranged from 3 to 6, and then the yield decreased with increasing pH. This result may be due to low enzyme activities at higher pH values [22]. Thus pH of 6.0 was the optimal choice for the next work.
3.2. Experimental Design and Analysis of Variance
3.2.1. Building Response Surface Model
Experimental design and observed responses were presented in Table 2. The whole design consisted of 29 experimental points and the data were analyzed by Design-Expert software. As a result, the extraction yield value could be expressed by the following second order polynomial equations:
where Y was the polysaccharide yield, A, B, C, and D were extraction time, extraction temperature, enzyme concentration, and pH, respectively.
Y = 3.19 + 0.38A − 0.14B + 0.034C + 0.096D + 0.50AB − 0.12AC + 0.14AD + 0.13BC − 0.20BD + 0.06CD − 0.70A2 − 0.70B2 − 0.085C2 − 0.68D2
The statistical significance of the regression equation was checked by F-value and p-value, and the analysis of variance (ANOVA) for the response surface quadratic model was summarized in Table 3. The high model F-value (63.31) and low p-value (p < 0.0001) showed that the model was highly significant. The lack of fit F-value with the value of 4.23 indicated the suitability of the model to predict the variations. The determination coefficient (R2 = 0.9845) of the quadratic regression model exhibited that only 1.55% of the total variations could not be explained by the model. The adjusted determination coefficient (R2adj = 0.9161) was also very high, showing the high degree of correlation between the experimental and predicted values. At the same time, the coefficient of the variation (C.V.) with the low value of 4.75 clearly stated the dispersion of data points was around the mean and had a good reliability.
Table 3 also showed that the linear coefficients (A, B, D), the quadratic term coefficients (A2, B2, D2), and the cross product coefficients (AB, AC, AD, BC, BD) significantly affected the yield (p < 0.05 or p < 0.01). In addition, extraction time was the most significant single parameter followed by extraction temperature and pH.
3.2.2. Estimation of the Model Precision
Figure 2A showed the comparison between the actual value and the model predicted value. It could be seen that the distribution of each experimental value was a straight line, indicating that the predicted value of the model was highly consistent with the actual experimental value. Normal probability plot of the studentized residuals was shown in Figure 2B, the distribution of the data points was almost on a straight line, and no serious deviation occurred, suggesting that the model had a good fitting effect. The data in Figure 2C confirmed that all the data were distributed within satisfactory ranges (±3).
3.2.3. Optimization of Experimental Procedures
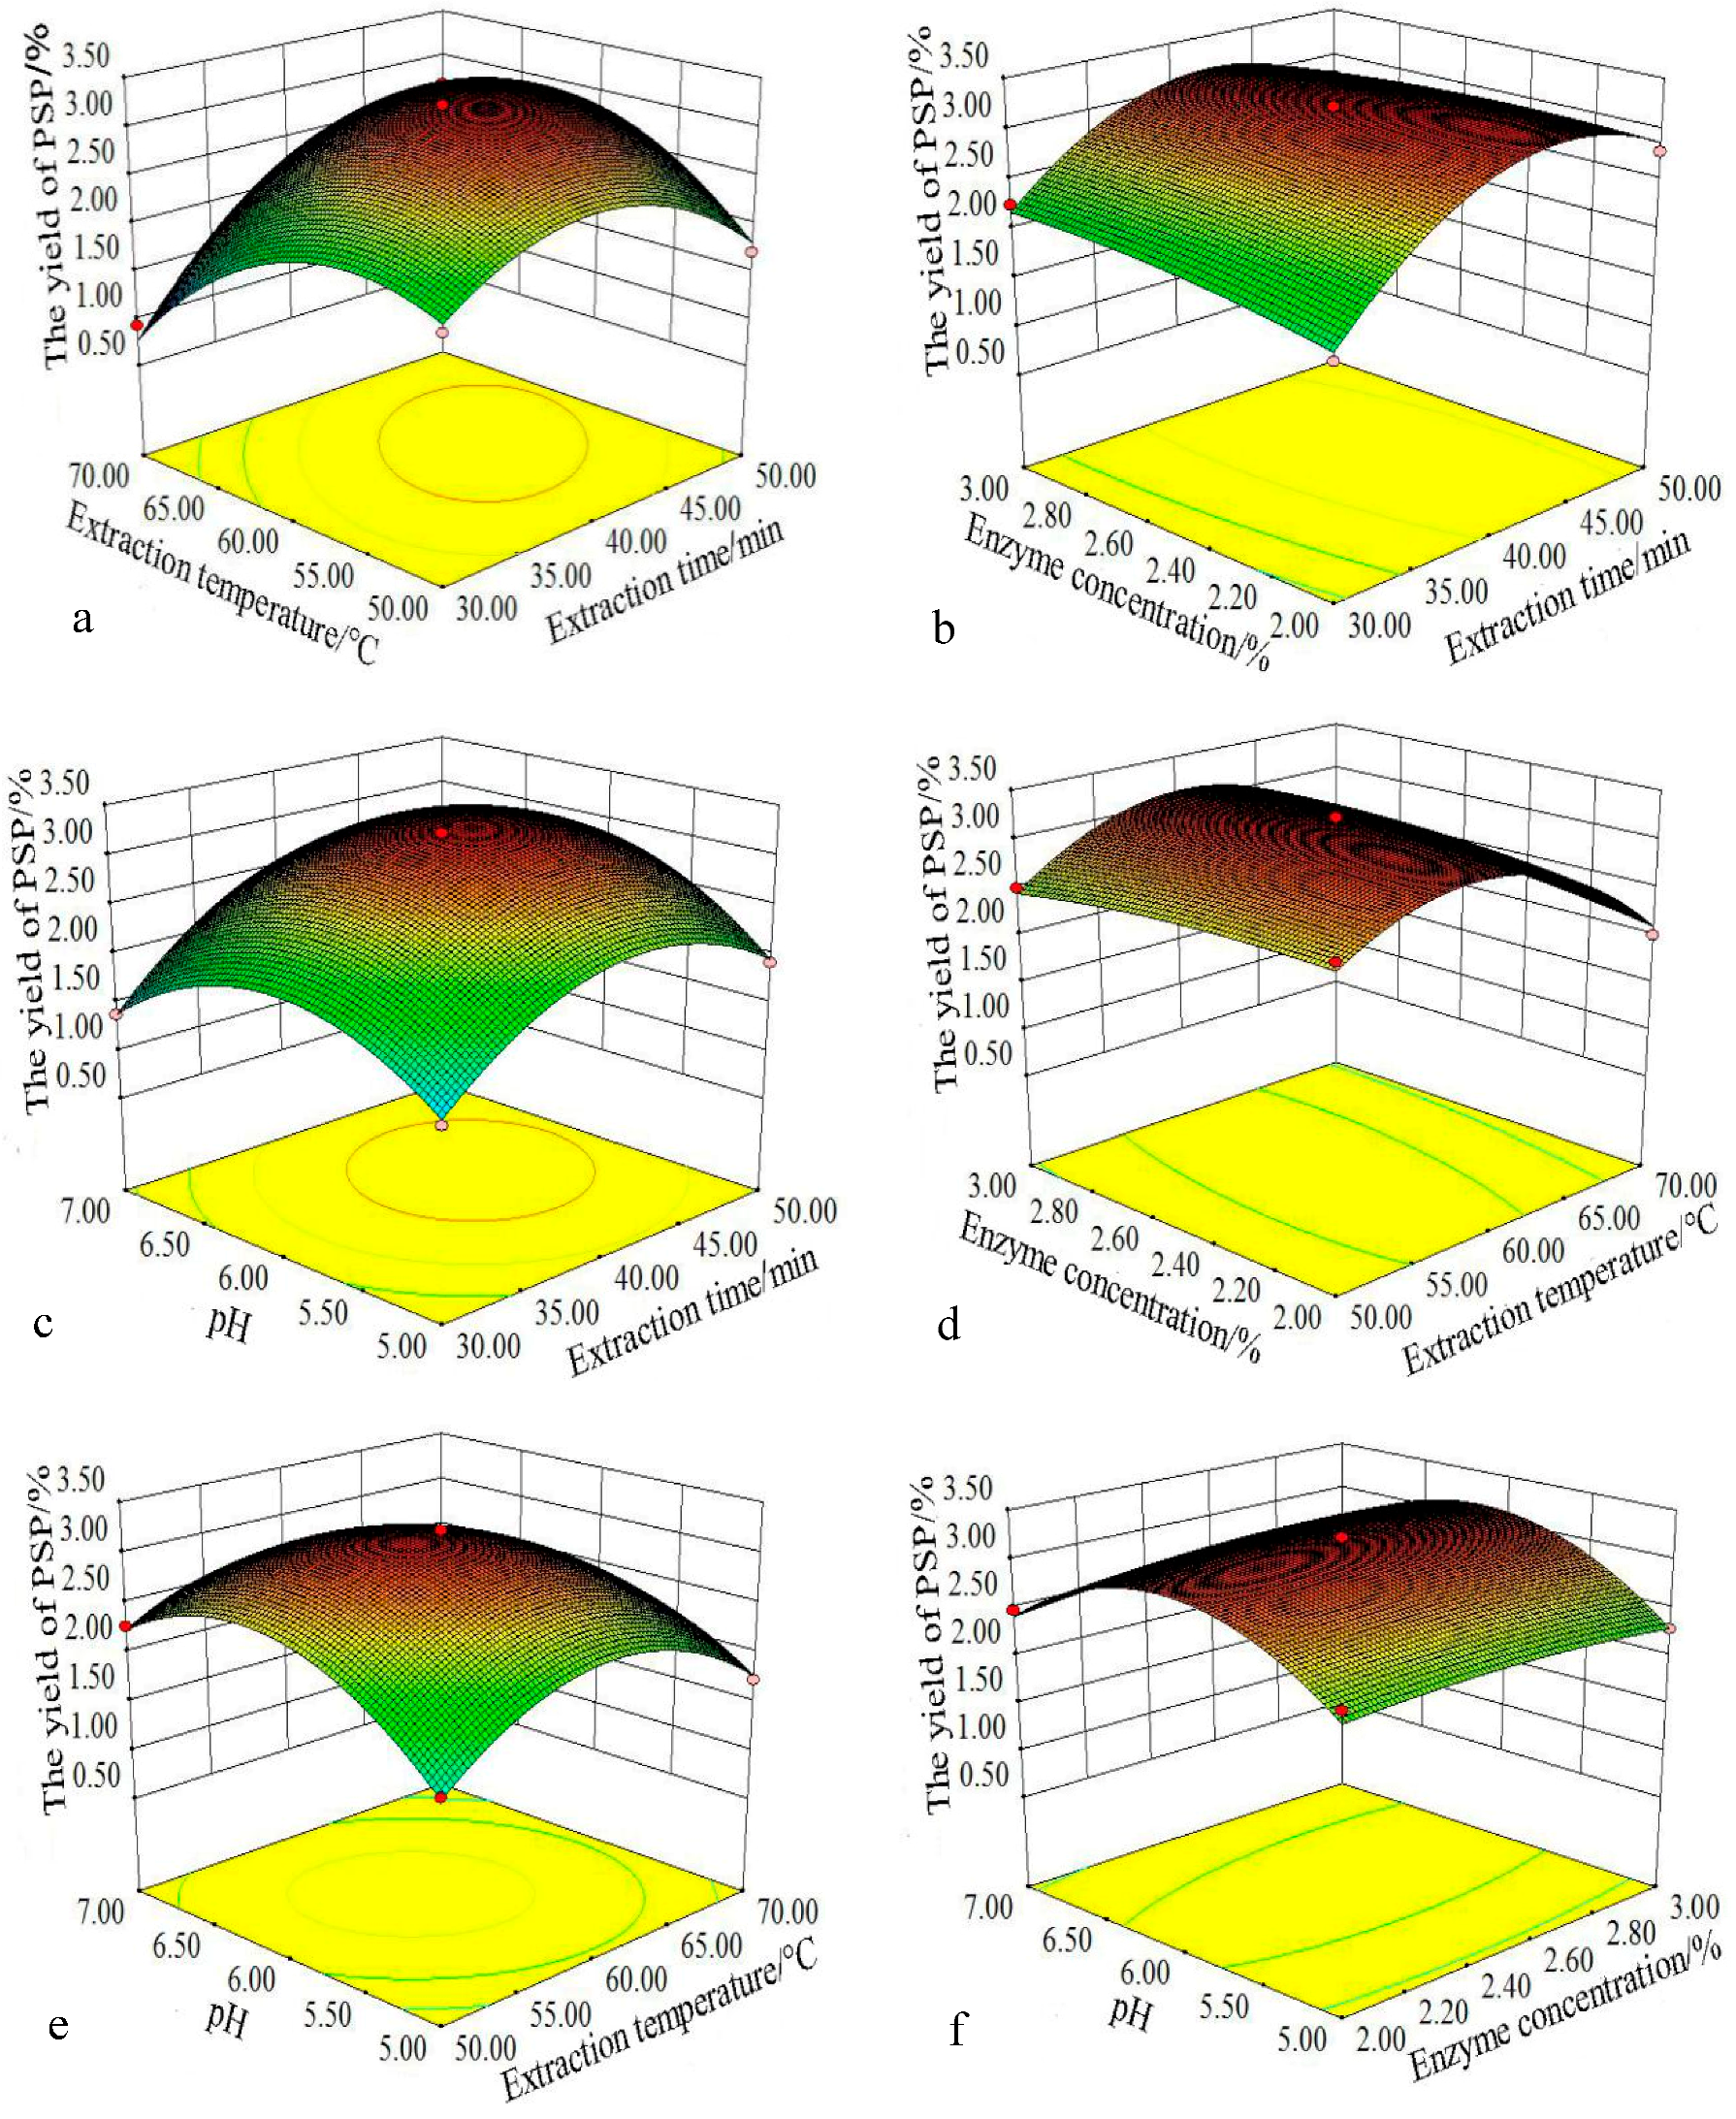
The response surface plots were shown in Figure 3, it was simple to evaluate the presence of any interactions between two variables and to determine the optimum values of the variables.
Figure 3a,c,e showed extraction time (A), extraction temperature (B) and pH (D) had important influences on the yield of PSP, and the interactions between different functions (extraction time and extraction temperature; extraction temperature and pH) also produced very significant influences on the extraction yield. Whereas enzyme concentration (C) exerted a weaker effect on the yield (Figure 3b,d) and the interaction between enzyme concentration and pH was insignificant (Figure 3f).
Based on Figure 3, it could be deduced that the optimal EAE conditions were as follows: Extraction temperature of 59.90 °C, extraction time of 42.78 min, enzyme concentration of 2.52%, and pH of 6.10. Under these conditions, the maximum response was 3.24% predicted by the model.
3.2.4. Validation of the Predictive Model
The parameters were modified slightly in the verification experiment as follows: Extraction temperature of 60 °C, extraction time of 43 min, enzyme concentration of 2.5%, and pH of 6.0. The experimental value of 3.22 ± 0.04% was obtained from three parallel experiments, compared with the prediction of 3.24%, this result confirmed that the response model was precise and satisfactory.
Based on our previous research results, the yield of crude polysaccharides extracted from pumpkin seeds was 2.18% using HWE for 2.5 h [13]. Obviously, EAE showed higher efficiency with a shorter extraction time. At the same time, the yield of PSP (3.22%) using EAE was also higher than that of UAE (2.29%) with extraction time of 24 min and extraction temperature of 50 °C [14]. These data showed that EAE was an excellent method for polysaccharides extraction from pumpkin seeds.
3.3. Purification and Preliminary Characterisation of PSPE
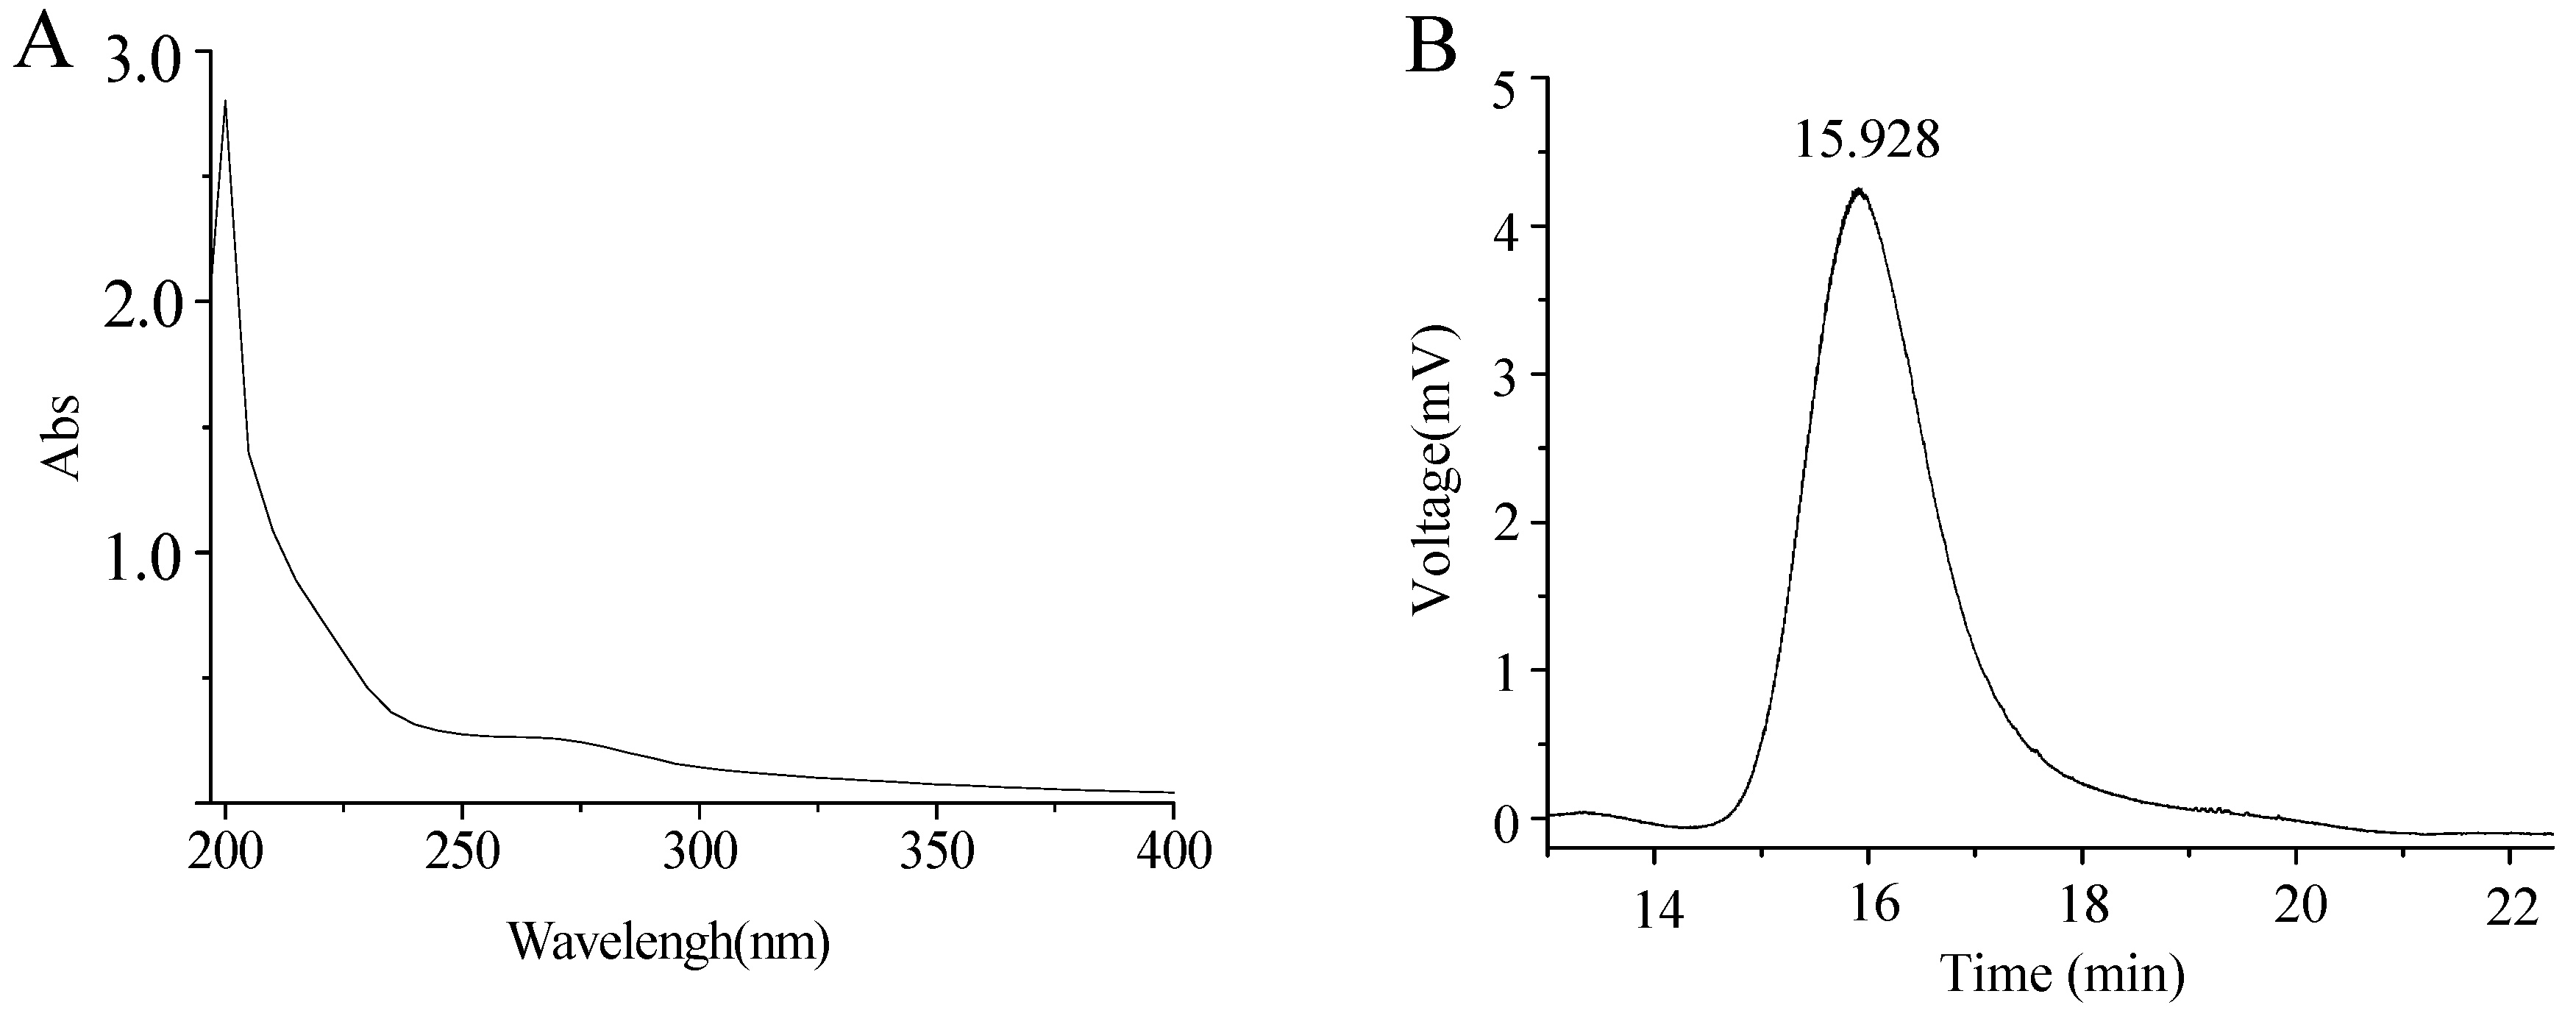
The crude polysaccharides were extracted by EAE, and the free protein was removed by Sevag method. Then the polysaccharide solution was further purified with Q-Sepharose FF column and Sephadex G-25 column, and one main fraction named PSPE was obtained. The yield of PSPE counted with the crude polysaccharides was 18.24%, and the sugar content of PSPE was 87.25% with the protein content of 8.05%. The UV spectrum of PSPE was shown in Figure 4A, the feeble absorption at 260–280 nm also indicated the existence of protein. The purity and molecular weight of PSPE were determined by HPLC, as shown in Figure 4B, PSPE was eluted as a single symmetrical peak, which indicated that PSPE was homogeneous. According to the retention time of the standard samples, the regression equation correlated the molecular weight was lgMw = −0.352t + 9.83, R2 = 0.9987. Thus, the molecular weight of PSPE was calculated as 16,700 g/mol (t = 15.928 min). In our earlier work, HWE and UAE have been used to extract the crude polysaccharides from pumpkin seeds, and then the purified polysaccharides (PSP-I and PSP-1) were gained after further two-step column separation, respectively. According to the molecular weight of PSP-I (21,100 g/mol), PSP-1 (3728 g/mol), and PSPE (16,700 g/mol), PSP-1 extracted by UAE had the smallest molecular weight among three methods (HWE, UAE and EAE), which showed UAE was more suitable to extract polysaccharides with low molecular weight. This result was consistent with the reported literature [16].
GC analysis (GC profile not listed) showed that PSPE contained three monosaccharide species (Man, Glc and Gal in a molar ratio of 1.00:3.84:1.62), which was well matched with that found in PSP-1 (Man, Glc and Gal in a molar ratio of 1.00:4.26:5.78). However, the distinction between the two molar ratios was obvious, indicating that PSPE was a new and different polysaccharides.
3.4. FT-IR Spectrum Analysis
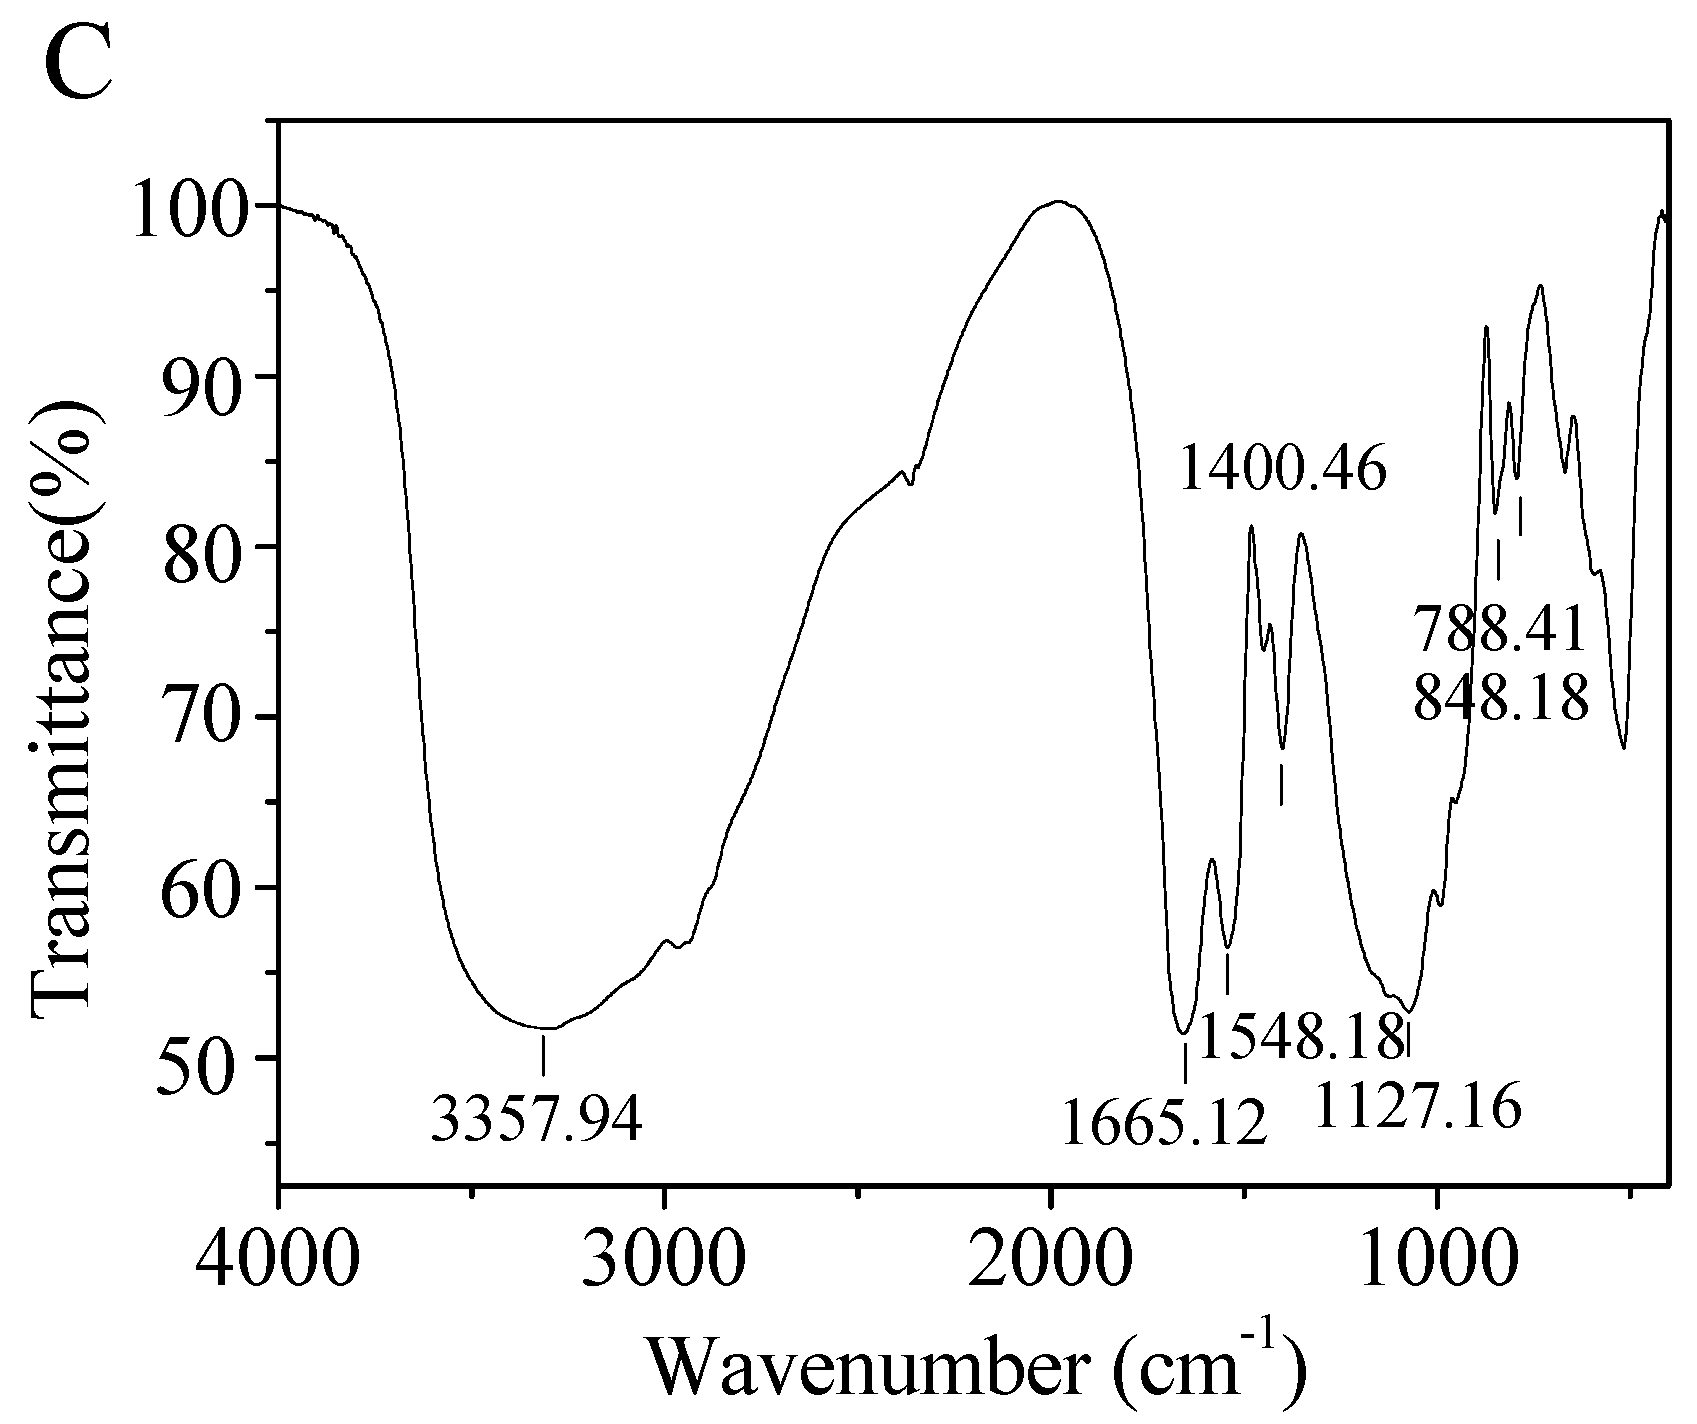
Figure 4C presented the FT-IR spectrum of PSPE. The band around 3357 cm−1 indicated O–H stretching vibration. The high absorbency ranged of 1200–950 cm−1 was the characteristic absorption peak of polysaccharide, which was attributed to C–O–C and C–O–H link band [23]. The two peaks at 1665 and 1548 cm−1 revealed the presence of C=O and N–H bond [24], showing the existence of protein. The absorption peaks at 848 and 788 cm−1 indicated that α- and β-configurations were simultaneously existing in PSPE [25]. Moreover, the bands in the range of 350–600 cm−1 belonged to skeletal modes of pyranose rings [26].
3.5. NMR Analysis
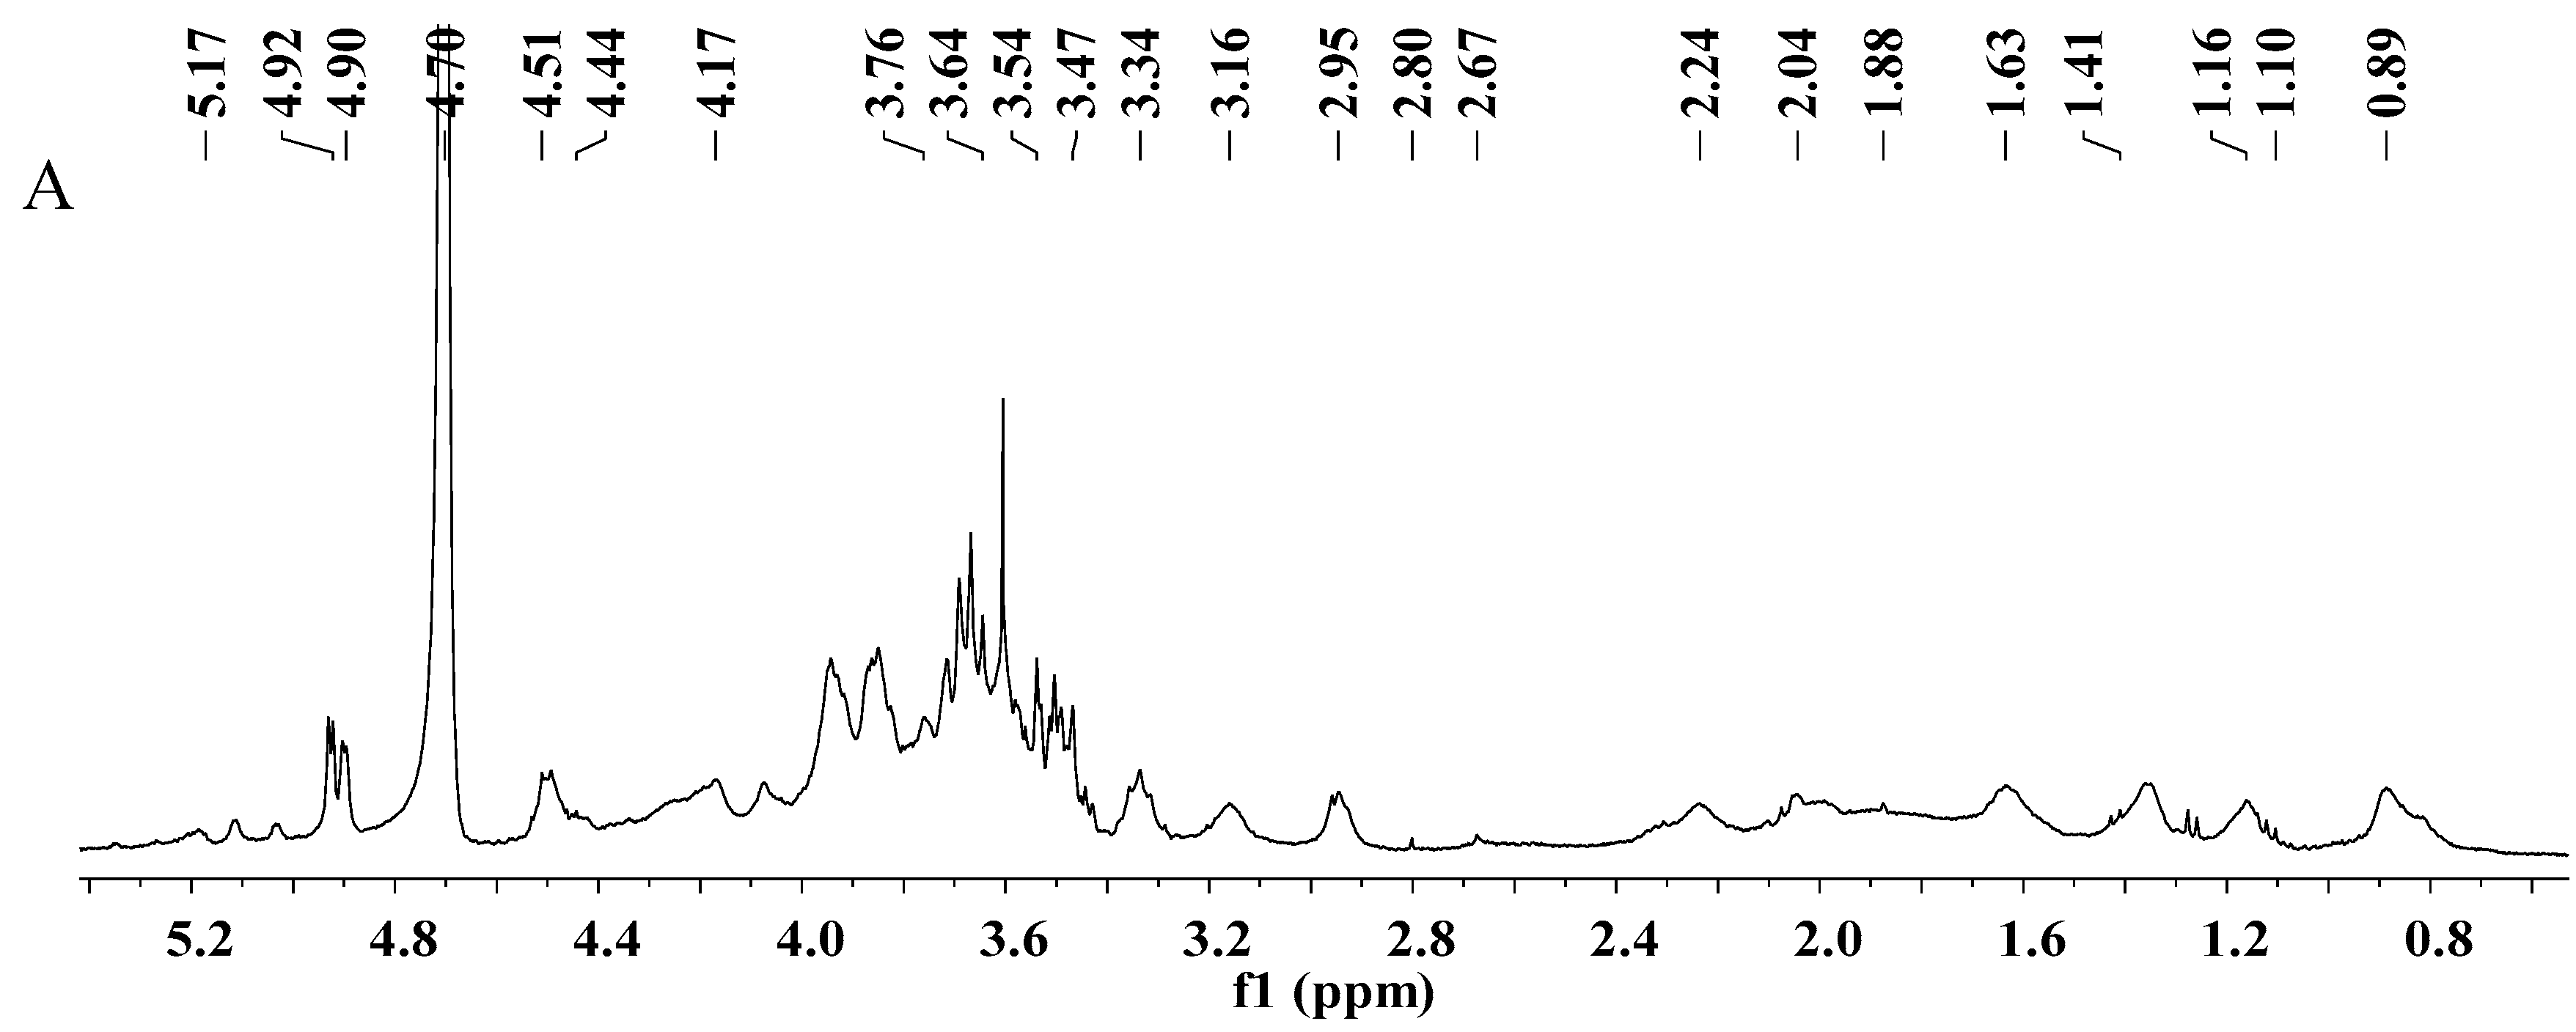
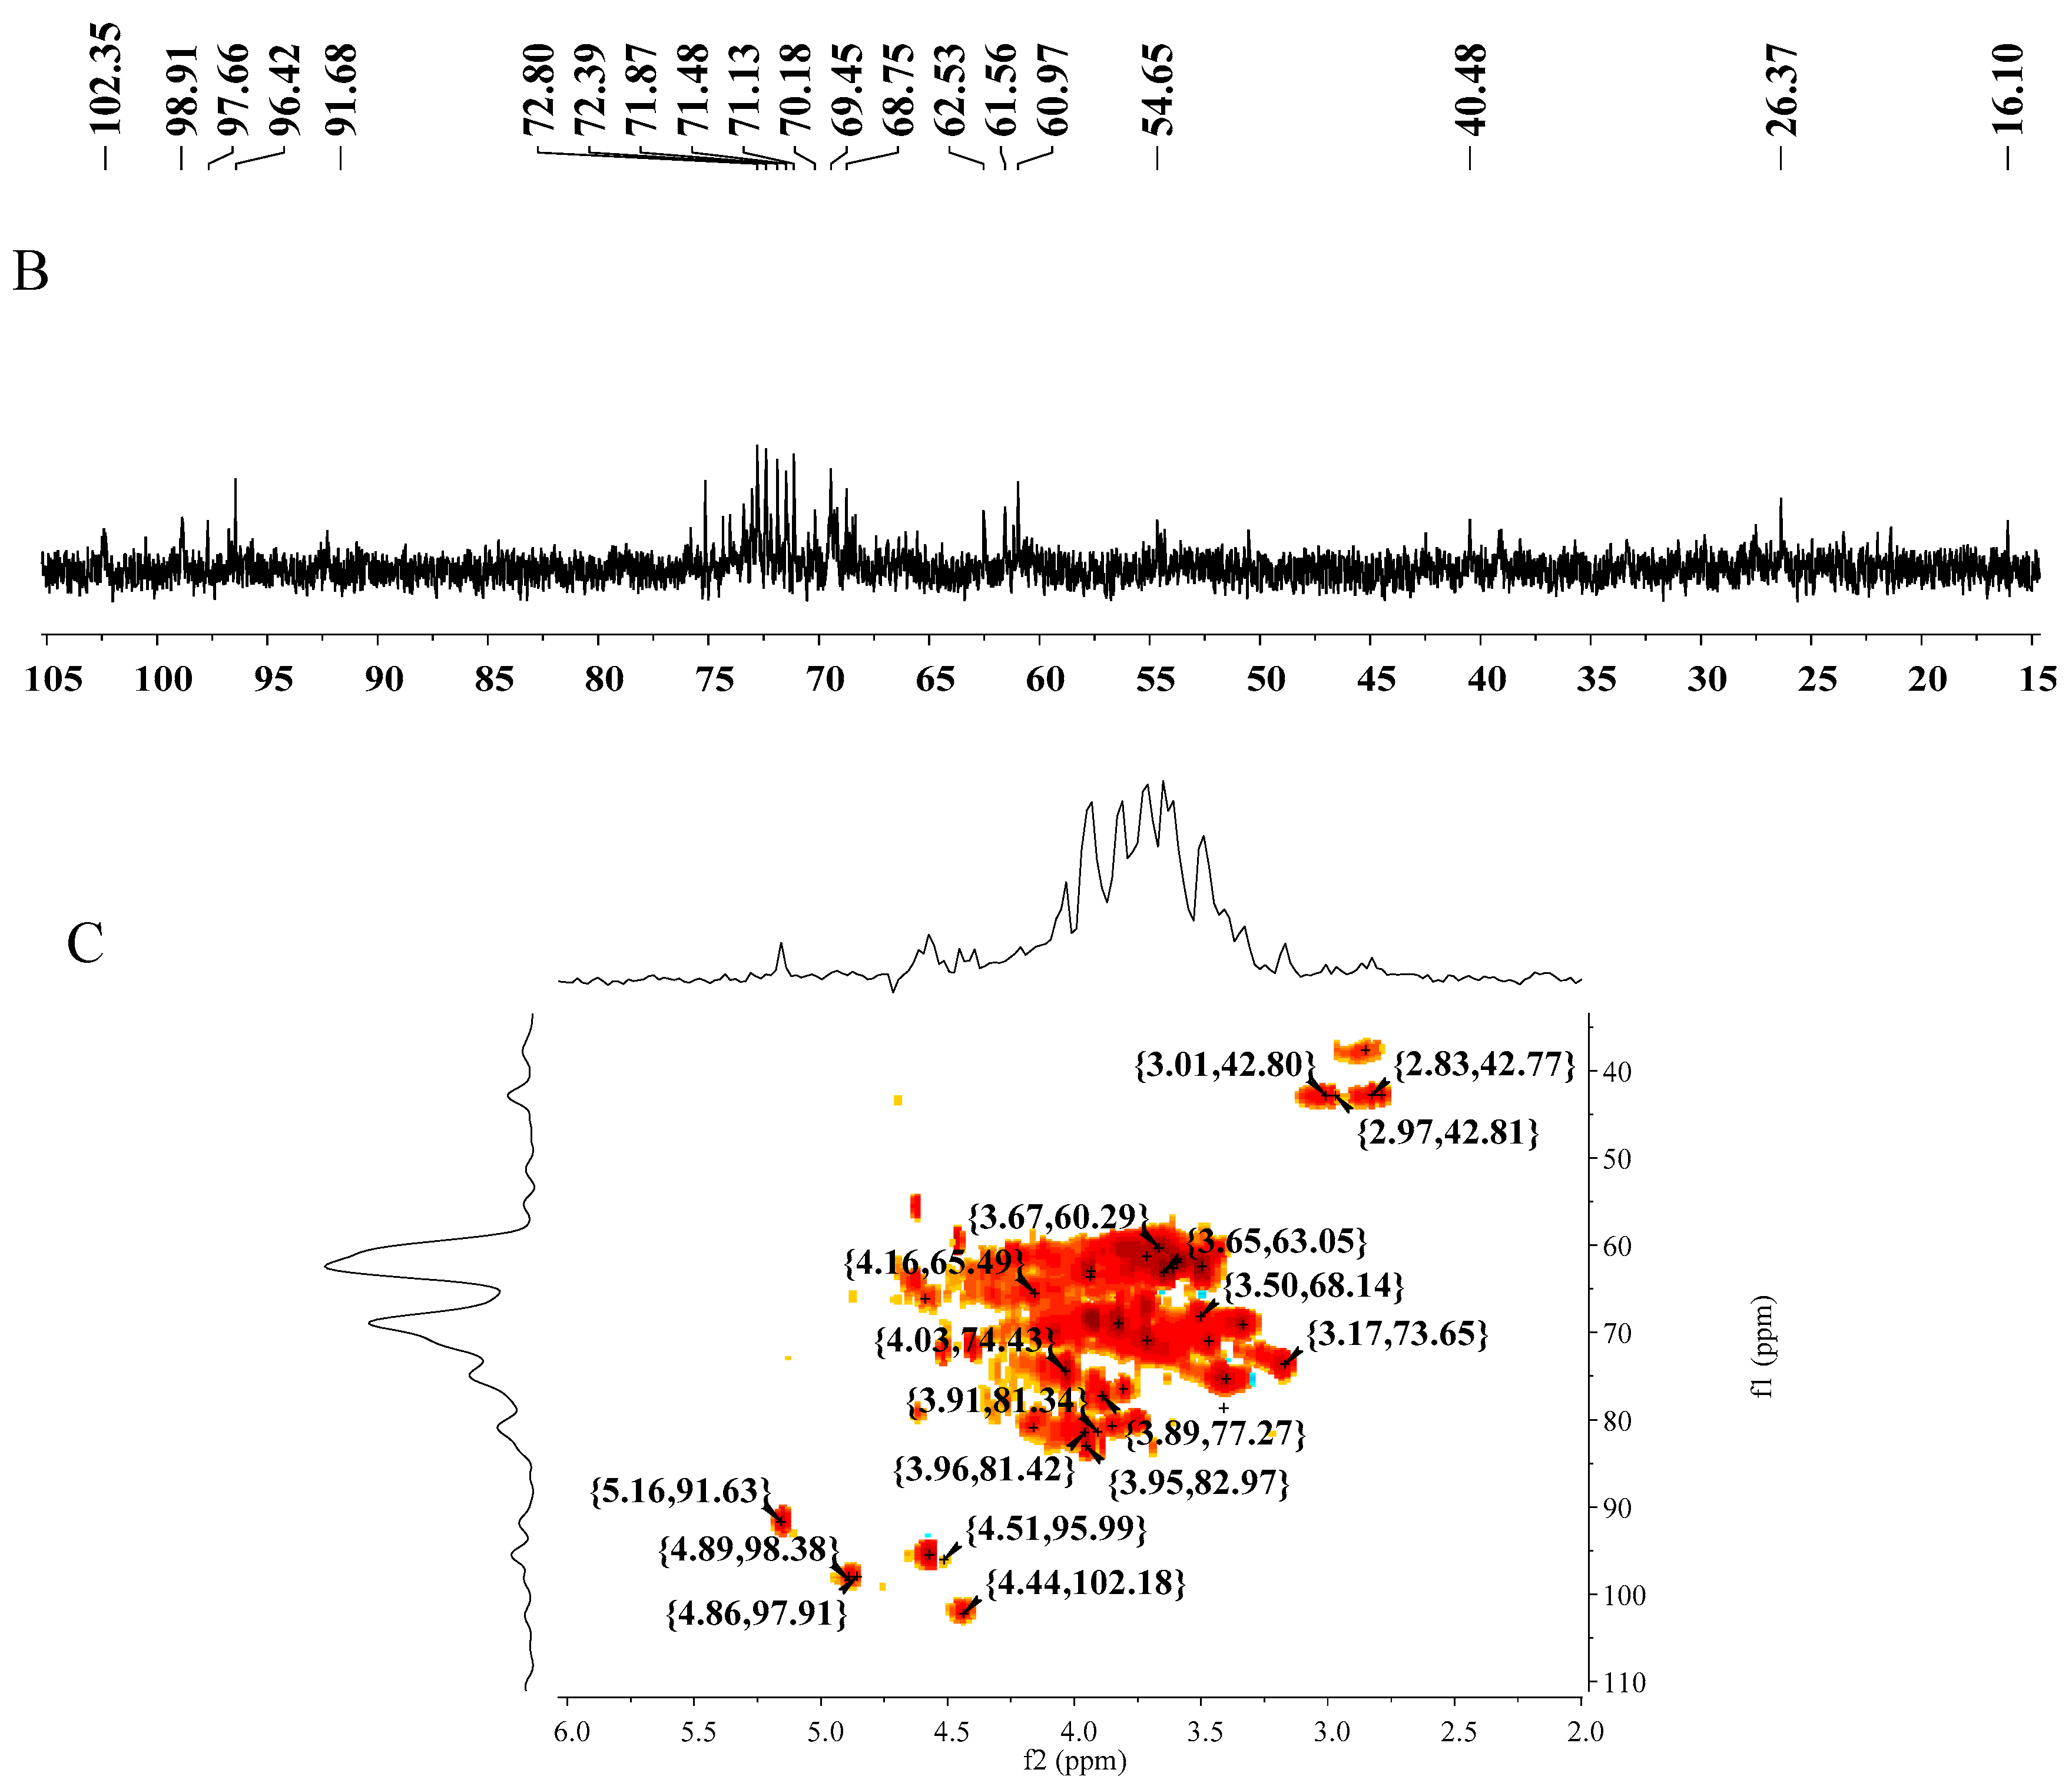
As showed in Figure 5A,B, the signals crowded in the regions of δH 3.0–5.5 ppm and δC 60–110 ppm was the typical distribution of polysaccharides [27]. The chemical shifts of the protons of N-acetyl group (δ 1.0–3.6 ppm) showed the presence of protein [28], this result was agreed with the analytic data of protein content and UV spectrum. In addition, the characteristic chemical shifts of furanose at δ 107–109 ppm and δ 82–84 ppm were absent, which confirmed that PSPE was composed of pyranose [29].
The C-1 signals at δ 5.17, 4.92, 4.90, 4.51, and 4.44 ppm in 1H NMR spectrum showed four β-type glycosidic linkages and one α-type glycosidic linkage [30,31]. The anomeric carbon signals at δ 102.35, 98.55, 97.70, 96.37, and 91.68 in 13C NMR spectrum revealed that PSPE contained five types of monosaccharide residues, which was agreed with the 1H NMR spectrum. As seen in HSQC spectrum (Figure 5C), the chemical shifts of δ 4.44/102.18, 4.89/98.38, 4.86/97.91, 4.51/95.99, and 5.16/91.63 were assigned to the anomeric region of H1/C1. According to the reported literatures [32,33], the chemical shifts of δ 5.16/91.63, 3.47/70.98, 3.81/76.46, 3.96/81.42, 3.89/77.27, and 3.71/61.24 were assigned to H1/C1-H6/C6 of →4)-α-d-Glcp-(1→ The presence of →3,6)-β-d-Glap-(1→ was confirmed by characteristic signals at δ 4.51/95.99 (H1/C1), 3.64/72.93(H2/C2), 3.95/82.97 (H3/C3), 4.03/74.43 (H4/C4), 3.40/75.31 (H5/C5), and 3.93/68.56 (H6/C6) [34,35]. The signals of δ 4.89/98.38, 4.07/70.05, 3.33/69.12, 3.91/81.34, 3.17/73.65, and 3.61/62.63 showed the existence of →4)-β-d-Manp-(1→ residue [36]. In addition, the signal of δ 4.44/102.18 ppm was attributed to H1/C1 of β-d-galactose [15].
Up to now, three purified polysacharides (PSP-I, PSP-1 and PSPE) were isolated from pumpkin seeds. NMR spectra analysis confirmed that PSP-I was mainly contained →4)-β-d-Glcp-(1→, →2)-α-d-Glap-(1→, →6)-α-d-Manp-(1→ and α-d-galactose [15]. The main backbone structure of PSP-1 comprised →6)-β-d-Galp-(1→, →6)-α-d-Glcp-(1→, and →3,6)-β-d-Manp-(1→. Branch linkage was composed of α-d-Glcp-(1→ and →4)-α-d-Galp-(1→ [14]. The present result confirmed that PSPE consisted of →4)-α-d-Glcp-(1→, →3,6)-β-d-Glap-(1→, →4)-β-d-Manp-(1→, and β-d-galactose. All of the data confirmed that these three polysacharides did not have the same structures, even though they had the same monosaccharide composition (Man, Glc and Gal). In addition, the above results further demonstrated that different polysaccharides could be obtained from the same materials with using different extraction methods.
4. Conclusions
In the present study, the extraction conditions of EAE were optimized by RSM. Under the optimum parameters, the yield of polysaccharides (3.22% ± 0.04%) from pumpkin seeds was higher than HWE (2.18%) and UAE (2.29%), which indicated EAE exhibited the highest efficiency for the polysaccharides extraction. A new polysaccharide PSPE with the molecular weight 16,700 g/mol was purified from the crude polysaccharides, and NMR spectra confirmed that PSPE consisted of four sugar residues. Three polysaccharides (PSP-I, PSP-1 and PSPE) with different molecular weight were isolated from pumpkin seeds using three methods (HWE, UAE and EAE), which showed the extraction method had an influence on the molecular weight of the extracted polysaccharide. The influence of different extraction methods on the activities of extracted polysaccharides will be investigated in the future.
Author Contributions
L.W. and D.L. conceived and designed the experiments; F.L. and T.L. performed the experiments; F.L. and Y.X. analyzed the data; Y.Y. and Y.X. contributed reagents/materials/analysis tools; L.W. and D.L. wrote the paper.
Funding
This research was funded by National Natural Science Foundation of China (NO. 31600276) and University Nursing Program for Young Scholars with Creative Talents in Heilongjiang Province (UNPYSCT-2016146).
Acknowledgments
This work was supported by the research group of Food Science and Engineering.
Conflicts of Interest
The authors declare no conflict of interest.
References
- Charoensiddhi, S.; Lorbeer, A.J.; Lahnstein, J.; Bulone, V.; Franco, C.M.M.; Zhang, W. Enzyme assisted extraction of carbohydrates from the brown alga Ecklonia radiata: Effect of enzyme type, pH and buffer on sugar yield and molecular weight profiles. Process Biochem. 2016, 51, 1503–1510. [Google Scholar] [CrossRef]
- Chen, H.; Zhou, X.; Zhang, J. Optimization of enzyme assisted extraction of polysaccharides from Astragalus membranaceus. Carbohydr. Polym. 2014, 111, 567–575. [Google Scholar] [CrossRef] [PubMed]
- Fernández, K.; Vega, M.; Aspé, E. An enzymatic extraction of proanthocyanidins from País grape seeds and skins. Food Chem. 2015, 168, 7–13. [Google Scholar] [CrossRef] [PubMed]
- Babbar, N.; Van Roy, S.; Wijnants, M.; Dejonghe, W.; Caligiani, A.; Sforza, S.; Elst, K. Effect of extraction conditions on the saccharide (neutral and acidic) composition of the crude pectic extract from various agro-industrial residues. J. Agric. Food Chem. 2016, 64, 268–276. [Google Scholar] [CrossRef] [PubMed]
- Mat Yusoff, M.; Gordon, M.H.; Ezeh, O.; Niranjan, K. Aqueous enzymatic extraction of Moringa oleifera oil. Food Chem. 2016, 211, 400–408. [Google Scholar] [CrossRef] [PubMed]
- Cheng, H.; Feng, S.; Jia, X.; Li, Q.; Zhou, Y.; Ding, C. Structural characterization and antioxidant activities of polysaccharides extracted from Epimedium acuminatum. Carbohydr. Polym. 2013, 92, 63–68. [Google Scholar] [CrossRef] [PubMed]
- Wang, J.; Zhao, Y.; Li, W.; Wang, Z.; Shen, L. Optimization of polysaccharides extraction from Tricholoma mongolicum Imai and their antioxidant and antiproliferative activities. Carbohydr. Polym. 2015, 131, 322–330. [Google Scholar] [CrossRef] [PubMed]
- You, Q.; Yin, X.; Zhao, Y. Enzyme assisted extraction of polysaccharides from the fruit of Cornus officinalis. Carbohydr. Polym. 2013, 98, 607–610. [Google Scholar] [CrossRef] [PubMed]
- Rostami, H.; Gharibzahedi, S.M.T. Cellulase-assisted extraction of polysaccharides from Malva sylvestris: Process optimization and potential functionalities. Int. J. Biol. Macromol. 2017, 101, 196–206. [Google Scholar] [CrossRef] [PubMed]
- Zhao, Y.M.; Song, J.H.; Wang, J.; Yang, J.M.; Wang, Z.B.; Liu, Y.H. Optimization of cellulase-assisted extraction process and antioxidant activities of polysaccharides from Tricholoma mongolicum Imai. J. Sci. Food Agric. 2016, 96, 4484–4491. [Google Scholar] [CrossRef] [PubMed]
- Sun, L.; Wu, D.; Ning, X.; Yang, G.; Lin, Z.; Tian, M.; Zhou, Y. α-Amylaseassisted extraction of polysaccharides from Panax ginseng. Int. J. Biol. Macromol. 2015, 75, 152–157. [Google Scholar] [CrossRef] [PubMed]
- Liu, X.; Zhang, M.; Guo, K.; Jia, A.; Shi, Y.; Gao, G.; Liu, C. Cellulase-assisted extraction, characterization, and bioactivity of polysaccharides from Polygonatum odoratum. Int. J. Biol. Macromol. 2015, 75, 258–265. [Google Scholar] [CrossRef] [PubMed]
- Wang, L.B.; Cheng, L.; Xu, Y.Q.; Wang, T.H.; Li, L.B.; Wang, H.S. Extraction technology optimization and antioxidant activity of polysaccharides from pumpkin seeds. Trans. Chin. Soc. Agric. Eng. 2016, 32, 284–290. [Google Scholar] [CrossRef]
- Wang, L.B.; Cheng, L.; Liu, F.C.; Li, T.F.; Yu, Z.Y.; Xu, Y.Q.; Yang, Y. Optimization of ultrasound-assisted extraction and structural characterization of the polysaccharide from pumpkin (Cucurbita moschata) seeds. Molecules 2018, 23, 1207. [Google Scholar] [CrossRef] [PubMed]
- Wang, L.B.; Liu, F.C.; Wang, A.X.; Yu, Z.Y.; Xu, Y.Q.; Yang, Y. Purification, characterization and bioactivity determination of a novel polysaccharide from pumpkin (Cucurbita moschata) seeds. Food Hydrocoll. 2017, 66, 357–364. [Google Scholar] [CrossRef]
- Zhao, C.; Li, X.; Miao, J.; Jing, S.; Li, X.; Huang, L.; Gao, W. The effect of different extraction techniques on property and bioactivity of polysaccharides from Dioscorea hemsleyi. Int. J. Biol. Macromol. 2017, 102, 847–856. [Google Scholar] [CrossRef] [PubMed]
- Liu, D.; Wong, P.T.S.; Dutka, B.J. Determination of carbohydrate in lake sediment by a modified phenol-sulfuric acid method. Water Res. 1973, 7, 741–746. [Google Scholar] [CrossRef]
- Lott, J.A.; Stephan, V.A.; Pritchard, K.A. Evaluation of the Coomassie Brilliant Blue G-250 method for urinary protein. Clin. Chem. 1983, 29, 1946–1950. [Google Scholar] [PubMed]
- Yu, Z.Y.; Liu, L.; Xu, Y.Q.; Wang, L.B.; Teng, X.; Li, X.G.; Li, X.J.; Dai, J. Characterization and biological activities of a novel polysaccharide isolated from raspberry (Rubus idaeus L.) fruits. Carbohydr. Polym. 2015, 132, 180–186. [Google Scholar] [CrossRef] [PubMed]
- Liu, J.C.; Miao, S.; Wen, X.C.; Sun, Y.X. Optimization of polysaccharides (ABP) extraction from the fruiting bodies of Agaricus blazei Murill using responsesurface methodology (RSM). Carbohydr. Polym. 2009, 78, 704–709. [Google Scholar] [CrossRef]
- Yin, X.L.; You, Q.H.; Jiang, Z.H. Optimization of enzyme assisted extractionof polysaccharides from Tricholoma matsutake by response surface methodology. Carbohydr. Polym. 2011, 86, 1358–1364. [Google Scholar] [CrossRef]
- Wu, H.; Zhu, J.; Diao, W.; Wang, C. Ultrasound-assisted enzymatic extraction and antioxidant activity of polysaccharides from pumpkin (Cucurbita moschata). Carbohydr. Polym. 2014, 113, 314–324. [Google Scholar] [CrossRef] [PubMed]
- Jahanbin, K.; Abbasian, A.; Ahang, M. Isolation, purification and structural characterization of a new water-soluble polysaccharide from Eremurus stenophyllus (boiss. & buhse) baker roots. Carbohydr. Polym. 2017, 178, 386–393. [Google Scholar] [CrossRef] [PubMed]
- Wang, L.B.; Xu, Y.Q.; Yu, Z.Y.; Wang, T.H.; Li, L.B. Ethanol fractional precipitation and ultrasonic modification of pumpkin polysaccharides. Trans. Chin. Soc. Agric. Mach. 2015, 46, 215–220. [Google Scholar] [CrossRef]
- Ji, X.; Liu, F.; Peng, Q.; Wang, M. Purification, structural characterization, and hypolipidemic effects of a neutral polysaccharide from Ziziphus Jujuba cv. Muzao. Food Chem. 2018, 245, 1124–1130. [Google Scholar] [CrossRef] [PubMed]
- Zhang, Z.; Liu, W.; Zheng, Y.; Jin, L.; Yao, W.; Gao, X. SGP-2, an acidic polysaccharide from Sarcandra glabra, inhibits proliferation and migration of human osteosarcoma cells. Food Funct. 2014, 5, 167–175. [Google Scholar] [CrossRef] [PubMed]
- Li, B.; Dobruchowska, J.M.; Gerwig, G.J.; Dijkhuizen, L.; Kamerling, J.P. Structural investigation of water-soluble polysaccharides extracted from the fruit bodies of Coprinus comatus. Carbohydr. Polym. 2013, 91, 314–321. [Google Scholar] [CrossRef] [PubMed]
- Agrawal, P.K. NMR spectroscopy in the structure elucidation of oligosaccharides and glycosides. Phytochemistry 1992, 31, 3307–3330. [Google Scholar] [CrossRef]
- Bosco, M.; Miertus, S.; Dentini, M.; Segre, A.L. The structure of gellan in dilute aqueous solution. Biopolymers 2000, 54, 115–126. [Google Scholar] [CrossRef]
- Yan, J.K.; Wang, Y.Y.; Ma, H.L.; Wang, Z.B.; Pei, J.J. Structural characteristics and antioxidant activity in vivo of a polysaccharide isolated from Phellinus linteus mycelia. J. Taiwan Inst. Chem. E 2016, 65, 110–117. [Google Scholar] [CrossRef]
- Dang, Z.L.; Feng, D.M.; Liu, X.H.; Yang, T.; Guo, L.; Liang, J.; Hu, F.; Cui, F.; Feng, S. Structure and antioxidant activity study of sulfated acetamido polysaccharide from Radix Hedysari. Fitoterapia 2013, 89, 20–32. [Google Scholar] [CrossRef] [PubMed]
- Luo, Q.; Tang, Z.; Zhang, X.; Zhong, Y.; Yao, S.; Wang, L.; Lin, C.; Luo, X. Chemical properties and antioxidant activity of a water-soluble polysaccharide from Dendrobium officinale. Int. J. Biol. Macromol. 2016, 89, 219–227. [Google Scholar] [CrossRef] [PubMed]
- Shi, X.D.; Nie, S.P.; Yin, J.Y.; Que, Z.Q.; Zhang, L.J.; Huang, X.J. Polysaccharide from leaf skin of Aloe barbadensis Miller: Part I. Extraction, fractionation, physicochemical properties and structural characterization. Food Hydrocoll. 2017, 73, 176–183. [Google Scholar] [CrossRef]
- Liu, W.; Liu, Y.; Zhu, R.; Yu, J.; Lu, W.; Pan, C.; Yao, W.; Gao, X. Structure characterization, chemical and enzymatic degradation, andchain conformation of an acidic polysaccharide from Lycium barbarum L. Carbohydr. Polym. 2016, 147, 114–124. [Google Scholar] [CrossRef] [PubMed]
- Ruthes, A.C.; Komura, D.L.; Carbonero, E.R.; Sassaki, G.L.; Gorin, P.A.J.; Iacomini, M. Structural characterization of the uncommon polysaccharides obtained from Peltigera canina photobiont Nostoc muscorum. Carbohydr. Polym. 2010, 81, 29–34. [Google Scholar] [CrossRef]
- Xu, Y.; Guo, Y.; Gao, Y.; Niu, X.; Wang, L.; Li, X.; Chen, H.; Yu, Z.; Yang, Y. Seperation, characterization and inhibition on α-glucosidase, α-amylase and glycation of a polysaccharide from blackcurrant fruits. LWT Food Sci. Technol. 2018, 93, 16–23. [Google Scholar] [CrossRef]
Figure 1.
Effect of different experimental variables on the yield of PSP. (a) Extraction time; (b) Extraction temperature; (c) Enzyme concentration; (d) pH.
Figure 1.
Effect of different experimental variables on the yield of PSP. (a) Extraction time; (b) Extraction temperature; (c) Enzyme concentration; (d) pH.


Figure 2.
Estimation of the model precision. (A) Plot of predicted and actual values; (B) The normal % probability plot; (C) Plot of internally studentized residuals versus actual run.
Figure 2.
Estimation of the model precision. (A) Plot of predicted and actual values; (B) The normal % probability plot; (C) Plot of internally studentized residuals versus actual run.

Figure 3.
Response surface (3D) showing the interactions between different extraction parameters. (a) Extraction temperature and extraction time; (b) Enzyme concentration and extraction time; (c) Extraction time and pH; (d) Enzyme concentration and extraction temperature; (e) Extraction temperature and pH; (f) Enzyme concentration and pH.

Figure 4.
Characterization of PSPE. (A: UV scanning spectrum; B: HPLC elution profile; C: FT-IR spectrum).
Figure 4.
Characterization of PSPE. (A: UV scanning spectrum; B: HPLC elution profile; C: FT-IR spectrum).


Figure 5.
1D and 2D NMR spectra of PSPE. (A) 1H NMR spectrum; (B) 13C NMR spectrum; (C) HSQC spectrum.
Figure 5.
1D and 2D NMR spectra of PSPE. (A) 1H NMR spectrum; (B) 13C NMR spectrum; (C) HSQC spectrum.


Table 1.
Factors and levels of Box-Behnken experiment design.
| Factors | Level | ||
|---|---|---|---|
| −1 | 0 | 1 | |
| A (Extraction time/min) | 30 | 40 | 50 |
| B (Extraction temperature/°C) | 50 | 60 | 70 |
| C (Enzyme concentration/%) | 2.0 | 2.5 | 3.0 |
| D (pH) | 5.0 | 6.0 | 7.0 |
Table 2.
Box-Behnken design and observed responses.
| Number | A (Extraction Time, min) | B (Extraction Temperature, °C) | C (Enzyme Concentration, %) | D (pH) | Yield of PSP (Y) % |
|---|---|---|---|---|---|
| 1 | 40 | 70 | 3.0 | 6.0 | 2.31 |
| 2 | 40 | 60 | 2.0 | 5.0 | 2.47 |
| 3 | 50 | 60 | 2.0 | 6.0 | 2.78 |
| 4 | 40 | 60 | 3.0 | 5.0 | 2.29 |
| 5 | 40 | 50 | 2.0 | 6.0 | 2.72 |
| 6 | 50 | 60 | 2.5 | 5.0 | 1.92 |
| 7 | 50 | 50 | 2.5 | 6.0 | 1.71 |
| 8 | 40 | 60 | 2.5 | 6.0 | 3.22 |
| 9 | 30 | 60 | 3.0 | 6.0 | 2.25 |
| 10 | 50 | 70 | 2.5 | 6.0 | 2.68 |
| 11 | 40 | 70 | 2.5 | 5.0 | 1.73 |
| 12 | 40 | 60 | 2.5 | 6.0 | 3.08 |
| 13 | 40 | 70 | 2.0 | 6.0 | 2.01 |
| 14 | 30 | 50 | 2.5 | 6.0 | 1.97 |
| 15 | 30 | 60 | 2.5 | 7.0 | 1.38 |
| 16 | 40 | 70 | 2.5 | 7.0 | 1.53 |
| 17 | 40 | 60 | 2.5 | 6.0 | 3.21 |
| 18 | 40 | 60 | 2.5 | 6.0 | 3.20 |
| 19 | 50 | 60 | 2.5 | 7.0 | 2.44 |
| 20 | 40 | 60 | 2.5 | 6.0 | 3.22 |
| 21 | 40 | 50 | 2.5 | 5.0 | 1.67 |
| 22 | 40 | 60 | 2.0 | 7.0 | 2.48 |
| 23 | 50 | 60 | 3.0 | 6.0 | 2.77 |
| 24 | 30 | 60 | 2.0 | 6.0 | 1.79 |
| 25 | 40 | 60 | 3.0 | 7.0 | 2.54 |
| 26 | 30 | 60 | 2.5 | 5.0 | 1.41 |
| 27 | 40 | 50 | 3.0 | 6.0 | 2.50 |
| 28 | 40 | 50 | 2.5 | 7.0 | 2.27 |
| 29 | 30 | 70 | 2.5 | 6.0 | 0.93 |
Table 3.
Analysis of variance for the second-order polynomial model.
| Source | Sum of Squares | DF | Mean Square | F-Value | p-Value |
|---|---|---|---|---|---|
| Model | 10.50 | 14 | 0.75 | 63.31 | ** |
| A | 1.74 | 1 | 1.74 | 146.90 | ** |
| B | 0.23 | 1 | 0.23 | 19.15 | ** |
| C | 0.014 | 1 | 0.014 | 1.18 | |
| D | 0.11 | 1 | 0.11 | 9.30 | ** |
| AB | 1.01 | 1 | 1.01 | 85.25 | ** |
| AC | 0.055 | 1 | 0.055 | 4.66 | * |
| AD | 0.076 | 1 | 0.076 | 6.38 | * |
| BC | 0.068 | 1 | 0.068 | 5.71 | * |
| BD | 0.16 | 1 | 0.16 | 13.50 | ** |
| CD | 0.014 | 1 | 0.014 | 1.22 | |
| A2 | 3.14 | 1 | 3.14 | 264.83 | ** |
| B2 | 3.14 | 1 | 3,14 | 264.83 | ** |
| C2 | 0.047 | 1 | 0.047 | 4.00 | |
| D2 | 3.03 | 1 | 3.03 | 255.39 | ** |
| Residual | 0.17 | 14 | 0.012 | ||
| Lack of fit | 0.15 | 10 | 0.015 | 4.23 | |
| Pure error | 0.014 | 4 | 3.58 × 10⁻³ | ||
| Cor total | 10.67 | 28 | |||
| C.V.% | 4.75% | ||||
| R2 | 0.9845 | ||||
| adj-R2 | 0.9161 |
Notes: ** p < 0.01; * p < 0.05.
© 2018 by the authors. Licensee MDPI, Basel, Switzerland. This article is an open access article distributed under the terms and conditions of the Creative Commons Attribution (CC BY) license (http://creativecommons.org/licenses/by/4.0/).
Share and Cite
MDPI and ACS Style
Wang, L.; Liu, F.; Li, T.; Liu, D.; Xu, Y.; Yang, Y. Enzyme Assisted Extraction, Purification and Structure Analysis of the Polysaccharides from Naked Pumpkin Seeds. Appl. Sci. 2018, 8, 1866. https://doi.org/10.3390/app8101866
AMA Style
Wang L, Liu F, Li T, Liu D, Xu Y, Yang Y. Enzyme Assisted Extraction, Purification and Structure Analysis of the Polysaccharides from Naked Pumpkin Seeds. Applied Sciences. 2018; 8(10):1866. https://doi.org/10.3390/app8101866
Chicago/Turabian StyleWang, Libo, Fangcheng Liu, Tengfei Li, Dawei Liu, Yaqin Xu, and Yu Yang. 2018. "Enzyme Assisted Extraction, Purification and Structure Analysis of the Polysaccharides from Naked Pumpkin Seeds" Applied Sciences 8, no. 10: 1866. https://doi.org/10.3390/app8101866
Note that from the first issue of 2016, this journal uses article numbers instead of page numbers. See further details here.