Application of Transient Electromagnetic Method for Investigating the Water-Enriched Mined-Out Area


1
College of Mining Engineering, Taiyuan University of Technology, Taiyuan 030024, China
2
Shanxi Institute of Geological Survey, Taiyuan 030006, China
3
Department of Chemical Engineering, School of Engineering, The University of Western Australia, Perth 6009, Australia
*
Author to whom correspondence should be addressed.
Appl. Sci. 2018, 8(10), 1800; https://doi.org/10.3390/app8101800
Submission received: 29 August 2018
/
Revised: 18 September 2018
/
Accepted: 26 September 2018
/
Published: 2 October 2018
(This article belongs to the Section Environmental Sciences)
Abstract
:Featured Application
This work provides detailed geological information to the coal mining enterprise for further coal-mining practices safety arrangement.
Abstract
The water-enriched mined-out area, which led to frequent accidents and the serious destruction of ecological environment and serious threat to coal-mining practices. To ensure safe mining practices and to avoid the intrusion of water from the bases of coal deposits, the detection of the mined-out areas, especially the water-filled mined-out area in advanced, is one of the most important issues. This research focuses on detecting mined-out area enriched by water with the large-loop transient electromagnetic method. Data acquisition system was arranged along 23 survey lines, and the total of 1975 survey points were recorded. An inversion technique was used to interpret the TEM data. The inversion results suggested that the mined-out areas enriched by water always exhibit a very low-resistivity, the resistivity contour present closed circle sharp. There are three main water enriched mined-out areas, named JS1, JS2, and JS3 in the north part of the survey area, as well as three main water weak-enriched areas named RJS1, RJS2 and RJS3 in the west and southwest part of the survey area can be inferred by TEM, the interpretation results were verified by drilling. Large loop TEM is proved as an efficient way to investigate water enriched mined-out areas under the rugged topography conditions, and this work provides more detailed geological information to the coal mining enterprise for further coal-mining practices safety arrangement.
1. Introduction
China is currently the world’s largest coal miner, and it is also the largest consumer of coal in the world [1,2,3,4,5,6]. The start of the 21st century was a golden era for the coal sector, and the rapid expansion of coal firms led to huge profits [7,8]. However, based on China’s existing technologies, the mining coal lead to huge mined-out regions. Mined-out areas of different scales will occur, which results in unstable stress and it hence brings stress concentration. Under the action of overlying rocks, deformation, cracking and dislocation will occur, leading to the formation of caving zone, fracture zone, and bent deformation belt [9,10]. Mined-out areas can be water filled, when water inrushes or surface water leaks through cracks into excavated areas, surface damage that is caused by subsequent subsidence might appear [11]. A typical collapsed area can be divided into three zones, such as Caving zone, Fault zone, and crooked zone, as shown in Figure 1 [11,12,13,14].
In most coal fields in China, the mined-out regions are enriched by water, which led to frequent accidents and the serious destruction of ecological environment and serious threat to coal-mining practices [8,15,16]. Therefore the detection of the mined-out areas, especially the water-filled mined-out area in advance, is one of the most important issues [17].
Recently, the main exploration technologies in mined-out areas are drilling exploration and geophysical prospecting [17]. Although the former technology is accuracy, its project volume and cost are massive and the controlled range is limited [18,19]. The geophysical prospecting is a useful, safe, economical, and rapid way to detect the mined-out areas. Therefore, the mined-out areas detection method is generally given priority to with geophysical prospecting, and drilling technical method validation is complementary [16].
Geophysical method especially Transient Electromagnetic (TEM) technique, as being non-invasive and cost-effective, acquisition of strong signals, deep levels of penetration, easy deployment, and suitability for geological exploration, which remains the first choice to explore the target with conductive characters. TEM has been widely used in various fields, such as engineering geology [20] and environmental geophysics investigations [21], mining [22], urban construction [23], tunnel prediction, and groundwater [24] and geothermal explorations. Due to its sensitivity to conductive geologic body when compared to the surrounding rocks with high resistivity, TEM has received great attention in the mined-out area with water investigations [25].
In this paper, a novel large loop TEM method that combines the advantages of high signals to noise ratio, large investigation depths has been used to investigate geological structures and electrical characteristics in order to map the water-enriched mined-out areas within the survey region. The survey area was located in a coalfield located in the Shanxi Province, northern China [18]. The large loop TEM technique was employed successfully in detecting the water-enriched mined-out areas at a depth of 300 m. These findings were verified by drillings.
2. Materials and Methods
2.1. Geologic Setting
The survey region is located in the central part of Lingshi City, Shanxi Province, China, between the Lvliang Mountain and Taihang Mountain. The survey region is typically a loess hilly area, the top of the mountain is extensively covered by loess and dense vegetation, (Figure 2), and the loess in the study area with good electrical conductivity. The elevation of the survey area sharply changes at different sites. The highest point with an elevation of 1065.1 m is located at the top of the mountain in the north part of the survey area, and the lowest point with an elevation of 806.2 m is located in the valley of the southwest part of the survey area (Figure 3) [12,26].
The strata from youngest to oldest in the survey area are Quaternary (Q), Ermaying formation (T2er), Heshanggou formation (T2h) and Liujiagou formation (T2l) of Triassic, Shiqianfeng formation (P2sh), Upper Shihezi formation (P2s), Lower Shihezi formation (P1x), and Shanxi formation (P1s) of Permian, Taiyuan formation (C3t) and Benxi formation (C2b) of Carboniferous and Fengfeng formation(O2f) of Ordovician, respectively. According to the borehole named ZK1, ZK4, ZK5 and the other geophysical measurements, the stratum distribution, lithology, and electrical property of the survey area are listed in Table 1.
2.2. Theory of Large-Loop TEM
For the large-fixed loop source given in Figure 4, the four sides of the loop are named A, B, C, and D, respectively, its dimensions are 2a and 2b in the X and Y directions, Receiver (, ) located inside the transmitter loop. The total vertical component contribution Hz is the sum of each side [27]:
where HZA, HZB, HZC, and HZD represent the electromagnetic field contributions from sides A, B, C, and D, respectively. For a uniform half space, the vertical component of the magnetic field due to a single dipole is [28]
erf (u) is the complementary error function, I is the transmitter current (A), dl is the dipole length, and r is the distance between the transmitter and the receiver.
Therefore, the electromagnetic field contributions from the transmitter loop sides A, B, C, and D are given by:
In general, the data collected from a large loop TEM system consist of vertical voltage measurements at different time intervals after the current is switched off. The relationship between the vertical voltage and vertical component of the magnetic field is given by [29,30]:
M is the magnetic moments of received loop, is the permeability of free space, and t is the decay time after the current is switched off.
L is the side length of the transmitter loop, L = 2a.
2.3. Field Operation
A large-loop TEM measurement was carried out along a section of proposed location, data acquisition system was arranged along 23 survey lines, the interval of the lines was 40 m, and the survey sites along the survey line with the interval of 20 m covers an area of 1.53 km2, and the total of 1975 survey points were recorded. The GDP-32 system that was developed by Zonge Engineering and Research Organization was adopted in our measurements, and a magnetic sensor with effective receiving areas of 10,000 m2 was used to receive the induced voltage.
In general, the data acquisition areas of a large loop TEM device are located in about one-third of each side length in the loop central (Figure 5). Because in these area, the induced electromagnetic field values distributed in this area can be considered as uniform [33].
Different fundamental frequencies have different observation time [14,32]. In general, the lower frequency, the longer observation time, but with lower efficiency. If the fundamental frequency is too high, then the detecting depth cannot be able to reach the depth of the investigate target. So, it is necessary to test the fittest frequency in the survey area. Fundamental frequency of 32 Hz, 16 Hz, and 8 Hz were chosen (Figure 6). It can be seen that, if the decay time t shorter than 2 ms, all the results of the three different frequencies match each other well, the quality of the acquired raw data is accurate and reliable. But, the observation time of 32 Hz data is shorter than 6 ms, the detecting depth is too shallow [33]. We also can obtain that the when the decay time t longer than 9 ms, the date of 8 Hz have lower signal to noise ratio, otherwise the fundamental frequency of 16 Hz was chosen in this work (Figure 6).
Note that the transmitter loop is square shape with the side length size of 480 × 480 m, the transmitter voltage is 120 V, and the strength of the transmitting current is 15 A.
3. Results and Interpretation
The TEM data analysis consisted of many components, as follows: data pro-processing, qualitative analysis, data inversion, and subsequent geological interpretation of the results [34,35]. Before the inversion, preprocessing work must be done to the raw data. In view of the characteristics of the wide frequency band and the fast attenuation of the TEM signal, it is difficult to directly smooth the decay curve of one measurement point. Therefore, we make the five-point smoothing to the data of the same time channel but of different measuring points [34]. Then, we inverted the smooth data using the TEMINV procedures.
Figure 7, Figure 8, Figure 9 and Figure 10 show the resistivity inversion results, together with a geologic interpretation of survey line 320, 600, 880, and 960, respectively. According to the results of the inversion, the resistivity tendency of the survey area is low-medium-high from shallow to deep in the normal stratum, but if there are mined-out areas that exist, the resistivity structure may be changed. The cross-section diagram with blue color on behalf of geological structures with low-resistivity, and the red color represent high-resistivity. The color blue-green-yellow-red indicated that the resistivity is increased.
In line 320 (Figure 7), the elevation higher than 890 m with the resistivity being lower than 70 Ω·m represents unconsolidated sediments in the Quaternary formation, the thickness of this layer changed at different area, the thickness at the ridge is thicker than valley. The elevation of No. 10 coal bed is decreased slowly from west to east, and the average elevation is 770 m, the resistivity range from 200 to 270 Ω·m in normal coal bed, and there are two main parts of abnormal areas with the resistivity lower than 150 Ω·m indicate the mined-out area with water, due to the different volume of water that is filled in the areas, the resistivity varies.
In line 600 (Figure 8), the elevation higher than 860 m with the resistivity lower than 70 Ω·m represents unconsolidated sediments in the Quaternary formation, and there are three small main parts of abnormal areas with the resistivity lower than 150 Ω·m indicate the mined-out area with water.
In line 880 (Figure 9), the elevation higher than 880 m with the resistivity lower than 70 Ω·m represents unconsolidated sediments in the Quaternary formation, and there are two large parts of abnormal areas with the resistivity being lower than 120 Ω·m indicate the mined-out area with water.
In line 960 (Figure 10), the elevation that is higher than 930 m with the resistivity lower than 70 Ω·m represents unconsolidated sediments in the Quaternary formation, and there are three large parts of abnormal areas with the resistivity lower than 120 Ω·m indicate the mined-out area with water.
Figure 11 shows the horizontal slice of the apparent resistivity values of the No. 9 coal bed, with the average elevation being about 780 m. The areas with an apparent resistivity less than 40 Ω·m were defined as water enriched areas, and the areas with an apparent resistivity range from 50 to 90 Ω·m were defined as weak-enriched areas. The results shows that there are three main parts of water enriched areas with the resistivity less than 40 Ω m exist in the north part of the survey area. Named JS1, JS2, and JS3, and there are three main parts of water weak-enriched areas with the resistivity range from 50 to 90 Ω·m lactated at the west and southwest part of the survey area, named RJS1, RJS2, and RJS3. The water volume of the water weak-enriched areas may less than the water enriched areas.
In order to verify the interpretation result, a borehole about 350 m depth was drilled in the center of JS3. The drilling results agreed well with interpretation result.
4. Conclusions
This work emphasizes that the application of the large loop TEM technique is a valuable tool in investigating the water enriched mined-out areas under the rugged topography conditions, and have been proven to be suitable for deep geological explorations. The GDP-32 instrument and ANT-6 magnetic probe were utilized for the practical geological exploration. The device operated at a fundamental frequency of 16 Hz with the 120 V transmitter voltage and 15 A transmitting current.
The following conclusions were obtained: (1) the mined-out areas enriched by water always exhibit a very low-resistivity, the resistivity contour present closed circle sharp; (2) There are three main water enriched mined-out areas, named JS1, JS2, and JS3, as well as three main water weak-enriched areas, named RJS1, RJS2, and RJS3, can be inferred by TEM, the interpretation result was verified by drilling; (3) Large loop TEM is an efficient way to investigate water enriched mined-out areas under the rugged topography conditions.
Author Contributions
Data curation, X.L.; Formal analysis, P.Y. and S.Y.; Funding acquisition, C.Y.; Investigation, X.L., P.Y. and S.Y.; Project administration, E.L.; Resources, E.L.; Writing—original draft, C.Y.; Writing—review & editing, C.Y. and J.L. And all authors have read and approved the final manuscript.
Funding
This research was funded by the financial support of the National Natural Science Foundation of China (No. 51504158) and Natural Science Foundation of Shanxi Province (Grant No. 201601D202085).
Conflicts of Interest
The authors declare no conflict of interest.
References
- Wu, C.; Hu, X.; Wang, G.; Xi, Y.; Lin, W.; Liu, S.; Yang, B.; Cai, J. Magnetotelluric Imaging of the Zhangzhou Basin Geothermal Zone, Southeastern China. Energies 2018, 11, 2170. [Google Scholar] [CrossRef]
- Imal, M.; Yilmaz, K.; Pinarbasi, A. Energy Efficiency Evaluation and Economic Feasibility Analysis of a Geothermal Heating and Cooling System with a Vapor-Compression Chiller System. Sustainability 2015, 7, 12926–12946. [Google Scholar] [CrossRef] [Green Version]
- He, L.F.; Chen, L.; Xi, X.L.; Zhao, X.F.; Chen, R.J.; Yao, H.C. Mapping the Geothermal System Using AMT and MT in the Mapamyum (QP) Field, Lake Manasarovar, Southwestern Tibet. Energies 2016, 9, 855. [Google Scholar] [CrossRef]
- Majorowicz, J.; Minea, V. Geothermal Energy Potential in Low Enthalpy Areas as a Future Energy Resource: Identifying Feasible Targets, Quebec, Canada, Study Case. Resources 2015, 4, 524–547. [Google Scholar] [CrossRef] [Green Version]
- Topliceanu, L.; Puiu, G.P. Contribution of Geothermal Resources to Energy Autonomy: Evaluation and Management Methodology. Energies 2016, 9, 612. [Google Scholar] [CrossRef]
- Maryanto, S.; Dewi, C.N.; Syahra, V.; Rachmansyah, A.; Foster, J.H.; Nadhir, A.; Santoso, D.R. Magnetotelluric-Geochemistry Investigations of Blawan Geothermal Field, East Java, Indonesia. Geosciences 2017, 7, 41. [Google Scholar] [CrossRef]
- Yu, X.; Wang, X.B.; Li, X.J.; Lin, X.J.; Yang, F.; Tang, M.E. Three-dimensional finite difference forward modeling of the transient electromagnetic method in the time domain. Chin. J. Geophys. 2017, 60, 810–819. [Google Scholar]
- Xue, G.Q.; Yan, S.; Zhou, N.N. Theoretical study on the errors caused by dipole hypothesis of large-loop TEM response. Chin. J. Geophys. 2011, 54, 2389–2396. [Google Scholar]
- Younger, P.L. Geothermal Energy: Delivering on the Global Potential. Energies 2015, 8, 11737–11754. [Google Scholar] [CrossRef] [Green Version]
- Lewerissa, R.; Sismanto, S.; Setiawan, A.; Pramumijoyo, S. The Study of Geological Structures in Suli and Tulehu Geothermal Regions (Ambon, Indonesia) Based on Gravity Gradient Tensor Data Simulation and Analytic Signal. Geosciences 2018, 8, 4. [Google Scholar] [CrossRef]
- Xu, P.; Zhang, M.X.; Lin, Z.B.; Cao, Z.Z.; Chang, X. Additional Stress on a Buried Pipeline under the Influence of Coal Mining Subsidence. Adv. Civ. Eng. 2018. [Google Scholar] [CrossRef]
- Xue, G.Q.; Cheng, J.L.; Zhou, N.N.; Chen, W.Y.; Li, H. Detection and monitoring of water-filled voids using transient electromagnetic method: A case study in Shanxi, China. Environ. Earth Sci. 2013, 70, 2263–2270. [Google Scholar] [CrossRef]
- Kozhevnikov, N.O.; Antonov, E.Y. Magnetic viscosity effect on TEM data of an array with a fixed transmitter loop. Russ. Geol. Geophys. 2018, 59, 690–696. [Google Scholar] [CrossRef]
- Sanmiquel, L.; Bascompta, M.; Vintro, C.; Yubero, T. Subsidence Management System for Underground Mining. Minerals 2018, 8, 243. [Google Scholar] [CrossRef]
- Krawczyk, A.; Grzybek, R. An evaluation of processing InSAR Sentinel-1A/B data for correlation of mining subsidence with mining induced tremors in the Upper Silesian Coal Basin (Poland). In Proceedings of the Seminary on Geomatics, Civil and Environmental Engineering, Gdansk, Poland, 22–25 June 2017; Nykiel, G., Ed.; EDP Sciences: Les Ulis, France, 2018; Volume 26. [Google Scholar]
- Roser, J.; Potocnik, D.; Vulic, M. Analysis of Dynamic Surface Subsidence at the Underground Coal Mining Site in Velenje, Slovenia through Modified Sigmoidal Function. Minerals 2018, 8, 74. [Google Scholar] [CrossRef]
- Wu, G.J.; Yang, G.L.; Tan, H.B. Mapping coalmine goaf using transient electromagnetic method and high density resistivity method in Ordos City, China. Geod. Geodyn. 2016, 7, 340–347. [Google Scholar] [CrossRef]
- Chen, W.Y.; Xue, G.Q.; Olatayo, A.L.; Chen, K.; Khan, M.Y.; Chen, W.C.; Zhang, L.B.; Chen, W. A comparison of loop time-domain electromagnetic and short-offset transient electromagnetic methods for mapping water-enriched zones—A case history in Shaanxi, China. Geophysics 2017, 82, B201–B208. [Google Scholar] [CrossRef]
- Xue, G.Q.; Mohammed, E.A.E.; Guo, W.B. The Response of Large-loop Transient Electromagnetic. Univ. Afr. J. Sci. 2016, 1, 1–17. [Google Scholar]
- Christensen, N.B. Two-Dimensional Imaging of Transient Electromagnetic Soundings. In Proceedings of the Symposium on the Application of Geophysics to Engineering and Environmental Problems, Reno, NV, USA, 23–26 March 1997; Environment and Engineering Geophysical Society: Denver, CO, USA, 2015; pp. 397–406. [Google Scholar]
- Chongo, M.; Christiansen, A.V.; Fiandaca, G.; Nyambe, I.A.; Larsen, F.; Bauer-Gottwein, P. Mapping localised freshwater anomalies in the brackish paleo-lake sediments of the Machile-Zambezi Basin with transient electromagnetic sounding, geoelectrical imaging and induced polarisation. J. Appl. Geophys. 2015, 123, 81–92. [Google Scholar] [CrossRef] [Green Version]
- Xue, G.Q.; Qin, K.Z.; Li, X.; Li, G.M.; Qi, Z.P.; Zhou, N.N. Discovery of a Large-scale Porphyry Molybdenum Deposit in Tibet through a Modified TEM Exploration Method. J. Environ. Eng. Geophys. 2012, 17, 19–25. [Google Scholar] [CrossRef]
- Simard, P.T.; Chesnaux, R.; Rouleau, A.; Daigneault, R.; Cousineau, P.A.; Roy, D.W.; Lambert, M.; Poirier, B.; Poignant-Molina, L. Imaging Quaternary glacial deposits and basement topography using the transient electromagnetic method for modeling aquifer environments. J. Appl. Geophys. 2015, 119, 36–50. [Google Scholar] [CrossRef]
- Abu Rajab, J.S.; El-Naqa, A.R. Mapping groundwater salinization using transient electromagnetic and direct current resistivity methods in Azraq Basin, Jordan. Geophysics 2013, 78, B89–B101. [Google Scholar] [CrossRef]
- Li, H.; Xue, G.-Q.; Zhou, N.-N.; Chen, W.-Y. Appraisal of an Array TEM Method in Detecting a Mined-Out Area Beneath a Conductive Layer. Pure Appl. Geophys. 2015, 172, 2917–2929. [Google Scholar] [CrossRef]
- Xue, G.; Chen, W.; Zhong, H. Mapping coal-beds water-filled zones by using SOTEM. In Proceedings of the International Workshop and Gravity, Electrical & Magnetic Methods and their Applications, Chenghu, China, 19–22 April 2015; pp. 482–485. [Google Scholar]
- Xue, G.Q.; Bai, C.Y.; Yan, S.; Greenhalgh, S.; Li, M.F.; Zhou, N.N. Deep sounding TEM investigation method based on a modified fixed central-loop system. J. Appl. Geophys. 2012, 76, 23–32. [Google Scholar] [CrossRef]
- Nabighian, M.N. Quasi-static transient response of a conducting half-space—An approximate representation. Geophysics 1979, 44, 1700–1705. [Google Scholar] [CrossRef]
- Yu, C.T.; Liu, H.F.; Zhang, X.J.; Yang, D.Y.; Li, Z.H. The analysis on IP signals in TEM response based on SVD. Appl. Geophys. 2013, 10, 79–87. [Google Scholar] [CrossRef]
- Tiwari, A.K.; Maurya, S.P.; Singh, N.P. TEM Response of a Large Loop Source over the Multilayer Earth Models. Int. J. Geophys. 2018, 9891548. [Google Scholar] [CrossRef]
- Nabighian, M.N.; Macnae, J.C. Time Domain Electromagnetic Prospecting Methods. Electromagn. Methods Appl. Geophys. 1991, 427–520. [Google Scholar] [CrossRef]
- Goldman, M.M. The Integral-Finite-Difference Method for Calculating Transient Electromagnetic-Fields in a Horizontally Stratified Medium. Geophys. Prospect. 1983, 31, 664–686. [Google Scholar] [CrossRef]
- Xue, G.Q.; Chen, W.Y.; Ma, Z.J.; Hou, D.Y. Identifying Deep Saturated Coal Bed Zones in China through the Use of Large Loop TEM. J. Environ. Eng. Geophys. 2018, 23, 135–142. [Google Scholar]
- Haroon, A.; Adrian, J.; Bergers, R.; Gurk, M.; Tezkan, B.; Mammadov, A.L.; Novruzov, A.G. Joint inversion of long-offset and central-loop transient electromagnetic data: Application to a mud volcano exploration in Perekishkul, Azerbaijan. Geophys. Prospect. 2015, 63, 478–494. [Google Scholar] [CrossRef]
- Hoheisel, A.; Hordt, A.; Hanstein, T. The influence of induced polarization on long-offset transient electromagnetic data. Geophys. Prospect. 2004, 52, 417–426. [Google Scholar] [CrossRef]
Figure 1.
Schematic diagram of typical three zones in mined-out area.

Figure 2.
Location and survey line layout of the survey area.
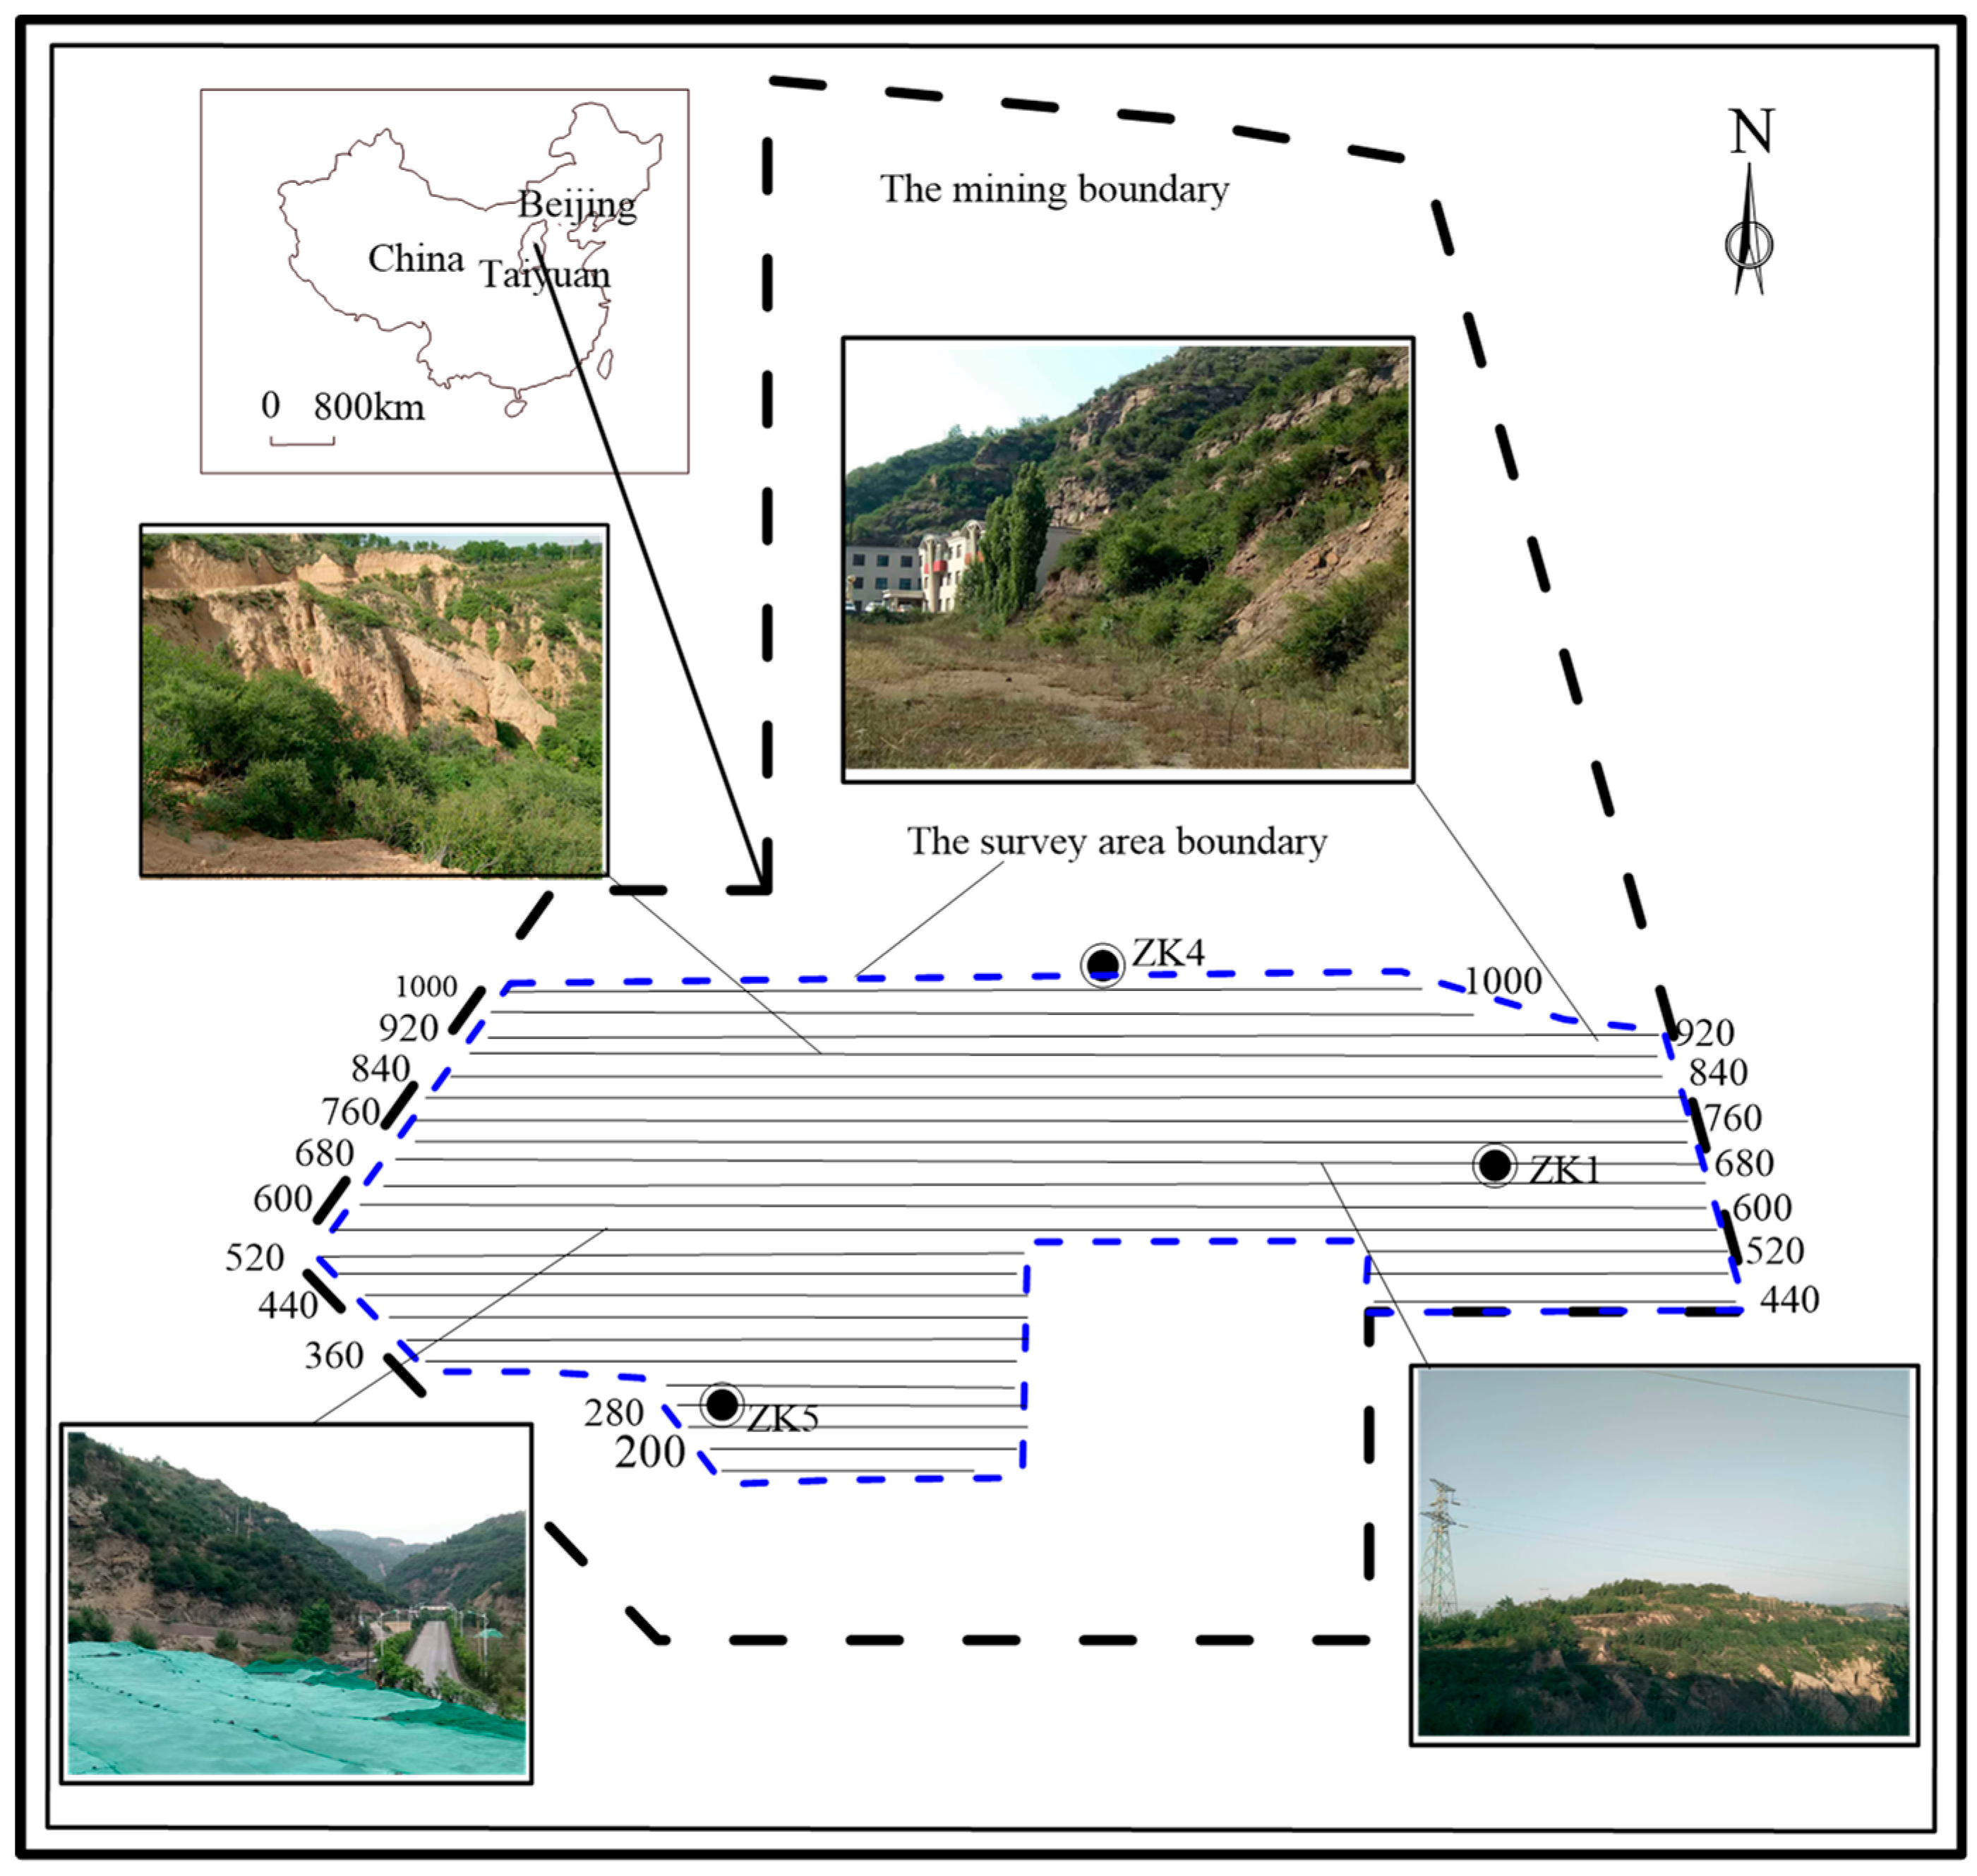
Figure 3.
Topographic map of the survey area.
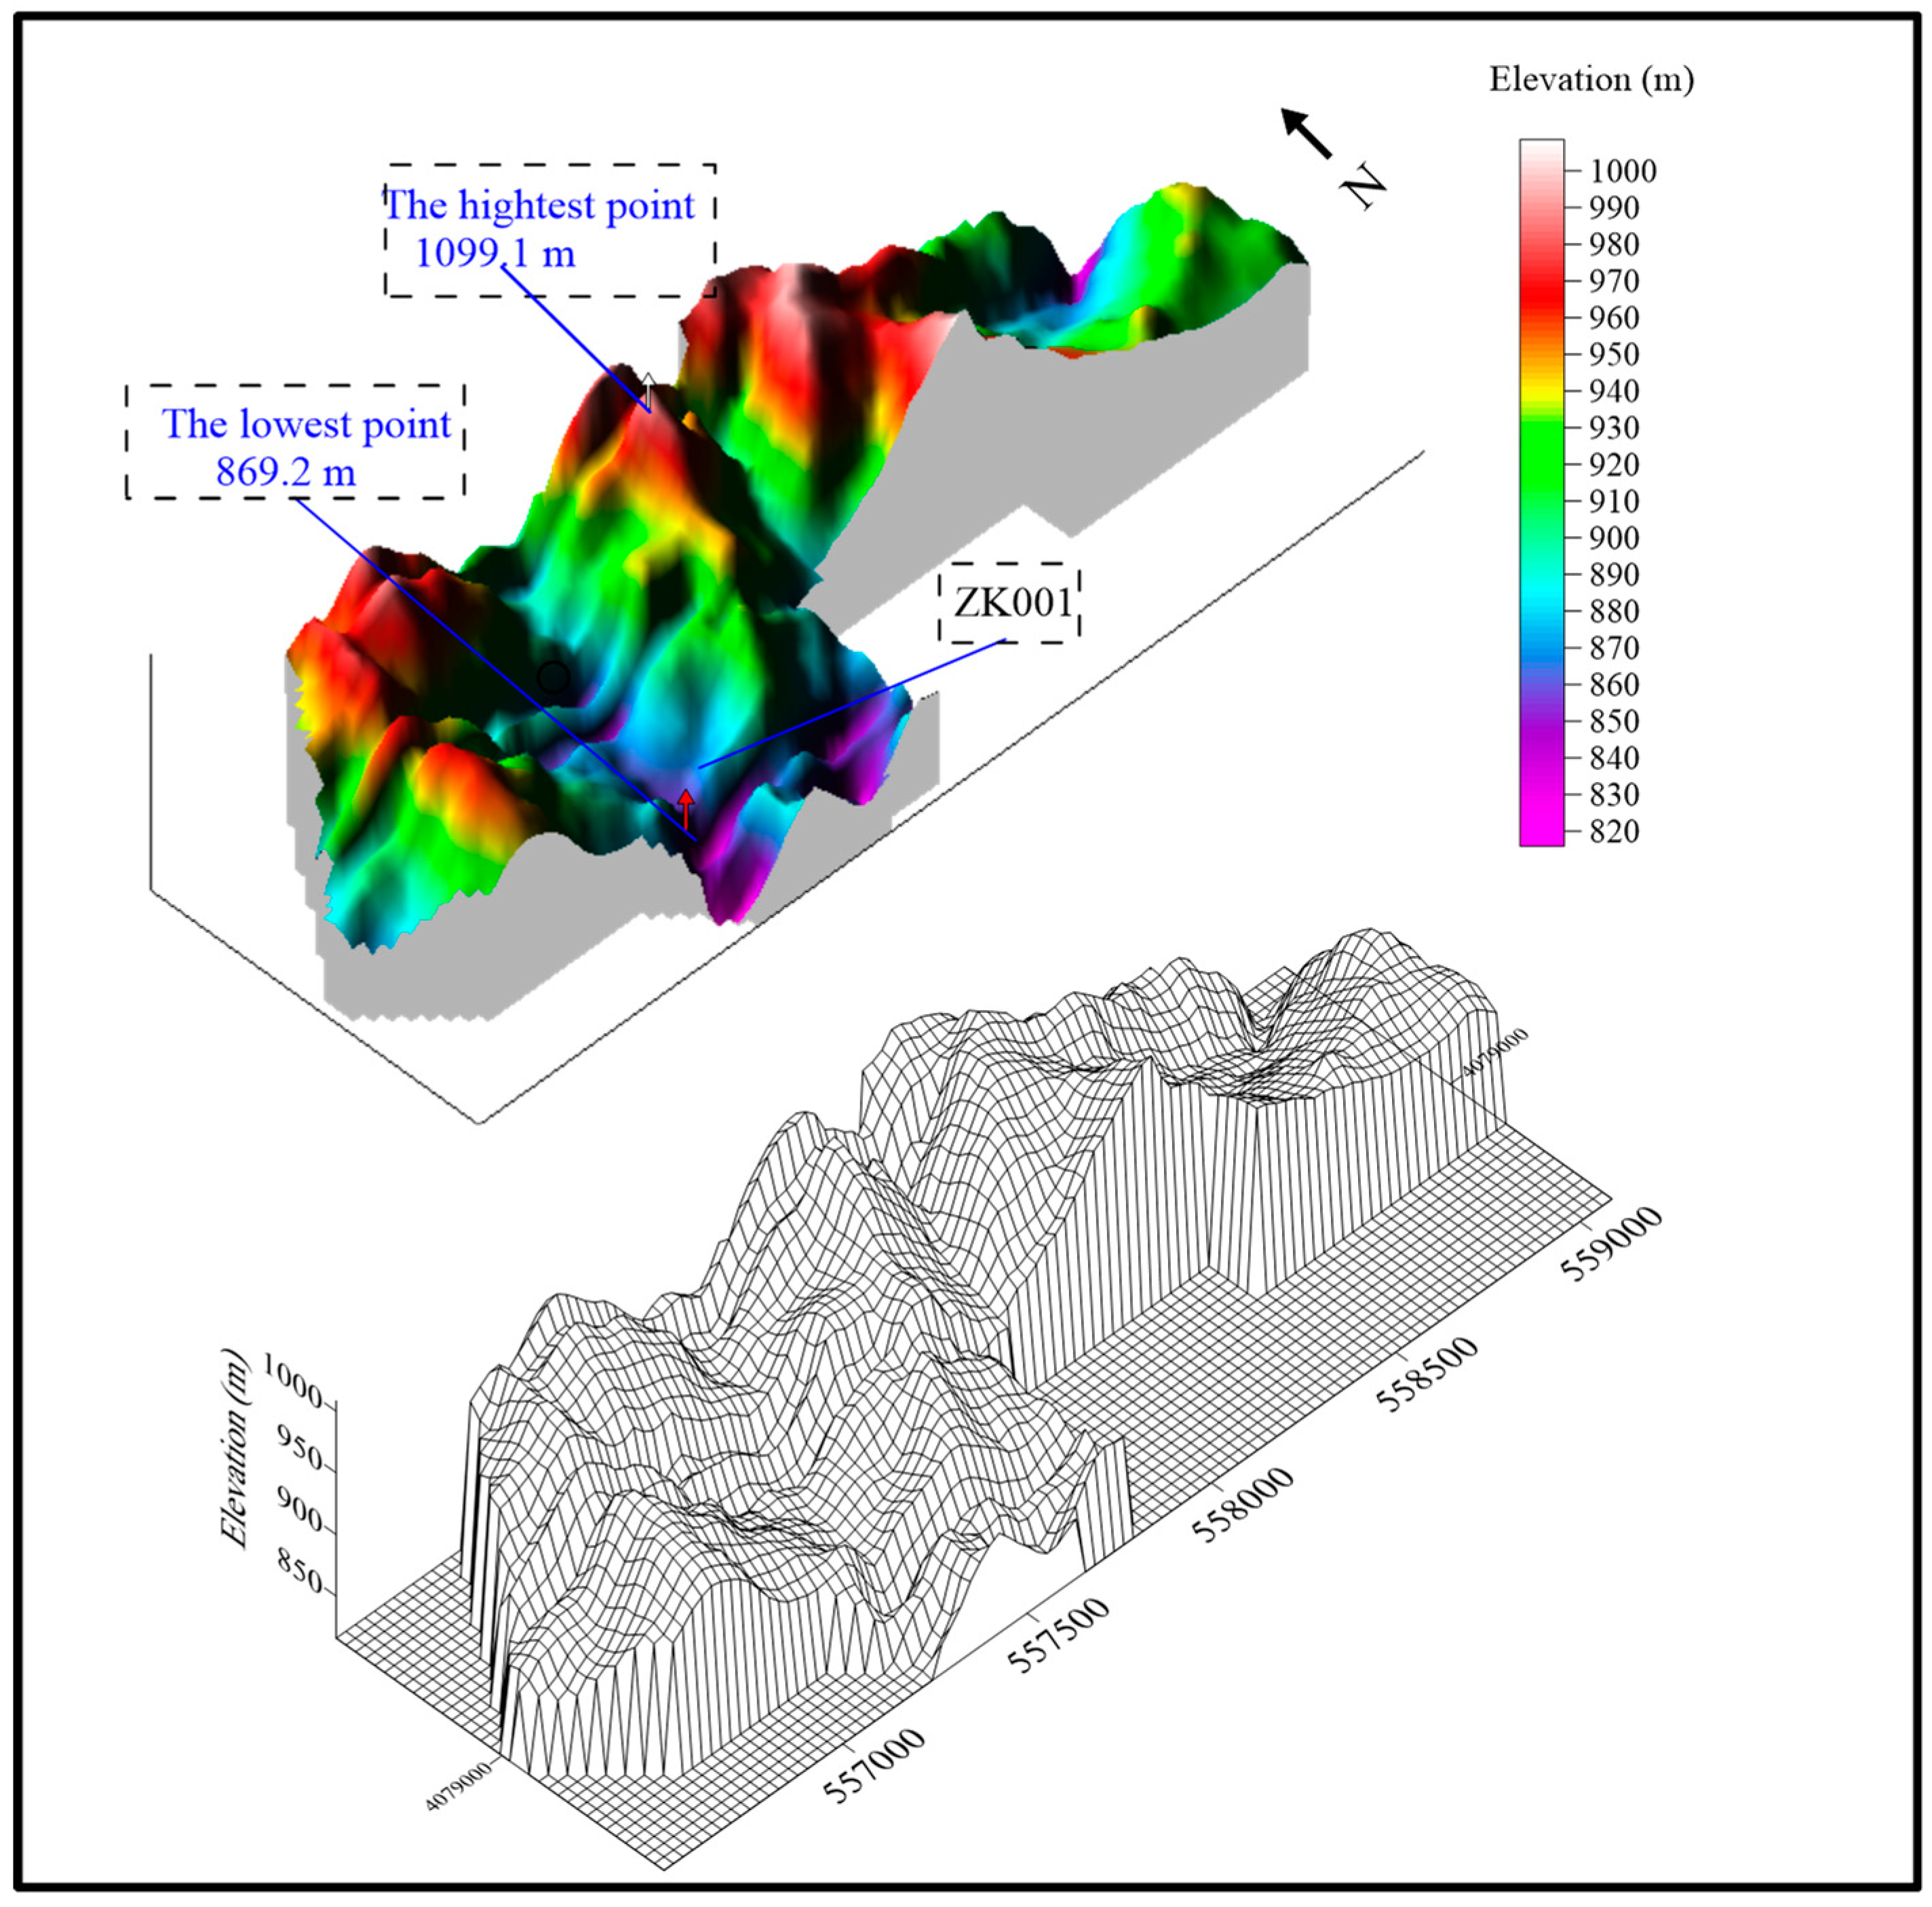
Figure 4.
Diagrammatic explanation of the large-fixed loop Transient Electromagnetic (TEM) response.
Figure 4.
Diagrammatic explanation of the large-fixed loop Transient Electromagnetic (TEM) response.
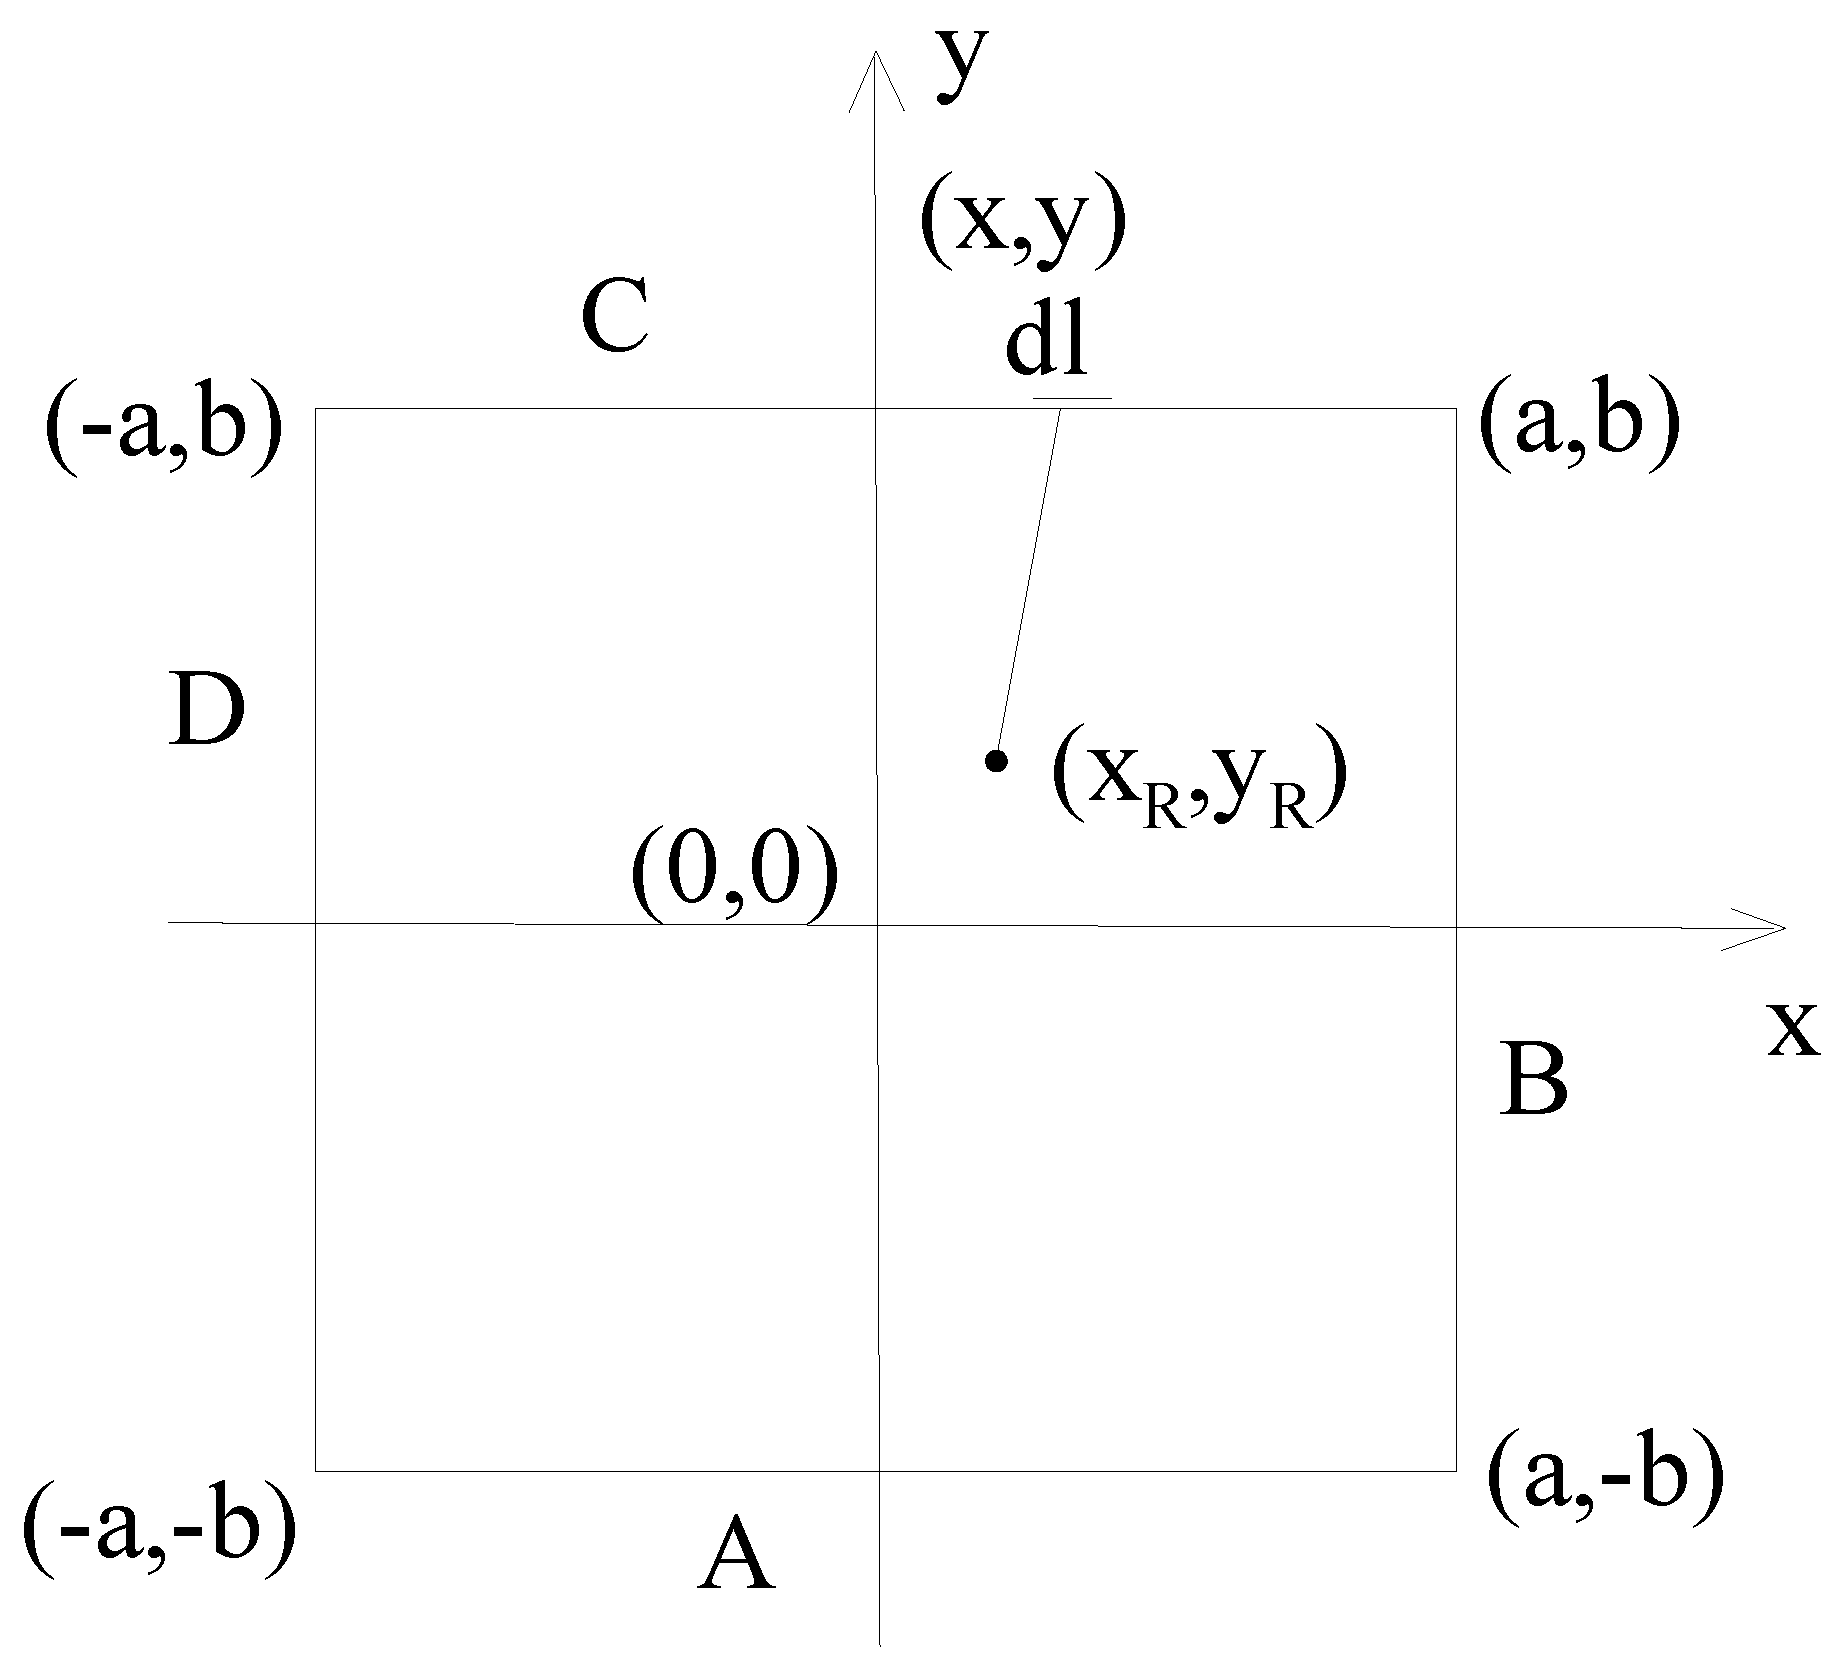
Figure 5.
Large-loop TEM configuration used in the field.

Figure 6.
The decay curves of dB/dt at different frequency.
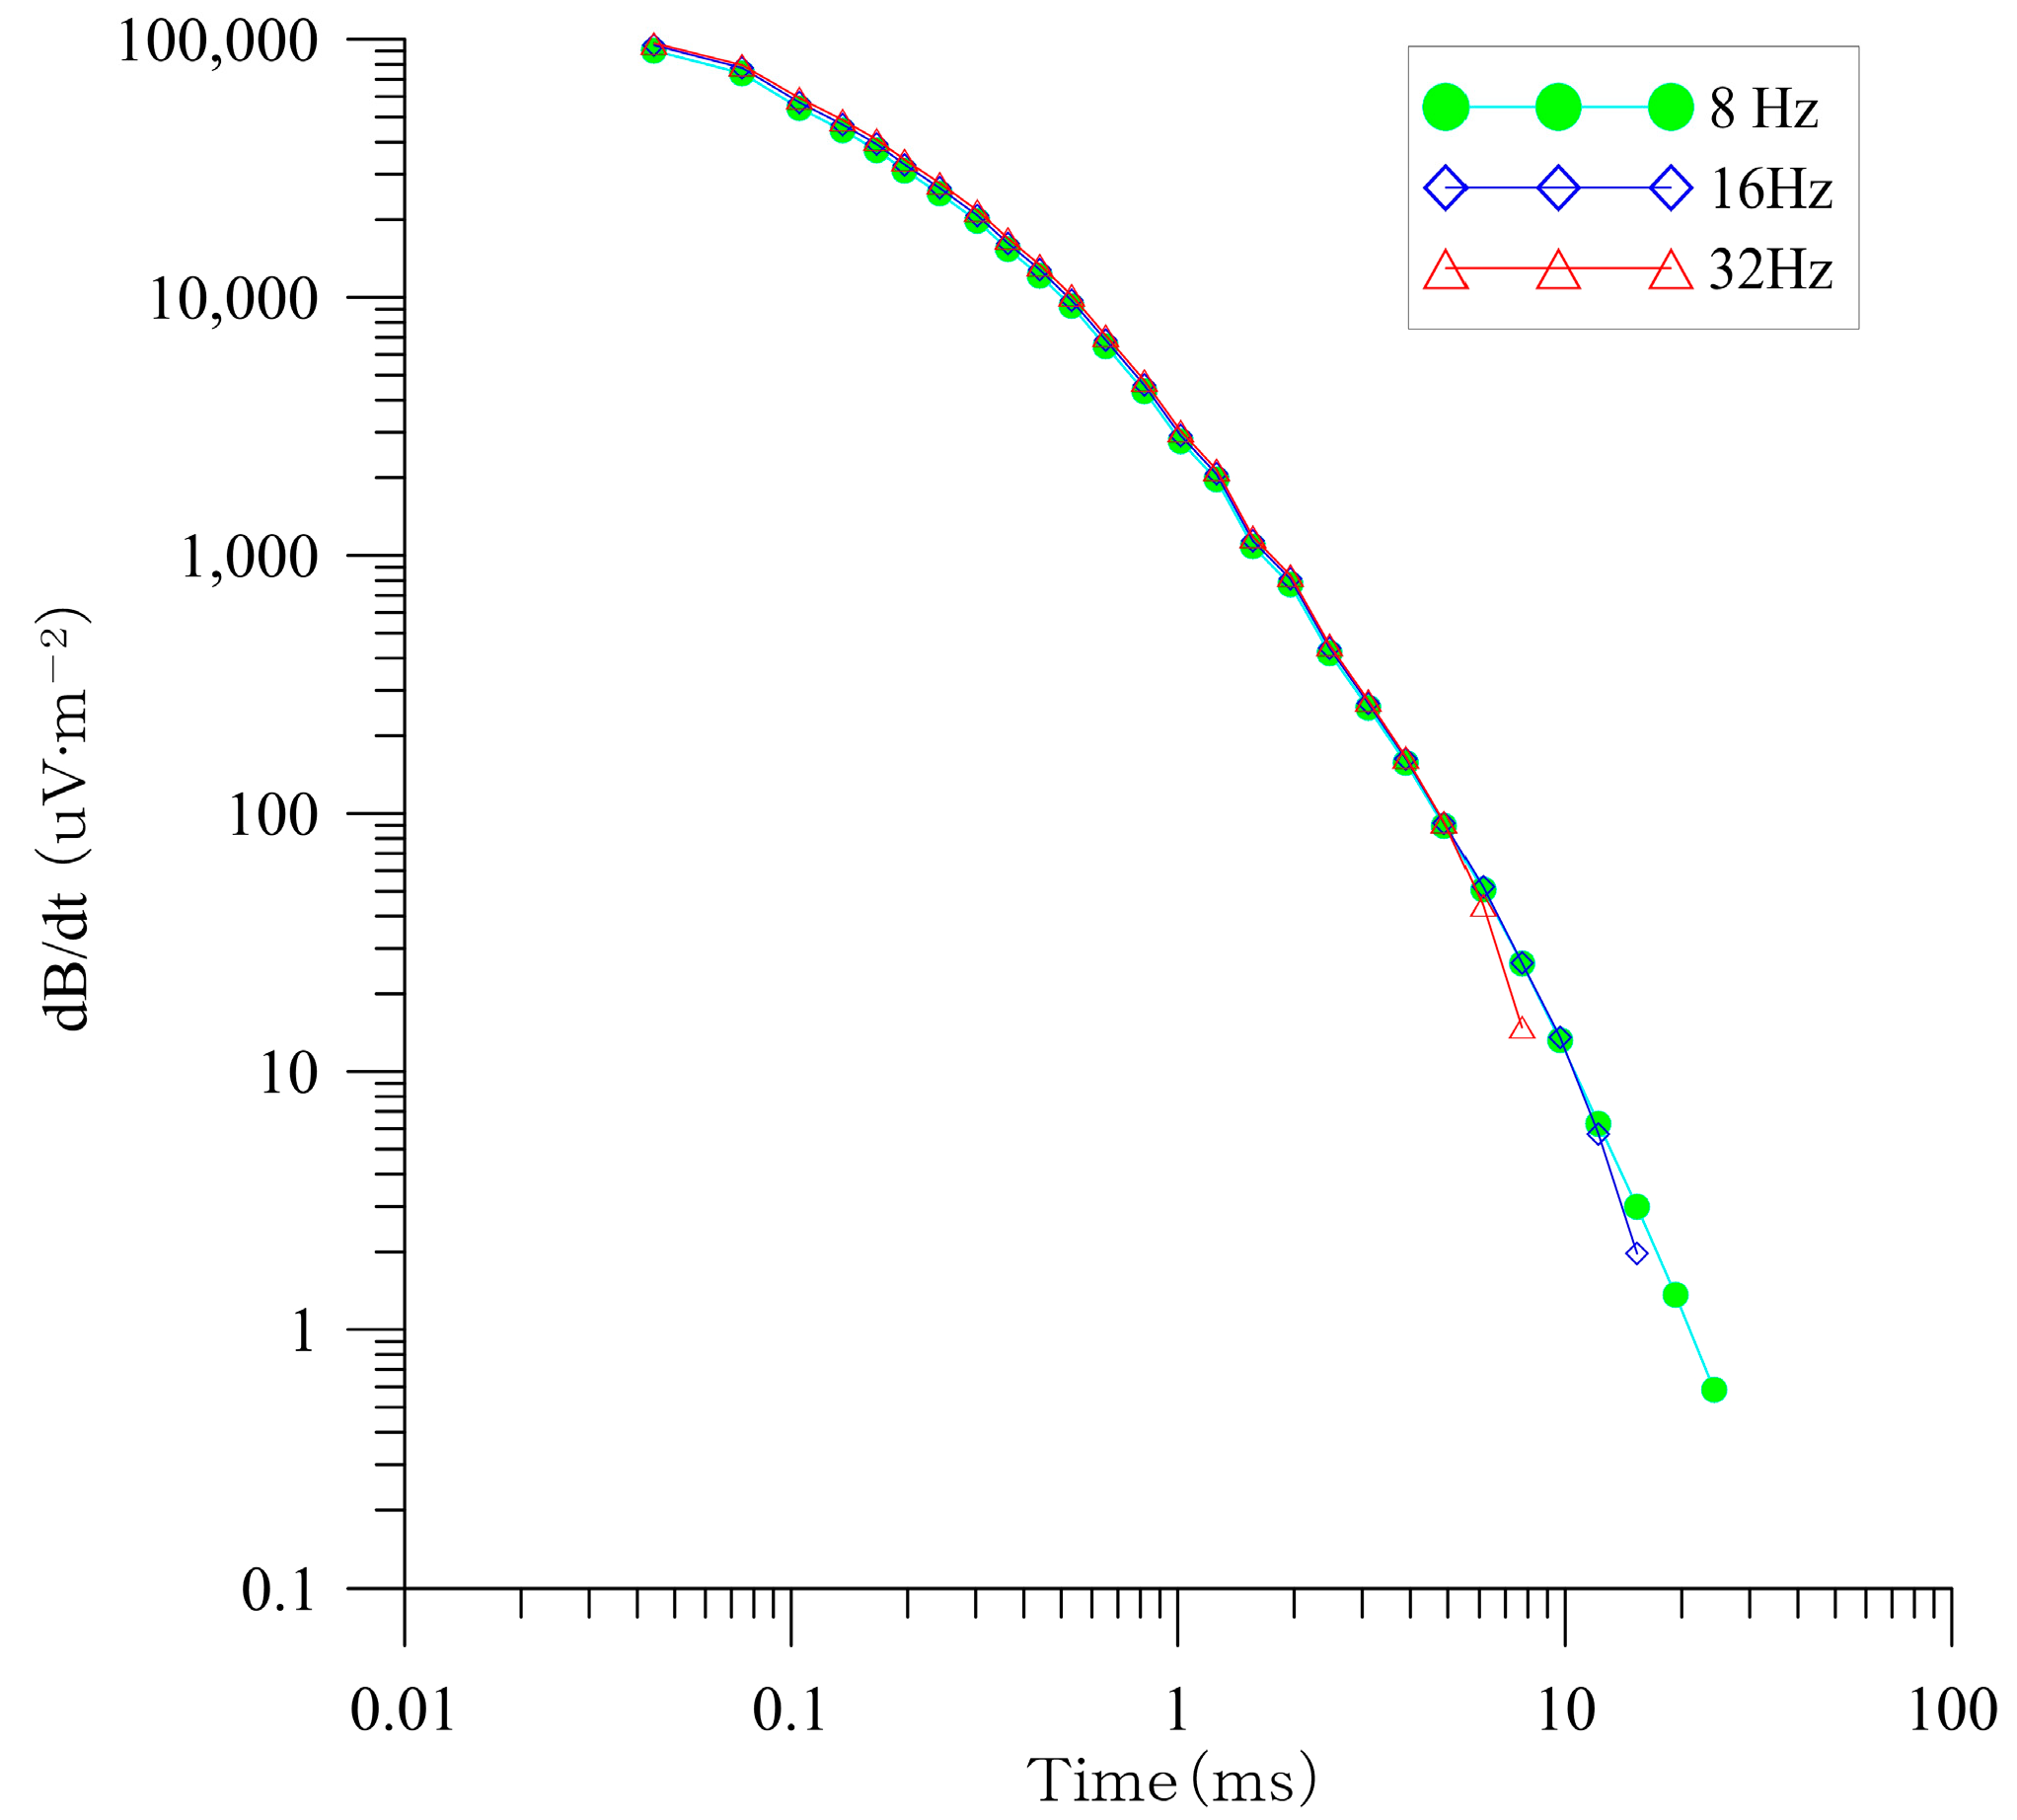
Figure 7.
Inversion results of line 320.
Figure 8.
Inversion results of line 600.
Figure 9.
Inversion results of line 880.

Figure 10.
Inversion results of line 960.
Figure 11.
The horizontal slice of the apparent resistivity values of the No. 9 coal bed. The elevation is about 780 m. The areas with an apparent resistivity less than 40 Ω·m were defined as water enriched areas, and the areas with an apparent resistivity range from 50 to 90 Ω·m were defined as water weak-enriched areas.


Table 1.
Stratum parameters of the survey area.
| Stratum | Lithology | Resistivity/Ω·m | |
|---|---|---|---|
| Quaternary (Q) | Loess, alluvium | 40–80 | |
| Triassic (T) | Ermaying formation (T2er) Heshanggou formation (T2h) Liujiagou formation (T1l) | Mudstone Sandstone | 50–200 |
| Permian (P) | Shiqianfeng formation (P2sh) | Sandstone, sandy mudstone, and coal | 150–300 |
| Upper Shihezi formation (P2s) | |||
| Lower Shihezi formation (P1x) | |||
| Shanxi formation (P1s) | |||
| Carboniferous (C) | Taiyuan formation (C3t) Benxi formation (C2b) | Sandstone, siltstone, mudstone, bauxite limestone, and coal | 220–420 |
| Ordovician (O) | Fengfeng formation(O2f) | Limestone | 700 |
© 2018 by the authors. Licensee MDPI, Basel, Switzerland. This article is an open access article distributed under the terms and conditions of the Creative Commons Attribution (CC BY) license (http://creativecommons.org/licenses/by/4.0/).
Share and Cite
MDPI and ACS Style
Yu, C.; Liu, X.; Liu, J.; Li, E.; Yue, P.; Yan, S. Application of Transient Electromagnetic Method for Investigating the Water-Enriched Mined-Out Area. Appl. Sci. 2018, 8, 1800. https://doi.org/10.3390/app8101800
AMA Style
Yu C, Liu X, Liu J, Li E, Yue P, Yan S. Application of Transient Electromagnetic Method for Investigating the Water-Enriched Mined-Out Area. Applied Sciences. 2018; 8(10):1800. https://doi.org/10.3390/app8101800
Chicago/Turabian StyleYu, Chuantao, Xinyue Liu, Jishan Liu, Enguo Li, Peng Yue, and Shuaibin Yan. 2018. "Application of Transient Electromagnetic Method for Investigating the Water-Enriched Mined-Out Area" Applied Sciences 8, no. 10: 1800. https://doi.org/10.3390/app8101800
Note that from the first issue of 2016, this journal uses article numbers instead of page numbers. See further details here.