Review

Two Topics of Optical Excitation Dynamics, Newly Unveiled by the Time- and Momentum-Resolved Photo-Electron Emission from the Conduction Band of GaAs: A Theoretical Review

by
Hiromasa Ohnishi
1,2,* and
Norikazu Tomita
3
1
National Institute of Technology (NIT), Tsuruoka College, 104 Sawada, Inooka, Tsuruoka, Yamagata 997-8511, Japan
2
Faculty of Business, ICT and Chemical Engineering, Turku University of Applied Sciences, Joukahaisenkatu 3 C, 20520 Turku, Finland
3
Department of Physics, Yamagata University, 1-4-12 Kojirakawa, Yamagata 990-8560, Japan
*
Author to whom correspondence should be addressed.
Appl. Sci. 2018, 8(10), 1788; https://doi.org/10.3390/app8101788
Submission received: 4 September 2018 / Revised: 26 September 2018 / Accepted: 27 September 2018 / Published: 1 October 2018
(This article belongs to the Special Issue Photoinduced Cooperative Phenomena)

Abstract

:
We review the recent two topics of optical excitation and relaxation dynamics, newly unveiled by the time- and momentum-resolved photo-electron emission from the conduction band of GaAs. One is the real-time collective relaxation dynamics, resulting in the Fermi degeneracy formation in the Γ valley. We show that it takes almost infinite time to realize the exact Fermi degeneracy, due to a restricted selection rule for the intravalley transition of the photo-excited electrons. The other is the spontaneous and instantaneous intervalley transition from the Γ valley to the L one. By considering the electron-phonon coupling before the photo-excitation, such spontaneous intervalley transition is realized within the framework of the Franck–Condon principle of the photo-excitation.

1. Introduction

The dynamics of photo-excited states is one of the most fascinating topics in materials science. One reason is that the control of functionalities by light, such as a photoinduced phase transition, directly connects with the development of optical devices [1,2,3]. The recent remarkable progress of time- and energy-resolution in pump-probe spectroscopy helps the precise understanding of transient states after the photo-excitation [4,5]. Information on the precise time-evolution of the photo-excited states with fine energy and momentum resolutions is of course important for their application. In addition, such precise information is now giving another stage for investigation of more fundamental problems.
For example, it is well known that fermions in solids occupy the band states to make the total energy the lowest. As a result, the states below the Fermi energy are completely occupied, but those above the Fermi energy are unoccupied at the zero temperature. This is a well-established phenomenon called Fermi degeneracy. However, it is not clear how the fermions go to Fermi degeneracy and how long it takes.
The Franck–Condon principle is another example. In this principle, an electron is adiabatically excited by light without any momentum exchange to phonons. However, this does not mean that phonons never contribute to the photo-excitation. What happens if the photo-excited states are initially coupled with phonons before excitation? This must be a question to be treated within the Franck–Condon principle.
Experimentally, two-photon photoemission spectroscopy (2PPES) can answer these fundamental questions. A macroscopic number of electrons are excited to the initially empty conduction band by the first light. Then, the second light works for photoemission spectroscopy on these photo-excited electrons relaxing in the conduction band. By changing the time-duration between the first and second lights, we can obtain information on how electrons form Fermi degeneracy in the conduction band. Similarly, the intervalley transition of the photo-excited electrons can be observed by 2PPES. We suggest that this intervalley transition can be caused by the electron-phonon coupling in the initial electronic states before photo-excitation within the framework of the Franck–Condon principle.
Thus, one of the most significant highlights in the recent progress of the optical measurement techniques is the realization of time- and momentum-resolved 2PPES. As mentioned above, 2PPES can give qualitatively different data of the photo-excited carriers from the ordinary optical measurements such as reflectance and transmittance. In fact, the recent 2PPES experiments have revealed the novel dynamics of photo-excited electrons, such as Fermi degeneracy formation and the intervalley transition within the Franck–Condon principle [6,7,8,9,10].
In this paper, following the state-of-the-art 2PPES measurements, we review the recent progress on the theoretical study of the real-time dynamics of the photo-excited electrons in the conduction band of semiconductors. Especially, we focus on two major channels of the carrier dynamics, namely intravalley and intervalley transitions. The former is closely related to the Fermi degeneracy formation [11], while the latter is related to the Franck–Condon principle in the photo-excitation [12]. Although we are mainly concerned with GaAs, the basic results and concepts would be widely applicable to a variety of other materials.
We have succeeded in describing the 2PPES experiments and giving reasonable physical pictures to them. In both cases, the electron-phonon coupling plays a very important role. In the intravalley transition, for example, photo-excited electrons can change their energies and momenta by the electron-phonon scattering, and they can occupy the lower parts of the conduction band very quickly. However, after most of electrons occupy the conduction band, the energies and momenta that should be necessary for the rest of electrons to relax inside the conduction band are strongly restricted. In other words, the number of phonons that meet the electronic transition in the conduction band decreases drastically. As a result, the relaxation becomes very slow. Both the experimental data and our present calculation show that it takes almost infinite time to realize complete Fermi degeneracy. Furthermore, we will show that the electron-phonon coupling in the initial ground state makes the instantaneous intervalley transition of photo-excited electrons possible.

2. Two-Photon Photo-Electron Emission Spectroscopy

In 2PPES [13,14], the electron is excited by the first pulsed light, and the transient dynamics of the photo-excited electrons is probed by the second pulsed light, with adjusting the time duration between the first and second pulsed lights. When the energy of the light is in the visible region, the wavelength of the light is the order of several hundreds of nanometers. On the other hand, the lattice constant of crystal is typically several Å. As a result, the momentum of the visible light is negligibly small compared with that of the crystal. Therefore, we can safely assume that the vertical electronic excitation occurs in the energy-momentum space. This is well known as the Franck–Condon principle of photo-excitation.
A schematic explanation of this two-photon process is given in Figure 1. The electrons excited by the first pulsed light with energy h ν are now distributed in the conduction band with energy E. On the other hand, these electrons are shone by the second pulsed light with energy h ν , and they are excited up to the high energy continuum state within the crystal. This high energy continuum is the literal “high energy continuum”, in the sense that the electron with any crystal momentum can find the corresponding state at “any high energy”, and can go out of the crystal, whereafter it is sorted according to the initial crystal momentum and the energy. Then, the kinetic energy and momentum of the photo-emitted electron are given by E kin = h ν ( E vac E ) and k | | = k , respectively, where E vac is the energy of the vacuum level and k is the crystal momentum.
A specific feature of 2PPES is that, by the combination of the angle- and time-resolved photo-emission technique, 2PPES can directly evaluate the energy distribution function (EDF) of photo-excited electrons in the conduction band. As a result, we can know the transient dynamics of the photo-excited electrons in terms of the explicit energy-momentum conservation. Thus, 2PPES can give qualitatively different data compared with the ordinary optical measurement, such as reflectance and transmittance.
In the ordinary optical measurement, an observed spectral shape reflects all the possible elementary excitations in the solid, unselectively. To clarify microscopically what happens in the solid from the spectral shape, we have to use some models for the analysis. In this sense, the ordinary optical measurement has an ambiguity in the interpretation of the result. On the other hand, there is no such ambiguity in 2PPES. By using 2PPES, Tanimura et al. have investigated the transient dynamics of the photo-excited electrons in the conduction band of typical semiconductors, such as Si, GaAs and InP [6,7,8,9,10], and remarkable features of the photo-excited electrons have been revealed.

3. Possible Relaxation Channels in the Early Stage

As mentioned before, we are mainly concerned with GaAs. The band structure of GaAs is schematically shown in Figure 2. The conduction bands have a multi-valley structure [15]. The lowest valley is the Γ valley, and the second lowest is L. When a visible light is shone onto GaAs, according to the Franck–Condon principle of the photo-excitation, the electrons are injected only into the Γ valley of the conduction band, at first. After a while, the photo-injected electrons are relaxed toward the energetically lower states. The dominant relaxation trivially occurs within the lowest Γ valley. However, when the photo-injected electrons are distributed in energetically higher region than the minimum of the other valley, such as the L valley in Figure 2, the intervalley scattering from the Γ valley to the other one becomes possible. Then, the major scattering channels of photo-excited electrons in the early stage of the relaxation are the intravalley one and the intervalley one.

4. Intravalley Relaxation and Fermi Degeneracy Formation

It is well known that the fermions in solids occupy the band states to make the total energy the lowest. As a result, the states below the Fermi energy are completely occupied, but those above the Fermi energy are unoccupied at zero temperature. This is a well-established phenomenon called Fermi degeneracy. Most theories in solid state physics assume the presence of the Fermi degeneracy trivially as their starting point [16]. However, it is not clear how the fermions go to the Fermi degeneracy and how long it takes, since the real system never starts from the ground state. Thus, it is meaningful to examine what happens if a macroscopic number of electrons are photo-injected into the conduction band at once.
In metal [17,18,19,20], it has been reported that the photo-excited system shows an extremely rapid relaxation, since the ratio of the photo-excited electrons is low, meaning the unexcited electrons work as a heat reservoir for the photo-excited ones.
Being different from the above metallic cases, what happens in the gapped system such as a semiconductor? The intravalley relaxation in a direct gap semiconductor is a good target for this problem. In this case, the electrons relax toward the conduction band minimum (CBM) or Γ valley bottom, and finally, the Fermi degeneracy would be formed at the CBM.
While this intravalley relaxation has been studied intensively so far [21,22,23,24,25,26], its microscopic mechanism is still under considerable debate. The 2PPES measurement for this process has been performed by Kanasaki [7], by observing the time evolution of the energy distribution function (EDF). The crucial aspects of this experiment are as follows: The whole distribution of photo-excited carriers shows an extremely rapid collective relaxation in the initial first picosecond (ps) from the photo-excitation. In this early stage, the electrons take a non-equilibrium distribution, which is far from the Fermi–Dirac one. After 1 ps from the photo-excitation, the relaxation speed keeps slowing down with a slight change of the EDF. This slow relaxation is inversely proportional to time.

4.1. Possible Scenario

In this section, we discuss a possible scenario for the aforementioned intravalley relaxation process. When we focus on an initial few ps after the photo-excitation, the electron-electron (e-e) and electron-phonon (e-ph) scatterings would be the possible processes. As suggested by the experiment [7], however, the electron distribution soon after the photo-excitation is far from the Fermi–Dirac one. This means that the e-e scattering is not dominant in the early stage of relaxation. This fact would be validated due to the following reasons: One is the low carrier density in the experiment, which is estimated to be ∼0.003 electrons per unit cell. The other is the fine parabolicity of Γ valley band dispersion in GaAs. The e-e scattering process, which satisfies both energy and momentum conservation, is a rare event with the parabolic band dispersion. Thus, the relaxation process would be dominated by e-ph scattering. On the other hand, when the system reaches near the Fermi degeneracy, the electron distribution goes to the Fermi–Dirac one. In this case, the e-e scattering should be considered. This effect is discussed in Section 4.5. Thus, the photo-excited electrons will relax toward the CBM by emitting their energy to the phonon system.

4.2. Model and Method

The aforementioned scenario has been examined theoretically by Ohnishi et al. [11]. They have considered the model, in which many electrons are coupled with acoustic (ac) and optical (op) phonons, and the time evolution of carriers in the Γ valley has been investigated by using the second order perturbation theory [11]. In this section, we review their model and method.
They start from the Hamiltonian ( H ), which is given as follows:
H = H 0 + H I , H I = H ep ( ac ) + H ep ( op )
H 0 = H e + H p ( ac ) + H p ( op ) k , σ ε k a k , σ a k , σ + q ω q b q b q + ω o p q f q f q ,
H ep ( ac ) = S 2 N q , k , σ b q + b q a k q , σ a k , σ
H ep ( op ) = 1 N q , k , σ i V q f q a k q , σ a k , σ f q a k , σ a k q , σ .
Here, a k , σ ( a k , σ ) is an electron creation (annihilation) operator, having a wavevector k and spin σ . The conduction band dispersion is assumed to be parabolic: ε k = B · ( k · k / π 2 ) where B represents a bandwidth. b q ( b q ) and f q ( f q ) are phonon creation (annihilation) operators of acoustic (ac) and op (optical) phonons, respectively, having a wavevector q . The acoustic phonon band dispersion is given by ω q = ω M · ( q / π ) . S and V are electron-ac and -op phonon coupling constants, respectively.
The time evolution of electron population, n k , σ ( t ) , is evaluated in terms of the second order perturbation theory. For this purpose, we expand:
n k , σ ( t ) Tr ( n k , σ ρ ˜ ( t ) ) Tr ( ρ ˜ ( t ) ) ,
by H I . The density matrix of the system is given by:
ρ ˜ ( t + Δ t ) = exp + i 0 Δ t d τ H ˜ I ( τ ) ρ e ( t ) ρ p exp i 0 Δ t d τ H ˜ I ( τ ) ,
where H ˜ I ( τ ) e i τ H 0 H I e i τ H 0 and subscript ± in the exponent means chronological order. ρ e ( t ) is the density matrix for the electron. ρ p exp ( H p / k B T p ) is the density matrix for the phonon with the phonon temperature T p . In the present scenario, the phonon system works as a heat reservoir for the electrons. Thus, T p is fixed to be 0 K.
From Equations (5) and (6), with the use of the Fermi’s golden rule, we get the rate equation for electron population, which is given by:
n k , σ t = ( 1 n k , σ ( t ) ) Γ ep , k + ( ac ) ( t ) + Γ ep , k + ( op ) ( t ) n k , σ ( t ) Γ ep , k ( ac ) ( t ) + Γ ep , k ( op ) ( t ) ,
where:
Γ ep , k + ( i ) = q C i n k + q , σ δ ( ε k + ω q ε k + q ) ,
Γ ep , k ( i ) = q C i ( 1 n k + q , σ ) δ ( ε k + q + ω q ε k ) ,
with C i = π S 2 N 1 or 2 π V 2 N 1 / q 2 for i = ac or op, respectively.
In [11], the parameters were set to B = 5 eV, ω M = 24 meV, ω op = 38 meV, S = 0 . 5 eV and V = 0 . 13 eV, for GaAs and also InP.

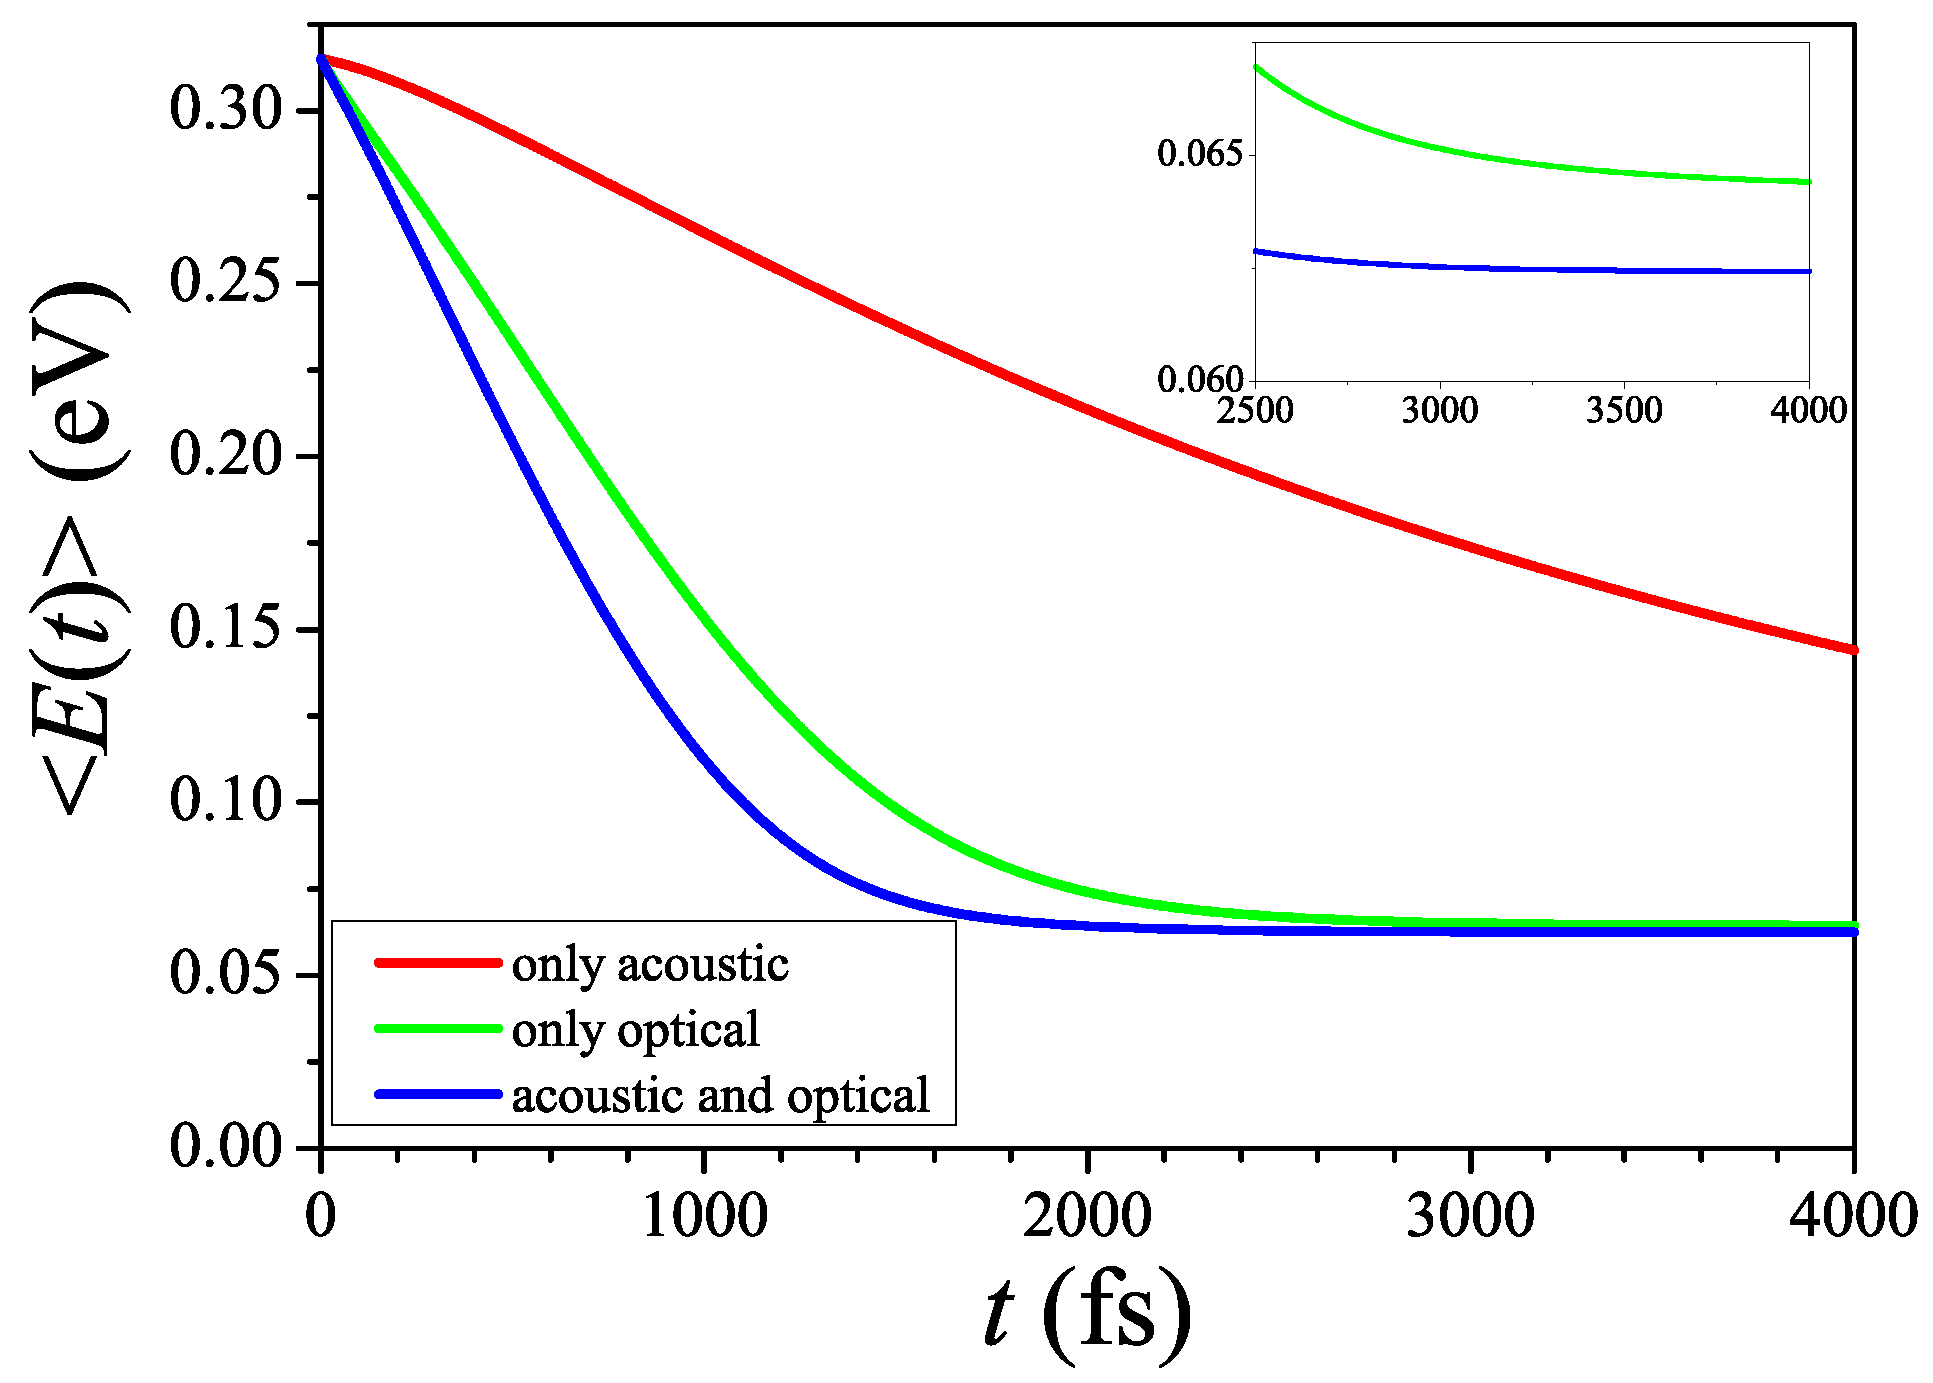
4.3. Role of Optical and Acoustic Phonons in the Relaxation

The time evolution of the density of states (DOS) with the electron density n M = 0 . 003 electrons per site is given in Figure 3. The time evolution of the mean energy is also given in Figure 4, where the mean energy is defined as E E tot / n tot , where n tot is the total photo-excited electron number. In the early stage to around 1200 fs, the system shows an extremely rapid relaxation, since the electrons can occupy the lower parts of the conduction band very quickly. As seen in Figure 4, this rapid relaxation is caused mainly by the electron-optical phonon scattering.
At around 1200 fs, most of the electrons occupy around the CBM. In this stage, the energies and momenta that should be necessary for the rest of electrons to relax inside the conduction band are strongly restricted. In other words, the number of phonons that meet the electronic transition in the conduction band decreases drastically. As a result, the relaxation becomes very slow. As seen in the inset of Figure 4, the system cannot reach the completely Fermi degenerated state (CFDS) only by the electron-optical phonon scattering. Thus, this slow relaxation is mainly caused by electron-acoustic phonon scattering.
Although it is not clear in Figure 4, the system very slowly relaxes down toward the CFDS at a later time, as seen in Figure 5. Thus, the relaxation speed continues slowing down, and thus, it takes an infinite time to reach the CFDS.
The time evolution of the electron occupation can be seen in Figure 6. In the slow relaxation process, the electron occupation is close to the Fermi–Dirac distribution, implying the e-e interaction is effectively working. Thus, the electron temperature is well defined in this stage.

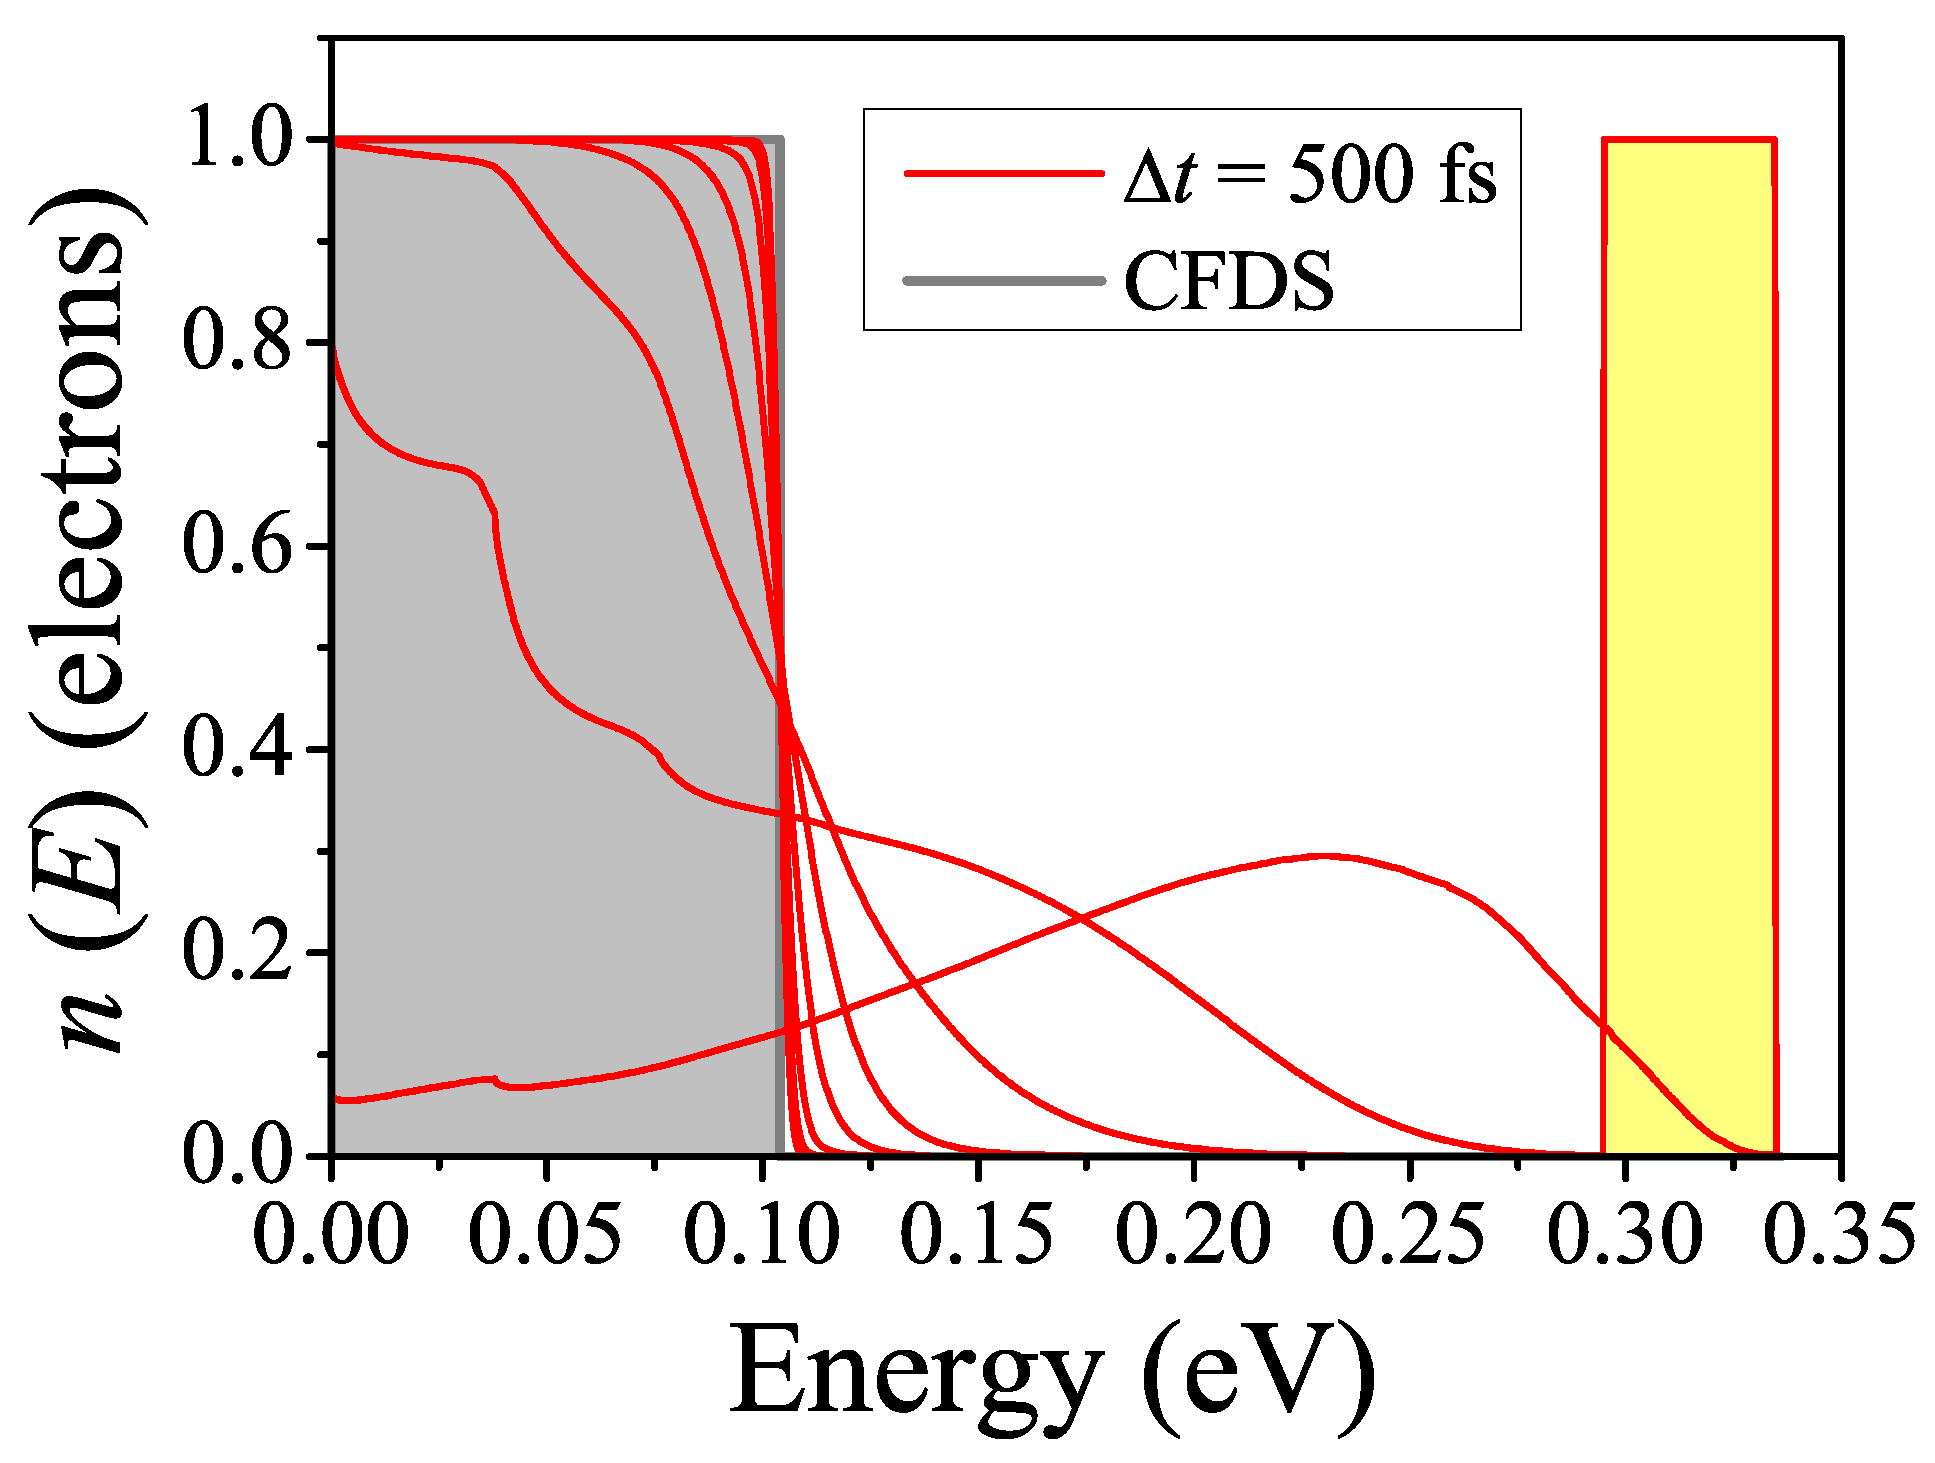
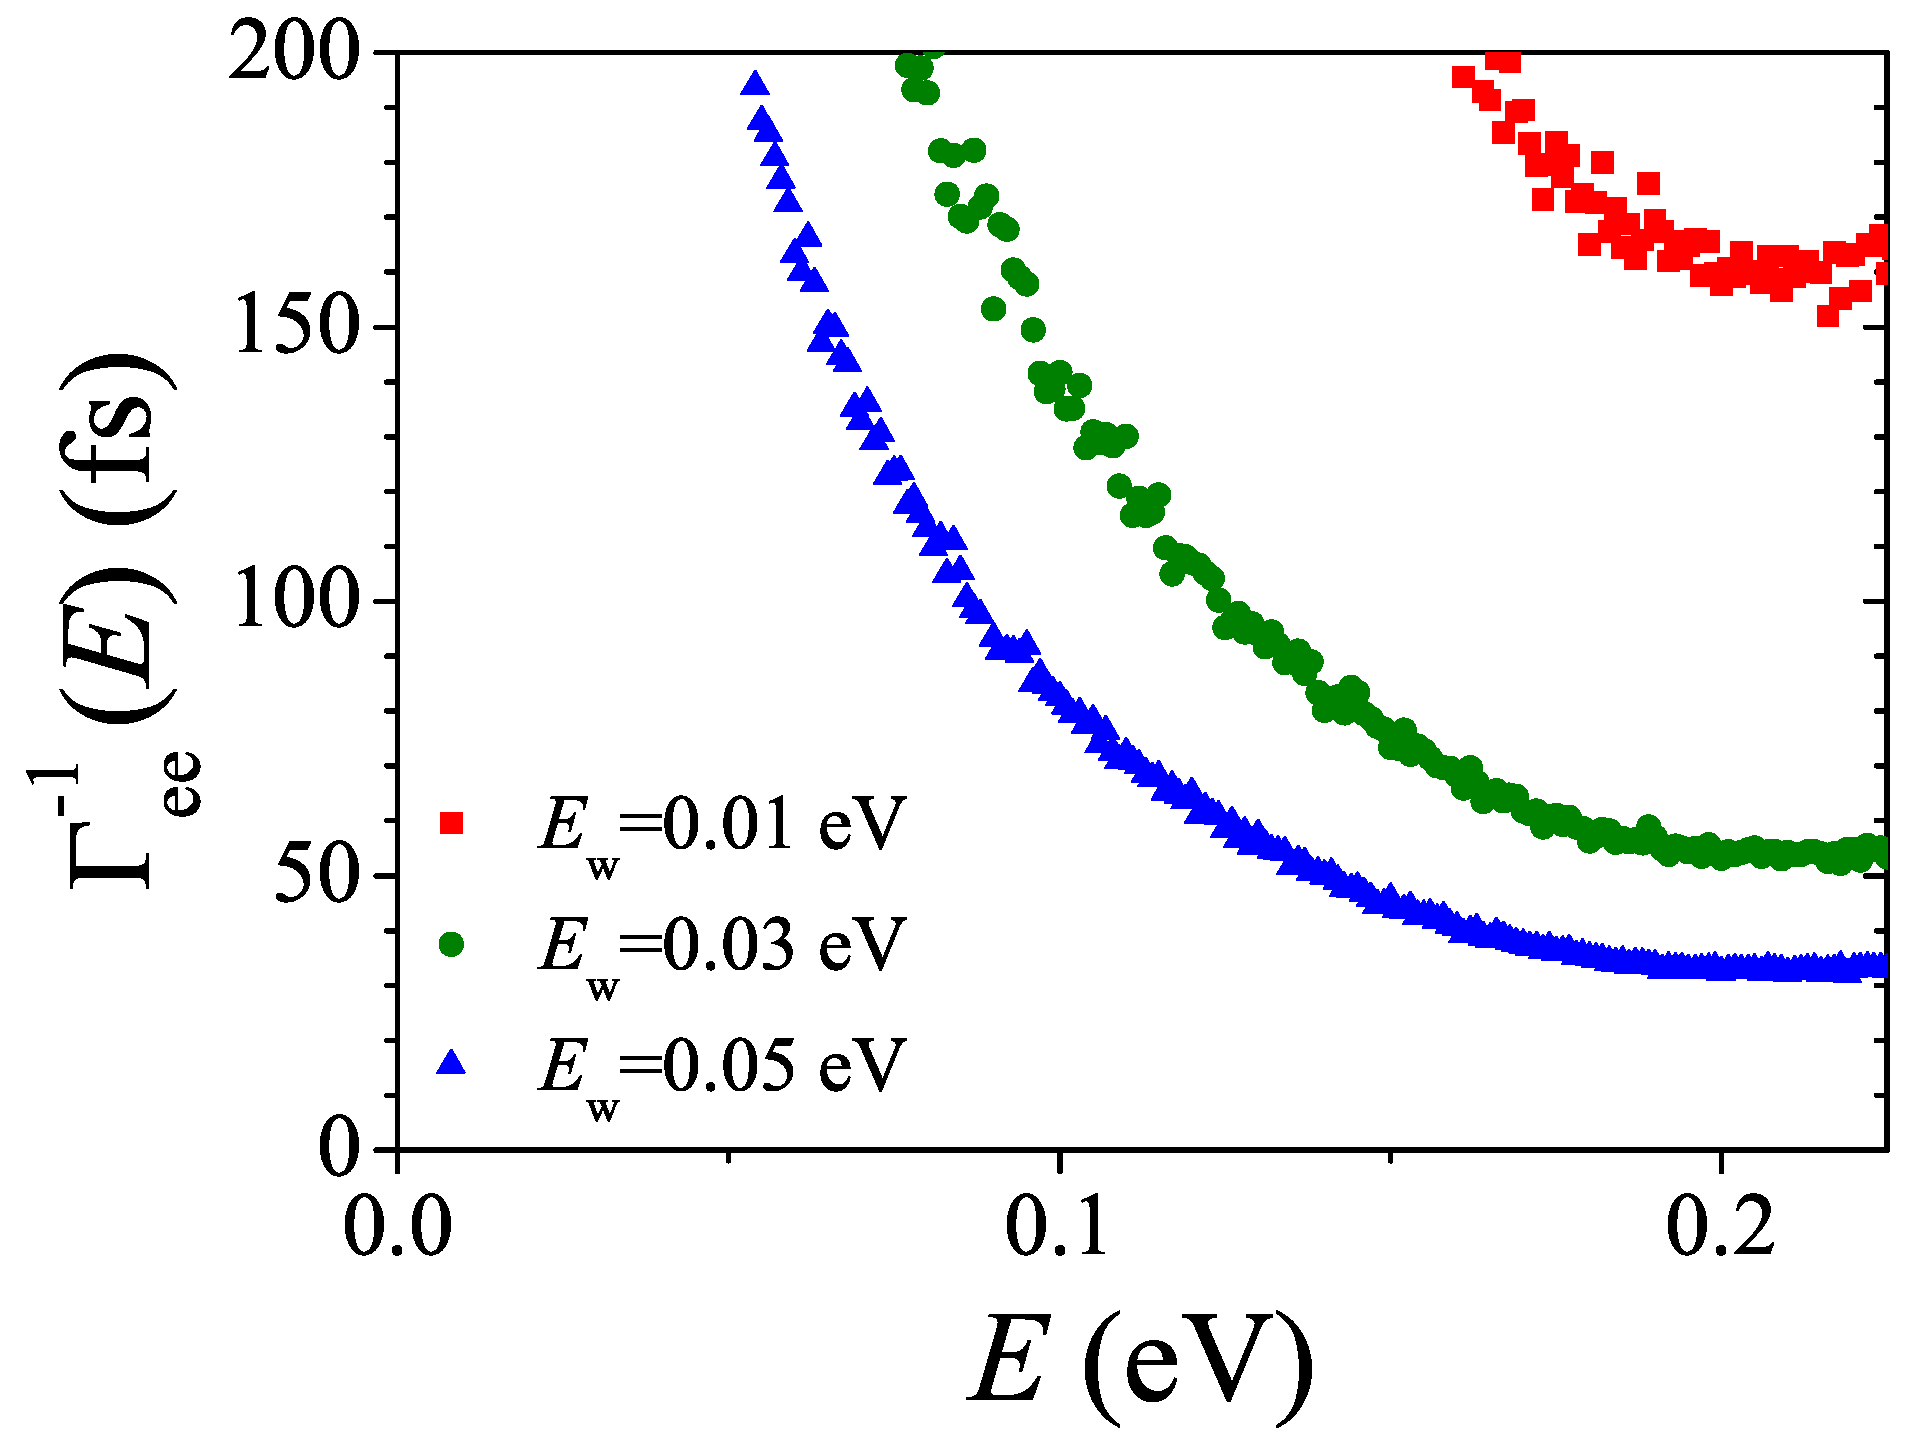
4.4. Fermi Blocking Effect

The n M -dependence of the relaxation is investigated in this section. As seen in Figure 7, the result does not depend on n M strongly around n M = 0 . 003 ; both rapid relaxation in the initial stage and very slow one at a later time can be seen. However, we can find a difference in the energy loss rate, which is defined as d E / d t , in the initial relaxation process. The present result has shown that the increase of n M results in the decrease of the energy loss rate, meaning the slowing down of the initial relaxation speed. This fact is understood by considering the Fermi blocking effect. An electron is able to relax down to a lower energy state only when the lower energy state has holes, due to Fermi’s exclusion principle. Thus, the electrons placed in the high energy state cannot move until the hole is created on the low energy side. In the large n M case, it takes much more time for this trivially due to many carriers. In other words, when the number of carriers is increased without the change of the number of states, the total relaxation flow becomes slow, like a traffic jam.

4.5. Effective Electron Temperature Approximation

As mentioned in Section 4.3, in the final stage of the relaxation, the electron temperature T e is well defined. In this case, we can include an effect of the elastic e-e scattering in terms of the electron temperature approximation (ETA). By using the second order perturbation theory, the time dependence of T e is given by:
T e t = Γ ( T e ) C ( T e ) .
where:
Γ ( T e ) = π S 2 N q , k , σ ω q ( 1 n k q , σ ) n k , σ δ ( ω q + ε k q ε k ) .
In the derivation of Equation (10), the energy conservation between the electronic system and phonon one has been considered [11]. It is well-known that the electronic heat capacity C ( T e ) T e at low temperature [27]. Electron-hole pair numbers around the Fermi energy and the acoustic phonon energy are also proportional to T e , while the phonon mode density is proportional to T e 2 . Thus, the Γ ( T e ) T e 4 , and hence, we obtain T e t 1 / 2 . This leads to the shift of the mean energy of electronic system as:
Δ E ( t ) = C ( T e ) | Δ T e | t 1 .
Then, by taking the elastic e-e scattering into account in ETA, the relaxation speed in the final stage further slows down more than that only by the e-ph scattering, and this result is consistent with the experiment [7].

4.6. Discussion

The present results have revealed that it takes an infinite time to realize the complete or rigorous Fermi degeneracy, when we start from the true electron vacuum. This result has a close connection with the Luttinger theorem [28] and the Fermi liquid theory [29], in which the lifetime of the quasi-particle just above or below the Fermi energy is infinite.

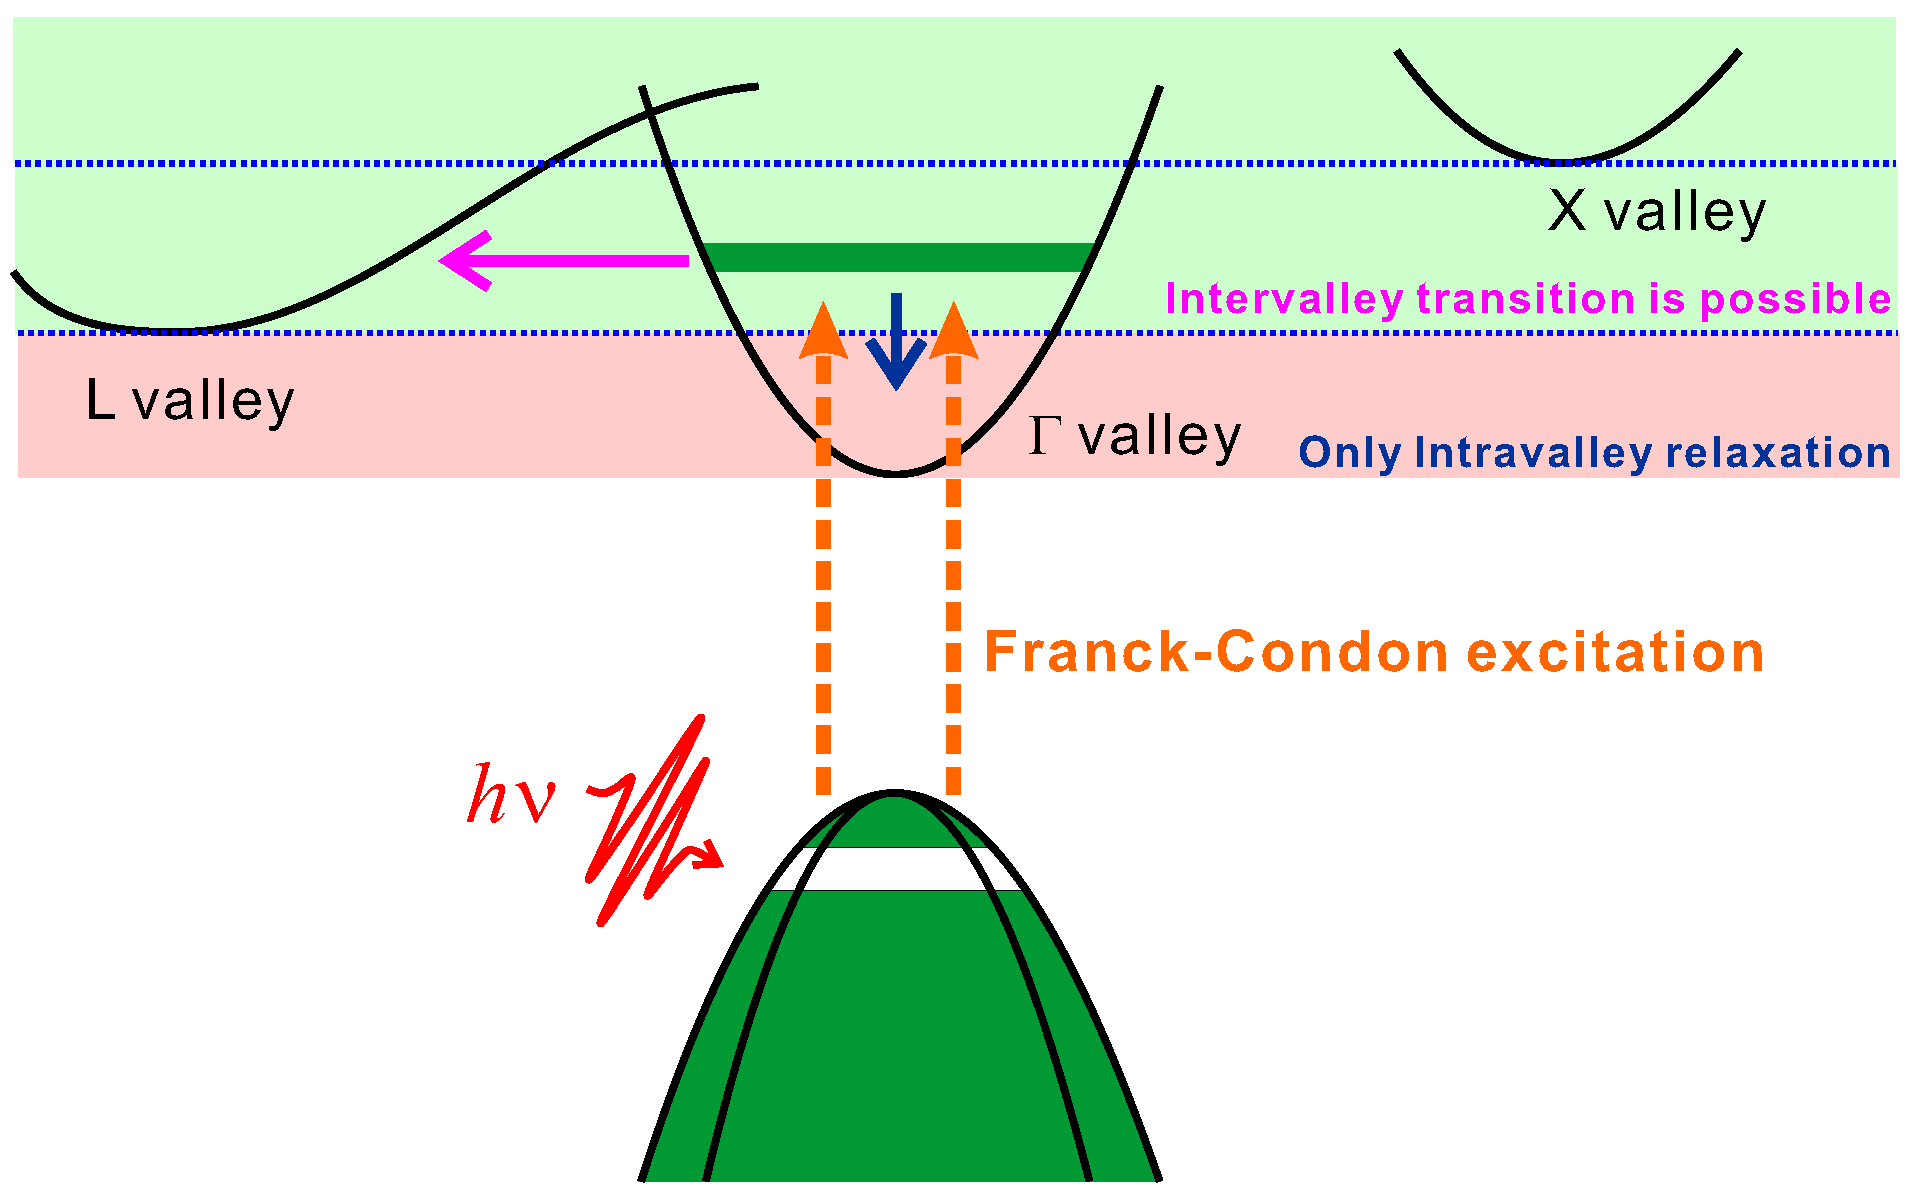
5. Intervalley Scattering and Franck–Condon Transition

In this section, we see the intervalley scattering (IVS) from the Γ valley to L. While the study of IVS has a long history of more than forty years, very recent experimental discovery of the IVS in the conduction band of GaAs gives us a big mystery about its microscopic origin. Becker et al. [30] have revealed at first that the IVS from the Γ valley to the L one is the ultrafast process characterized by the time constant of about 80 fs, by using the visible light transmittance measurement method. After that, Kanasaki et al. [8] succeeded in measuring this IVS more directly, by using time- and momentum-resolved 2PPES. They have determined that this intervalley transition occurs within 20 fs.

5.1. Conventional Theories

In the conventional theory of semiconductors, the microscopic quantum origin of the IVS has been understood in the context of the inelastic e-ph scattering [31,32,33,34,35,36,37,38,39,40]. In this mechanism, final L valley electrons and phonons must be independent of each other to achieve the process, while the scattering e-ph complex [41] is created after the excitation. For this purpose, the phonon should recoil and dissipate away from plane-wave electrons. To realize the energy and momentum conservation laws exactly in this inelastic and irreversible process, the phonon should oscillate at least a few periods or so, being inevitably slow [41], since the phonon oscillation period is ∼110 fs [40].
This argument can also be seen from the viewpoint of the Markov approximation or the linear response theory [42,43,44]. As seen in Equation (8), for instance, the transition rate by the inelastic e-ph scattering does not depend on the phonon frequency directly, implying that the phonon field works as a heat reservoir for the electron. This situation is validated when the averaged amplitude of the randomly oscillating phonons in the whole system is almost zero. This is the white noise condition in the Markov approximation. In the present problem, however, the time scale to pay attention to is much shorter than the phonon oscillation period. Then, the inelastic e-ph scattering is not adequate for the explanation of the present ultrafast IVS, and the detailed and microscopic origin of the aforementioned ultrafast IVS is under significant debate and should be investigated further.
On the other hand, the e-e scattering would be one of the promising mechanisms to realize the ultrafast transition. This mechanism has been examined by the ensemble Monte Carlo method, which has shown the time constant of the Γ to L ( Γ -L) transition to be of the order of 100 fs [45]. Then, the e-e scattering is one of the promising mechanisms for the ultrafast IVS. However, the 2PPES result has revealed that the time constant strongly depends on the temperature, implying that the understanding only by the e-e scattering is not enough.

5.2. Possible Scenario

When we argue the phenomena just after the photo-excitation, we should start from the Franck–Condon principle. In this principle, as mentioned in Section 2, electrons are adiabatically excited by visible light without any momentum exchange to phonons. Then, phonons soon after the photo-excitation are frozen at the ground state configuration before the photo-excitation. However, this does not mean that phonons never contribute to the photo-excitation. As suggested in [12], the spatial randomness of the frozen phonons can mix the eigenstates of the Γ valley with those of the L one. As a result, initially photo-injected electrons to the Γ valley diffuse into the L one in the Γ -L mixed eigenstate. We call this process the Γ -L “elastic” e-ph scattering.
As the process does not depend on the phonon system, the Coulombic scattering of two electrons, with no shift of the center of gravity of two electrons, as schematically shown in Figure 8a, is also expected to be an ultrafast process.
The above two processes, the e-e scattering of two electrons (Figure 8a) and the elastic e-ph one (Figure 8b), have been examined in [12].

5.3. Model and Method

The model and method introduced in [12] are reviewed. We start from the following Hamiltonian ( H ),
H = H 0 + H I , H 0 = H e + H p , H I = H ee + H ep ,
H e = k , σ E ( k ) a k , σ a k , σ , H p = q ω q b q b q ,
H ee = U l n l , n l , ,
H ep = ( 2 N ) 1 2 q , k , σ S q ( b q + b q ) a k q , σ a k , σ .
Here, E i ( k ) is the one electron energy in the conduction band, where i = Γ or L correspond to each valley state. The others are the same notation as those in Section 4.2. The unit of length is the lattice constant along the [111] direction of the GaAs crystal. U is the on-site Coulombic repulsion energy.
The time constants for the e-e process and the elastic e-ph one are estimated as inverse of the corresponding transition rate, which is derived by the second order perturbation theory. Thus, we can follow the same manner in Section 4.2 and obtain the rate equation as:
n k , σ ( t ) t = Γ ee , k , σ + + Γ ep , k , σ + ( T p ) Γ ee , k , σ + Γ ep , k , σ ( T p ) ,
where Γ ee , k , σ ± and Γ ep , k , σ ± ( T p ) are the transition rate for the e-e and e-ph processes, respectively. Since we treat only the Γ -L process soon after the photo-excitation, we need transition rates only for the decay channel of the Γ valley electrons to the L valley. For the e-e scattering and the elastic e-ph one, the decay transition rates are given by:
Γ ee , k , σ = 2 π U 2 N 2 k , q δ ( E L ( k + q ) + E L ( k q ) E Γ ( k ) E Γ ( k ) ) ,
and:
Γ ep , k , σ ( T p ) = 2 π N q S q 2 ( n q ( T p ) + 1 2 ) δ ( E L ( k + q ) E Γ ( k ) ) ,
respectively, with the phonon number n q ( T p ) . E Γ ( L ) represents the band energy in the Γ (L)-valley. In the derivation of Equations (18) and (19), it is assumed that the initial Γ valley is fully occupied and the L valley is completely unoccupied. Although this assumption may restrict the situation rather strongly, we can know the trend and characteristics of each scattering process to argue the possible ultrafast IVS.
In Equation (19), the frozen phonon effect is taken into account by neglecting the time dependence of the phonon annihilation (creation) operator in the interaction representation as:
b ˜ q ( ) ( t ) = e ( ) i ω q t b q ( ) ( 0 ) = b q ( ) ( 0 ) 1 + ( ) i ω q t ω q 2 t 2 + = b q ( ) ( 0 ) 1 + O ω q Band Width .
The energy dependent transition rate is given by:
Γ ee ( ep ) ( E ) = 4 k k ( E ) Γ ee ( ep ) , k , σ / N s ,
where N s is the corresponding number of states.
The parameters are set to U = 5 eV, S π = 0 . 15 eV and ω π = 30 meV, with the modeled band dispersion for the conduction band of GaAs [12].

5.4. Evaluation of the Time Constant

The numerically-evaluated time constants for the e-e and the elastic e-ph scatterings are given in Figure 9 and Figure 10. In Figure 9, E w corresponds to the initial electron distribution width, which is proportional to the photo-injected electron density. Since the frequency of the scattering event of two electrons in the Γ valley is proportional to E w , the time constant is inversely proportional to E w . The e-e scattering with sufficiently large electron density is one of the promising candidates of ultrafast Γ -L IVS, which can give a time constant smaller than 100 fs.
As seen in Figure 10, the elastic e-ph scattering is another promising candidate. The clear difference between the above two processes are the temperature dependence. In the elastic e-ph scattering, the time constant is inversely proportional to the phonon temperature T p , since the enhancement of the spatial randomness of the frozen phonon at the starting ground state increases the mixing rate of the eigenstates between the Γ valley and the L valley. On the other hand, the time constant for the e-e scattering does not depend on the temperature. The experimental results [8] have revealed that the time constant for the Γ -L IVS depends on the sample temperature. Thus, the elastic e-ph scattering gives a compatible result with the experiment, while the e-e scattering is also a possible process.

5.5. Analogy to the Dynamical Jahn–Teller Effect

The mechanism of the elastic e-ph scattering is basically the same as the dynamical Jahn–Teller effect in optical absorption [46]. To see this, let us consider the three-level localized electronic system, coupled with the x y phonon. The ground state is the s , and the excited states are doubly degenerated p x and p y . When there exists the dynamical lattice distortion Q x y due to thermal randomness, the p x and p y states are hybridized. Here, Q x y is the lattice distortion measured from the equilibrium position. The Hamiltonian of this system is written as:
H = 0 0 0 0 E 0 S Q x y 0 S Q x y E 0 + 1 2 ω x y Q x y 2 ,
where the energy of the s level is set to zero and those for p x and p y are E 0 . S is the e-ph coupling constant, and ω x y is the phonon frequency. Equation (22) is easily diagonalized within the excited state, and the resultant adiabatic energy as a function of Q x y is shown in Figure 11. In the excited state, p x and p y are no longer the eigenstates of the system; instead, the hybridized state ( p x ± p y ) / 2 becomes the eigenstate of the system. When the completely x-polarized white pulsed light is shone onto this system at time t = 0 , the photo-excited electrons are injected only into the p x state at first. Afterwards, the electrons in the p x state are transferred into the p y one. In the short time limit, this transition rate is easily obtained as:
p y e i t ( H E 0 ) p x S Q x y t .
Thus, we can see that the increasing speed of the p y component does not directly depend on ω x y . It does not depend on the time evolution of the x y phonon, but depends on the thermal excitation randomness in the starting ground state as:
1 2 ω x y Q x y 2 k B T .
Strictly speaking, this is not a transition, but a diffusion of carriers inside of one eigenstate ( p x ± p y ) / 2 .
The practical situation in the present intervalley transition is a little different from the above simple case, but the basic physical concept is entirely the same. Due to the thermal randomness in the ground state, the eigenstates of Γ valley and the L one are mixed up, and the ultrafast intervalley transition becomes possible.

5.6. Non-Condon Effect

In the elastic e-ph scattering, the phonons are frozen at the starting ground state configuration, exactly following the Franck–Condon principle of the photo-excitation. In this section, let us consider the situation that a small oscillation is allowed for the phonons. This is known as the non-Condon effect, which is taken into account by considering the higher order terms in the time evolution of the phonon operator in Equation (20). In this case, the transition rate can be written as:
Γ ep , k , σ = Γ ep , k , σ ( 0 ) + Γ ep , k , σ ( 1 ) + Γ ep , k , σ ( 2 ) + ,
where:
Γ ep , k , σ ( 0 ) = C N ( T p ) q F ( q , Δ ) Δ = 0 ,
Γ ep , k , σ ( 1 ) = C Δ q ω q F ( q , Δ ) Δ = 0 ,
and:
Γ ep , k , σ ( 2 ) = C N ( T p ) 2 Δ 2 q ω q 2 2 F ( q , Δ ) Δ = 0 ,
with C = 2 π N S π 2 , N ( T p ) = n π ( T p ) + 1 2 , and F ( k , q , Δ ) = δ ( E L ( k + q ) + Δ E Γ ( k ) ) . Δ is a hypothetical variable only for the formulation and is finally set to zero. The zeroth order term Γ ep , k , σ ( 0 ) corresponds to the elastic e-ph process, Equation (19). The evaluation of more higher order terms is straightforward, but their effects are very small.
The evaluation of the non-Condon effect is performed in the same condition as Section 5.4, except the temperature is fixed to T p = 0 K. The result is given in Figure 12. The effects of the first and second order terms are basically small. Thus, even if the non-Condon effect is taken into account, the characteristic time constant is not altered so much. However, the inclusion of the non-Condon effect makes the time constant larger compared with that without the non-Condon effect. This is an intrinsic point to understand the relationship between the elastic e-ph process and the inelastic e-ph one. As seen in Equations (27) and (28), the higher order terms explicitly depend on the phonon frequency ω q . Since the phonon oscillation period is long compared with the present time scale, the process including the phonon motion inevitably becomes slower than that without phonons. Although the argument of the non-Condon effect is valid only at around t = 0 , this has a close connection with why the inelastic e-ph process is not suitable for the explanation of the present ultrafast intervalley transition.

5.7. On- and Off-Resonance Effects

In this section, let us discuss the on- and off-resonance effects on the present intervalley scattering process and its experimental observation. The observation of the L valley electron can be seen as a two-step process naively. In the first process, the electrons in the ground state are excited into the Γ valley by a visible light and scattered to the final L valley after a while. In the second process, the L valley electron is emitted out of the crystal by the second light excitation.
In the first process through the elastic e-ph scattering, the matrix element between the intermediate Γ valley state and the final L valley one is given by the spatial randomness of the ground state phonons. As discussed in the preceding section, since this transfer of electrons from the Γ valley to the L one is a diffusion within an eigenstate, the elastic intervalley scattering has the same order as the Rayleigh scattering as an optical process. So far, we have treated only the on-resonant process in the elastic e-ph scattering, in which the photo-excited electrons are scattered to the L valley without a change of the energy, as shown in Figure 8b. As a general theory, the off-resonant process is also possible, while the intensity by the off-resonant process is expected to be much weaker than that of the resonant process in many cases. However, on- and off-resonance effects are basically indistinguishable as a final state interaction of light absorption.
In the second process, the initial L valley electron is emitted out of crystal by the second visible light excitation. In this process, the L valley electron can pass through the unoccupied states in the conduction band by the elastic e-ph process, as shown in Figure 13. This fact is reflected in the transition rate as the initial state interaction. Then, the initial state of this process would be written as:
k + 1 N q V k , k q E ( k ) E ( k q ) k q ,
where k is the electronic state with a wave vector k and V k , k q is the coupling constant of the elastic e-ph interaction between k and k q . In an actual experimental observation [10], the observed kinetic energy of the photo-emitted electron from the L valley is the same regardless of whether the electron passed through the above intermediate state or not. On the other hand, the momentum of the electron reflects their path. As a result, intensities along the equi-energy line, in which there is no one-body state, may be able to appear. In fact, we can see intensities between the Γ valley and the L one along the equi-energy line in the experimental EDF (Figure 14).
It should be noted that intermediate state can also be realized through other mechanisms such as elastic e-e scattering. However, the intensity would be much weaker than that by the elastic e-ph scattering.

6. Summary

We have reviewed the recent theoretical progress on the real-time dynamics of the photo-excited carriers in the conduction band of GaAs. The intravalley collective relaxation mechanism of the photo-excited carriers in the Γ valley was discussed in connection with the Fermi degeneracy formation. The instantaneous and spontaneous intervalley transition mechanism was also discussed in connection with the Franck–Condon principle of the photo-excitation. In both cases, the electron-phonon coupling has a very important role. These insights are brought by the direct observation of the EDF through the time- and momentum-resolved 2PPES measurement.
Very recently, time- and momentum-resolved 2PPES has been applied for the observation of the exciton [47,48]. Since the exciton is a bound state of an electron and a hole, the one-body state of the electron constituting the exciton is indefinite in principle, even if the exciton itself has a well-defined energy. Then, the observation of the exciton by 2PPES will open a new aspect of real electron-hole correlation in insulating solids.
The state-of-the-art optical measurement techniques give us precise information on the transient dynamics of photo-excited electrons and are important for their application. On the other hand, it gives another stage for more fundamental problems, even if the problem is a well-established concept. By reconsidering such fundamental concepts, we sometimes reach a more essential viewpoint and have various possibilities for physics. This would be an indispensable and important aspect of science.

Author Contributions

Writing, review and visualization, H.O. Supervision and conceptualization, N.T.

Funding

This work was partly supported by a JSPS Grant-in-Aid for Specially Promoted Research, Grant Number 24000006.

Acknowledgments

The authors would like to thank Katsumi Tanimura, Jun’ichi Kanasaki and Hiroshi Tanimura for presenting their research result prior to publication. One of authors (H.O.) would like to thank Patric Granholm, Antti Haarto and Markku Karhunen for kind and warm hospitality extended to him at Turku University of Applied Sciences.

Conflicts of Interest

The authors declare no conflict of interest.

References

  1. Nasu, K. Photo-Induced Phase Transitions; World Scientific: Singapore, 2004. [Google Scholar]
  2. Ishikawa, T.; Sagae, Y.; Naitoh, Y.; Kawakami, Y.; Itoh, H.; Yamamoto, K.; Yakushi, K.; Kishida, H.; Sasaki, T.; Ishihara, S.; et al. Optical freezing of charge motion in an organic conductor. Nat. Commun. 2014, 5, 5528. [Google Scholar] [CrossRef] [PubMed] [Green Version]
  3. Ohkoshi, S.; Takano, S.; Imoto, K.; Yoshikiyo, M.; Namai, A.; Tokoro, H. 90-degree optical switching of output second-harmonic light in chiral photomagnet. Nat. Photonics 2014, 8, 65–71. [Google Scholar] [CrossRef]
  4. Krausz, F.; Ivanov, M. Attosecond physics. Rev. Mod. Phys. 2009, 81, 163. [Google Scholar] [CrossRef]
  5. Damascelli, A.; Hussain, Z.; Shen, Z. Angle-resolved photoemission studies of the cuprate superconductors. Rev. Mod. Phys. 2003, 75, 473. [Google Scholar] [CrossRef]
  6. Ichibayashi, T.; Tanimura, K. Ultrafast Carrier Relaxation in Si Studied by Time-Resolved Two-Photon Photoemission Spectroscopy: Intravalley Scattering and Energy Relaxation of Hot Electrons. Phys. Rev. Lett. 2009, 102, 087403. [Google Scholar] [CrossRef] [PubMed]
  7. Kanasaki, J. Ultrafast Electron Dynamics in Photo-excited Semiconductors Studied by Time and Angle-resolved Two Photon Photoelectron Spectroscopy. CLEO Tech. Dig. 2014. [Google Scholar] [CrossRef]
  8. Kanasaki, J.; Tanimura, H.; Tanimura, K. Imaging Energy-, Momentum-, and Time-Resolved Distributions of Photoinjected Hot Electrons in GaAs. Phys. Rev. Lett. 2014, 113, 237401. [Google Scholar] [CrossRef] [PubMed]
  9. Tanimura, H.; Kanasaki, J.; Tanimura, K. Ultrafast scattering processes of hot electrons in InSb studied by time- and angle-resolved photoemission spectroscopy. Phys. Rev. B 2015, 91, 045201. [Google Scholar] [CrossRef]
  10. Tanimura, H.; Kanasaki, J.; Tanimura, K.; Sjakste, J.; Vast, N.; Calandra, M.; Mauri, F. Formation of hot-electron ensembles quasiequilibrated in momentum by ultrafast momentum scattering of highly excited electrons photoinjected into the Γ valley of GaAs. Phys. Rev. B 2016, 93, 161203. [Google Scholar] [CrossRef]
  11. Ohnishi, H.; Tomita, N.; Nasu, K. Real Time Relaxation Dynamics of Macroscopically Photo-Excited Electrons toward the Fermi Degeneracy Formation in the Conduction Band of Semiconductors. J. Phys. Soc. Jpn. 2015, 84, 043701. [Google Scholar] [CrossRef] [Green Version]
  12. Ohnishi, H.; Tomita, N.; Nasu, K. Instantaneous Intervalley Transition Just at the Franck–Condon State in the Conduction Band of GaAs. J. Phys. Soc. Jpn. 2016, 85, 013705. [Google Scholar] [CrossRef] [Green Version]
  13. Ramakrishna, S.; Willing, F.; Knorr, A. Time-resolved two-photon photoemission spectroscopy of semiconductor bulk states. Appl. Phys. A 2004, 78, 247–252. [Google Scholar] [CrossRef]
  14. Ueba, H.; Gumhalter, G. Theory of two-photon photoemission spectroscopy of surfaces. Prog. Surf. Sci. 2007, 82, 193–223. [Google Scholar] [CrossRef]
  15. Adachi, S. Properties of Group-IV, III-V and II-VI Semiconductors; Wiley: Chichester, UK, 2005. [Google Scholar]
  16. Mahan, G.D. Many-Particle Physics; Kluwer/Plenum: New York, NY, USA, 2000. [Google Scholar]
  17. Elsayed-Ali, H.E.; Norris, T.B.; Pessot, M.A.; Mourou, G.A. Time-resolved observation of electron-phonon relaxation in copper. Phys. Rev. Lett. 1987, 58, 1212. [Google Scholar] [CrossRef] [PubMed]
  18. Schoenlein, R.W.; Lin, W.Z.; Fujimoto, J.G. Femtosecond studies of nonequilibrium electronic processes in metals. Phys. Rev. Lett. 1987, 58, 1680. [Google Scholar] [CrossRef] [PubMed]
  19. Zhukov, V.P.; Andreyev, O.; Hoffmann, D.; Bauer, M.; Aeschlimann, M.; Chulkov, E.V.; Echenique, P.M. Lifetimes of excited electrons in Ta: Experimental time-resolved photoemission data and first-principles GW +T theory. Phys. Rev. B 2004, 70, 233106. [Google Scholar] [CrossRef]
  20. Baranov, V.V.; Kabanov, V.V. Theory of electronic relaxation in a metal excited by an ultrashort optical pump. Phys. Rev. B 2014, 89, 125102. [Google Scholar] [CrossRef]
  21. Pötz, W. Hot-phonon effects in bulk GaAs. Phys. Rev. B 1987, 36, 5016. [Google Scholar] [CrossRef]
  22. Elsaesser, T.; Shah, J.; Rota, L.; Lugli, P. Initial thermalization of photoexcited carriers in GaAs studied by femtosecond luminescence spectroscopy. Phys. Rev. Lett. 1991, 66, 1757. [Google Scholar] [CrossRef] [PubMed]
  23. Rota, L.; Lugli, P.; Elsaesser, T.; Shah, J. Ultrafast thermalization of photoexcited carriers in polar semiconductors. Phys. Rev. B 1993, 47, 4226. [Google Scholar] [CrossRef]
  24. Collet, J.H. Screening and exchange in the theory of the femtosecond kinetics of the electron-hole plasma. Phys. Rev. B 1993, 47, 10279. [Google Scholar] [CrossRef]
  25. Hohenester, U.; Supancic, P.; Kocevar, P.; Zhou, X.Q.; Kütt, W.; Kurz, H. Subpicosecond thermalization and relaxation of highly photoexcited electrons and holes in intrinsic and p-type GaAs and InP. Phys. Rev. B 1993, 47, 13233. [Google Scholar] [CrossRef]
  26. Leitenstorfer, A.; Fürst, C.; Laubereau, A.; Kaiser, W. Femtosecond Carrier Dynamics in GaAs Far from Equilibrium. Phys. Rev. Lett. 1996, 76, 1545. [Google Scholar] [CrossRef] [PubMed]
  27. Luttinger, J.M. Fermi Surface and Some Simple Equilibrium Properties of a System of Interacting Fermions. Phys. Rev. 1960, 119, 1153. [Google Scholar] [CrossRef]
  28. Luttinger, J.M.; Ward, J.C. Ground-State Energy of a Many-Fermion System. II. Phys. Rev. 1960, 118, 1417. [Google Scholar] [CrossRef]
  29. Pines, D.; Nosières, P. The Theory of Quantum Liquid; Benjamin: New York, NY, USA, 1989. [Google Scholar]
  30. Becker, P.C.; Fragnito, H.L.; Cruz, C.H.B.; Shah, J.; Fork, R.L.; Cunningham, J.E.; Henry, J.E.; Shank, C.V. Femtosecond intervalley scattering in GaAs. Appl. Phys. Lett. 1988, 53, 2089–2090. [Google Scholar] [CrossRef]
  31. Rossi, F.; Kuhn, T. Theory of ultrafast phenomena in photoexcited semiconductors. Rev. Mod. Phys. 2002, 74, 895. [Google Scholar] [CrossRef]
  32. Mlckevic̆ius, R.; Reklaitis, A. Electron intervalley scattering in gallium arsenide. Semicond. Sci. Technol. 1990, 5, 805. [Google Scholar]
  33. Jacoboni, C.; Reggiani, L. The Monte Carlo method for the solution of charge transport in semiconductors with applications to covalent materials. Rev. Mod. Phys. 1983, 55, 645. [Google Scholar] [CrossRef]
  34. Oberli, D.Y.; Shah, J.; Damen, T.C. Intervalley scattering in GaAs. Phys. Rev. B 1989, 40, 1323. [Google Scholar] [CrossRef]
  35. Jalabert, R.; Sarma, S.D. Inelastic scattering in a doped polar semiconductor. Phys. Rev. B 1990, 41, 3651. [Google Scholar] [CrossRef]
  36. Zollner, S.; Gopalan, S.; Cardona, M. Intervalley deformation potentials and scattering rates in zinc blende semiconductors. Appl. Phys. Lett. 1989, 54, 614. [Google Scholar] [CrossRef]
  37. Zollner, S.; Gopalan, S.; Cardona, M. Microscopic theory of intervalley scattering in GaAs: K dependence of deformation potentials and scattering rates. J. Appl. Phys. 1990, 68, 1682–1693. [Google Scholar] [CrossRef]
  38. Stanton, C.J.; Bailey, D.W. Rate equations for the study of femtosecond intervalley scattering in compound semiconductors. Phys. Rev. B 1992, 45, 8369. [Google Scholar] [CrossRef]
  39. Bigot, J.-Y.; Portella, M.T.; Schoenlein, R.W.; Cunningham, J.E.; Shank, C.V. Resonant intervalley scattering in GaAs. Phys. Rev. Lett. 1990, 65, 3429. [Google Scholar] [CrossRef] [PubMed]
  40. Fürst, C.; Leitenstorfer, A.; Laubereau, A.; Zimmermann, R. Quantum Kinetic Electron-Phonon Interaction in GaAs: Energy Nonconserving Scattering Events and Memory Effects. Phys. Rev. Lett. 1997, 78, 3733. [Google Scholar] [CrossRef]
  41. Toyozawa, Y. Resonance and Relaxation in Light Scattering. J. Phys. Soc. Jpn. 1976, 41, 400–411. [Google Scholar] [CrossRef]
  42. Nakajima, S. On Quantum Theory of Transport Phenomena: Steady Diffusion. Prog. Theor. Phys. 1958, 20, 948–959. [Google Scholar] [CrossRef]
  43. Mori, H. Transport, Collective Motion, and Brownian Motion. Prog. Theor. Phys. 1965, 33, 423–455. [Google Scholar] [CrossRef] [Green Version]
  44. Aihara, M. Non-Markovian theory of nonlinear-optical phenomena associated with the extremely fast relaxation in condensed matter. Phys. Rev. B 1982, 25, 53. [Google Scholar] [CrossRef]
  45. Kann, M.J.; Kriman, A.M.; Ferry, D.K. Effect of electron-electron scattering on intervalley transition rates of photoexcited carriers in GaAs. Phys. Rev. B 1990, 41, 12659. [Google Scholar] [CrossRef]
  46. Toyozawa, Y.; Inoue, M. Dynamical Jahn-Teller Effect in Alkali Halide Phosphors Containing Heavy Metal Ions. J. Phys. Soc. Jpn. 1966, 21, 1663–1679. [Google Scholar] [CrossRef]
  47. Zhu, X.-Y. Photoemission from excitons in organic semiconductors. J. Electron Spectrosc. Relat. Phenom. 2015, 204, 75–79. [Google Scholar] [CrossRef]
  48. Ohnishi, H.; Tomita, N.; Nasu, K. Direct determination of exciton wavefunction amplitudes by the momentum-resolved photo-electron emission experiment. Int. J. Mod. Phys. B 2018, 32, 1850094. [Google Scholar] [CrossRef] [Green Version]
Figure 1. A schematic view of two-photon photo-emission process is shown. E VBM , E CBM and E vac represent the energies at the valence band maximum, conduction band minimum and vacuum level, respectively. E kin is the kinetic energy of the photo-emitted electron. k | | is the wave vector (or momentum) of the photo-emitted electron parallel to the crystal surface. For more details, see the text.
Applsci 08 01788 g001
Figure 2. A schematic view of band structure of GaAs is shown. According to the distribution of photo-injected electrons, intravalley and intervalley scatterings become possible. For more details, see the text.
Applsci 08 01788 g002
Figure 3. The time evolution of the density of states (DOS) is shown. CFDS represents the DOS at the completely Fermi degenerated state. Thick and thin lines are plotted at every 500 and 100 fs, respectively, from t = 0 –4000 fs. Adapted with the permission from [11], copyright Journal of the Physical Society of Japan, 2015.
Applsci 08 01788 g003
Figure 4. The time evolution of the mean energy is shown. “Only acoustic (optical)” represents the result, considering the time evolution only by the e-acoustic (ac) (op (optical)) process.
Applsci 08 01788 g004
Figure 5. The time evolution of the total energy is shown. The dashed line represents the energy relaxation, which is proportional to t 1 . The total energy is referenced from that in the completely Fermi degenerated state (CFDS). Adapted with the permission from [11], copyright Journal of the Physical Society of Japan, 2015.
Applsci 08 01788 g005
Figure 6. The time evolution of the electron occupations to 4000 fs is given. In the completely Fermi degenerated state (CFDS), the electron occupation corresponds to the Fermi–Dirac distribution at T = 0 K. The energy is referenced from the conduction band minimum (CBM).
Applsci 08 01788 g006
Figure 7. n M -dependence of the mean energy is shown.
Applsci 08 01788 g007
Figure 8. A schematic explanation of (a) elastic e-e scattering (Coulomb burst) and (b) elastic e-phonon (ph) scattering is shown. Adapted with the permission from [12], copyright Journal of the Physical Society of Japan, 2016.
Applsci 08 01788 g008
Figure 9. The time constant by the elastic e-e scattering is given. The energy is referenced from that of the L valley bottom. Adapted with the permission from [12], copyright Journal of the Physical Society of Japan, 2016.
Applsci 08 01788 g009
Figure 10. The time constant by the elastic e-ph scattering is given. The energy is referenced from that of the L valley bottom. T represents the phonon temperature, and thus, T = T p . Adapted with the permission from [12], copyright Journal of the Physical Society of Japan, 2016.
Applsci 08 01788 g010
Figure 11. The adiabatic energy of three-level localized electronic system distorted by the thermal randomness of the phonon is given. For more details, see the text.
Applsci 08 01788 g011
Figure 12. Time constant by the elastic Γ -L e-ph transition, including the non-Condon effect, is given.
Applsci 08 01788 g012
Figure 13. A schematic view of the initial state interaction in the photo-emission process of the L valley electrons. The colored arrows show some possible emission paths of a L valley electron, passing through the unoccupied states in the conduction band. For more details, see the text.
Applsci 08 01788 g013
Figure 14. The experimental energy distribution function (EDF) in the conduction band of GaAs, obtained by two-photon photoemission spectroscopy (2PPES). The solid and dashed curves show the band dispersion along Γ -L and Γ -X directions, plotted as a function of angle, based on the band-structure calculation in Ref. [10]. Adapted with permission form [10], copyright American Physical Society, 2016. For more details, see [10].
Applsci 08 01788 g014

