Role of Piezoelectric Elements in Finding the Mechanical Properties of Solid Industrial Materials


1
Materials Engineering Department, College of Engineering, Diyala University, Diyala 32001, Iraq
2
Centre of Integrated Design for Advanced Mechanical Systems (PRISMA), Department of Mechanical and Materials Engineering, Faculty of Engineering and Built Environment, University Kebangsaan Malaysia, UKM, Bangi 43600, Malaysia
*
Author to whom correspondence should be addressed.
Appl. Sci. 2018, 8(10), 1737; https://doi.org/10.3390/app8101737
Submission received: 14 August 2018
/
Revised: 11 September 2018
/
Accepted: 12 September 2018
/
Published: 26 September 2018
(This article belongs to the Special Issue Piezoelectric Actuators)
Abstract
:Recent developments in ultrasonic material testing have increased the need to evaluate the current status of the different applications of piezoelectric elements (PEs). This research have reviewed state-of-the-art emerging new technology and the role of PEs in tests for a number of mechanical properties, such as creep, fracture toughness, hardness, and impact toughness, among others. In this field, importance is given to the following variables, namely, (a) values of the natural frequency to PEs, (b) type and dimensions of specimens, and (c) purpose of the tests. All these variables are listed in three tables to illustrate the nature of their differences in these kinds of tests. Furthermore, recent achievements in this field are emphasized in addition to the many important studies that highlight the role of PEs.
1. Introduction
The role of piezoelectric elements (PEs) in ultrasonic tests and smart system applications is becoming increasingly difficult to ignore, especially with regard to art using PE in finding the mechanical properties of solid materials. The classical definition of PE is a polarizing ceramic material that can convert mechanical energy to electric energy and vice versa. The mechanical wave or vibration is generated through passing an electric wave through the two electrodes of the PE then, into the material of PE itself. The piezoelectric effect causes a crystal to produce an electrical potential when it is subjected to mechanical vibration. In contrast, the reverse piezoelectric effect causes the crystal to produce vibration when it is placed in an electric field. A crystal exhibits the piezoelectric effect if its structure has no center of symmetry. A stress (tensile or compressive) applied to such a crystal will alter the separation between the positive and negative charge sites in each elementary cell leading to a net polarization at the crystal surface. The effect is practically linear, i.e., the polarization varies directly with the applied stress, and is direction-dependent, so that compressive and tensile stresses will generate electric fields and hence voltages of opposite polarity. It is also reciprocal, so that if the crystal is exposed to an electric field, it will experience an elastic strain causing its length to increase or decrease according to the field polarity [1]. There are many advantages of PEs which are very important in mechanical tests such as (1) the high electromechanical transformation efficiency; (2) a broad range of characteristics can be achieved with different material compositions (high degree of freedom in characteristics design); (3) high stability; and (4) their suitability for mass production and economic production. The purposes of this research are: (a) to summarize published articles that involve PE applications in testing material properties; (b) to report recent progress in this field; and (c) to establish a guideline for the frequency levels or ranges of PE use associated with the dimensions of test specimens for these types of tests.
2. Using Piezoelectricity to Calculate Solid-Material Properties
The properties that were taken into account are discussed in the following sub-sections.
2.1. Creep
Creep represents plastic deformation in material over time, when this material is subjected to constant stress. This stress is often less than the yield point of the material. Usually, creep does not necessarily mean failure, but it is usually not good. Acute creep tends to increase with increasing temperature.
To calculate the static creep rate of ice and a frozen soil specimen (394 mm long and 76 mm in diameter subject to −3 °C), two pieces of PE with frequency ranging from 0 Hz to 1000 Hz were used [2]. In this test, the input motion and output sample resonance are both observed and measured with piezoelectric transducer attached to the cap and base plates at passive and active ends of the specimen.
Vibrocreep in polymers means an acceleration of creep through the specimen to the cyclic loading regime. This test was used as one of many stages in an experimental program to test the creep in polymers and thin-film of piezoelectric polymer made from polyvinylidene fluoride (PVDF) [3,4]. The PVDF used can sense very small vibrations from 1 Hz to 20 Hz, slight changes in stress, after more than 10 years and 100 million pressure cycles at a pressure range from 10 kPa to 2 MPa, with approximately 10% accuracy, and about 1 ms response time [3]. In addition, the PVDF can be used in a wide temperature range (−40 °C to +160 °C). In another report, PVDF of 4 mm diameter with hosing diameter range of 8 mm to 20 mm was used, which can sense loads with frequency ranging from 0.001 GHz to 2 GHz [4]. These potential properties and their flexibility in use are very difficult to find in many available sensors or smart materials. Thus, most ultrasonic creep tests have utilized PVDF recently [5,6,7].
The Udimet 520 and IN738LC Ni nickel-based alloy is one of the important alloys in manufacturing gas turbine blades because this material has a high resistance to creep. A previous study reported the relationship between creep life and its effects on ultrasonic waves for these alloys using PE (2.25 MHz, 6 mm diameter that was manually joined to the specimen using a compliant gel) as a dual element transducer (pulse emitter and receiver from the same location) [8]. The overall length of these specimens was 15 cm and the width ranged from 2.25 cm to 3.0 cm.
To measure the creep in SUS 316L austenitic stainless steel, a control system consisting of PE with a natural frequency of 15 MHz as the valve opening to control the force which comes from the vacuum drum was designed [9]. This application reveals the ability of PE as a high-velocity actuator with small size, which can be used in special applications.
In the same manner, another report indicated that ultrasonic attenuation increases on two conditions, namely, an increase in the equivalent size of cubical shape γ’ precipitates and an increase in creep time [10]. This attenuation in ultrasonic waves can be used as a potential non-destructive parameter for evaluating the creep degree for the alloy IN738LC Ni, as shown in Figure 1. Thus, piezoelectric transducer (PT) with a center frequency of 15 MHz in a pulse echo technique was used to calculate the attenuation in this wave. Then, the degree of creep in this alloy was calculated. In addition, PE was used as a sensor to measure creep in paper peeling [11].
2.2. Fracture Toughness
In recent years, interest in fracture toughness in the ultrasonic field has increased considerably. Fracture toughness is defined as the ability of the material to resist the progression of a crack. Material failure occurs when where: , K1 = mode 1 stress intensity factor, Y = constant, depending on geometry/loading, σ = average stress (i.e., away from the crack), c = crack size, and K1C = is a material property named fracture toughness.
One of the methods of measuring the increasing toughness of materials is by using a periodic residual stress model, which was explained in detail in [12]. A piezospectroscopic technique [13], a method that was described in detail in another report [14], was used to calculate the residual stress in an alumina matrix (ZrO2-Zr) from the measured frequency shifts according to a relation of linear proportionality through the average piezospectroscopic coefficients given by He and Clarke [15]. Recently, most measurements of residual stresses in several alloys have been implemented by piezospectroscopic measurements based on the shift peak as a function of stress [16]. Table 1 highlights some of the roles of PEs in finding the fracture toughness property for some solid metals.
Many common methods have used attenuation in ultrasonic waves as an indicator of fracture toughness [34,35,36]. For example, in the investigation of the influence of nitrogen on the fracture toughness (K1C) of stainless steel coatings, a 150 kHz PE was used as filter for signals (filter for interference noise during the test) for frequencies above 300 kHz and below 100 kHz [37]. In addition, the changing of the voltage values of the PE signal, within these bandwidth during the increasing of test load from 0 N to 200 N, were used as an indication of the critical magnitude of the load, which is the threshold load for crack formation (PC). Then, they used PC to calculate K1C using Equation (1):
where Ccircular = the radial crack length in the coating, Ec= elastic modulus of the coating, and Hc= hardness of the coating.
2.3. Hardness
Hardness is defined as the resistance to plastic deformation, such as scratching, cutting, or abrasion. Several classic methods to determine the hardness of a material include the Rockwell hardness test, Brinell hardness, Vickers, Knoop hardness, and Shore. A number of researchers suggested different methods to use PE in finding the hardness of materials. PE was used as a 1 Hz actuator in a nano/micro-hardness tester to apply load on a specimen to check the hardness [38].
Similarly, PE was regarded as load actuator in the hardness measurements for JNl, JN2, SUS304, SUS 316L, Ti alloy, and copper at cryogenic temperatures less than 4.2 K, where the piezo-actuator is expected to maintain the given load constant when the applied load fluctuates [39]. Another application in this field is PE as a piezoscanner [40].
As a sensor of load, PE with a frequency of 5 MHz, was connected with an amplifier and displayed on a memory oscilloscope. PE was used to calculate the dynamic and static hardness of different materials [41]. In the same context, five piezo-elements in series were used as a force sensor, where the maximum displacement of dynamic part in that device was 15 µm [42,43].
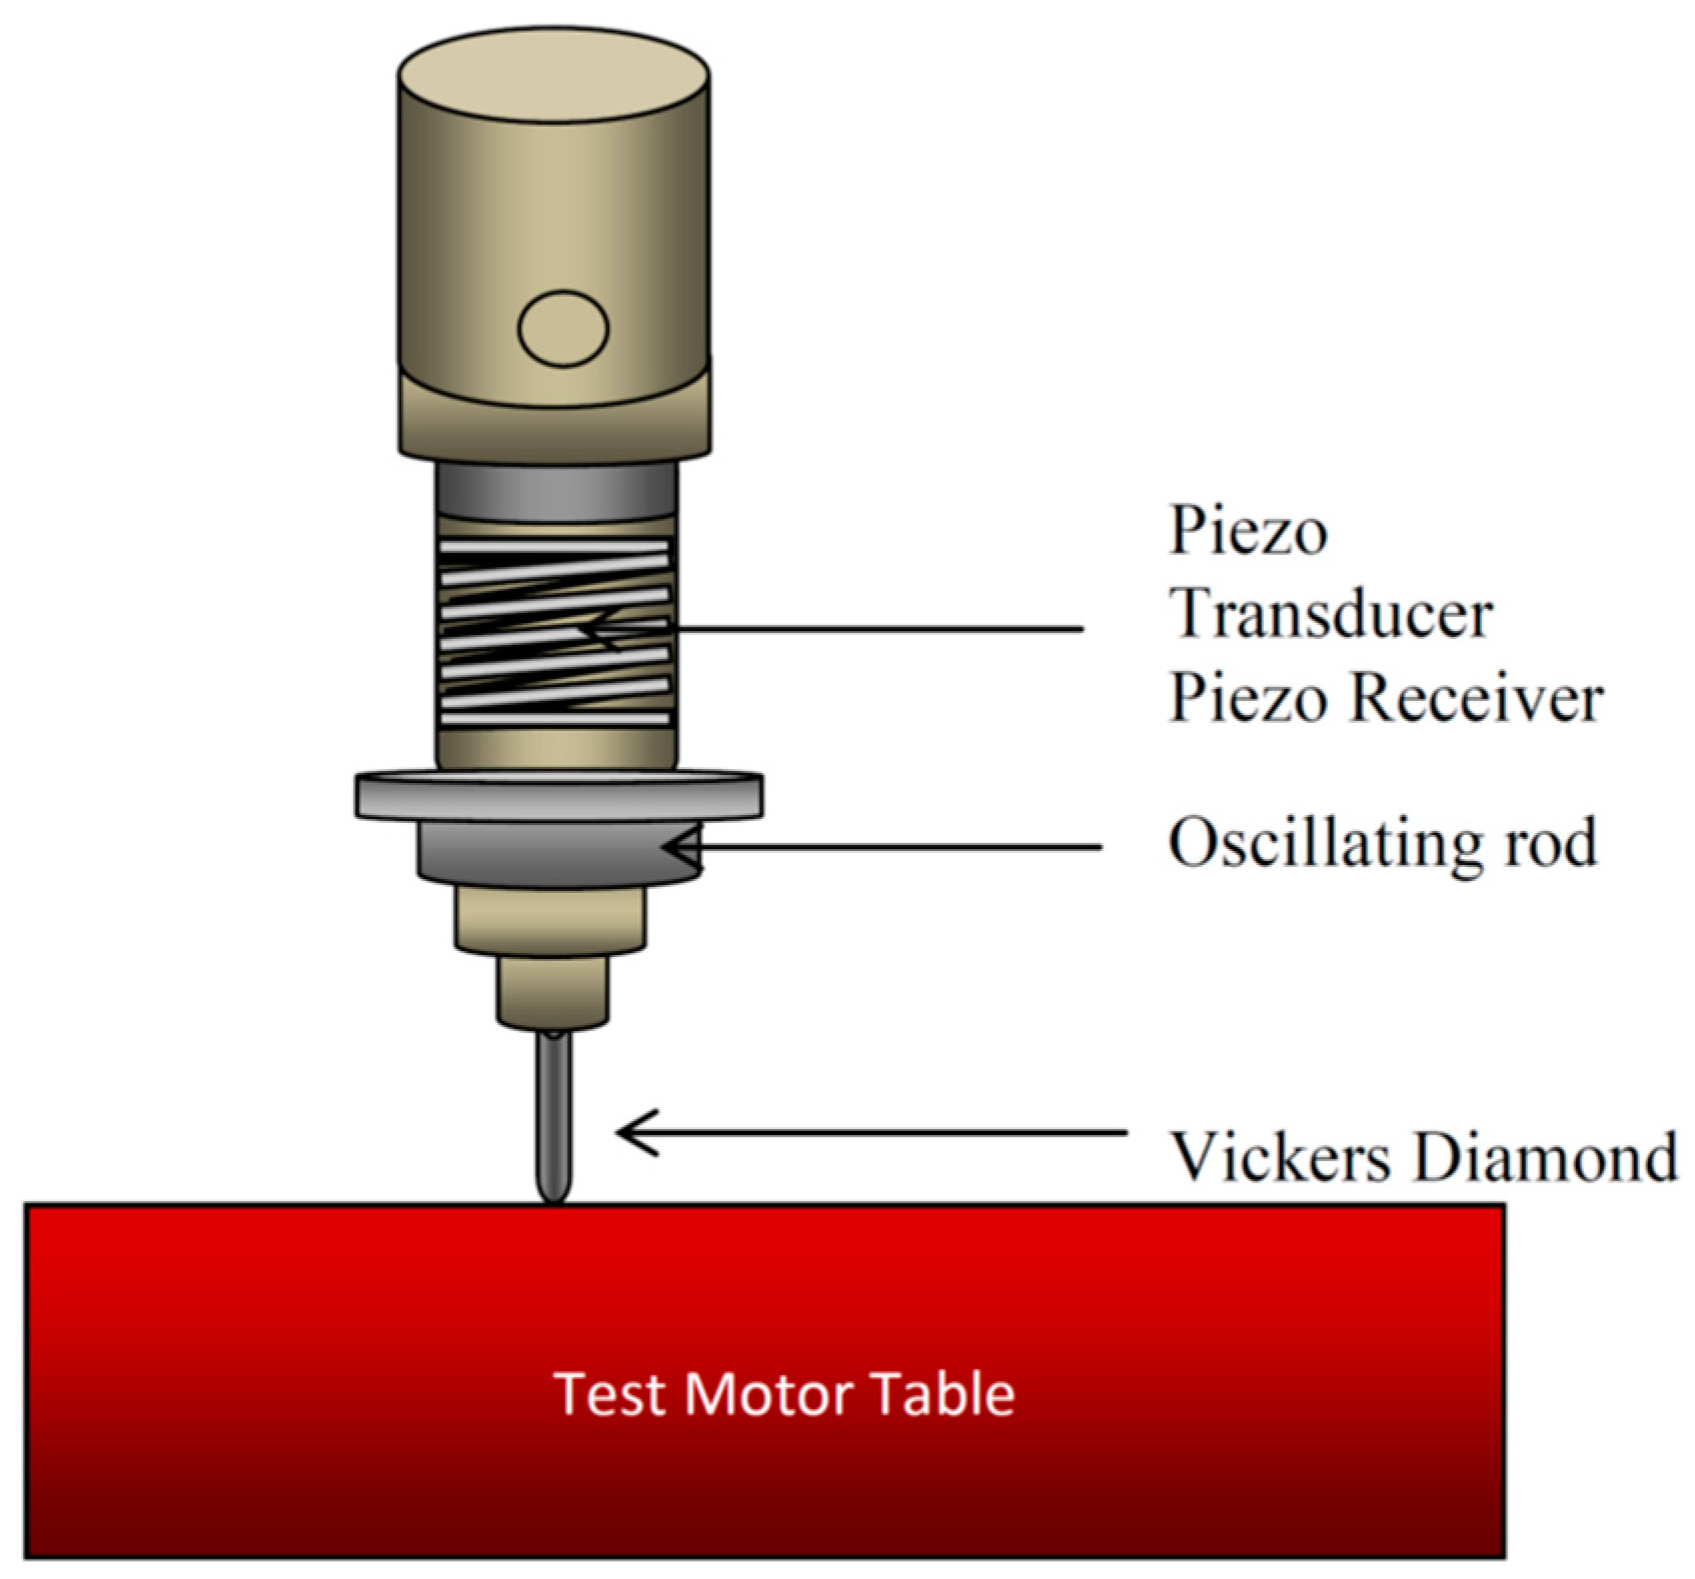
The authors in [44,45,46,47,48,49] used the PE in the ultrasonic contact impedance (UCI) method to measure the frequency shift. However, MIC10 and MIC20 can be also used for standardization according to ASTM A 1038 and DIN 50159 to evaluate the hardness of the material, as indicated in Figure 3 [46]. When a 70 kHz PE excite s the metal rod, the end of this rod will penetrate the specimen as provided by Vickers Diamond. This penetration will cause a frequency shift and allow the indentation area to be electronically detected by measuring the shift of an ultrasonic frequency using a piezoelectric receiver. The frequency shift is proportional to the size of the Vickers test indentation. Then, hardness can be evaluated using Equation (2):
where Δf is the frequency shift, A is the area of indentation, Eeff is the effective Young’s modulus, HV is the Vickers hardness value, and F is the test load.
Δf = f (Eeff, A); HV = F/A
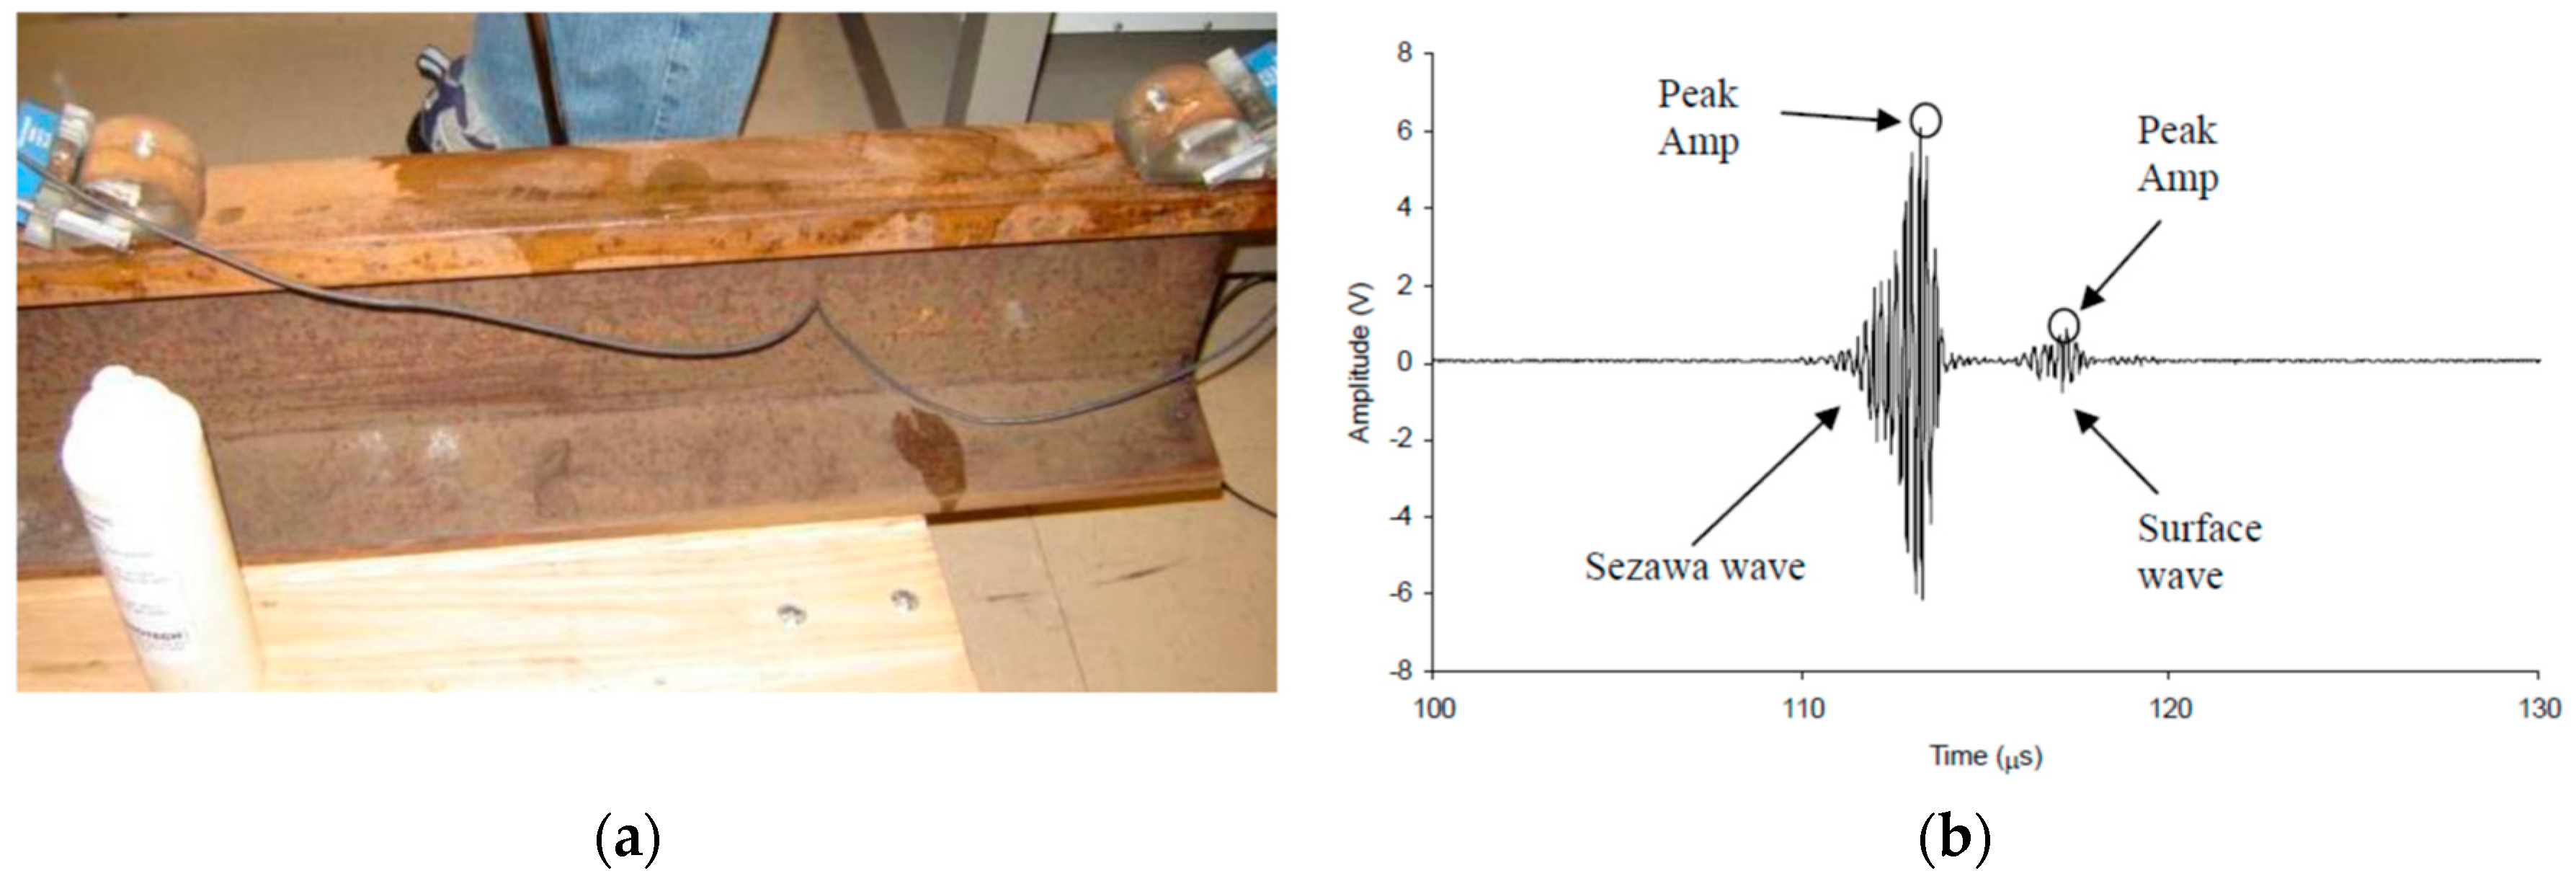
To characterize and identify a traffic-hardened layer in a rail surface and to identify a minimum detectable hardness gradient requirement in this rail, three different frequency angle-wedge PEs (ultrasonic transducers) were used to develop the handled prototype (Lunch Box PC) [50,51]. This box has the ability to produce Sezawa waves that have been used in inspections for rail specimens, as shown in Figure 4a,b. These PE pieces, with frequencies ranging from 1 MHz to 5 MHz, were included after a grinding cycle to the rail specimen (to use in pulse echo technique). Then, this process was repeated for several depths at 1.9 mm to 5.65 mm of grinding to check the amplitude of the Sezawa wave after each grinding cycle. Afterward, they compared these results (maximum amplitudes of the Sezawa wave) from the different depths of the grinding cycles with a standard rail hardness profile and used the amplitude of these waves as an indication of hardness.
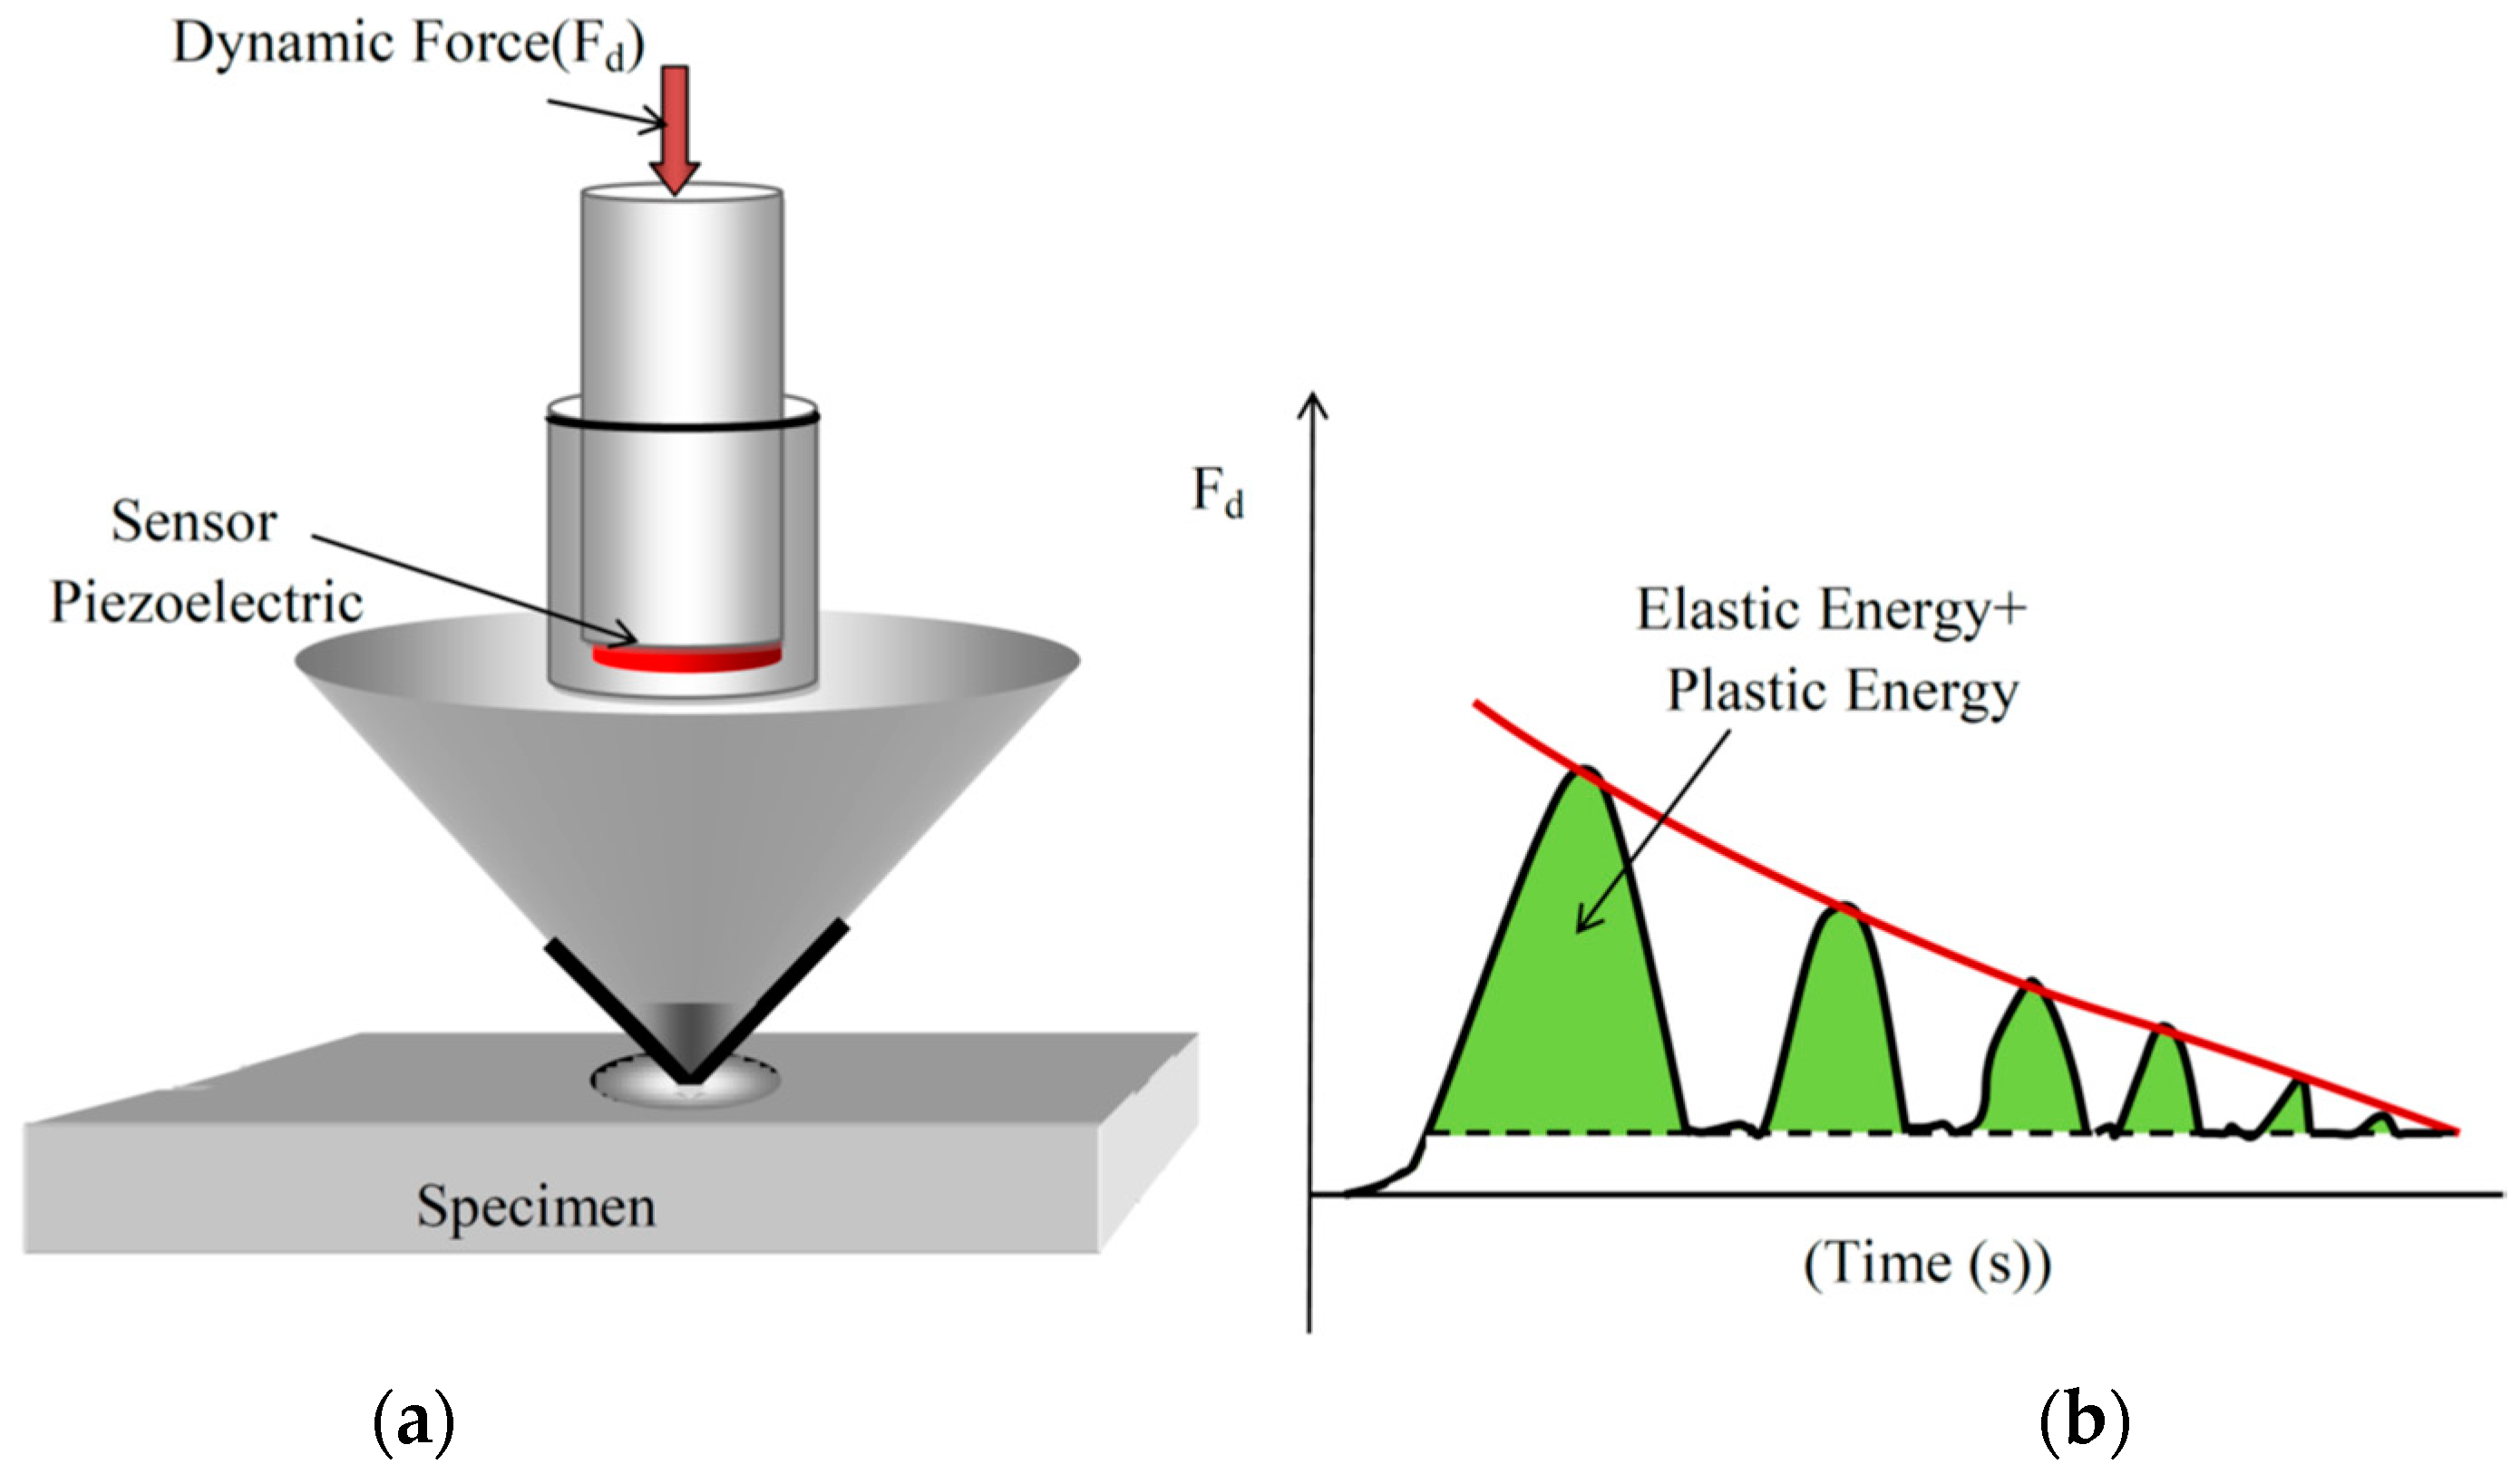
The design of Gutt [52] is regarded as one of the modern apparatuses in the field of using an acoustic technique for testing the properties of materials, because they used PE as a device for sensing the elastic reaction force from a specimen after force removal. This PE was located after a press part, as shown in Figure 5a, and the output voltage from this PE suits the dynamic force Fd, as shown in Figure 5b. The shadowed area represents the elastic and plastic deformation energy. This energy is relative to the kinetic energy of impact calculated from a connected superior photo barrier coupled to an electronic counter and other facilities, and it is proportional to dynamic hardness. The references [53,54,55]provide more details about how to create equivalent voltage from mechanical load by using PE.
Recently, guide waves have been used in determining the hardness of metals. Guide waves suffer from changes in attenuation and dispersion with the changing of material microstructure due to several reasons, such as rolling, heat treatment, and so on. Thus, to test the hardness of six specimens of aluminum 2024 alloy plates (152. 4 mm × 50.8 mm × 4.0 6 mm) difference in heat treatments using Lamb waves, ref. [56] employed two pairs of PTs at the two frequencies of 1 and 3.5 MHz in pitch catch technique to achieve this aim.
The role of PE in this area is not limited to determining the mechanical properties of materials but also to studying the effect of external factors on these characteristics. For example, ref. [57] recently published a new article on the relationship between the levels of hardness and the performance of coated carbide tool for AISI 4340 steel. This study was performed using a three-component of the PE KISTLER Type 9257A as dynamometer to measure the average values of the force components of the cutting.
2.4. Impact Toughness
Impact is a high load that strikes one or more bodies during a specific short time, but the strength of the impact is the ability to resist or to withstand shock loading. Popular methods used to determine the strength of impact are those of Charpy and Izod. Typically, this work focuses on using PE in an impact test. Many authors used a PE as a sensor to obtain a constant output signal in impact toughness tests. This advantage of PE (as a sensor) was used to measure the impact toughness of glass/polyester face sheet/polyvinyl chloride (PVC) foam core sandwich structure [58], which is widely used in automotive, aerospace, and marine industries because it has high superior bending stiffness, acoustic damping, and low weight.
Authors in [59,60] developed a new instrument to determine the impact energy by employing a suitable frequency PE as a strain gage to obtain real-time information such as force-versus-time behavior for the material and the magnitude of peak force, which Charpy and Izod cannot provide.
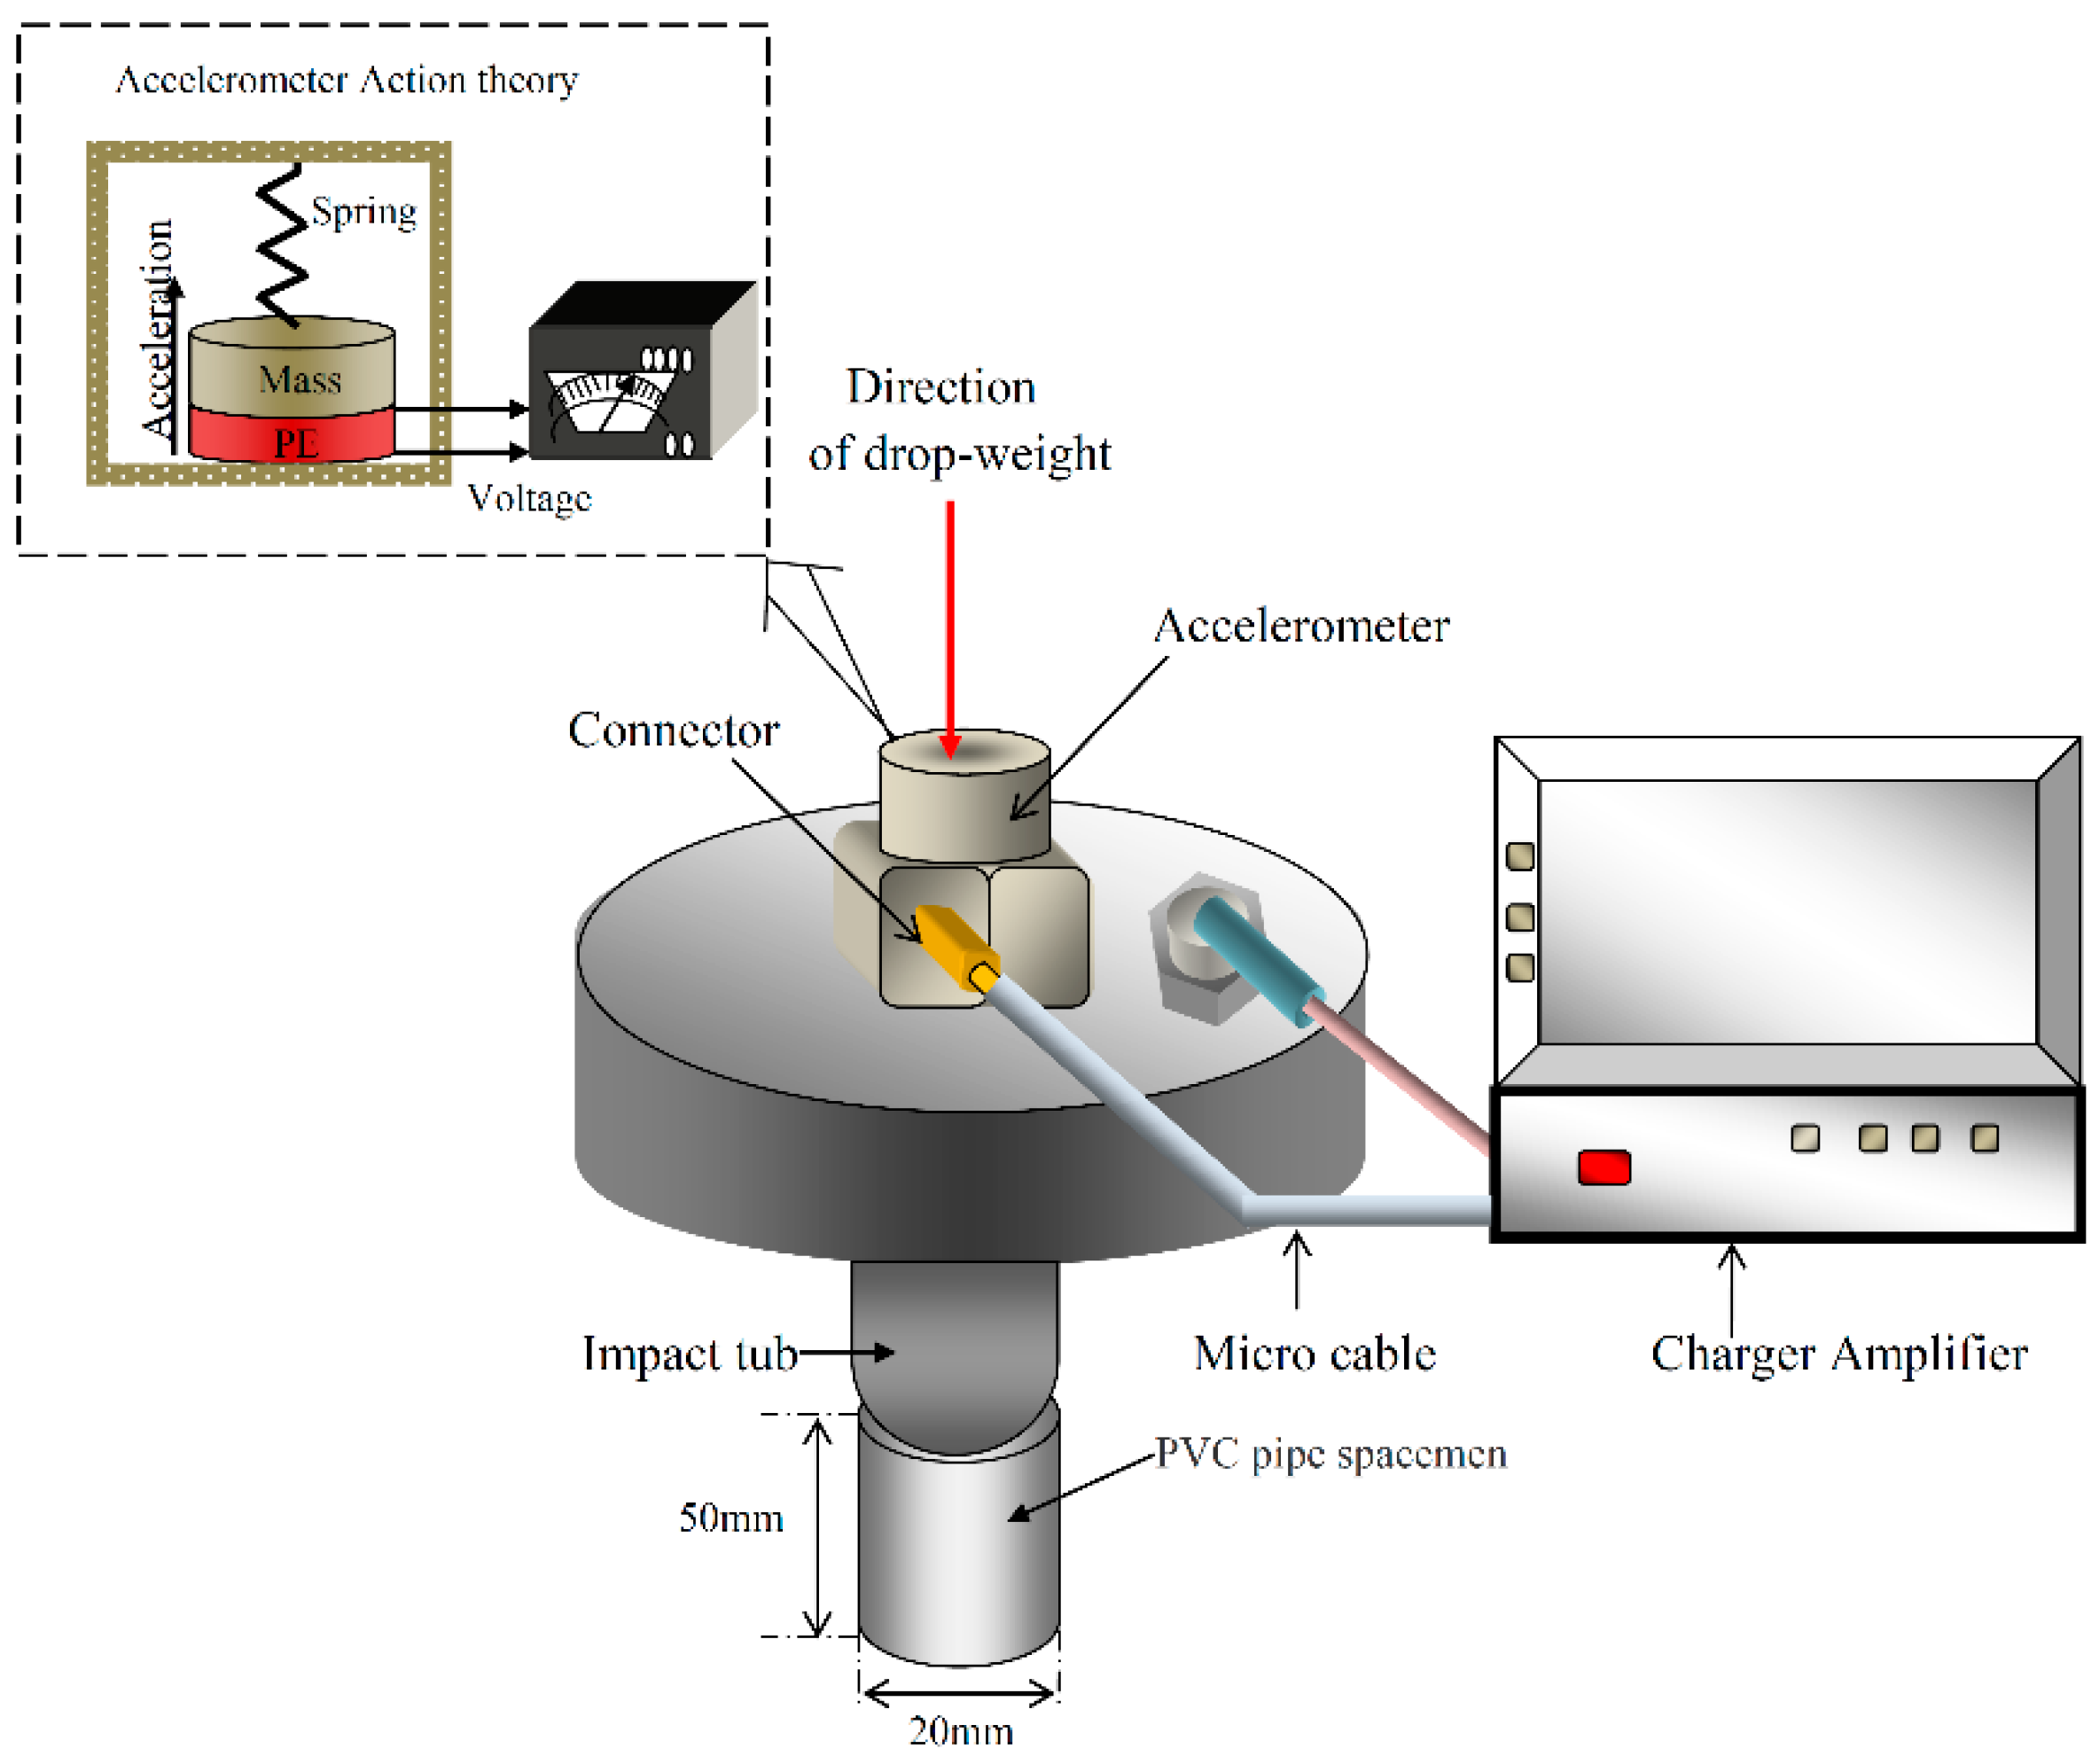
Given the wide usage of PVC pipes in mechanical and civil engineering, authors in [61] employed this material as a specimen to illustrate the impact strength of 25% and 33% VE/FLYASH using the drop-weight test. This test contains a “Bruel and Kjaer” piezoelectric delta shear type (Type: 4371) to be real-looking as shown in Figure 6. The advantages of using piezoelectric accelerometers over other types of accelerometers are a broad frequency range, good linearity in dynamic applications and performance in a wider range of environmental conditions, and the ability of data to be integrated. The output signal appearing on the oscilloscope screen is analyzed by the MATLAB program to solve the equation of velocity C(t), is as shown in Equation (3). The data obtained from an oscilloscope represented the changing velocity with time (acceleration). The value of velocity is calculated through integration the equation of acceleration a(t) as shown in Equation (3a).
where PEnergy is potential energy and KEnergy is kinetic energy.
The use of PE in this test allowed access to important data, such as the distribution of power, peak force, duration, and the energy required to activate the crack and its propagation as shown in Equation (3b). More information on using piezoelectric accelerometers has been reported previously [62,63].
To indicate the effect of aluminum particles and milled fibers in the toughness impact of epoxy matrix as a composite material, authors in [64] needed a piezoelectric accelerometer with 1.008 PC/m s−2 sensitivity (Bruel and Kjaer 4371, Denmark) to complete his tester device [pendulum machine H.20 (Tensometer Ltd., Croydon, UK)]. An acceleration/time curve that was produced from a piezoelectric accelerometer was used. A force/time curve can be plotted to evaluate the absorbed energy that refers to the strength of impact for this composite material.
2.5. Longitudinal Velocity of Sound
Longitudinal waves in materials refer to the particles of the material that are moving in the same or maybe opposite in direction with respect to the exciting vibration wave, such as a compression wave. The popular expression of longitudinal wave velocity v(CL) is where λ is the wavelength and f is the frequency or w⁄k where w is the angular frequency and k is the propagation constant.
Considering that PE is often used as a generator of sonic and ultrasonic waves, many researchers have attempted to study the longitudinal velocity of sound in PE itself. Authors in [65] studied the effect of many different variables, such as thickness (t), volume percentage, density (ρ), and the modulus of elasticity (E), on the longitudinal velocity of sound (CL) for ceramic materials with PE (1 MHz to 10 MHz). Lead zirconate titanate Pb[ZrxTi1-x]O3 (PZT ) using the formula where Et, as an elastic modulus, was regarded as a function of volume fraction of PZT. This function was calculated by [66,67], who found the relationship between the volume percentage of PZT and the longitudinal velocity of sound as an inverse relationship.
Then, authors in [68] studied the effect of lateral dimensions of un-poled and poled PZT-5H ceramics (15 MHz) and the longitudinal velocity of sound was generated from it. The same result was obtained (an inverse relationship between the dimensions of PE and the longitudinal velocity generated from it) in which the transducer’s diameter (un-poled and poled PZT-5H) increased to 14%, and the longitudinal velocity of sound will increase to 1.4% and 0.9% respectively. In the same context, authors in [69] used picoseconds in ultrasonic devices to calculate the longitudinal velocity in PE (111) epilayers of InxGa(1-x)As.
As a sensor, authors in [70] utilized a 300 kHz PE to calculate the longitudinal velocity for the following samples: polycrystalline metals (Al and Cu), single-crystalline alkali-halides (LiF and KCl), poly-crystalline Al2O3, fused silica (SiO2), and an invar alloy. The samples were square-shaped plates with a common dimension of approximately 40 mm × 40 mm × 10 mm except for Cu, which was 35 mm × 35 mm × 10 mm.
To evaluate the velocity of sound in the single crystal YBazCu307 under the effect of temperature change, the authors in [71] needed a PE as a generator of short 10 ns to 20 ns pulses of ultrasonic waves (500 MHz bandwidth).
The relationship between the relative velocity ∆v/v of sound in a single crystal YBazCu307 to temperature is non-linear. Also, an inverse relationship was found. authors in [72] found a positive relationship between longitudinal and transverse velocity with temperature. The experiment was performed using two PEs, one as an emitter transducer and another as a receiver, for sending and receiving ultrasonic pulse waves (405 kHz), on silica aerogels 10-cm wide where, aerogels undoubtedly come under a class of fascinating materials having high porosity, low density, low thermal conductivity, large surface area, transparency in the visible range, and many more peculiar properties for scientific and industrial uses [68]. They succeeded obtaining a longitudinal wave by cutting piezoelectric crystal in the x-direction, and then they obtained a transverse wave by cutting piezoelectric crystals in the y-direction. In addition, they illustrated a behavior of longitudinal and transfer waves with a different molar ratio of silica aerogels, where, silica aerogels was a function of molar ratios of tetramethoxysilane (TMOS) precursor, ammonia (NH4OH) catalyst, methanol (MeOH) solvent, and water, as shown in Figure 7.
Authors in [73,74] studied an air-coupling technique to explain the effect of velocities of transferred longitudinal waves on different samples of paper as shown in Figure 8. These paper samples involved differences in density from 80 g/m3 to 300 g/m3 and difference in magnitudes of angles for the paper (angle of inclination of the paper). Two pairs of specially designed air-coupled piezoelectric transducers were used as emitters and receivers. The center frequency was 0.9 MHz for one pair and 1.7 MHz for the other. The active elements were 1 to 3 piezocomposite disks made by the dice and filling technique (PZ-26, Ferroperm and Araldite-D), which were 2-mm thick for the 0.9 MHz transducers and 1 mm thick for the 1.7 MHz transducers.
Using the same technique (air coupled), authors in [75] PE 750 kHz to show a good match between the theoretical calculations and the experimental results of the longitudinal behavior of the waves for the following materials(1) copper sheets with 0.35 mm width and 0.45 mm thickness (2) 0.1 mm width and 0.5 mm thickness, and finally (3) CW508L copper with width 0.0762 mm and thickness of 0.381 mm).
PE with a resonance frequency of 7 MHz was employed by [76] as a transducer to investigate and measure the longitudinal sound waves in liquid and selenium. The authors in [77] succeeded to replace the disturbance force effects on a steel square plate (19 mm × 19 mm × 305 mm) by a PE with a center frequency of 2.2 MHz and attached it by using cyanoacrylate adhesive to create longitudinal sound waves. The transducer was driven by a five-cycle windowed sinusoid voltage waveform [78] where the used pulses generator in [76] was arbitrary. Waveform generatorscan produce waves of any shape such as the function in Equation (4). They noted the first arrival of the wave at 52.6 μs, and this corresponded to the group velocity of sound in the steel (5.8 km/s). Equation (4) represents two sine waves multiplied together with the deference phase angle for producing modulated waves (Ton berst wave).
The authors in [79] used longitudinal velocity, which was measured by utilizing two pieces of PE (one as an emitter and the other as a sensor) for a set of various Fe4Sb12 and Co4Sb12-based skutterudites filled by mischmetal, didymium, or alkaline earths (Ca, Sr, and Ba) in order to calculate some of the mechanical properties which are: modulus of elasticity, transfer velocity, shear modulus of elasticity, bulk modulus, and Poisson’s ratio for the above materials, where time-of-flight sound pulse measurements were performed on cylinders (height = 10 mm, diameter = 10 mm) with a frequency of 10 MHz were also measured.
Recently, many researchers have considered piezoelectric shunt damping techniques as a renewable technology in this field, where the periodic arrays of shunted piezoelectric patches are utilized to control the wave host plate. The tunable characteristics that belong to shunted piezo-patches allow the band gaps to be tuned over desired frequency ranges. The authors in [80] used this technology to explain the mechanism of resonant piezoelectric shunt scan to be tuned over desired frequency ranges. They achieved this aim by bonding squire-shunted piezo-patches with frequencies ranging from (1 kHz to 1.6 kHz), dimensions 40 mm × 40 mm × 0.2 mm) to a plat made of epoxy (Young’s modulus of 4.35 × 10⁹ N/m2, Poisson’s ratio of 0.37 and density of 1.18 × 10³ kg/m3) with dimensions of 80 mm × 80 mm × 5 mm. This study describes how resonant piezoelectric shunts can be used to affect the equivalent mechanical characteristics of an elastic waveguide and suggests their application for enhancing the tunable band gaps.
2.6. Modulus of Elasticity
In mechanical applications, the modulus of elasticity (E) of material is a measure of its stiffness. E is considered as an important material property. The famous rule for this factor is , where σ is stress and ϵis strain. The tensile test is regarded as a classic method. To measure E for non-traditional specimens, non-traditional methods are needed.
PE was used as an electric force measurement system (sensor, nominal range 0 N to 50 N). This PE was put just below the central bending point of the specimens (length = 70 mm, width = 4.021 mm to 4.2 mm, and thickness = 0.1 mm to 0.25 mm) to measure E for magnetron-sputtered thin films of different materials (C, W, W(C), Cr, TIN) with different thicknesses [81].
Two pairs of PEs were used with each pair three pieces of PE, type (air-transducers KG100-0.25, KG100-0.5, and KG100-1 with center frequencies of 250 kHz, 500 kHz, and 1 MHz)in the system shown Figure 8 [82]. This approach was used to detect E based on the relationship for 13 types of test paper made of different materials with thicknesses ranging from 60 µm to 700 µm. The term was considered as a function of velocity (c). Then, they detected the term ( from the method, as explained in the air-coupling technique discussed in Section 2.5. This method was explained in detail previously [83].
The most popular method in acoustic tests for the material properties test is the method of calculation of the time of flight of the wave (TOF). Several studies have been dependent on the TOF method, which depends on conversion formulas of elastic module for homogeneous materials as shown in Equation (5):
where ETOF is in MPa, ρ is in kg/m3, Cs is the acoustic shear wave velocity in m/s, ν is the Poisson’s ratio and CL is the longitudinal wave velocity. Many published studies used acoustic tests and regarded the two factors ETOF and E is the same factor (no difference between them), and mentioned them as the modulus of elasticity (E); for example, Osamura et al. [84] estimated ETOF for. Bismuth strontium calcium copper oxide (BSCCO) tapes and regarded ETOF is the same with E, Vendra and Rabiei [85] evaluated the ETOF for composite metal foams by experimental and numerical techniques without mention of this difference, in the same contract Diaz et al. [86] estimated ETOF and regarded it E for plastics and wood plastic composites using a Taber stiffness tester.Genga et al. [87] studied the effect of Mo2C additions on the properties of spark plasma sintering (SPS) manufactured WC–TiC–Ni cemented carbides without mention to this difference too.
To study the relationship of E with hydrostatic pressure (HP) and moisture content (µ), the same relationship (Equation (5)) was used to calculate E for a bulk of cereal grains [88]. The initial state of the cylindrical sample was a length of 150 mm and a diameter of 70 mm in (for five levels of moisture 10%, 12.5%, 15%, 17.5%, and 20%). To achieve this relationship, a magnitude of ν was taken from a Polish standard. Then, a PE was used as an emitter and receiver of acoustic shear waves (Cs) (1 KHz) as shown in Figure 9. The values of Cs were measured for each increasing of magnitude of HP. These values of ν and Cs were employed to complete the Equation (5) requirements in order to calculate the value of E. The positive relationship between E and Hp was found, but the relationship between E and µ was negative.
To generate a longitudinal wave in a tree trunk has dimensions (1.2 m × 50 mm × 50 mm), the authors in [89] made a hole in the tree trunk to insert PE in order to study the relationship between E with the longitudinal wave. This study proved a positive relationship between these two parameters.
Authors in [90] calculated the E for different types of granite according to another formula: where T is a factor depending on the relative specimen dimensions, L is specimen length, Fl is a resonance frequency in Hz, and ρ is the density of granite. To achieve the conditions of this equation, an Erudite MK3 test system (CNS Farnell) was used. This device worked in the range 1 kHz to 100 kHz to receive an optimization for the acoustic technique depending on the measure of the essential mode for the longitudinal wave resonance frequency. This measure was based on the use of PE as a receiver of the vibrational longitudinal wave that was changed to a voltage wave and then emitted to Erudite MK3.
As indicated in Section 2.3, authors in [52] declared that “the tangent of the curve in the plateau of the elastic rebound after impact is proportional to the size of dynamic elastic modulus of indentation”, as shown in Figure 5b. A general technique as was described previously in [52] and the traditional technique in [91] have been recently regarded as techniques in finding E and ν.
Arshed et al. [92,93] noted that there is a big difference between the standard values of E, according to ASTM from one side, and the values of E calculated from TOF tests, for a group of metals which are the refractory metals, from another side. To address this issue, Refs. [92,93] provided a new relationship between pressure transmission coefficient (PTC) and E × ρ of the test specimen (TS) as shown in Equations (6)–(8) to calculate E for refractory and non-refractory metals:
The following equations were derived:
The Equation (8a) can be used for the solid materials that have an acoustic impedance (ZTS) equals or less than 51 × 106 kg/m2 s (ZTS ≥ 51 × 106 kg/m2 s). The Equation (8b) is used for the materialshave values ofZTSwithin range of 51 × 106 ≤ ZTS ≤ 29 × 106 kg/m2 s:
While for values of ZTS are around ZTS ≤ 29 × 106 kg/m2 the equation is
According [92,93], the set of Equation (8) depends on the value of PTC only to find the value of E where, ρ is already known. PTC is based on the calculation of ZTS as shown in Equation (7) and this ZTS is equals to ρ × CL as shown in Equation (6). Therefore, the calculation of E according to the method proposed by [93] depends on measuring CL only, while the TOF method needs measuring two types of waves (CL and CS) to calculation E as shown in Equation (5), where . Figure 10 illustrates the difference between the proposed method by Arshed et al. and the TOF method represented by one of the OLYMPUS company products, 38DL PLUS, that uses this technique.
2.7. Poisson’s Ratio
In most studies, ν is associated to E. Poisson’s ratio is the ratio between a strain perpendicular to the load axis and a strain that occurs with the load axis. Authors in [95] utilized a PE with 0.5 MHz, and [96] also utilized it as an emitter and a sensor in the TOF method by measuring the longitudinal and transverse velocities of the wave to calculate ν and several properties of materials for cement paste, mortar, and rock.
Authors in [97,98] succeeded in measuring ν, E, and tensile strength for polysilicon by using PE as a motion generator to the load cell (4.5 N) and the linear air bearing. The advantage of using the air bearing is the absence of friction, which is shown in Figure 11. The motion of PE was controlled by a laboratory computer. This motion system was used to generate strain in a polysilicon specimen. The specimen strain was measured using an interferometric strain/displacement gage.
To determine ν and E for a thin film of fused silica and TiN/NbN, the authors in [99] developed the contact area technique using an acoustic microscope to measure surface elastic properties quantitatively. They needed a piezoelectric thin-film transducer in a pulse-echo acoustic microscope, which was used in this work, to generate an ultrasonic wave that is focused by a hemispherical sapphire lens. The focused wave passes through a coupling fluid, usually water, and interacts with the sample surface, producing bulk shear and longitudinal waves as well as a surface wave. These waves were used in the contact area technique to calculate ν and E.
The flexibility to use a thin film of PE associated with the ability of generating deference types of waves, cannot be found in other smart materials except PE. The authors in [100] preferred to utilize piezo-spectroscopy to measure the stress and strain to calculate ν in aluminum-alumina.
The authors in [101] measured the ν and E for a thin golden film using a micro tensile testing unit. This unit consisted of a piezoelectric actuator, as a load cell, a microscope, and two CCD cameras. After the results were obtained from the tensile test unit, the results were compared with those from the visual image tracing (VIT). The results were in good agreement.
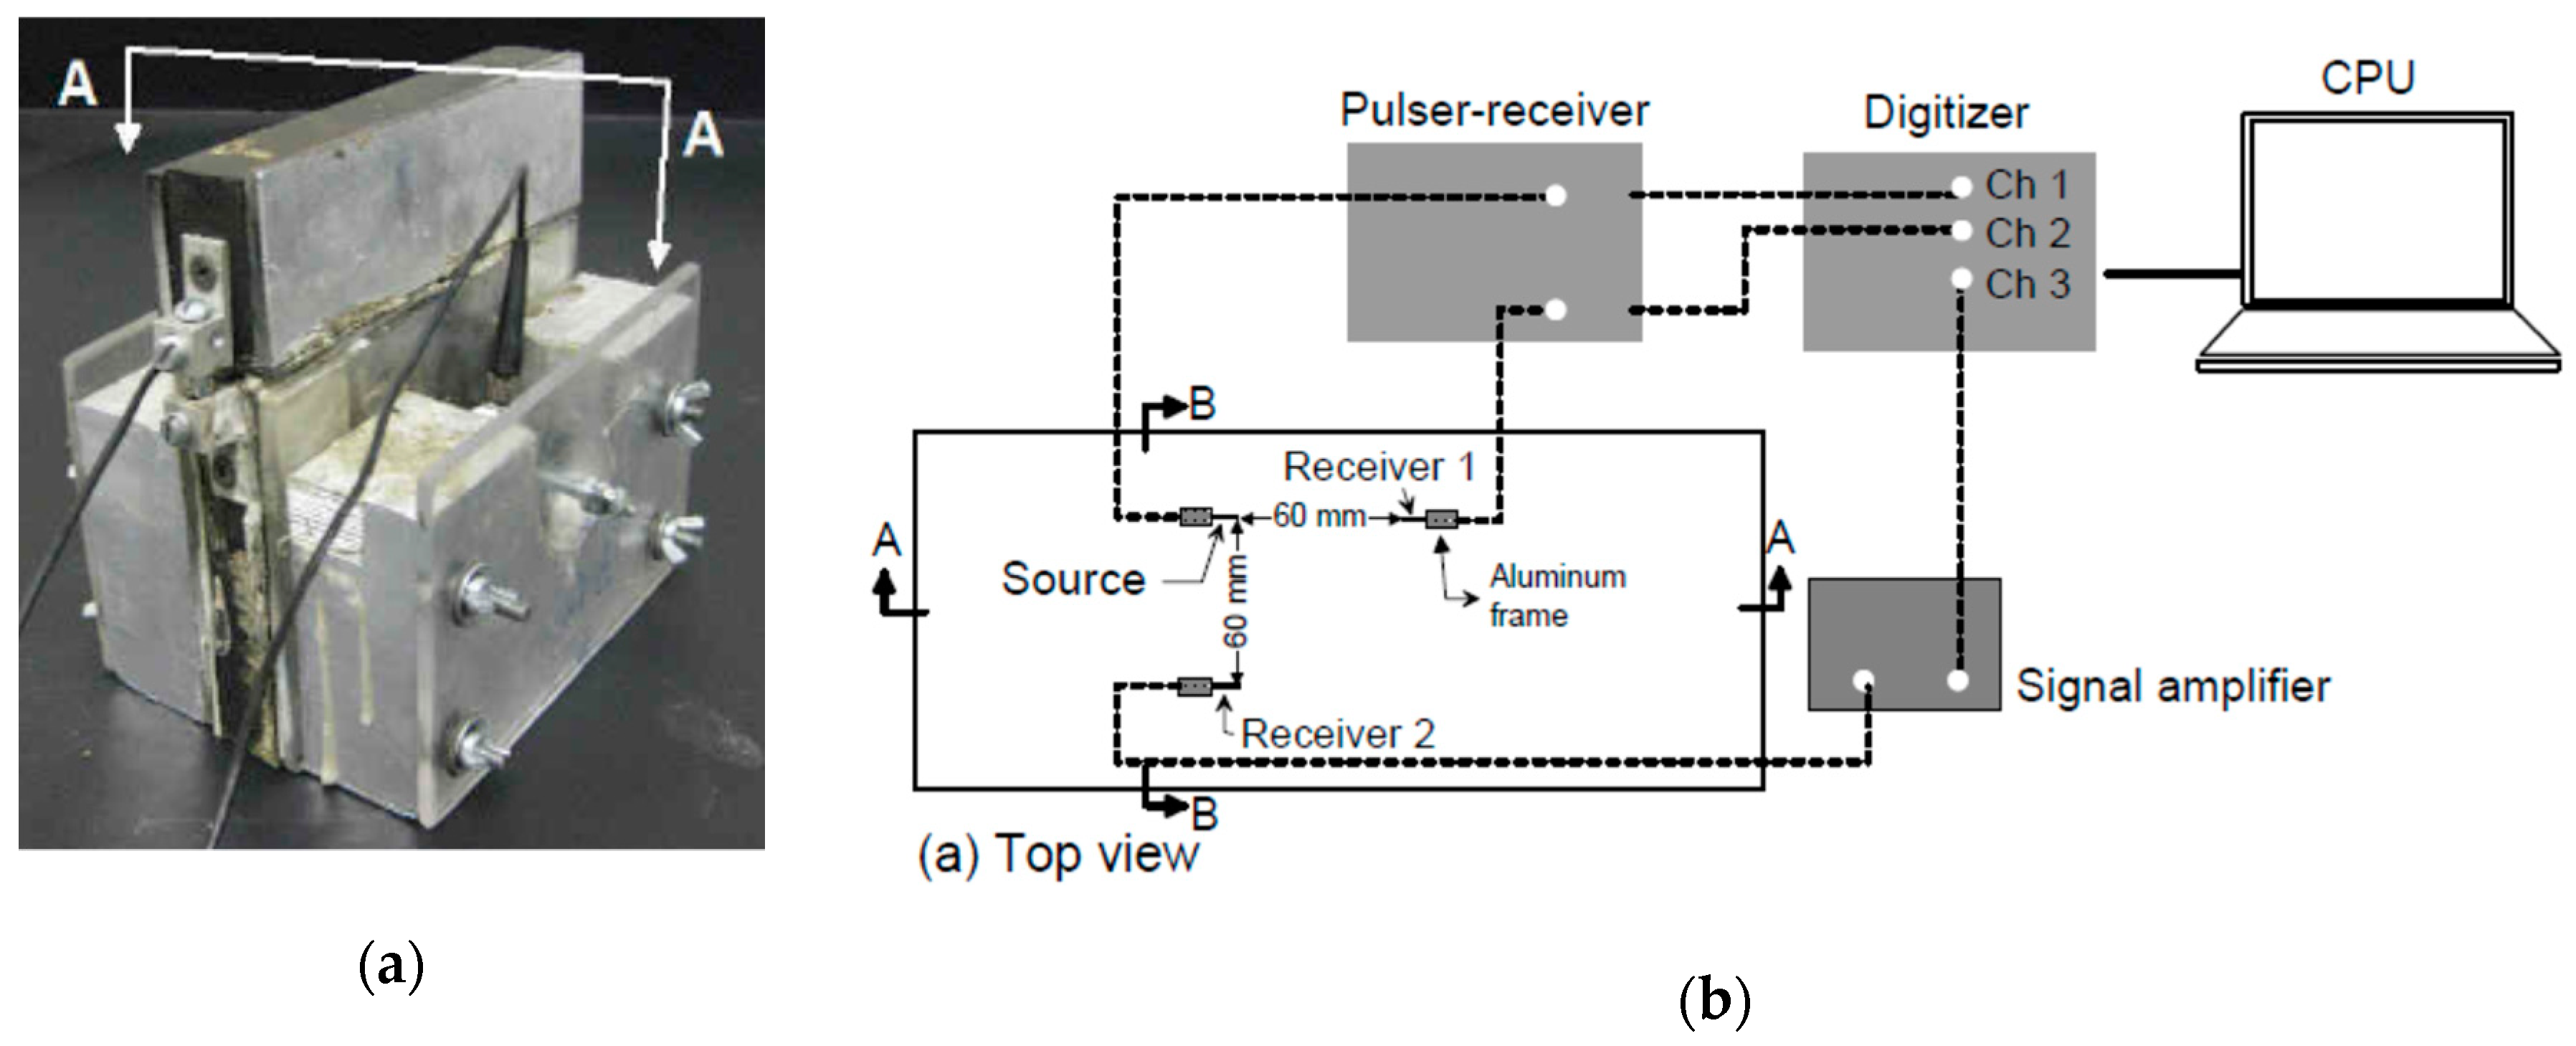
To evaluate the ν and shear E for a concrete specimen, the authors in [102] used three pieces of PE (piezo-blender element), one as sender (500 kHz) and two pieces as receivers. The first receiver was in front of the actuator to detect the CL and the other was beside it to detect the CS as shown in Figure 12a,b. Then, the velocities of these two types of waves were calculated using B-scan images. Poisson’s ratio was calculated from the equation below:
2.8. Shear Modulus of Elasticity
For materials subjected to shear force, an important parameter that must be taken into account is the shear modulus of elasticity, which is defined as the ratio between shear stress to shear strain. Instead of using direct shear forces to excite the three samples of granular materials (Fontainebleau sand, first and second class of natural alluvial deposits of the Seine River) to measure the shear modulus of elasticity (Gw), refs. [103,104] used a PE (bender elements) to generate and receive a shear wave. Moreover, they calculated the propagation time tw (the time that the wave took to pass through the sand specimens) by recording the input and output electric signal on an oscilloscope. The equations below were used to calculate the shear modulus where Lw is the length between the tips of the bender elements and m is the unit mass of the materials.
Then, the authors in [105] used PE as an emitter (1 and 10 MHz) and receiver of a shear wave but it was placed at opposite corners in the cubic and cylindrical specimens with the length of an isotropic cube side or cylinder height L1 (10.1 mm brass cube of mass 8.175 g). This procedure was performed for many reasons, such as to provide a weak elastic couple (torsional couple) on the piezoelectric pieces and for minimum parasitic damping. Resonant ultrasound spectroscopy was also employed, which involved scanning the resonance structure (γ) for a compact specimen and then by using Equation (9) the shear modulus was calculated:
The authors in [106] utilized PE(LiNbO3) to generate a wave from 300 kHz to 1 MHz with the Curie temperature at 1200 °Cto calculate Gw for metallic glass under this condition equation.
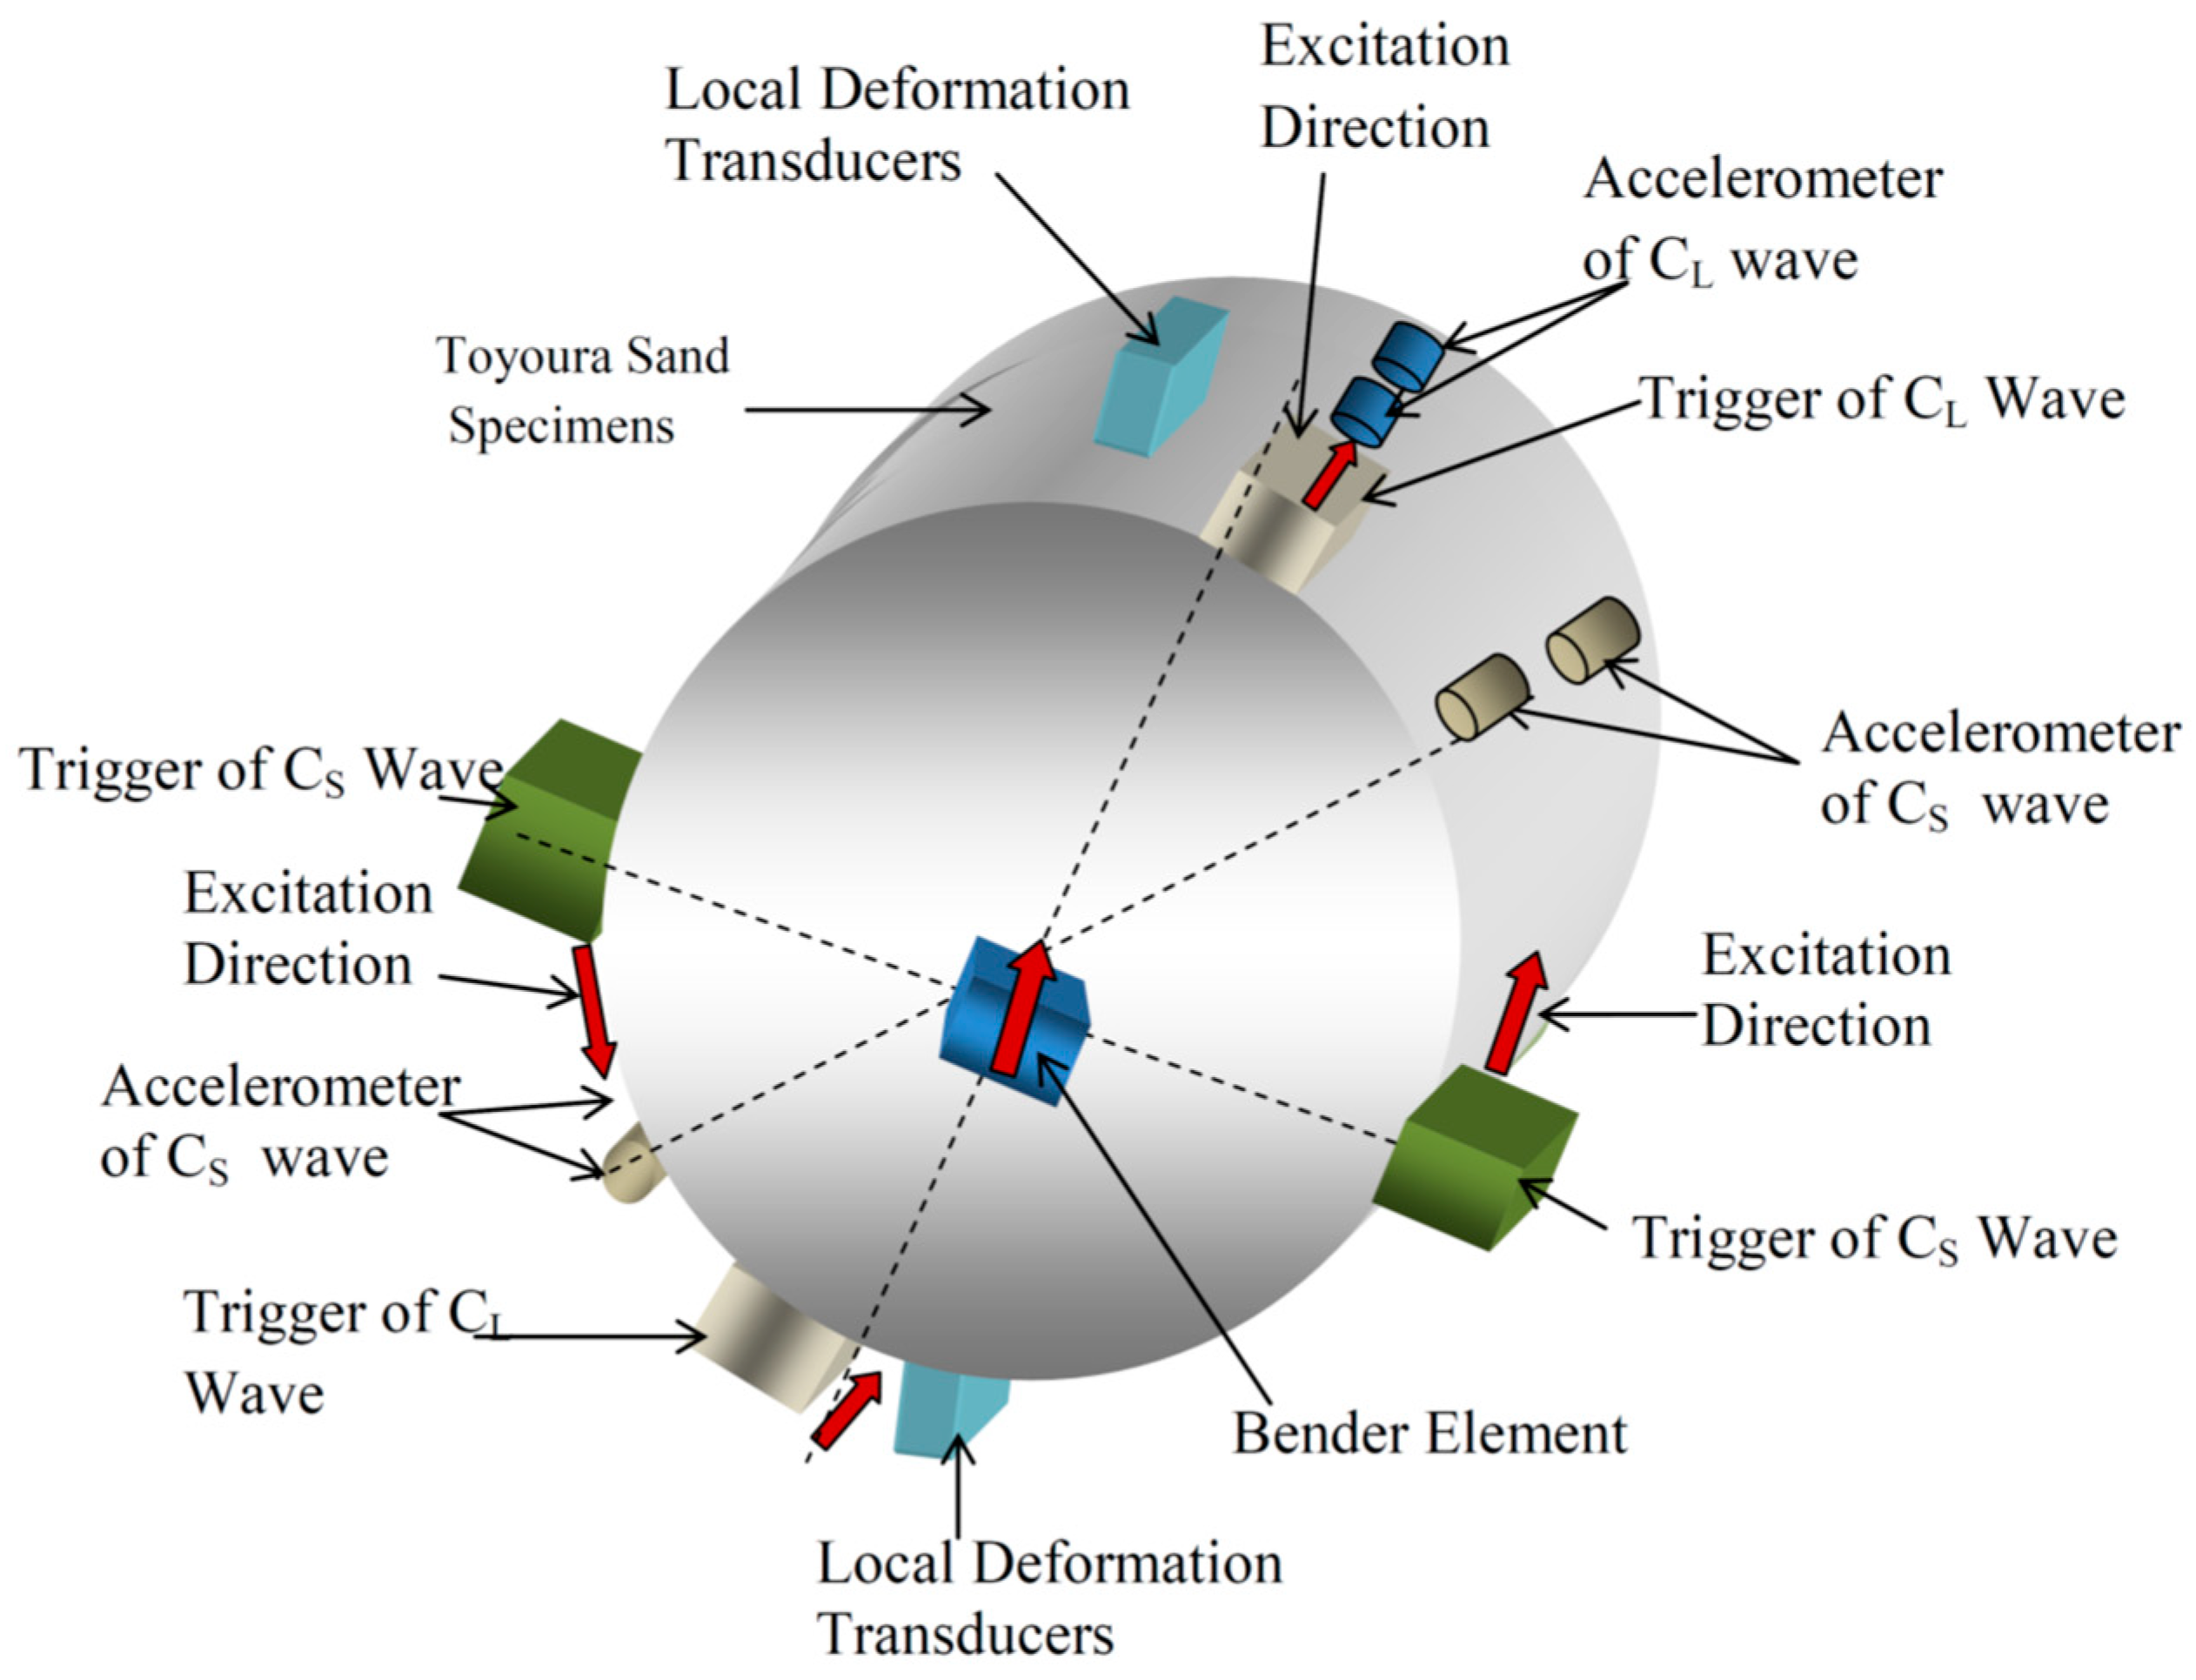
An interesting study was conducted by [107,108] to study the difference between the static and dynamic factors. Two couples of piezoelectric transducers were used as an actuator, which required a trigger with dimensions of 10 mm × 10 mm × 20 mm and an actual frequency of 69 kHz to generate a compressive wave (longitudinal wave (CL)) and shear waves CS. Three couples of piezoelectric transducers were used as a cylindrical accelerometer of 60 kHz with a diameter of 3.6 mm and a thickness of 3 mm to receive these waves. Two small piezoelectric-type bender elements was fixed first at the top of the cylindrical specimen (Toyoura sand, 5 cm in diameter and 10 cm in thickness), as shown in Figure 13, and the other at the bottom. The equation was considered as the equation of dynamic modulus of elasticity and as the equation of dynamic shear modulus of elasticity. For shear modulus, the results were in good agreement with the results from those that used CL and CS waves. However, for the dynamic modulus of elasticity, the results revealed a large difference between the dynamic and static values and the difference increased with increasing specimen density. Using the similar technique, the authors in [109] utilized three plate transducers of 3.9, 7.8, and 15.9 kHz to calculate GD from the equation for a soil.
The authors in [2] reported using torsional resonant frequencies as a recent technique in this field to measure shear modulus for isotropic bars.
where fr is the fundamental frequency of torsional resonance. PE has been used as an actuator (electro-mechanic) driver to excite both flexural and torsional vibrations in isotropic bars [110,111,112].
2.9. Tensile Strength
The tensile strength of a material is its ability to bear tensile load before failure. As a mathematical concept, it is the ratio between the greatest tensile forces allowed (before destruction) to the cross section area of a specimen. Most of the users of PE in this type of test have used it as a sensor. Among the first who used PE as a pressure sensor in a tensile test was [113,114] for a specimen with dimensions 1.5 cm × 0.5 cm.
Authors in [115] employed eight PEs (Physical Acoustics model S9225) with frequencies ranging from 0.1 MHz to 2 MHz to calculate the tensile strength of a rock of quasi-brittle material with size (span × height) of approximately 800 mm × 300 mm and 400 mm × 150 mm for the granite and 900 mm × 300 mm for the sandstone and 200 mm × 75 mm for the granite and sandstone.
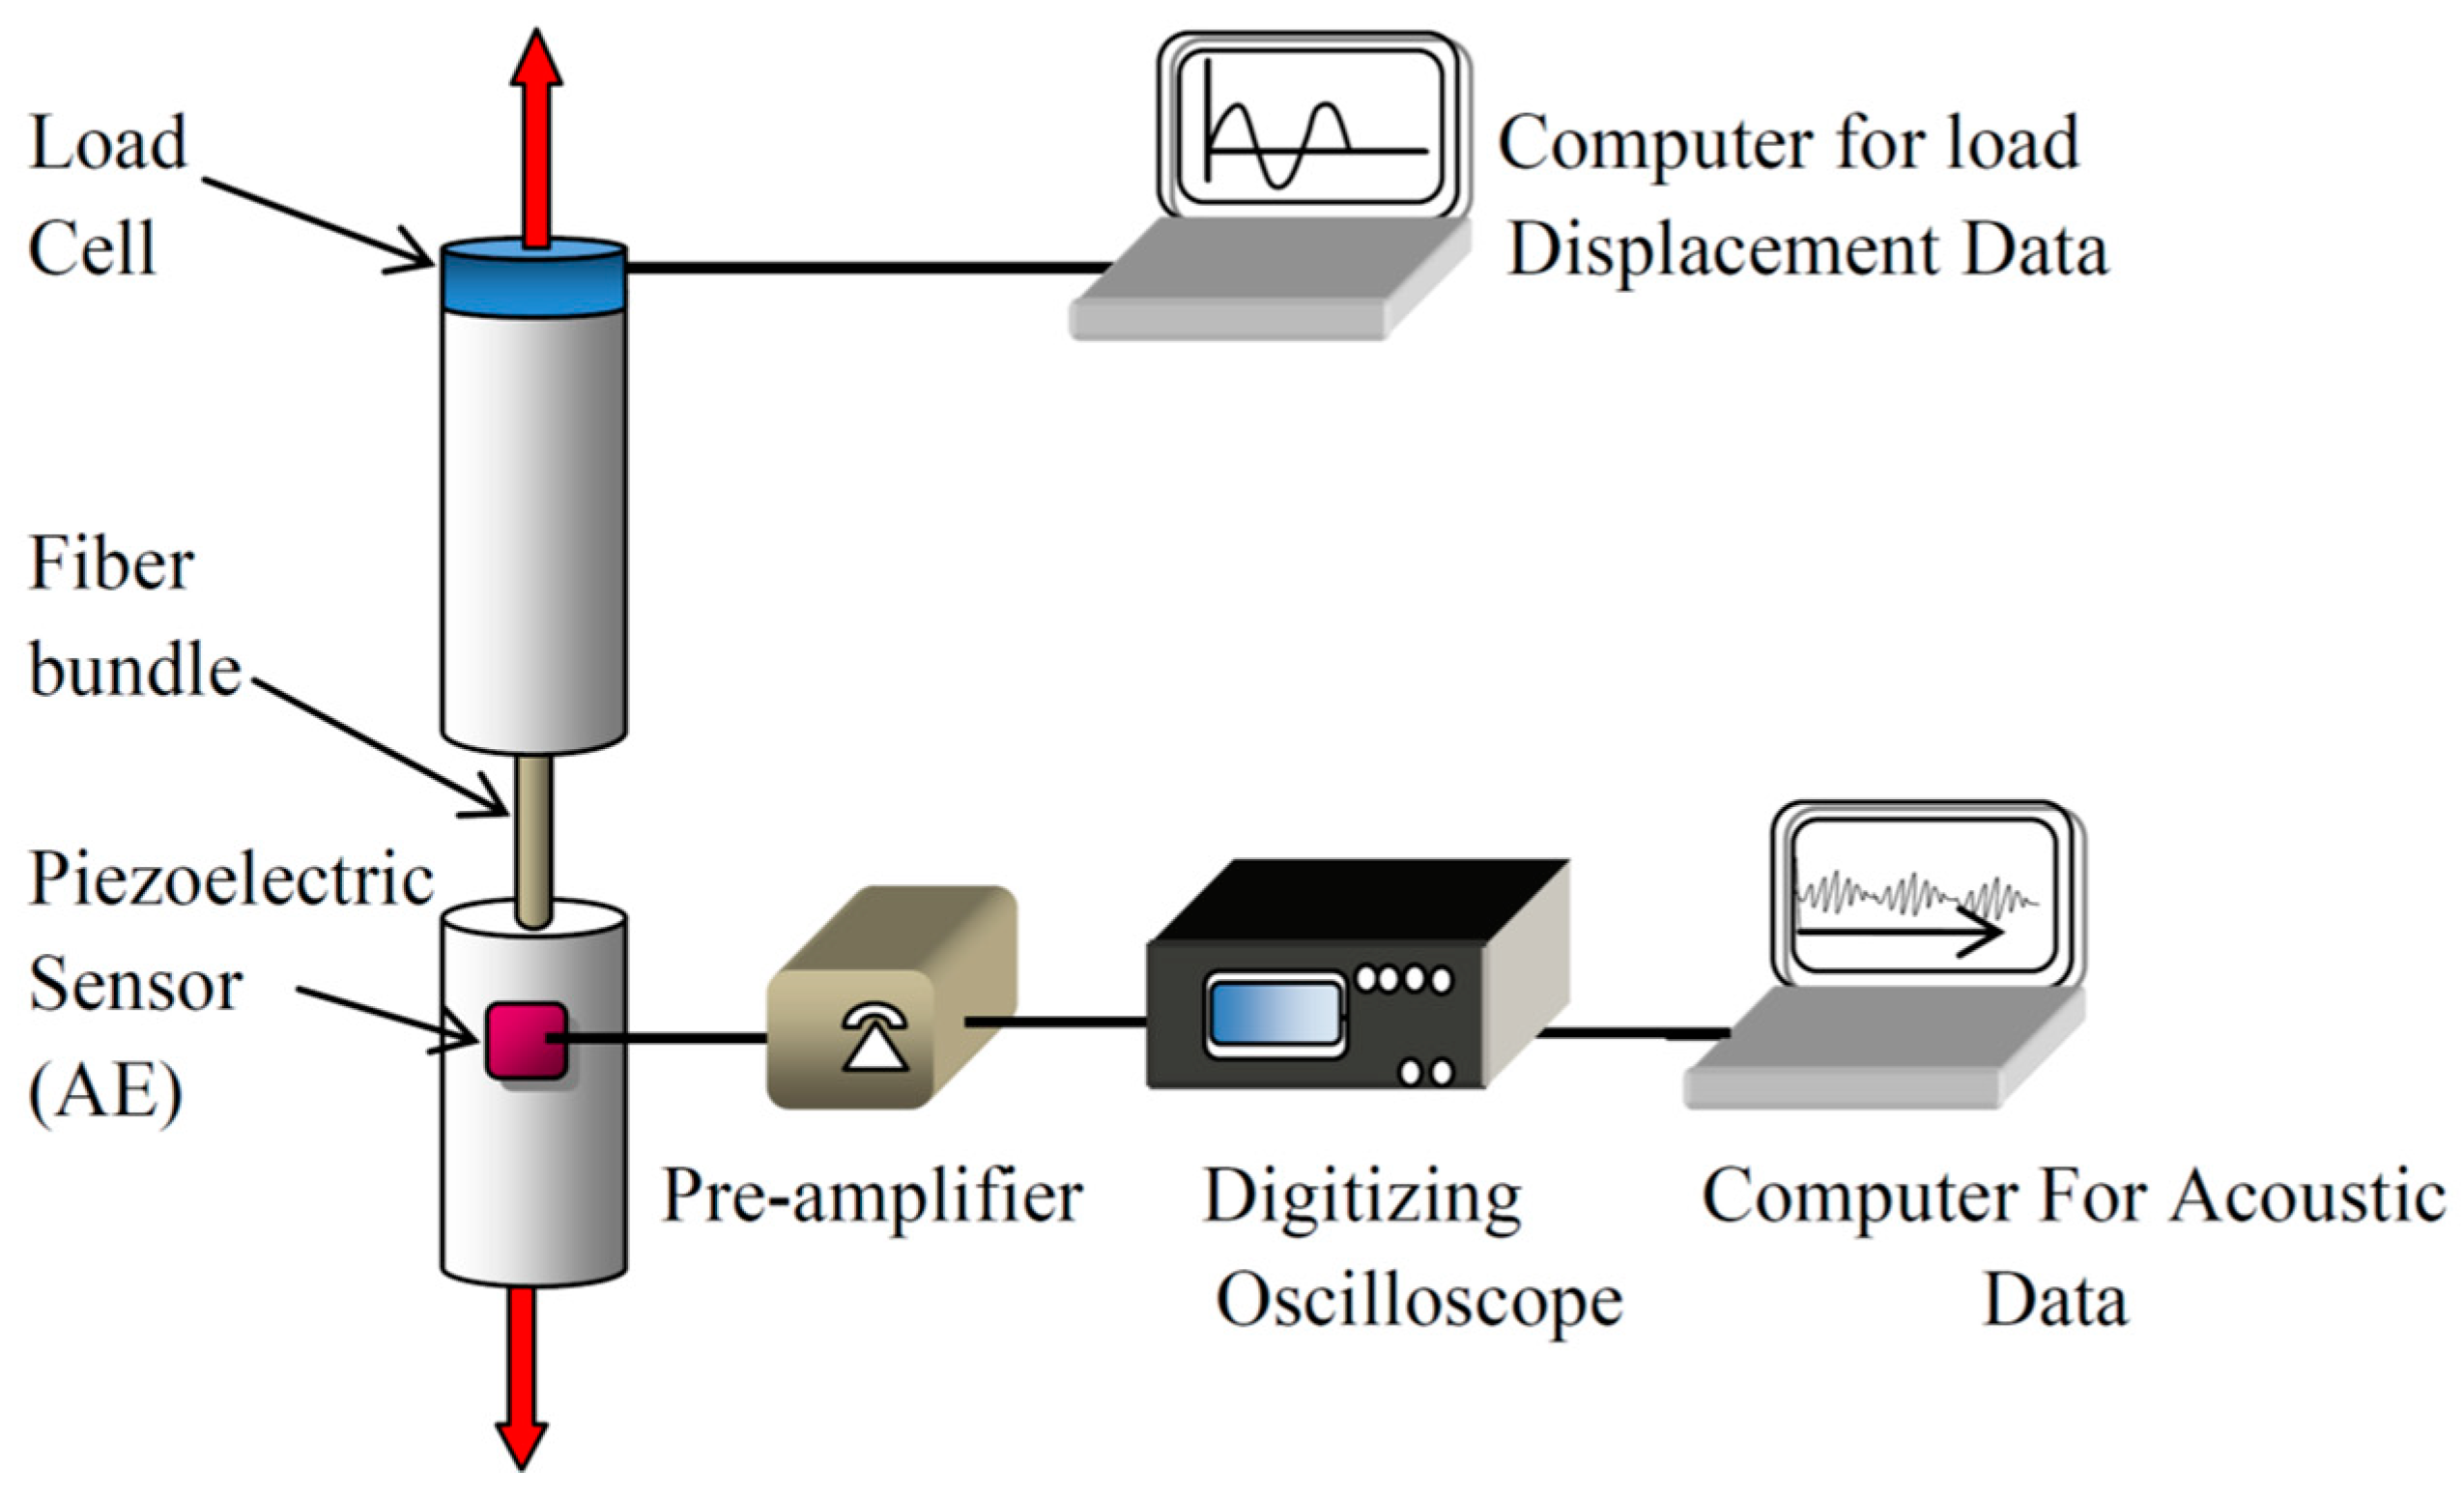
A 150 kHz acoustic emission was also used by [116] as a detector to determine the strength of glass-fibre bundles or as a sensor for energy produced from a fibre fracture during the tension process, as shown in Figure 14.
PE was used in a tensile setting, and the authors in [117] measured the tensile strength of a piezoelectric specimen made of PZT (150) kHz fibre-epoxy with dimensions of 25 mm × 50 mm composites and explained the strong effect of matrix material on the tensile strength of PE.
The authors in [118] placed two PEs as an emitter and receiver with an operating frequency range of 200 kHz to 750 kHz. The relationship between the tensile stress and acoustic wave velocity (acoustoelectric calibration test) was measured in a case of loading and unloading for seven-wire steel strands (T15.7), which had the following dimensions: core wire diameter of 5.4 mm, helical wire diameter of 5.22 mm, and strand diameter of 5.7 mm. The results of this research revealed an induced positive relationship between an increase in transit wave velocity (through this type of wire) and an increase in the stress percentage in it.
The authors in [119] used a piezoelectric sensor with a frequency range of 1 kHz to 1.5 MHz to evaluate the tensile strength of epoxy-impregnated Kevlar® 49 composites (25 mm × 1.4 mm × 1.1 mm). PE was used as a load washer (load sensor with 33 kHz) to measure the tensile strength of sisal fibre cement composites (152.4 mm × 25.4 × 12 mm) [120].
3. Statistical Study and Discussion
There are several points worthy of discussion raised in this research: One is the rapid increase in utilizing PE for determining the proprieties of solid materials, as shown in Figure 15. Another is the pulse echo technique that has acquired the largest share in using this type of testing, as well as the attention of researchers in the use of PZT as a material of PT.
The frequency ranges of dual-use PEs (emitter and receiver) including specimen dimensions are listed in Table 2.
Another classification for PE according to the type of application and range of frequency is shown in Table 3.
Another category based on material type is shown in Table 4.
4. Conclusions
Many corporations and factories need PE in finding the mechanical properties of solid materials especially when the purchase orders of their needed materials have non-uniform shapes or long specimens such as long shafts or wide and thick plates where long or wide materials cannot be tested within the tensile test devices. In addition, the need it to lower the costs of these types of test which are mostly non-destructive. A number of impressions can be gained from this review. A quick in-depth analysis on all the research that has been reviewed in the art of using piezoelectric elements in finding the mechanical properties of solid materials, which amounted to 121 studies, reveals that the PE frequencies in this kind of tests did not exceed 15 MHz and most of the research used PE frequencies less than 500 kHz. In addition, most of the dimensions of the samples that were used did not exceed 100 mm. In addition, in this review three tables were classified based on the range of PE frequencies for each test, type of test such as impact tests, toughness tests, etc. and classification of tests according to material properties.
On the other hand, many technical advantages in using PEs can be concluded, as follows:
- Most of the ultrasonic creep tests have preferred of using PVDF because it can sense: (a) the low and high vibrations; (b) the slight changes in stress for more than 10 years and 100 million pressure cycles; (c) and can be used in a wide temperature range (−40 °C to +160 °C).
- PE can eliminate any inertia effects associated with the higher velocity; therefore, many applications focus on using the PEs as a load cell, instead of any type of actuators, in quasi-static dynamic fracture toughness tests.
- PE could be used as a strain gage to obtain real-time information such as force-versus-time behavior for the material and the magnitude of peak force, which Charpy and Izod cannot provide us in impact tests.
- The advantages of using piezoelectric accelerometers over other types of accelerometers in impact tests are the broad frequency range, good linearity in dynamic applications and performance in a wider range of environmental conditions, and the ability of data to be integrated.
- There is an inverse relationship between the dimensions of PE and the longitudinal velocity generated from it.
- The resonant piezoelectric shunts can be used to affect the equivalent mechanical characteristics of an elastic waveguide and suggests their application for enhancing the tunable band gaps.
- Tests of the shear modulus of elasticity, putting the PEs at the opposite corners for specimens that have cube shapes or at opposite edges for the short cylinders, show (a) weakness in elastically coupling for the piezoelectric transducers (b) reducing the perturbation of the vibration (c) minimal shift in resonant frequency, and finally (d) minimum parasitic damping. The main challenge of the use of PE in finding mechanical properties are that these tests do not include all mechanical properties such as yield stresses, ultimate tensile stress, and melting point etc. In addition, there are some of difference in results, for some of the special materials such as radiation materials, between the result coming from these tests (PE tests) from one side, and from traditional tests from the other side. Therefore, these tests need more study and research.
5. Recommendations
- Study using PE in finding other properties of materials such as yield stress, tensile strength and melting point.
- Study using PE in finding the materials properties in high temperature.
Author Contributions
S.M.H. proposed the idea of this work, then check the final work; A.A.M. collected the data; M.Z.N. analyzed the data.
Funding
Research received no external funding.
Conflicts of Interest
The authors declare no conflict of interest.
References
- Weifang Jude Electronic Co., Ltd. The Piezoelectric Effect in Ceramic Materials. Available online: http://www.pztceramics.com/The-piezoelectric-effect-in-ceramic-materials-id508854.html (accessed on 15 March 2017).
- Ussef, H.; Uhlemeyer, R.; Nch, R. Development of an Apparatus for Static and Dynamic Creep Testing of Ice and Frozen Soils. Available online: http://www.docstoc.com/docs/72471918/Development-of-an-apparatus-for-static-and-dynamic-creep-testing (accessed on 21 September 2018).
- Vinogradov, A.M. Creep-Fatigue Interaction in Polymers. Rubber. Chem. Technol. 1994, 1–6. [Google Scholar]
- Shirinov, A.V.; Schomburg, W.K. Pressure sensor from a PVDF film. Sens. Actuators A Phys. 2008, 142, 48–55. [Google Scholar] [CrossRef]
- Seminara, L.; Capurro, M.; Cirillo, P.; Cannata, G.; Valle, M. Electromechanical characterization of piezoelectric PVDF polymer films for tactile sensors in robotics applications. Sens. Actuators A Phys. 2011, 169, 49–58. [Google Scholar] [CrossRef]
- Vinogradov, A.M.; Hugo Schmidt, V.; Tuthill, G.F.; Bohannan, G.W. Damping and electromechanical energy losses in the piezoelectric polymer PVDF. Mech. Mater. 2004, 36, 1007–1016. [Google Scholar] [CrossRef]
- Seminara, L.; Valle, M.; Capurro, M.; Cirillo, P.; Cannata, G. Piezoelectric polymer films for tactile sensors. In Sensors and Microsystems; D’Amico, A., Di Natale, C., Mosiello, L., Zappa, G., Eds.; Springer: Boston, MA, USA, 2012; Volume 109, pp. 169–173. [Google Scholar]
- Gyekenyesi, A.L.; Kautz, H.E.; Shannon, R.E. Quantifying creep damage in a metallic alloy using acousto-ultrasonics. J. Mater. Eng. Perform. 2002, 11, 205–210. [Google Scholar] [CrossRef]
- Ueno, K.; Nagakawa, J.; Murase, Y.; Yamamoto, N. Effect of cold work on the irradiation creep of SUS 316L. J. Nucl. Mater. 2004, 329, 602–606. [Google Scholar] [CrossRef]
- Ann, H.K.; Kim, C.S.; Shin, Y.H.; Jeon, Y.C.; Park, I.K. Nondestructive evaluation of the creep damaged Ni-based superalloy using ultrasonic wave method. In Proceedings of the Asia-Pacific Conference on NDT, Auckland, New Zealand, 5–10 November 2006. [Google Scholar]
- Rosti, J.; Koivisto, J.; Traversa, P.; Illa, X.; Grasso, J.-R.; Alava, M.J. Line creep in paper peeling. Int. J. Fract. 2008, 151, 281–297. [Google Scholar] [CrossRef]
- Virkar, A.V.; Johnson, D.L. Fracture behavior of ZrO2-Zr composites. Am. Cerr. Soc. 1977, 60, 514–519. [Google Scholar] [CrossRef]
- Tomaszewski, H.; Boniecki, M.; Weglarz, H. Toughness-curve behaviour of alumina-SiC and ZTA-SiC composites. J. Eur. Ceram. Soc. 2000, 20, 1215–1224. [Google Scholar] [CrossRef]
- Tomaszewski, H.; Strzeszewski, J.; Gȩbicki, W. The role of residual stresses in layered composites of Y–ZrO2 and Al2O3. J. Eur. Ceram. Soc. 1999, 19, 255–262. [Google Scholar] [CrossRef]
- He, J.; Clarke, D.R. Determination of the piezospectroscopic coefficients for chromium-doped sapphire. J. Am. Ceram. Soc. 1995, 78, 1347–1353. [Google Scholar] [CrossRef]
- Ramírez-Rico, J.; Martínez-Fernandez, J.; Peña, J.I.; Singh, D.; Routbort, J. Residual stresses in Al2O3–ZrO2 (3 MOL.% Y2O3) directionally solidified eutectic ceramics as a function of temperature. Mater. Sci. Eng. A 2012, 541, 61–66. [Google Scholar] [CrossRef]
- Jungk, J.M.; Boyce, B.L.; Buchheit, T.E.; Friedmann, T.A.; Yang, D.; Gerberich, W.W. Indentation fracture toughness and acoustic energy release in tetrahedral amorphous carbon diamond-like thin films. Acta Mater. 2006, 54, 4043–4052. [Google Scholar] [CrossRef]
- Félix-Bautista, R.; Hernández-Hernández, C.; Zendejas-Leal, B.E.; Fragoso, R.; Golzarri, J.I.; Vázquez-López, C.; Espinosa, G. Evolution of etched nuclear track profiles of alpha particles in CR-39 by atomic force microscopy. Radiat. Meas. 2013, 50, 197–200. [Google Scholar] [CrossRef]
- Hoffmann, J.; Schuler, A.; Weckenmann, A. Construction and evaluation of a traceable metrological scanning tunnelling microscope. Measurement 2009, 42, 1324–1329. [Google Scholar] [CrossRef]
- Starbuck, J.M.; Warren, C.D.; Carpenter, J.A.; Sklad, P.S.H. Crash Analysis of Adhesively-Bonded Structures (CAABS); Oak Ridge National Laboratory (ORNL): Oak Ridge, TN, USA, 2006.
- Salerno, M. Improved estimation of contact compliance via atomic force microscopy using a calibrated cantilever as a reference sample. Measurement 2012, 45, 2103–2113. [Google Scholar] [CrossRef]
- Belda, P.M.; Mielck, J.B. The tabletting machine as an analytical instrument: Qualification of the measurement devices for punch forces and validation of the calibration procedures. Eur. J. Pharm. Biopharm. 1998, 46, 381–395. [Google Scholar] [CrossRef]
- Schuurmans, J.; Scibetta, M. Cost-effective precracking of charpy V-notch specimens for fracture-toughness testing using a piezoelectric actuator. J. Test. Eval. 2016, 45, 1476–1483. [Google Scholar] [CrossRef]
- Mall, S. Integrity of graphite/epoxy laminate embedded with piezoelectric sensor/actuator under monotonic and fatigue loads. Smart Mater. Struct. 2002, 11, 527. [Google Scholar] [CrossRef]
- Mall, S.; Hsu, T.L. Electromechanical fatigue behavior of graphite/epoxy laminate embedded with piezoelectric sensor/actuator. Smart Mater. Struct. 2002, 9, 78. [Google Scholar] [CrossRef]
- Murri, G.B. Effect of embedded piezoelectric sensors on fracture toughness and fatigue resistance of composite laminates under mode I loading. In American Society of Composite 21st Annual Technical; NASA Langley Research Center: Hampton, VA, USA, 2006. [Google Scholar]
- Jayakumar, K.; Yadav, D.; Nageswara Rao, B. Moderately large deflection analysis of simply supported piezo-laminated composite plates under uniformly distributed transverse load. Int. J. Non-Linear Mech. 2013, 49, 137–144. [Google Scholar] [CrossRef]
- Miau, J.J.; Wu, C.W.; Hu, C.C.; Chou, J.H. A study on signal quality of a vortex flowmeter downstream of two elbows out-of-plane. Flow Meas. Instrum. 2002, 13, 75–85. [Google Scholar] [CrossRef]
- Sturm, D.; Heilmaier, M.; Schneibel, J.H.; Jéhanno, P.; Skrotzki, B.; Saage, H. The influence of silicon on the strength and fracture toughness of molybdenum. Mater. Sci. Eng. A 2007, 463, 107–114. [Google Scholar] [CrossRef]
- Patel, Y.; Blackman, B.R.K.; Williams, J.G. Determining fracture toughness from cutting tests on polymers. Eng. Fract. Mech. 2009, 76, 2711–2730. [Google Scholar] [CrossRef]
- Weerasooriya, T.; Moy, P.; Casem, D.; Cheng, M.; Chen, W. Determination of dynamic fracture toughness for brittle aterials with a modified SHPB. In Determination of Dynamic Fracture Toughness for SiC-N; The University of Arizona: Tucson, AZ, USA, 2010. [Google Scholar]
- Keshavanarayana, S.; Tan, K.Y.; Siddiqui, M.; Elyas, S.F. Crashworthiness of Composites—Material Dynamic Properties; Joint Advanced Materials & Structures Center of Excellence: San Diego, CA, USA, 20–21 April 2011. [Google Scholar]
- Deubener, J.; Höland, M.; Höland, W.; Janakiraman, N.; Rheinberger, V.M. Crack tip fracture toughness of base glasses for dental restoration glass-ceramics using crack opening displacements. J. Mech. Behav. Biomed. Mater. 2011, 4, 1291–1298. [Google Scholar] [CrossRef] [PubMed]
- Vary, A. Correlations among ultrasonic propagation factors and fracture toughness properties of metalic matterials. Mater. Eval. 1978, 36, 55–64. [Google Scholar]
- Vary, A.; Hull, D.R. Ultrasonic ranking of toughness of tungsten carbide. In National Aeronauticsand Space Administration; TM-83358; Lewis Research Center: Cleveland, OH, USA, 1983. [Google Scholar]
- Gopichand, A.; Rao, M.M.; Sharma, A.V.N.L.; Tony, V.S. Analysis and estimation of attenuation coefficient of aging en-19 steel. J. Eng. Res. Appl. (IJERA) 2012, 1, 590–595. [Google Scholar]
- Thompson, M.; Palaghian, L. Nitrogen influence on indentation fracture toughness of stainless steel coatings. In Proceedings of the International Conference on Tribology, Bucharest, Romania, 8–10 November 2007; pp. 78–82. Available online: http://www.om.ugal.ro/AnnalsFasc8Tribology/pdf/2008/067_Thompson_Romania%20xx.pdf (accessed on 26 September 2018).
- Randall, N.X.; Christoph, R.; Droz, S.; Julia-Schmutz, C. Localised micro-hardness measurements with a combined scanning force microscope/nanoindentation system. Thin Solid Films 1996, 290, 348–354. [Google Scholar] [CrossRef]
- Iwabuchi, A.; Shimizu, T.; Yoshino, Y.; Abe, T.; Katagiri, K.; Nitta, I.; Sadamori, K. The development of a vickers-type hardness tester for cryogenic temperatures down to 4.2 K. Cryogenics 1996, 36, 75–81. [Google Scholar] [CrossRef]
- Sansoz, F.; Gang, T. A force-matching method for quantitative hardness measurements by atomic force microscopy with diamond-tipped sapphire cantilevers. Ultramicroscopy 2010, 111, 11–19. [Google Scholar] [CrossRef] [PubMed]
- Vasauskas, V.; Čapas, V. Particular aspects in the calibration and application dynamic and static hardness. XVII IMEKO World Congr. 2003, TC5, 1009–1014. [Google Scholar]
- Ueda, T.; Huda, M.A.; Yamada, K.; Nakayama, K. Temperature measurement of CBN tool in turning of high hardness steel. Ann. CIRP 1999, 48, 63–66. [Google Scholar] [CrossRef]
- Mezlini, S.; Kapsa, P.; Abry, J.C.; Henon, C.; Guillemenet, J. Effect of indenter geometry and relationship between abrasive wear and hardness in early stage of repetitive sliding. Wear 2006, 260, 412–421. [Google Scholar] [CrossRef]
- Frank, S.; Schubert, H. Portable hardness testing—Principles and applications. J. Nondestruct. Test. 2002, 7, 8. [Google Scholar]
- Gutt, G.; Gutt, S.; Vasilache, V.; Severin, T.L. Research regarding the investigation of steel hardness. Roznov. Pod. Radhostem. 2004, 5, 18–20. [Google Scholar]
- Frank, S. Mobile Hardness Testing: Application Guide for Hardness Testers; GE Inspections Technologies: Skaneateles Falls, NY, USA, 2008. [Google Scholar]
- Tiniest Olsen Testing Machine Company. Universal Hardness Testing Machines. Available online: https://www.tiniusolsen.com/tinius-olsen-products/indentation-hardness-testers/univers (accessed on 21 September 2018).
- Ensminger, D.; Bond, L.J. Ultrasonics Fundamentals, Technologies and Applications, 3rd ed.; CRC Press: Boca Raton, FL, USA, 2011; p. 723. [Google Scholar]
- Qi, X.; Chen, W.; Liu, Y.; Tang, X.; Shi, S. A novel well drill assisted with high-frequency vibration using the bending mode. Sensors 2018, 18, 1167. [Google Scholar] [CrossRef] [PubMed]
- Hay, T.R. Rail Surface Characterization; IDEA: Washington, DC, USA, 2008; pp. 1–29. [Google Scholar]
- National Security Technologies, LLC. Strategic Opportunity Research Exploratory Research Site-Directed Research & Development; U.S. Department of Energy, and supported by the Site-Directed Research and Development Program; National Security Technologies, LLC: Laramie, WY, USA, 2017. [Google Scholar]
- Gutt, G.; Gutt, S.; Vasilache, V.; Severin, T.L. Research on universal dynamic hardness test. Roznov. Pod. Radhostem. 2010, 5, 1–8. [Google Scholar]
- Elahi, H.; Eugeni, M.; Gaudenzi, P.; Gul, M.; Swati, R.F. Piezoelectric thermo electromechanical energy harvester for reconnaissance satellite structure. In Microsystem Technologies; Springer: Berlin/Heidelberg, Germany, 2018. [Google Scholar]
- Elahi, H.; Eugeni, M.; Gaudenzi, P.; Qayyum, F.; Swati, R.F.; Khan, H.M. Response of piezoelectric materials on thermomechanical shocking and electrical shocking for aerospace applications. Microsyst. Technol. 2018, 24, 3791–3798. [Google Scholar] [CrossRef]
- Gaudenzi, P. Physical Behaviour, Mathematical Modelling and Applications; John-Wiley-and-Sons: Hoboken, NJ, USA, 2009. [Google Scholar]
- Korde, N.; Kundu, T. Material hardness and ageing measurement using guided ultrasonic waves. Ultrasonics 2013, 53, 506–510. [Google Scholar] [CrossRef] [PubMed]
- Chinchanikar, S.; Choudhury, S.K. Effect of work material hardness and cutting parameters on performance of coated carbide tool when turning hardened steel: An optimization approach. Measurement 2013, 46, 1572–1584. [Google Scholar] [CrossRef]
- Lendze, T.; Wojtyra, R.; Guillaumat, L.; Biateau, C.; Imielińska, K. Low velocity impact damage in glass/polyester composite sandwich panels. Adv. Mater. Sci. 2006, 6, 27–34. [Google Scholar]
- Scott, K.P. New instrumented pendulum impact system for testing plastics. Mater. Test. Prod. Technol. News 2001. [Google Scholar] [CrossRef]
- Du, G.; Li, Z.; Song, G. A PVDF-based sensor for internal stress monitoring of a concrete-filled steel tubular (CFST) column subject to impact loads. Sensors 2018, 18, 1682. [Google Scholar] [CrossRef] [PubMed]
- Ang, S.F. Evaluation Impact Strength on Particulate Reinforced (25% and 33%) Vinyl Ester Composite Cured under Microwave Conditions University of Southern Queensland; USQ: Darling Heights, Australia, 2004. [Google Scholar]
- Badri, A.E.; Sinha, J.K.; Albarbar, A. A typical filter design to improve the measured signals from mems accelerometer. Measurement 2010, 43, 1425–1430. [Google Scholar] [CrossRef]
- Medeiros, K.A.R.; Barbosa, C.R.H.; de Oliveira, E.C. Flow measurement by piezoelectric accelerometers: Application in the oil industry. Pet. Sci. Technol. 2015, 33, 1402–1409. [Google Scholar] [CrossRef]
- Vasconcelos, P.V.; Lino, F.J.; Magalhães, A.; Neto, R.J.L. Impact fracture study of epoxy-based composites with aluminium particles and milled fibres. J. Mater. Process. Technol. 2005, 170, 277–283. [Google Scholar] [CrossRef]
- Gururaja, T.R.; Schulze, W.A.; Cross, L.E.; Newnham, R.E.; Auld, B.A.; Wang, Y.J. Piezoelectric composite materials for ultrasonic transducer applications. Part I: Resonant modes of vibration of PZT rod-polymer composites. IEEE Trans. Sonics Ultrason 1985, 32, 481–498. [Google Scholar] [CrossRef]
- Lees, S.; Davidson, C.L. Ultrasonic measurement of some mineral filled plastics. IEEE Trans. Sonics Ultrason. 1977, 24, 222–225. [Google Scholar] [CrossRef]
- Alves, J.M.; Valleˆra, A.M. High temperature sound velocity measurement with piezoelectric transducers. Am. Inst. Phys. 1997, 69, 130–131. [Google Scholar] [CrossRef]
- Zhang, R.; Jiang, B.; Caoa, W. Influence of sample size on ultrasonic phase velocity measurements in piezoelectric ceramics. Appl. Phys. 2002, 91, 10194–10198. [Google Scholar] [CrossRef]
- Wen, Y.C.; Chou, L.C.; Lin, H.H.; Lin, K.H.; Kao, T.F.; Sun, C.K. Compositional dependence of longitudinal sound velocities of piezoelectric (111) InxGa(1−x) as measured by picosecond ultrasonics. J. Appl. Phys. 2006, 100, 103516. [Google Scholar] [CrossRef]
- Kambara, T.; Kageyama, K.; Kanai, Y.; Kojima, T.M.; Nanai, Y.; Yoneda, A.; Yamazaki, Y. Elastic wave from fast heavy ion irradiation on solids. Nucl. Instrum. Methods Phys. Res. Sect. Beam Interact. Mater. Atoms. 2002, 193, 371–375. [Google Scholar] [CrossRef]
- Golding, B.; Haemmerle, W.H.; Schneemeyer, L.F.; Waszczak, J.V. Gigahertz ultrasound in single crystal superconducting YBa2 Cu3O7. In Proceedings of the IEEE 1988 Ultrasonics Symposium, Chicago, IL, USA, 2–5 October 1988; Volume 1072, pp. 1079–1083. [Google Scholar]
- Haranath, D.; Wagh, P.B.; Pajonk, G.M.; Rao, A.V. Influence of sol-gel processing parameters on the ultrasonic sound velocities in silica aerogels. Mater. Res. Bull. 1997, 32, 1079–1089. [Google Scholar] [CrossRef]
- Gomez, T.E.; Gonzalez, B.; Montero, F. Paper characterization by measurement of thickness and plate resonances using air-coupled ultrasound. In Proceedings of the 2002 IEEE Ultrasonics Symposium, Munich, Germany, 8–11 October 2002; Volume 861, pp. 865–868. [Google Scholar]
- Fariñas, M.D.; Álvarez-Arenas, T.E.G.; Cummins, G.; Desmulliez, M.P.Y.; Seetohul, V.; Cochran, S. Assessment of the ultrasonic properties of additive manufactured materials for passive components of piezoelectric transducers. In Proceedings of the 2016 IEEE International Ultrasonics Symposium (IUS), Tours, France, 18–21 September 2016. [Google Scholar]
- Garcia-Rodriguez, M.; Yañez, Y.; Garcia-Hernandez, M.J.; Salazar, J.; Turo, A. Experimental velocity measurements of the low-order anti-symmetric lambwave generated-detected in metallic plates using air-coupled concave array transducers. Nondestruct. Eval. 2011, 30, 50–58. [Google Scholar] [CrossRef]
- Kozhevnikov, V.F.; Payne, W.B.; Olson, J.K.; Allen, A.; Taylor, P.C. Sound velocity in liquid and glassy selenium. J. Non-Cryst. Solids 2007, 353, 3254–3259. [Google Scholar] [CrossRef] [Green Version]
- Greve, D.W.; Oppenheim, I.J.; Zhengc, P. Lamb waves and nearly-longitudinal waves in thick plates. Sens. Smart Struct. Technol. Civ. Mech. Aerosp. Syst. 2008, 6932, 1–10. [Google Scholar]
- Greve, D.W.; Zheng, P.; Oppenheim, I.J. 12D-1 excitation of longitudinal and lamb waves in plates by edge-mounted transducers. In Proceedings of the 2007 IEEE Ultrasonics Symposium Proceedings, New York, NY, USA, 28–31 October 2007; pp. 1120–1123. [Google Scholar]
- Zhang, L.; Rogl, G.; Grytsiv, A.; Puchegger, S.; Koppensteiner, J.; Spieckermann, F.; Kabelka, H.; Reinecker, M.; Rogl, P.; Schranz, W.; et al. Mechanical properties of filled antimonide skutterudites. Mater. Sci. Eng. B 2010, 170, 26–31. [Google Scholar] [CrossRef]
- Chen, S.; Wang, G.; Wen, J.; Wen, X. Wave propagation and attenuation in plates with periodic arrays of shunted piezo-patches. J. Sound Vib. 2013, 332, 1520–1532. [Google Scholar] [CrossRef]
- Rouzaud, A.; Barbier, E.; Ernoult, J.; Quesnel, E. A method for elastic modulus measurements of magnetron sputtered thin films dedicated to mechanical applications. Thin Solid Films 1995, 270, 270–274. [Google Scholar] [CrossRef]
- Khoury, M.; Tourtollet, G.E.; Schröder, A. Contactless measurement of the elastic young’s modulus of paper by an ultrasonic technique. Ultrasonics 1999, 37, 133–139. [Google Scholar] [CrossRef]
- Luukkala, M.; Heikkila, P.; Surakka, J. Plate wave resonance—A contactless test method. Ultrasonics 1971, 9, 201–208. [Google Scholar] [CrossRef]
- Osamura, K.; Nyilas, A.; Shin, H. Estimation of uncertainty with the modulus of elasticity measured by means of tensile test for bscco tapes. Cryogenics 2010, 50, 660–665. [Google Scholar] [CrossRef]
- Vendra, L.; Rabiei, A. Evaluation of modulus of elasticity of composite metal foams by experimental and numerical techniques. Mater. Sci. Eng. A 2010, 527, 1784–1790. [Google Scholar] [CrossRef]
- Diaz, C.A.; Afrifah, K.A.; Jin, S.; Matuana, L.M. Estimation of modulus of elasticity of plastics and wood plastic composites using a taber stiffness tester. Compos. Sci. Technol. 2011, 71, 67–70. [Google Scholar] [CrossRef]
- Genga, R.M.; Cornish, L.A.; Akdogan, G. Effect of Mo2C additions on the properties of SPS manufactured WC–TiC–Ni cemented carbides. Int. J. Refract. Met. Hard Mater. 2013, 41, 12–21. [Google Scholar] [CrossRef]
- Stasiak, M.; Molenda, M.; Horabik, J. Determination of modulus of elasticity of cereals and rapeseeds using acoustic method. J. Food Eng. 2007, 82, 51–57. [Google Scholar] [CrossRef]
- Dzbeński, W.; Wiktorski, T. Ultrasonic evaluation of mechanical properties of wood in standing trees. In Proceedings of the COST E 53 Conference—Quality Control for Wood and Wood Products, Warsaw, Poland, 15–17 October 2007. [Google Scholar]
- Río, L.M.D.; López, F.; Calleja, B.; Tejado, J.J.; Mota, M.I.; González, I.; San Emeterio, J.L.; Ramos, A. Resonance-based acoustic technique applied to the determination of young’s modulus in granites. In Proceedings of the 19th International Congress on Acoustics, Madrid, Spain, 2–7 September 2007. [Google Scholar]
- Elastic Modulus Measurment. Olympus: Tokyo, Japen. Available online: http://www.olympus-ims.com/en/applications/elastic-modulus-measurement/ (accessed on 14 September 2018).
- Mohammed, A.A.; Haris, S.M.; Nuawi, M.Z. Using the pressure transmission coefficient of a transmitted wave to evaluate some of the mechanical properties of refractory metals. Ultrasonics 2015, 55, 133–140. [Google Scholar] [CrossRef] [PubMed]
- Mohammed, A.A. Design of a Piezoelectric Ceramic Transducer-Based Mechanical Properties Test for Refractory Metals. Universiti Kebangsaan Malaysia (UKM); Universiti Kebangsaan Malaysia (UKM): Bangi, Malaysia, 2015. [Google Scholar]
- Mohammed, A.A.; Haris, S.M.; Nuawi, M.Z. Utilizing hilbert–huang transform in detection some of mechanical properties of the refractory metals. Mech. Syst. Signal Process. 2016, 68, 449–461. [Google Scholar] [CrossRef]
- Boumiz, A.; Vernet, C.; Tenoudji, F.C. Mechanical properties of cement pastes and mortars at early ages: Evolution with time and degree of hydration. Adv. Cem. Based Mater. 1996, 3, 94–106. [Google Scholar] [CrossRef]
- Khandelwal, M.; Singh, T.N. Correlating static properties of coal measures rocks with P-wave velocity. Int. J. Coal Geol. 2009, 79, 55–60. [Google Scholar] [CrossRef]
- Sharpe, W.N., Jr.; Bin, Y.; Vaidyanathan, R.; Edwards, R.L. Measurements of young’s modulus, poisson’s ratio, and tensile strength of polysilicon. In Proceedings of the Tenth IEEE International Workshop on Microelectromechanical Systems, Nagoya, Japan, 26–30 January 1997; pp. 424–429. [Google Scholar]
- Jackson, K.M. Fracture strength, elastic modulus and poisson’s ratio of polycrystalline 3C thin-film silicon carbide found by microsample tensile testing. Sens. Actuators A Phys. 2005, 125, 34–40. [Google Scholar] [CrossRef]
- Bamber, M.J.; Cooke, K.E.; Mann, A.B.; Derby, B. Accurate determination of young’s modulus and poisson’s ratio of thin films by a combination of acoustic microscopy and nanoindentation. Thin Solid Films 2001, 398, 299–305. [Google Scholar] [CrossRef]
- Ganguly, P.; Poole, W.J. In situ measurement of reinforcement stress in an aluminum-alumina metal matrix composite under compressive loading. Mater. Sci. Eng. A 2003, 352, 46–54. [Google Scholar] [CrossRef]
- Lee, S.J.; Han, S.W.; Hyun, S.M.; Lee, H.J.; Kim, J.H.; Kim, Y.I. Measurement of young’s modulus and poisson’s ratio for thin au films using a visual image tracing system. Curr. Appl. Phys. 2009, 9, S75–S78. [Google Scholar] [CrossRef]
- Zhu, J.; Kee, S.-H. Monitoring early age microstructure development of cement paste using bender elements. Nondestruct. Charact. Compos. Mater. 2010, 7649, 76491R. [Google Scholar]
- Dano, C.; Hicher, P.-Y. Evolution of elastic shear modulus in granular materials along isotropic and deviatoric stress paths. In ASCE Engineering Mechanics; Columbia University: New York, NY, USA, 2002. [Google Scholar]
- Yoo, J.-K.; Park, D.; Baxter, C.D.P. Estimation of drained shear strength of granular soil from shear wave velocity and confining stress. J. Geotech. Geoenviron. Eng. 2018, 144, 04018027. [Google Scholar] [CrossRef]
- Wang, Y.C.; Lakesa, R.S. Resonant ultrasound spectroscopy in shear mode. Rev. Sci. Instrum. 2003, 74, 1371–1373. [Google Scholar] [CrossRef] [Green Version]
- Tanaka, K.; Ichitsubo, T.; Matsubara, E. Elasticity and anelasticity of metallic glass near the glass transition temperature. Mater. Sci. Eng. A 2006, 442, 278–282. [Google Scholar] [CrossRef]
- Builes, M.; Maqbool, S.; Sato, T.; Koseki, J. Dynamic and static measurements of small strain moduli of toyoura sand. In Proceedings of the Sixth International Summer Symposium, Saitama, Japan, 31 July 2004; pp. 229–232. [Google Scholar]
- Builes, M.; Garcia, E.; Riveros, C.A. Dynamic and static measurements of small strain moduli of toyoura sand. GIGA Group Fac. Eng. Univ. Antioq. 2008, 43, 86–101. [Google Scholar]
- Mulmi, S.; Sato, T.; Kuwano, R. Performance of plate type piezo-ceramictransducers for elastic wave measurements in laboratory soil specimens. Seisan Kenkyu 2008, 60, 565–569. [Google Scholar]
- Stanzl-Tschegg, S. Very high cycle fatigue measuring techniques. Int. J. Fatigue 2013, 60, 2–17. [Google Scholar] [CrossRef]
- Marines-Garcia, I.; Doucet, J.-P.; Bathias, C. Development of a new device to perform torsional ultrasonic fatigue testing. Int. J. Fatigue 2007, 29, 2094–2101. [Google Scholar] [CrossRef]
- Lashin, I.; Hussien, M.; Karray, M.; Chekired, M. Assessment of conventional interpretation methods of RC results based on 3D numerical simulations. Int. J. Geomech. 2018, 18, 04018160. [Google Scholar] [CrossRef]
- Clauer, A.H.; Fairand, B.P.; Wilcox, B.A. Laser shock hardening of weld zones in aluminum alloys. Met. Mater. Trans. A 1977, 8, 1871–1876. [Google Scholar] [CrossRef]
- Sikarwar, S.; Singh, S.; Yadav, B.C. Review on pressure sensors for structural health monitoring. Photonic Sens. 2017, 7, 294–304. [Google Scholar] [CrossRef] [Green Version]
- Labuz, J.F.; Biolzi, L. Characteristic strength of quasi-brittle materials. Int. J. Solids Struct. 1998, 35, 4191–4203. [Google Scholar] [CrossRef]
- Brown, E.N.; Davis, A.K.; Jonnalagadda, K.D.; Sottos, N.R. Effect of surface treatment on the hydrolytic stability of E-glass fiber bundle tensile strength. Compos. Sci. Technol. 2005, 65, 129–136. [Google Scholar] [CrossRef]
- Dent, A.C.E.; Bowen, C.R.; Stevens, R.; Cain, M.G.; Stewart, M. Tensile strength of active fibre composites—Prediction and measurement. Ferroelectr. Taylor Fr. Group LLC. 2008, 368, 209–215. [Google Scholar] [CrossRef]
- Chaki, S.; Bourse, G. Non-destructive evaluation of the stress levels in prestressed steel strands using acoustoelastic effect. In NDTCE’09, Non-Destructive Testing in Civil Engineering; Spring: Nantes, France, 2009. [Google Scholar]
- Waller, J.M.; Saulsberry, R.L.; Andrade, E. Use of acoustic emission to monitor progressive damage accumulation in kevlar® 49 composites. Qunt. Nondestruct. Eval. (QNDE) Kingst. 2009. [Google Scholar] [CrossRef]
- Silva, F.D.A.; Zhu, D.; Mobasher, B.; Soranakom, C.; Filhoc, R.D.T. High speed tensile behavior of sisal fiber cement composites. Mater. Sci. Eng. A 2010, 527, 544–552. [Google Scholar] [CrossRef] [Green Version]
- Kim, J.-H.; Kim, D.; Han, H.N.; Barlat, F.; Lee, M.-G. Strain rate dependent tensile behavior of advanced high strength steels: Experiment and constitutive modeling. Mater. Sci. Eng. A 2013, 559, 222–231. [Google Scholar] [CrossRef]
- Spronk, S.W.F.; Verboven, E.; Gilabert, F.A.; Sevenois, R.D.B.; Garoz, D.; Kersemans, M.; Paepegem, W.V. Dynamic tensile testing of brittle composites using a hydraulic pulse machine: Stress-strain synchronization and strain rate limits. Proceedings 2018, 2, 405. [Google Scholar] [CrossRef]
Figure 1.
Behaviour of creep time at each creep case with changes in ultrasonic attenuation coefficient.
Figure 1.
Behaviour of creep time at each creep case with changes in ultrasonic attenuation coefficient.

Figure 2.
Double cantilever beam with microfiber composite (MFC) at the delaminating interface.

Figure 3.
The ultrasonic contact impedance (UCI) method (MIC 10, MIC 20).

Figure 4.
(a) Installation of angled beam piezoelectric transducers on a rail specimen. (b) Sezawa wave was greater in amplitude and arrives first (faster) than a surface wave [50].
Figure 4.
(a) Installation of angled beam piezoelectric transducers on a rail specimen. (b) Sezawa wave was greater in amplitude and arrives first (faster) than a surface wave [50].

Figure 5.
(a) A principle of an instrumental indentation test. (b) Evaluation of dynamic force Fd from impact to elastic recoil and after a return on a tested material.
Figure 5.
(a) A principle of an instrumental indentation test. (b) Evaluation of dynamic force Fd from impact to elastic recoil and after a return on a tested material.

Figure 6.
Connection of the impact tup.

Figure 7.
Sound velocity in silica aerogel versus: (a) NH4OH/TMOS molar ratio, (b) MeOH/TMOS molar ratio, and (c) H2O/TMOS molar ratio [72].
Figure 7.
Sound velocity in silica aerogel versus: (a) NH4OH/TMOS molar ratio, (b) MeOH/TMOS molar ratio, and (c) H2O/TMOS molar ratio [72].

Figure 8.
Air-coupled ultrasound technique.

Figure 9.
Testing system of the modulus of elasticity using a piezoelectric transducer as an actuator and sensor.
Figure 9.
Testing system of the modulus of elasticity using a piezoelectric transducer as an actuator and sensor.

Figure 10.
Comparison between time-of-flight (TOF) method and Arshed method.

Figure 11.
The measurement system for Poisson’s ratio, modulus of elasticity, and tensile strength for polysilicon.
Figure 11.
The measurement system for Poisson’s ratio, modulus of elasticity, and tensile strength for polysilicon.

Figure 12.
[102] (a) Top view of all test systems. (b) Frame of the test system.
Figure 12.
[102] (a) Top view of all test systems. (b) Frame of the test system.

Figure 13.
Specimen shape and the position of bender element, trigger of (CL and CS) waves, and accelerometer of (CL and CS) waves.
Figure 13.
Specimen shape and the position of bender element, trigger of (CL and CS) waves, and accelerometer of (CL and CS) waves.

Figure 14.
The completed tensile test system for glass-fibre bundles.

Figure 15.
The number of published researches (at intervals of five years) through the period 1971 to 2017.
Figure 15.
The number of published researches (at intervals of five years) through the period 1971 to 2017.


Table 1.
Several piezoelectric element (PE) applications for measuring the fracture of toughness of metals.
Table 1.
Several piezoelectric element (PE) applications for measuring the fracture of toughness of metals.
| Description of PE | Role of PE | Description of the Advantage of PE |
|---|---|---|
| (100 kHz to 2000 kHz) | Piezo-scanner. | An indenter tip was employed to obtain a convenient nanometer-resolution imaging of test surface for measuring the slim membrane toughness of the tetrahedral amorphous carbon of diamond [17]. More details on the piezo-scanner is available in the literature [18,19]. |
| 5 MHz | Load cell in quasi-static dynamic fracture toughness tests. | PE can eliminate any inertia effects associated with the higher velocity (5000 mm/s) test rates. Results show the magnitudes of K1C within the range () at an applied load rate of 1 m/s [20]. More details on using PE as a load cell has been previously reported [21,22,23]. |
| Lead zirconate titanate Pb[ZrxTi1-x]O3 (PZT) 0.79 in × 3.7 in (width× length) and thickness 0.0115 in to 0.0063 in | Embedded sensor for vibration control and health monitoring of aircraft structure. | PE was used as a sensor for load frequencies from 1 Hz to 10 Hz in epoxy and to study the effect of embedded materials on fracture toughness. Piezoelectric microfiber composite (MFC) (embedded piezoelectric sensors) was covered with a thin polymer film on its two sides. Then, the sandwich was inserted as an embedded material in glass/epoxy composite material (12-in2 unidirectional panels), as shown in Figure 2 to function as a sensor [24,25,26]. More details on embedded sensors have been reported [27,28]. |
| Emitter and receiver. | PE was used as a detector to determine the characteristics of several molybdenum alloys (10 mm × 10 mm × 55 mm) at various resonance frequencies [29]. | |
| Load cell for tool cutting. | PE was used to measure cutting force in the x-direction and transverse force in the y-direction to calculate the fracture toughness of polymers with cutting widths of 3 mm to 6 mm, depths of 0.025 mm to 0.25 mm, and velocity of 10 mm/s [30]. | |
| Monitor for the constant loading rate and equilibrium of the dynamic load on a pre-cracked specimen. | The new technology reported in references [31] proved the practicability of using the loading rate as a function of the dynamic fracture. Another article reported a similar finding [32]. | |
| Thick mode 10 MHz and 4 MHz shear mode | Sender and receiver for longitudinal and shear waves. | A thickness mode vibration PE was used for creating longitudinal waves and shear mode vibration for creating shear waves, these two types of PE were used in a crack-opening displacement method to determine the toughness of base glasses for dental restoration glass-ceramics [33]. |
Table 2.
Frequencies used for determining properties of solid materials associated with the dimensions of the test samples.
Table 2.
Frequencies used for determining properties of solid materials associated with the dimensions of the test samples.
| Material Properties | Emitter and Receiver Frequency Range | Rough Dimension Sample Size in mm, L = Length, W = Width, D = Depth |
|---|---|---|
| Creep | 2.25 MHz to 15 MHz | 150, 22–30, - |
| Fracture toughness | 4 MHz to 10 MHz | 10, 10, - |
| Hardness | Sezawa wave (1 MHz to 5 MHz) | -, -, 1.9–5.65 |
| Longitudinal velocity | Guide wave (1 MHz to 3.5 MHz) | 152, 10~20, 30 |
| 405 kHz to 15 MHz | 19–100, 10, 305 | |
| Modulus of elasticity | Air Coupled 750 KHz to 1.7 MHz | Paper-, -, 1–2; metal -, -, 0.1~0.5 |
| 1 kHz to 1 MHz | 60–150, 13~70, 5 | |
| Poisson’s ratio | Air coupled 250 kHz to 1 MHz | paper 60–700, -, - |
| 500 kHz | ||
| Shear modulus | 60 kHz to 10 MHz | Diameter = 50, 100 |
| Tensile strength | 1 kHz to 2 MHz | Rock 200–800 span = 75–300; Metal 25, 1.4, 1.1 |
Table 3.
Types of applications for PE according to frequency range.
| Frequency (fr) Range in MHz | Type of Application | Rough Description of the Samples |
|---|---|---|
| Less than 0.5 | Piezo-spectroscope, shaker load cell, filter for interface noise, emitter only, pickup sensor only, shock wave generator, active and passive velocity transducer, polyvinylidene fluoride (PVDF), Piezo-scanner, load cell, monitor to the constant load, dynamometer, strain gauge, accelerometers | Most dimensions for length, width and depth are less than 100 mm. Weight loads ranged between 4 N to 200 Grain size (0.3 µm to 1.5 µm) |
| 0.5 < fr < 2 | PVDF, Piezo-electroscope, and pickup sensor | |
| 2 < fr < 5 | Shaker load cell, pickup sensor only, monitor for constant load and PVDF. | |
| 5 < fr < 15 | High-speed actuator, PVDF. |
Table 4.
Different types of material with suitable frequency ranges for PE.
| Material Type | Range of Frequency of PE | Dimension of Samples (mm) |
|---|---|---|
| Plexiglas, glass, metallic glass | 300 kHz to 8 MHz | |
| Polycrystaline metals Aluminium, copper, Al2O3 | 10 Hz to 2000 kHz (bulk wave), 1 MHz to 3.5 MHz (surface wave) | 200 × 25 × 2, 152 × 50 × 4 |
| Ice | 1 Hz to 1000 Hz | 394 × 76 |
| Polymer | 1 Hz to 20 Hz | 8 to 20 (circle diameter) |
| IN738IC nickel base | 2.25~15 MHz | 150 × (22.5–30) |
| Stainless steel 316L | 100 Hz to 15 MHz | |
| Tetrahedral amorphous carbon diamond | 100 kHz to 2000 kHz | |
| Rail specimen | 1 MHz to 5 MHz | 1.9–5.65 |
| Ceramic | 1 MHz to 10 MHz | |
| Silica aerogels | 405 kHz | |
| Paper of writing | 0.9 MHz to 1.7 MHz | 80–300 g/m3 |
| Fe4Sb12, Co4Sb12, didymium akaline | 10 MHz | 10 (diameter) and 10 (height) |
| Seismogenic rock, concert, bulk of cereal grains | 75 kHz to 1 MHz | 60 × 13 × 5 |
| Epoxy-impregnated Kevlar | 1 kHz to 1.5 kHz | 25 × 1.4 × 1.1 |
© 2018 by the authors. Licensee MDPI, Basel, Switzerland. This article is an open access article distributed under the terms and conditions of the Creative Commons Attribution (CC BY) license (http://creativecommons.org/licenses/by/4.0/).
Share and Cite
MDPI and ACS Style
Mohammed, A.A.; Haris, S.M.; Nuawi, M.Z. Role of Piezoelectric Elements in Finding the Mechanical Properties of Solid Industrial Materials. Appl. Sci. 2018, 8, 1737. https://doi.org/10.3390/app8101737
AMA Style
Mohammed AA, Haris SM, Nuawi MZ. Role of Piezoelectric Elements in Finding the Mechanical Properties of Solid Industrial Materials. Applied Sciences. 2018; 8(10):1737. https://doi.org/10.3390/app8101737
Chicago/Turabian StyleMohammed, Arshed Abdulhamed, Sallehuddin Mohamed Haris, and Mohd Zaki Nuawi. 2018. "Role of Piezoelectric Elements in Finding the Mechanical Properties of Solid Industrial Materials" Applied Sciences 8, no. 10: 1737. https://doi.org/10.3390/app8101737
Note that from the first issue of 2016, this journal uses article numbers instead of page numbers. See further details here.